- Analytics
- News and Tools
- Market News
- Oil Price Analysis: Potential cracks showing in downtrend
Oil Price Analysis: Potential cracks showing in downtrend
- Oil is in a short-term downtrend but is showing signs that could be early evidence of a reversal.
- Oil has formed a bullish Doji candlestick reversal pattern at the day’s lows which could hail a stronger recovery.
- A break above the major trendline would be required for confirmation – as things stand the downtrend remains intact.
West Texas Intermediate (WTI) US Crude Oil is trading up over a percent at $78.01 on Thursday.
The commodity is in a short-term downtrend on the 4-hour chart (below) which given the old saying “the trend is your friend” would be expected to continue, favoring shorts over longs.
WTI Oil, however, is showing some early bullish reversal signs. It formed a Doji Japanese candle at Thursday’s 76.74 lows (shaded rectangle). This was followed by two bullish candles in a row. Although it is too early to say for sure, the candlestick formation could be an indication of a short-term change of trend.
Oil 4-hour Chart
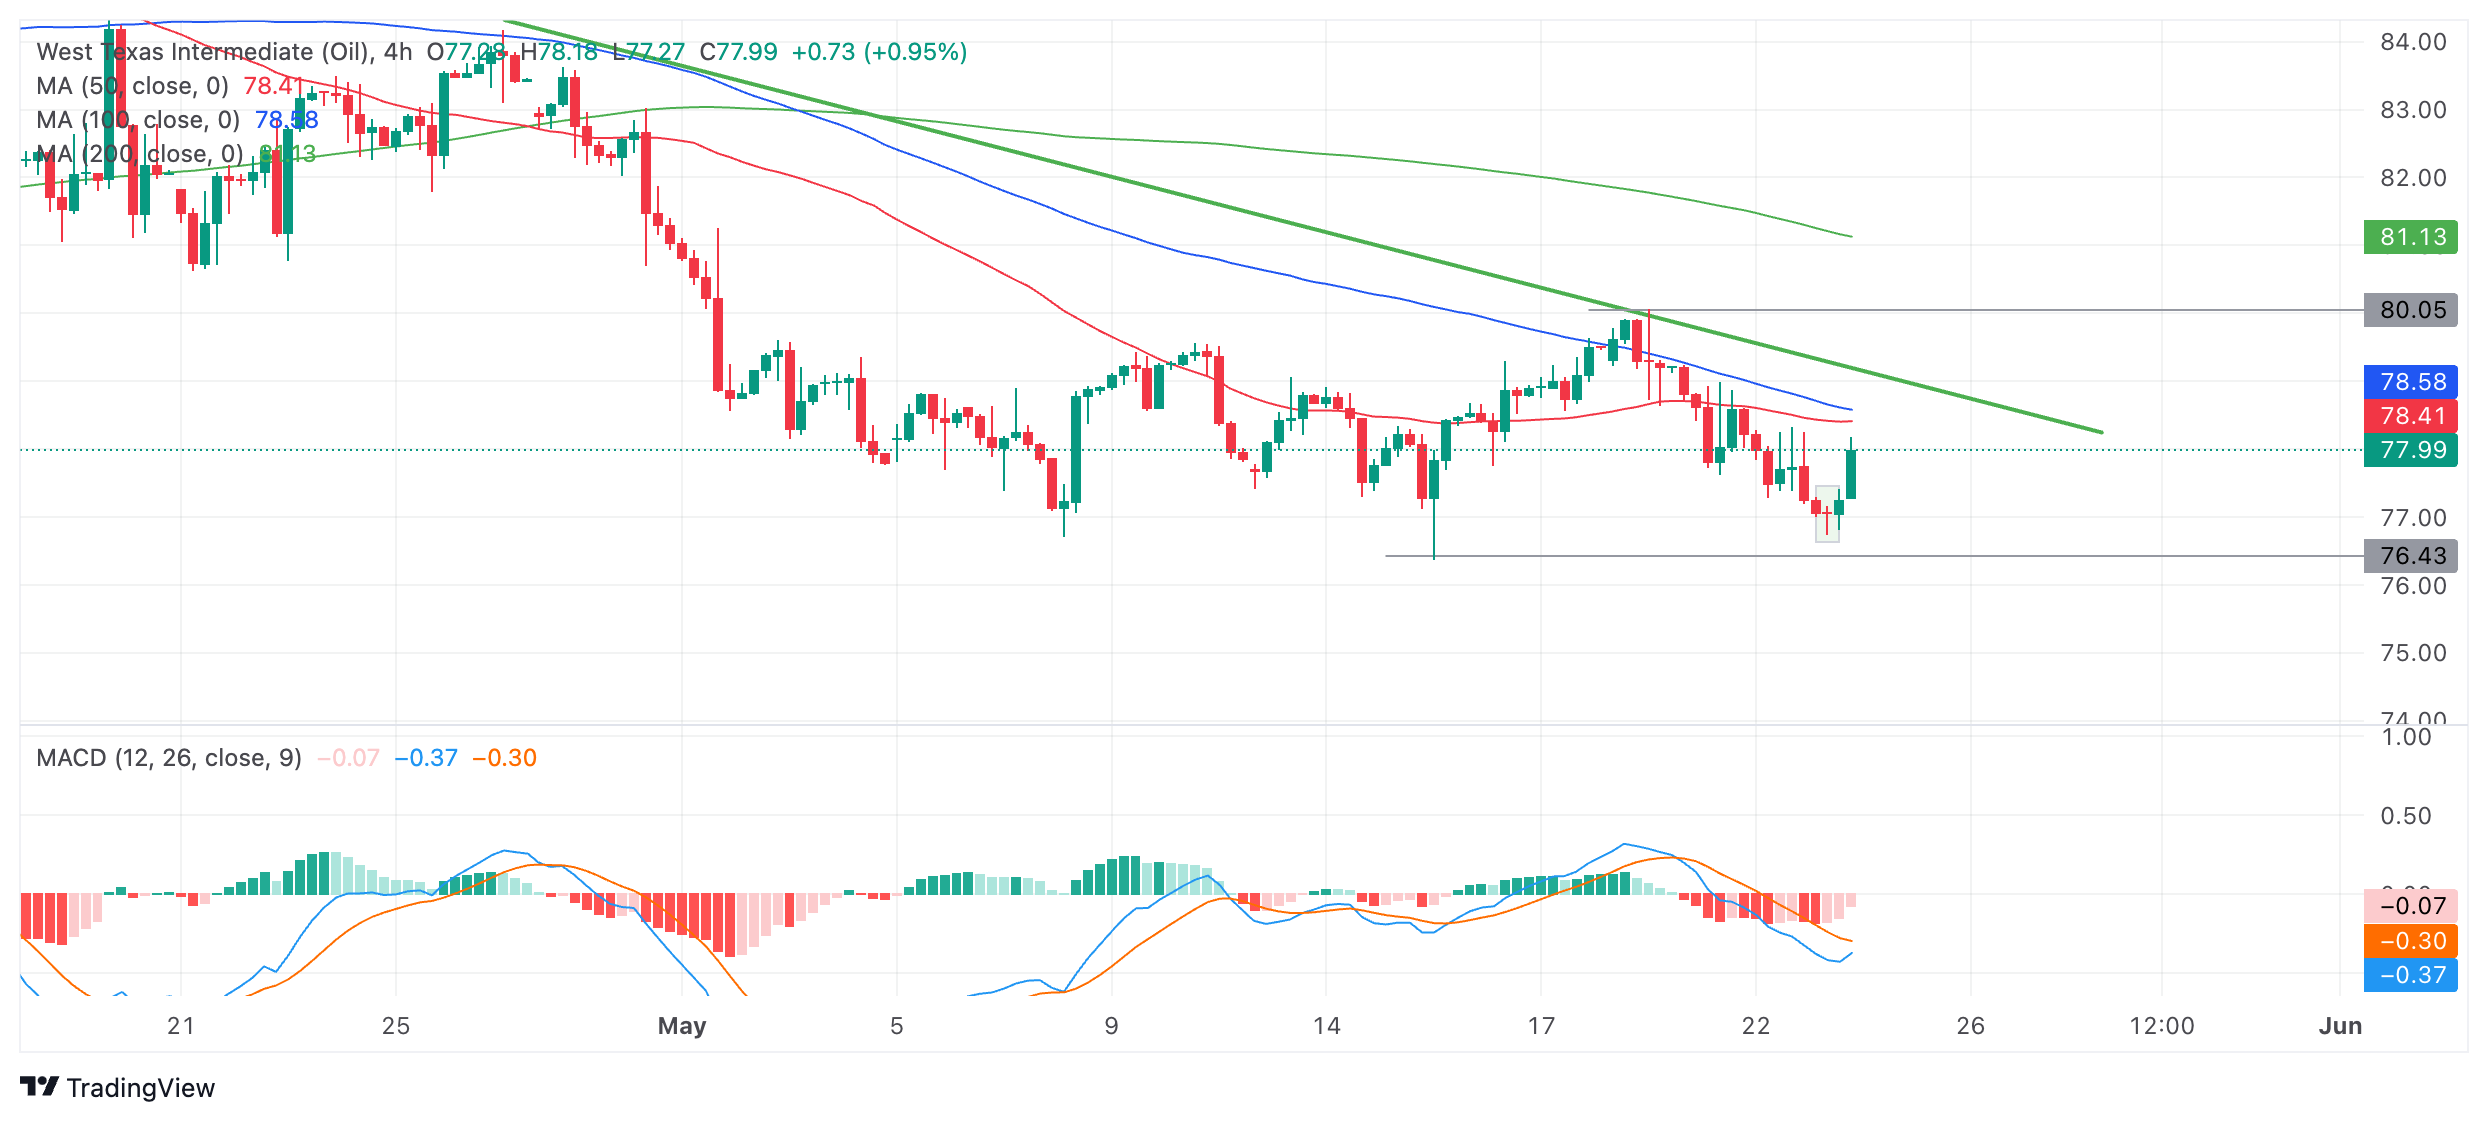
If Oil can continue rising up and definitively pierce above the green down trendline at roughly $79.00 it would be a sign that the short-term trend had reversed.
A definitive break above the trendline would be one accompanied by a longer-than-average green candle that closed near its highs or three green candles in a row that broke above the trendline.
Such a break would be expected to climb to a target at about $80.00, the resistance level of the May 20 lower high.
The Moving Average Convergence Divergence (MACD) momentum indicator is below the zero-line indicating a bearish environment. The blue MACD line is looking like it is about to cross above its red signal line, however, which would give a buy signal in line with the possibility of a reversal indicated by the Japanese candlestick pattern.
Alternatively, a capitulation and continuation of the still-intact downtrend would see WTI Oil price extend lower. A break below the May 15 monthly low at $76.38 would add confirmation to the bear trend and probably result in a move down to support from an older low at roughly $75.75 initially, with deeper declines attacking major historic support at $71.50.


© 2000-2026. All rights reserved.
This site is managed by Teletrade D.J. LLC 2351 LLC 2022 (Euro House, Richmond Hill Road, Kingstown, VC0100, St. Vincent and the Grenadines).
The information on this website is for informational purposes only and does not constitute any investment advice.
The company does not serve or provide services to customers who are residents of the US, Canada, Iran, The Democratic People's Republic of Korea, Yemen and FATF blacklisted countries.
Making transactions on financial markets with marginal financial instruments opens up wide possibilities and allows investors who are willing to take risks to earn high profits, carrying a potentially high risk of losses at the same time. Therefore you should responsibly approach the issue of choosing the appropriate investment strategy, taking the available resources into account, before starting trading.
Use of the information: full or partial use of materials from this website must always be referenced to TeleTrade as the source of information. Use of the materials on the Internet must be accompanied by a hyperlink to teletrade.org. Automatic import of materials and information from this website is prohibited.
Please contact our PR department if you have any questions or need assistance at pr@teletrade.global.
transfers