- Analytics
- News and Tools
- Market News
- GBP/JPY Price Analysis: Bulls maintain stronghold, despite profit take-off
GBP/JPY Price Analysis: Bulls maintain stronghold, despite profit take-off
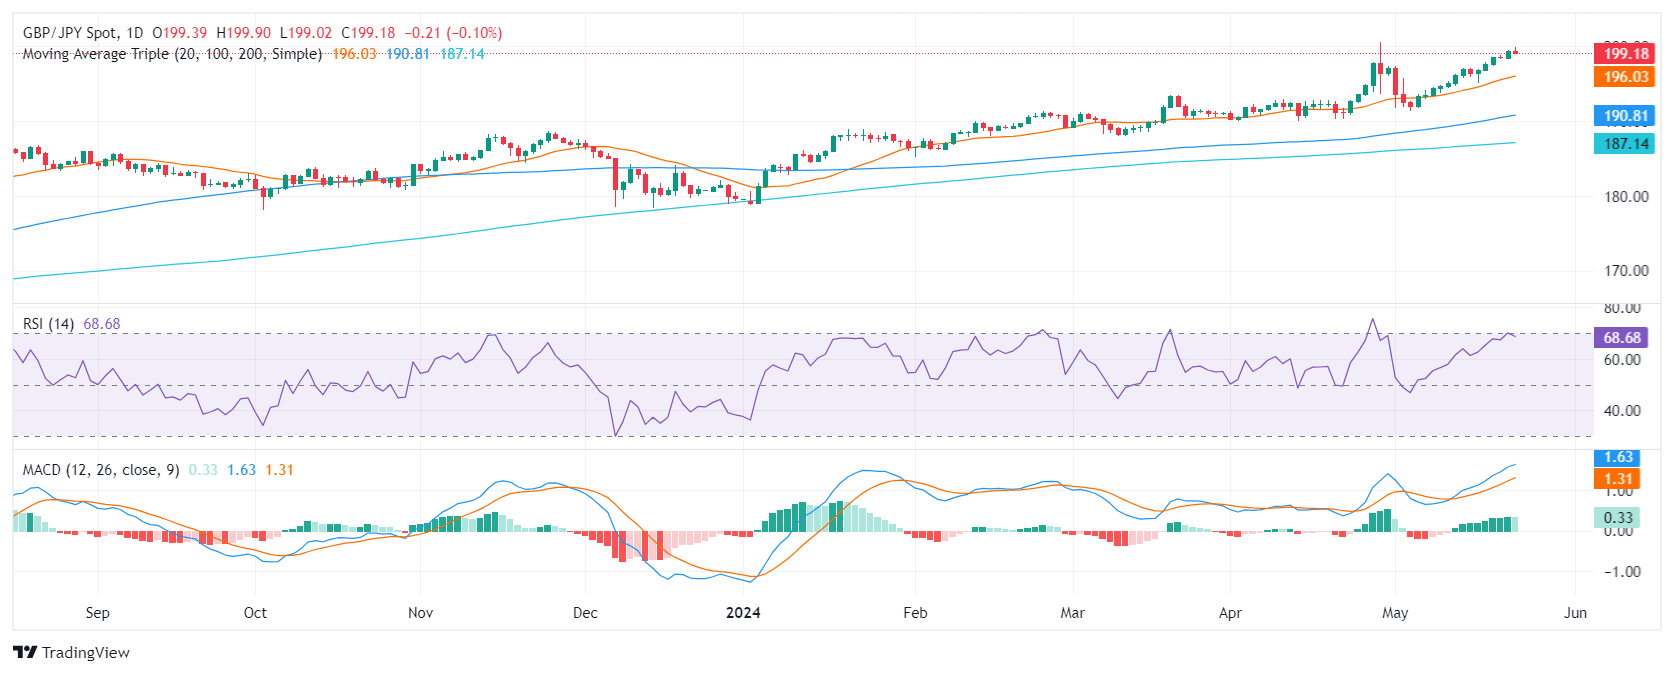
- The daily chart shows that the bulls are taking their foot off the gas and started to take profits.
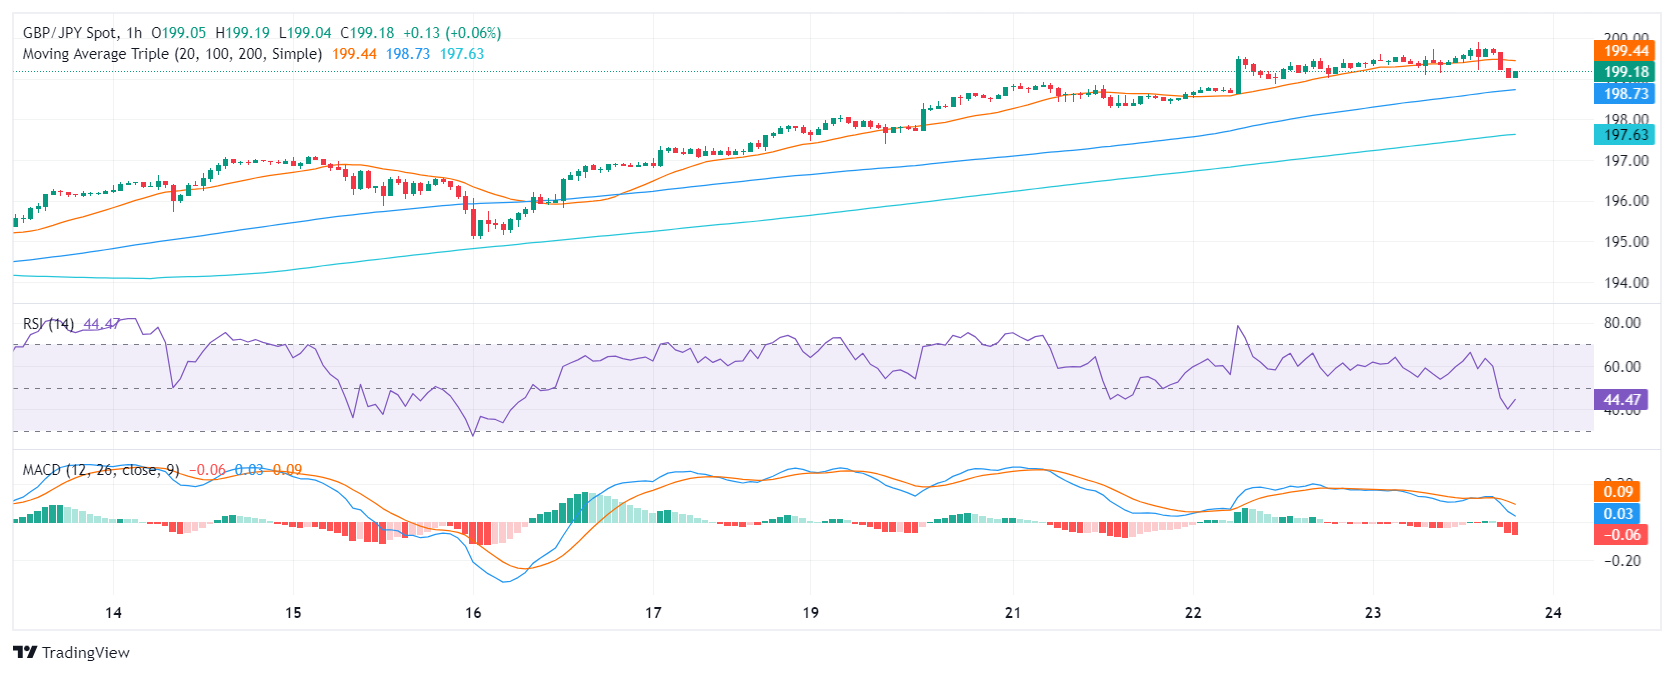
- The hourly chart shows signs of short-term selling pressure ahead of the Asian session.
- The main support to hold is the 20-day SMA at 196.00.
On Thursday's session, the GBP/JPY declined to 199.20 but holds an overall positive outlook. This theory is backed up by the pair approaching near-cycle highs. If the cross holds the 20-day Simple Moving Average (SMA) at 196.00, the downward movements could be considered corrective.
In the daily chart, the Relative Strength Index (RSI) exhibits heightened bullish momentum as it comfortably resides in positive territory nearing overbought conditions but seems to be flattening. Simultaneously, the Moving Average Convergence Divergence (MACD) reveals a decreasing bullish momentum, distinguished by falling green bars. This indicates that while buyers currently hold the reins, their influence may be abating.
GBP/JPY daily chart
Switching to the hourly chart, the RSI portrays a contrasting bearish tendency, with the latest reading of approximately 44, dipping into negative territory. A declining trend is corroborated by the MACD's ascending red bars, suggesting a surge in negative momentum as sellers gain influence in the short term.
GBP/JPY hourly chart
To conclude, the GBP/JPY pair rose near cycle highs, and indicators reached overbought conditions which may trigger a corrective phase. Ahead of the Asian session, investors are taking profits, evident in the hourly chart where indicators are in the red. However, as long as the pair holds above the 20,100 and 200-day SMAs, the outlook will be bullish.


© 2000-2026. All rights reserved.
This site is managed by Teletrade D.J. LLC 2351 LLC 2022 (Euro House, Richmond Hill Road, Kingstown, VC0100, St. Vincent and the Grenadines).
The information on this website is for informational purposes only and does not constitute any investment advice.
The company does not serve or provide services to customers who are residents of the US, Canada, Iran, The Democratic People's Republic of Korea, Yemen and FATF blacklisted countries.
Making transactions on financial markets with marginal financial instruments opens up wide possibilities and allows investors who are willing to take risks to earn high profits, carrying a potentially high risk of losses at the same time. Therefore you should responsibly approach the issue of choosing the appropriate investment strategy, taking the available resources into account, before starting trading.
Use of the information: full or partial use of materials from this website must always be referenced to TeleTrade as the source of information. Use of the materials on the Internet must be accompanied by a hyperlink to teletrade.org. Automatic import of materials and information from this website is prohibited.
Please contact our PR department if you have any questions or need assistance at pr@teletrade.global.
transfers