- Analytics
- News and Tools
- Market News
- GBP/JPY Price Analysis: Bulls keep momentum steady, overbought indicators signal near-term correction possible
GBP/JPY Price Analysis: Bulls keep momentum steady, overbought indicators signal near-term correction possible
- The pair rose to highs since 2007 at 199.90.
- The daily RSI indicates an overextended buying momentum, suggesting a pending technical correction.
- The hourly indicators have already started to consolidate.
In Friday’s session, the GBP/JPY pair experienced upward momentum, rising by 0.37% and the pair reached multi-year highs, a clear indication of the stronghold buyers have within the market. While a near-term technical correction could potentially occur due to the overbought condition, the overall outlook remains bullish for the cross.
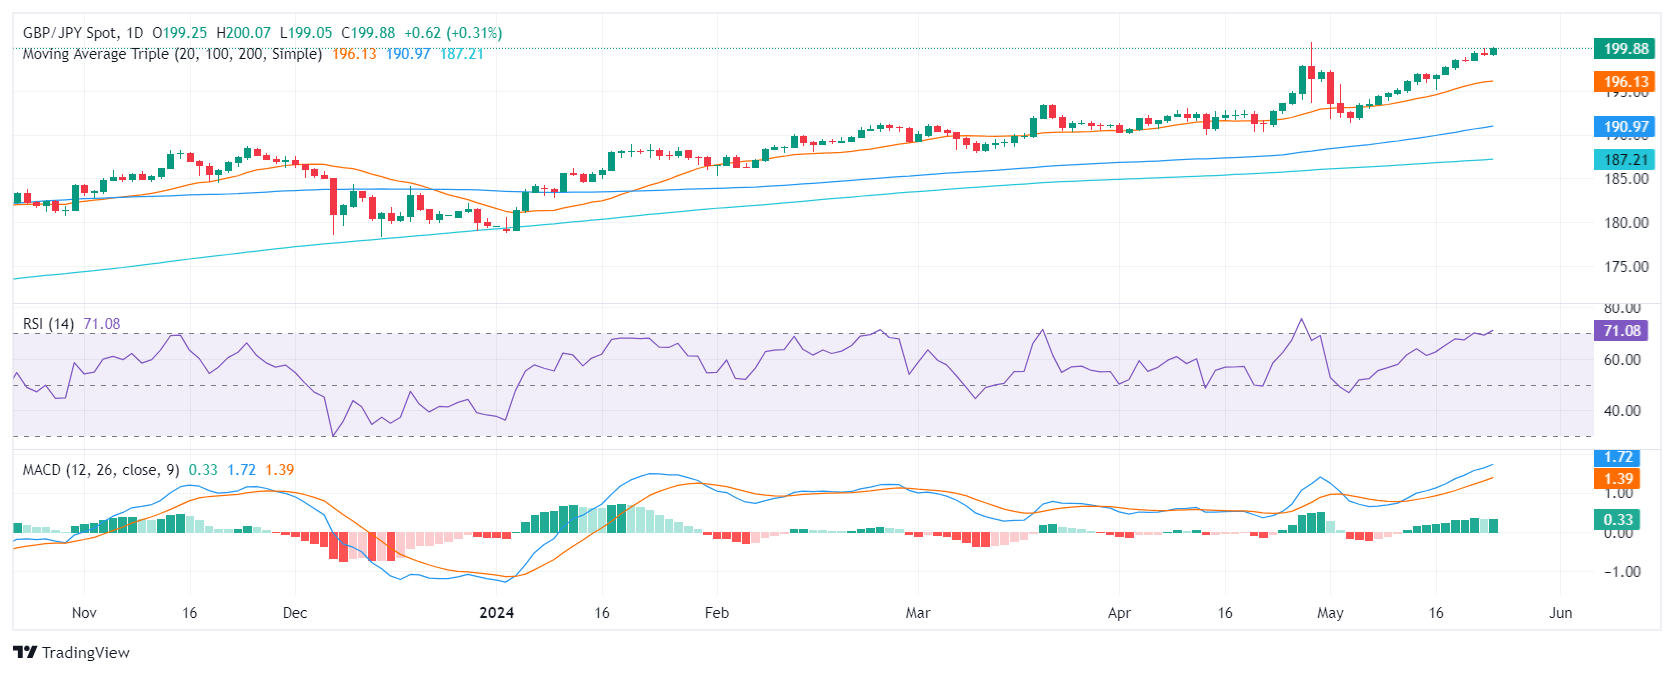
In the daily chart, the Relative Strength Index (RSI) has moved deep into overbought territory. The persistently high values hint at strong buying sentiment, but they also suggest a potential future correction. The Moving Average Convergence Divergence (MACD) reveals flat green bars, indicating positive momentum despite the relatively stable trend which may suggest that the pair might consolidate for the rest of the session.
GBP/JPY daily chart
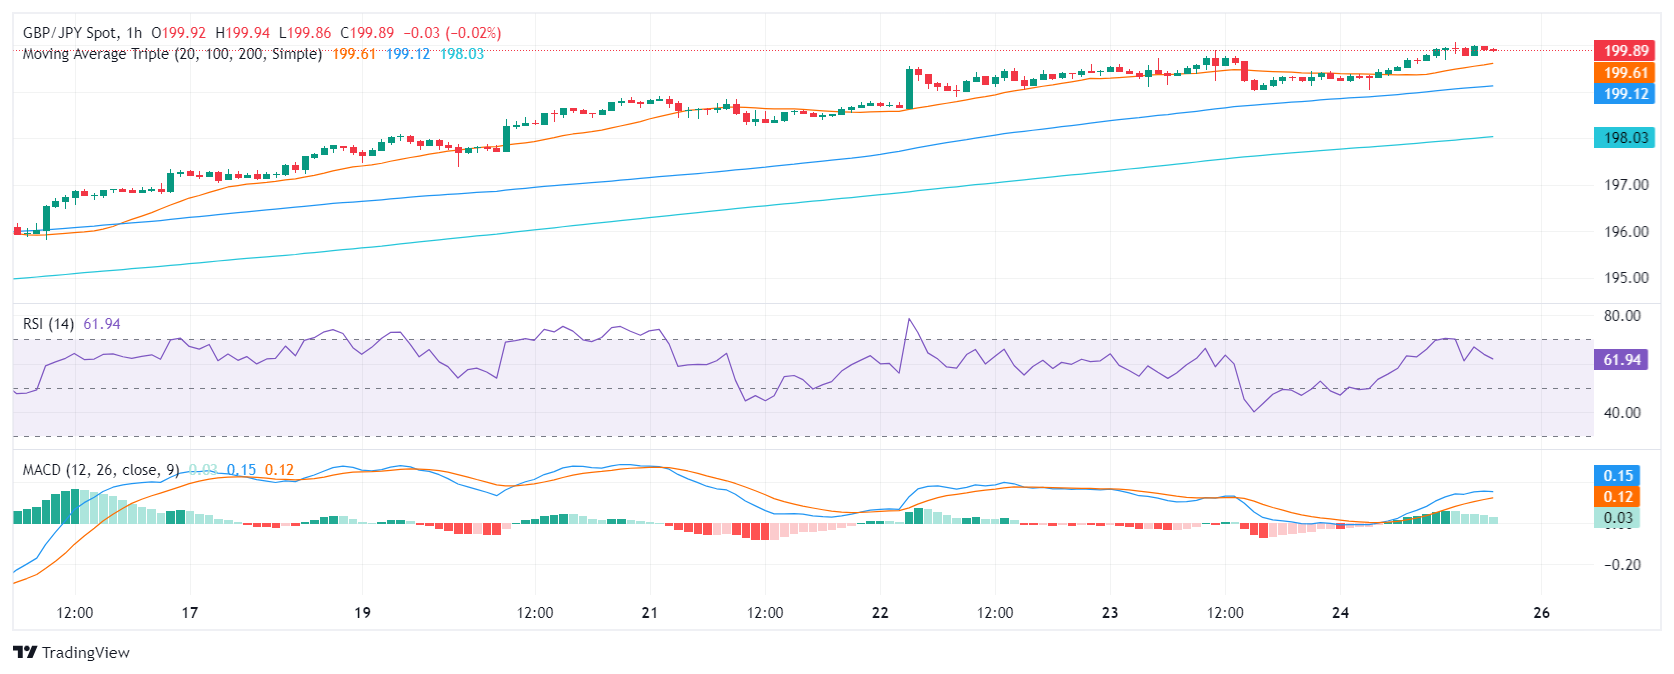
When examining the hourly chart, the RSI reveals noticeable ebbs and flows, with the latest value standing at 61. Although still positive, this level appears somewhat less intense when compared to the daily chart. The hourly MACD histogram continues to display flat green bars, indicating steady positive momentum which mirrors its daily counterpart.
GBP/JPY hourly chart
From a broader outlook, the GBP/JPY's position relative to its Simple Moving Averages (SMAs) helps to clarify the overall trend. The pair stands above the 20, 100, and 200-day SMAs, reflecting a bullish outlook for both short and long-term scenarios.


© 2000-2026. All rights reserved.
This site is managed by Teletrade D.J. LLC 2351 LLC 2022 (Euro House, Richmond Hill Road, Kingstown, VC0100, St. Vincent and the Grenadines).
The information on this website is for informational purposes only and does not constitute any investment advice.
The company does not serve or provide services to customers who are residents of the US, Canada, Iran, The Democratic People's Republic of Korea, Yemen and FATF blacklisted countries.
Making transactions on financial markets with marginal financial instruments opens up wide possibilities and allows investors who are willing to take risks to earn high profits, carrying a potentially high risk of losses at the same time. Therefore you should responsibly approach the issue of choosing the appropriate investment strategy, taking the available resources into account, before starting trading.
Use of the information: full or partial use of materials from this website must always be referenced to TeleTrade as the source of information. Use of the materials on the Internet must be accompanied by a hyperlink to teletrade.org. Automatic import of materials and information from this website is prohibited.
Please contact our PR department if you have any questions or need assistance at pr@teletrade.global.
transfers