- Analytics
- News and Tools
- Market News
- NZD/USD Price Analysis: Bulls maintain momentum, eyes on bullish crossover
NZD/USD Price Analysis: Bulls maintain momentum, eyes on bullish crossover
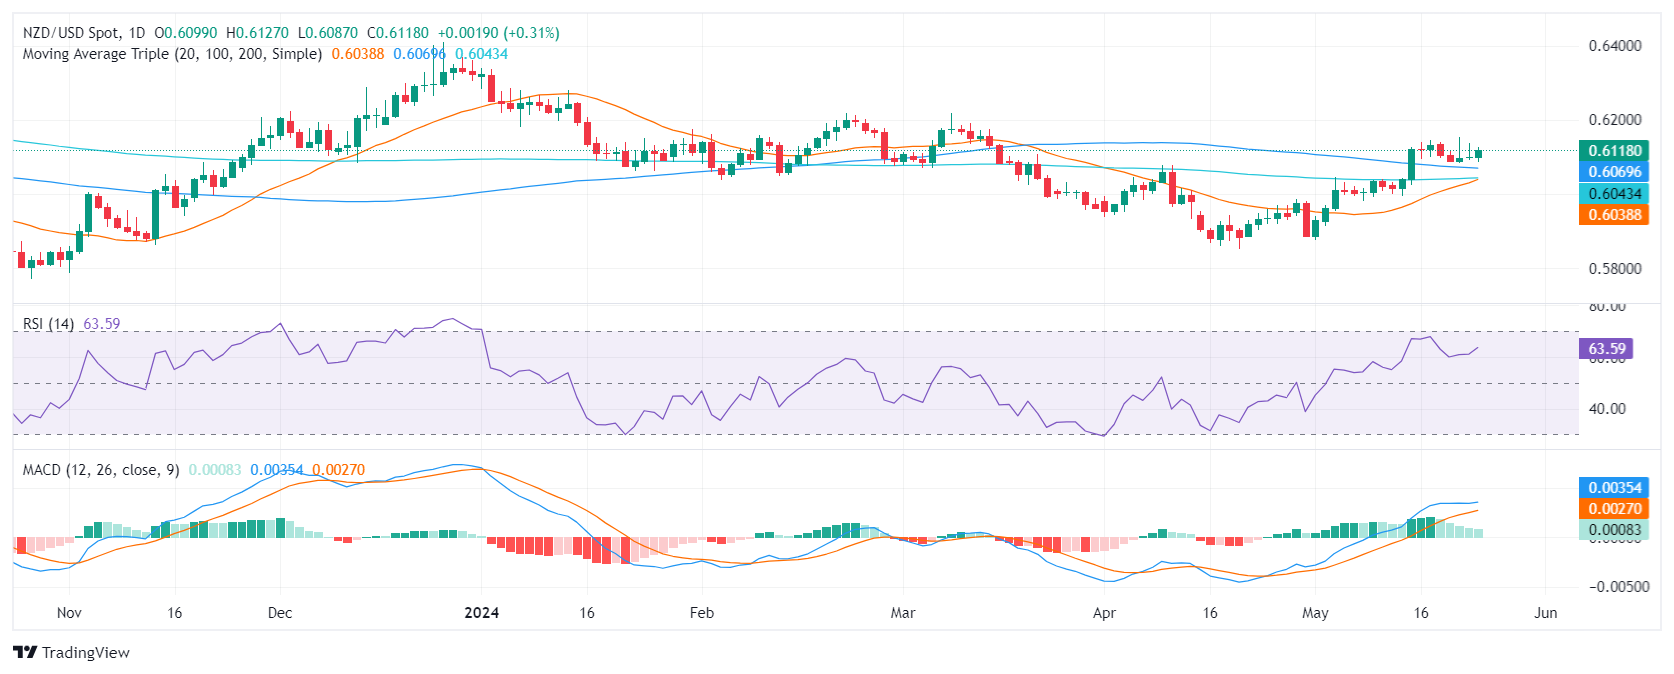
- The daily indicators remain in positive territory but somewhat flattened .
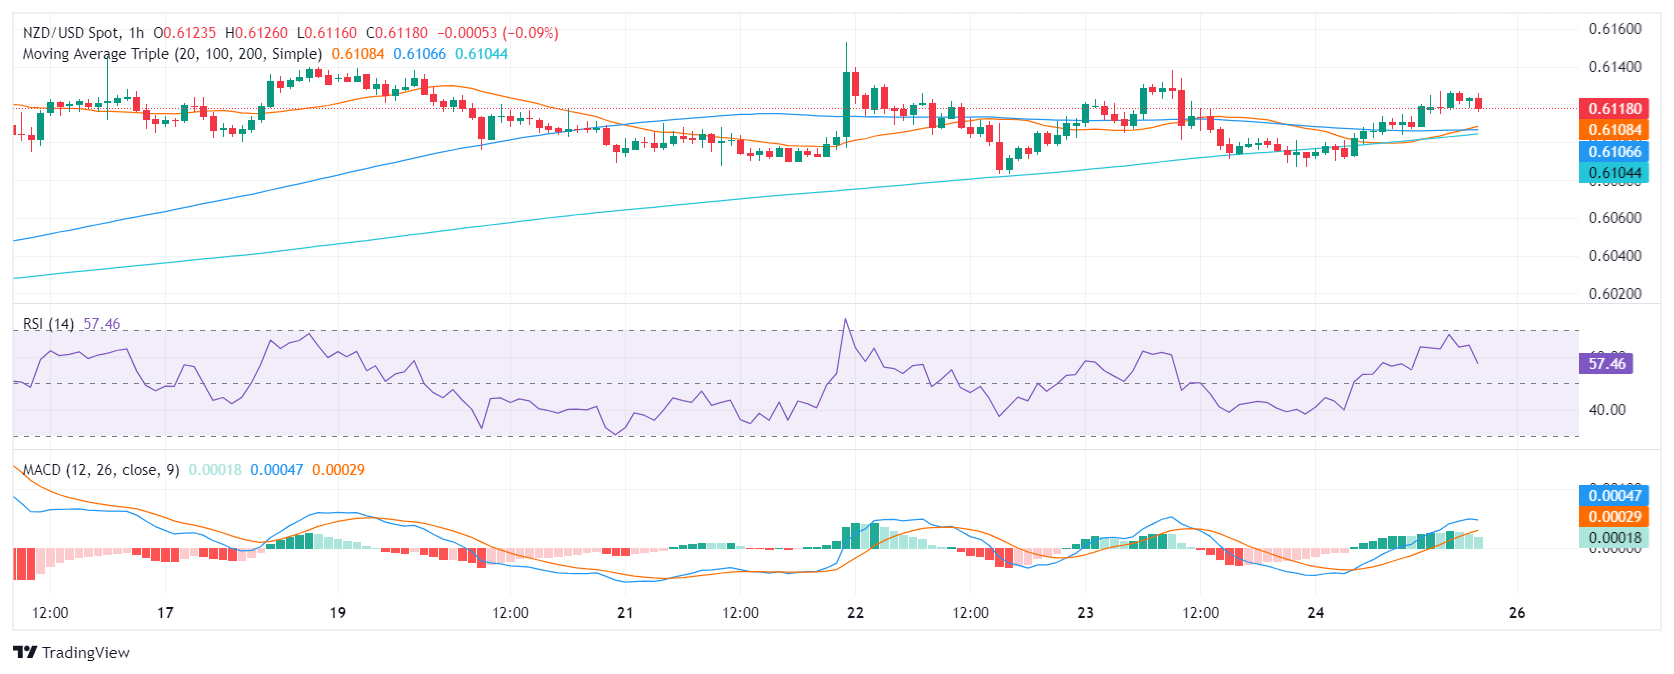
- The hourly charts reveal a temporary dip in the RSI and a MACD flattening, signaling a possible short-term consolidation.
- Pending bullish crossover between the 200 and 100-day SMA at 0.6040 could bolster the bullish momentum in future sessions.
During Friday's session, NZD/USD rose towards the 0.6125 level. The positive trajectory of the pair continues to convey a strong buyer influence in the market. However, echoes of consolidation may suggest a breather following the recent surge which pushed the pair above the 100 and 200-day Simple Moving Averages (SMA).
Examining the daily chart of the NZD/ pair, it is apparent that the Relative Strength Index (RSI) reveals a robust positive trend. After a close approach to overbought conditions at 69, the RSI receded to a still positive level of 63. In line with that, the Moving Average Convergence Divergence (MACD) prints flat green bars which may suggest a flattening momentum.
NZD/USD daily chart
Transitioning to the hourly chart, there is a discernible decreasing trend in the RSI readings, with figures retreating from 64 to 57 throughout Friday’s session. The MACD histogram aligns with this pattern, with flat green bars that signal reduced upward momentum.
NZD/USD hourly chart
From a broader perspective, the position of NZD/USD suggests a strong bullish trend. Trading above the Simple Moving Averages (SMA) of 20, 100, and 200-day, the pair displays upward momentum both on short-term and long-term scales.
Incorporating both the daily and hourly RSI trends, along with MACD and SMA positioning, the conclusion is drawn that the NZD/USD may need some respite after its recent surge. Despite this, the market structure maintains its bullish tone.


© 2000-2026. All rights reserved.
This site is managed by Teletrade D.J. LLC 2351 LLC 2022 (Euro House, Richmond Hill Road, Kingstown, VC0100, St. Vincent and the Grenadines).
The information on this website is for informational purposes only and does not constitute any investment advice.
The company does not serve or provide services to customers who are residents of the US, Canada, Iran, The Democratic People's Republic of Korea, Yemen and FATF blacklisted countries.
Making transactions on financial markets with marginal financial instruments opens up wide possibilities and allows investors who are willing to take risks to earn high profits, carrying a potentially high risk of losses at the same time. Therefore you should responsibly approach the issue of choosing the appropriate investment strategy, taking the available resources into account, before starting trading.
Use of the information: full or partial use of materials from this website must always be referenced to TeleTrade as the source of information. Use of the materials on the Internet must be accompanied by a hyperlink to teletrade.org. Automatic import of materials and information from this website is prohibited.
Please contact our PR department if you have any questions or need assistance at pr@teletrade.global.
transfers