- Analytics
- News and Tools
- Market News
Analytics, News, and Forecasts for CFD Markets: currency news — 01-04-2022.
- Gold slumps for the third day of the week amid an upbeat market mood and rising US yields.
- The 2s-10s yield curve inverted for the second time in the week as investors expect the US economy will slow down.
- Mixed US economic data was mainly ignored by XAU/USD traders.
- XAU/USD Price Forecast: In consolidation within the $1900-50 range.
Gold (XAU/USD) slides as the second quarter begins, down some 0.64% in the North American session. The Russia-Ukraine tussles, elevated global inflation, and rising US Treasury yields, keeping the non-yielding metal pressured. Nevertheless, an inversion in the 2s-10s yield curve is worth noting as investors assess the outcome for the yellow metal. At press time, XAU/USD is trading at $1924.46 a troy ounce.
Upbeat market sentiment and positive US economic data weighed on gold
US equities fluctuate as Wall Street is about to close; meanwhile, European bourses finished positive. The Russia-Ukraine war extends as peace talks over the last couple of weeks have failed to offer a diplomatic exit to the war. Furthermore, Russia’s President Vladimir Putin puts pressure on Europe after signing a decree that non-friendly countries need to pay in roubles for natural gas.
That triggered a raft of negative market moods on Thursday, which lifted gold towards $1950. Nonetheless, positive US economic data weighed on gold prices.
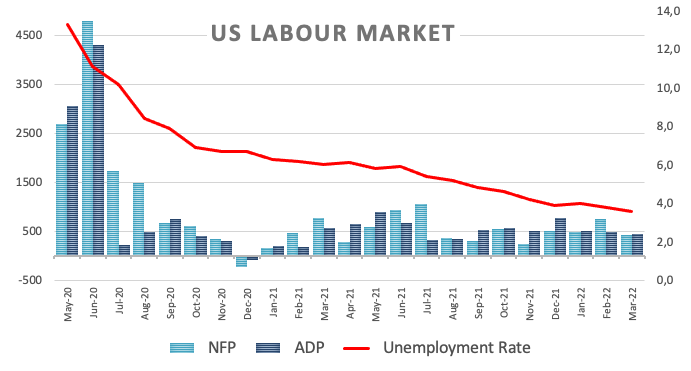
The US economic docket featured March’s Nonfarm Payrolls report, which came at 431K jobs created, lower than the 490K estimated by analysts. Even though it was slightly softer than expected, forecasts ranged from 0 to 700K, so the market perceived it as a robust report. Moreover, the Unemployment rate in March dropped to 3.6% from 3.8% YoY in and beat the 3.7% estimations.
Later the US ISM Manufacturing PMI, a leading indicator for the industry, fell to 57.1 in March from 58.6 in February, well below the 59 estimations by analysts.
Meanwhile, the US Dollar Index, a gauge of the greenback’s value against a basket of its rivals, rose 0.22%, sitting at 98.566, underpinned by US Treasury yields. The US 10-year benchmark note surges four basis points at 2.371%.
XAU/USD Price Forecast: Technica outlook
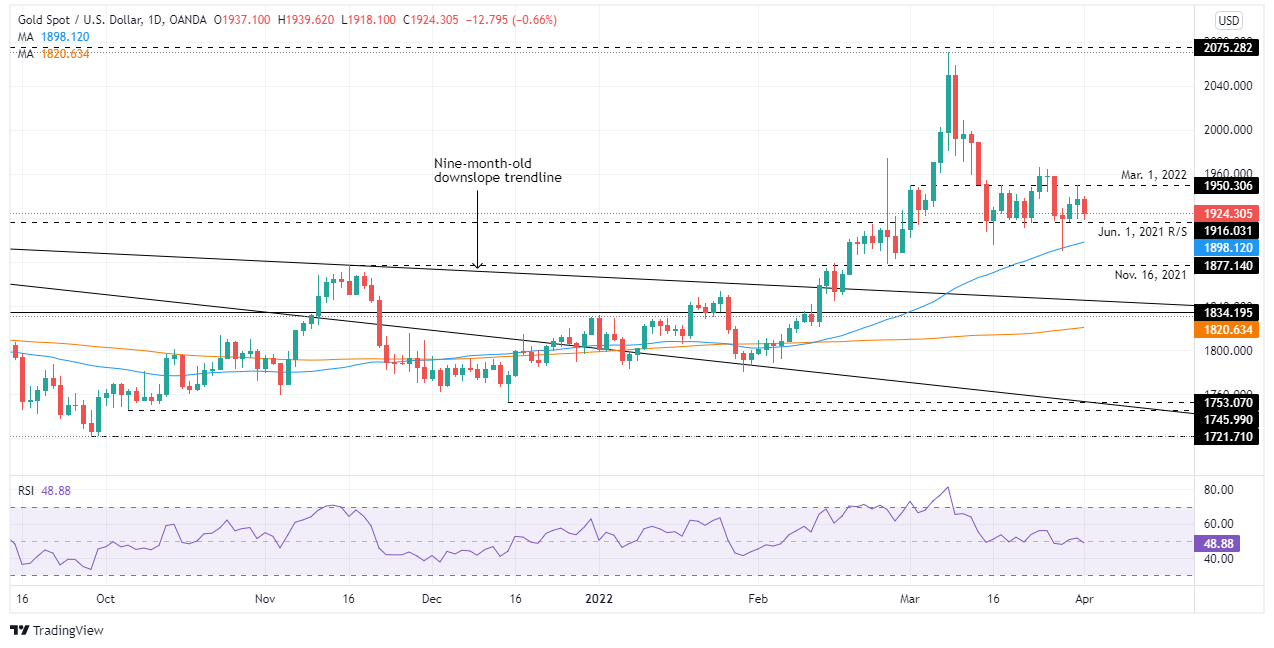
XAU/USD is trading within the $1910-50 range for thirteen consecutive days, consolidated and with a lack of direction. The Relative Strength Index (RSI), a momentum indicator, has been seesawing around the 50-midline but on Friday turned bearish at 48.71. However, the daily moving averages (DMAs) below the spot price depict an upward bias, but contradictory signals recommended to wait for a fresh catalyst.
Upwards, XAU/USD’s first resistance would be March 1 daily high at $1950.30. Breach of the latter would expose March 24 daily high at $1966.20, followed by $2000.
On the flip side, the XAU/USD first support would be $1910. A clear break would expose the 50-day moving average (DMA) at $1898.11, followed by November 16, 2021, daily high at $1877.14, followed by the 200-DMA at $1820.63.
- US equities were on course to post a third successive day in the red as strong US data saw markets up Fed tightening bets.
- The S&P 500 was last down 0.2% in the 4520 area.
US equities were on course to post a third successive day in the red on Friday as strong US labour market data and an inflationary ISM Manufacturing PMI report raised the prospect of a faster pace of Fed tightening this year and next. The S&P 500 was last trading about 0.1% lower on the day in the 4520s, having fluctuated between lows just above 4500 and highs near 4550. The index is on course to end the week with modest losses of about 0.4% and about 2.4% lower versus Tuesday’s highs.
The heavily tech/growth stock waited Nasdaq 100 index was a modest underperformer, losing nearly 0.5% to drop back into the 14,700s, leaving the index now more than 3.0% below earlier weekly highs in the 15,200s. However, the index remains on course to close in the green on the week. Tech/growth names underperformed on Friday amid a sharp rise in US yields, particularly at the short-end following the strong US data, which raises the “opportunity cost” of owning stocks whose current earnings are low relative to valuation.
Stocks whose current earnings are relatively higher when compared to current valuations, or so-called value/cyclical stocks which make up a heavier weighting in the Dow, performed better on Friday. Indeed, the Dow was last trading flat in the 34,600s, leaving it only about 2.0% below earlier weekly highs in the 35,300s. The S&P 500 CBOE Volatility Index (or VIX), often referred to as Wall Street’s “fear gauge” fell about half a point to near 20.00, which is its long-term average. That leaves it only about 1.50 above recent lows, indicative of calmer seas in the current equity market.
- Strong US data saw US yields surge as markets upped their Fed tightening bets, weighing on GBP/USD.
- The 21DMA continues to act as resistance, pushing the pair lower to near 1.3100, with BoE dovishness hampering sterling’s cause.
GBP/USD fell during US trade on Friday, as the US dollar strengthened versus the majority of its G10 counterparts following a strong official March labour market report and robust but also highly inflationary March ISM Manufacturing PMI survey release. To recap briefly, the US economy added 432K jobs, the unemployment rate dropped to 3.6% and wages grew at a pace of 5.6% YoY in March, while the headline ISM Manufacturing PMI index remained well in expansion territory, but the Price Paid subindex spiked to its highest levels since last July. The US dollar benefitted from a surge in US yields, particularly at the short-end of the curve. The bond market moves reflected a market interpreting Friday’s data strengthening the likelihood that the Fed opts to lift interest rates in 50 bps intervals in the coming quarters, and as more Fed policymakers indicated their openness to these larger rate moves.
At the time of writing, GBP/USD is trading just above the 1.3100 level and with on the day losses of about 0.2%. The pair continues to demonstrate that it is unable to break above its 21-Day Moving Average, which has been capping the price action now for nearly two weeks. It’s not just the stronger dollar acting as a headwind, but also poor UK fundamentals. As of this Friday (April 1), households in the UK will be paying over 50% more on their energy bills and this cost of living crisis is worrying the BoE. Indeed, Governor Andrew Bailey on Friday said that the BoE had already seen evidence of an economic slowdown that they expect to weigh on domestically generated inflation moving forward. That comes after the BoE softened its tone at its last meeting on the need for further rate hikes in the coming quarters to tackle inflation.
So just as the Fed is likely to become more hawkish, the BoE is getting more dovish. That suggests GBP/USD may continue having a tough time in getting above its 21DMA and bears will be eyeing downside targets. The main ones to look at are this week’s earlier lows in the 1.3050 area and March lows at pretty much bang on the psychologically important 1.3000 level just below it.
- The GBP/JPY advanced on Friday, recording gains of 0.57%.
- A positive market mood boosts risk-sensitive currencies like the GBP, weighing on safe-haven peers, like the yen.
- GBP/JPY Price Forecast: The “inverted hammer” and a “bullish harami” confluence keep the uptrend intact.
The GBP/JPY snaps three days of losses and jumps off Thursday’s losses amid a shift from a dismal to a favorable market mood, despite the continuation of Rissian’s invasion of Ukraine and market players’ worries about global inflation. At press time, the GBP/JPY is trading at 160.71.
Reflection of the positive market mood is European and US equities recording gains. Meanwhile, US Treasury yields surge, led by the short-end of the yield curve, with 2s and 5s rising more than the 10s and 30s, inverting the yield curve for the second time in three days.
Meanwhile, the Russia-Ukraine war continues for the fifth straight week. On Thursday, Russian President Putin stated that natural gas payments in roubles are irreversible and gave ten days of grace to European customers.
GBP/JPY Price Forecast: Technical outlook
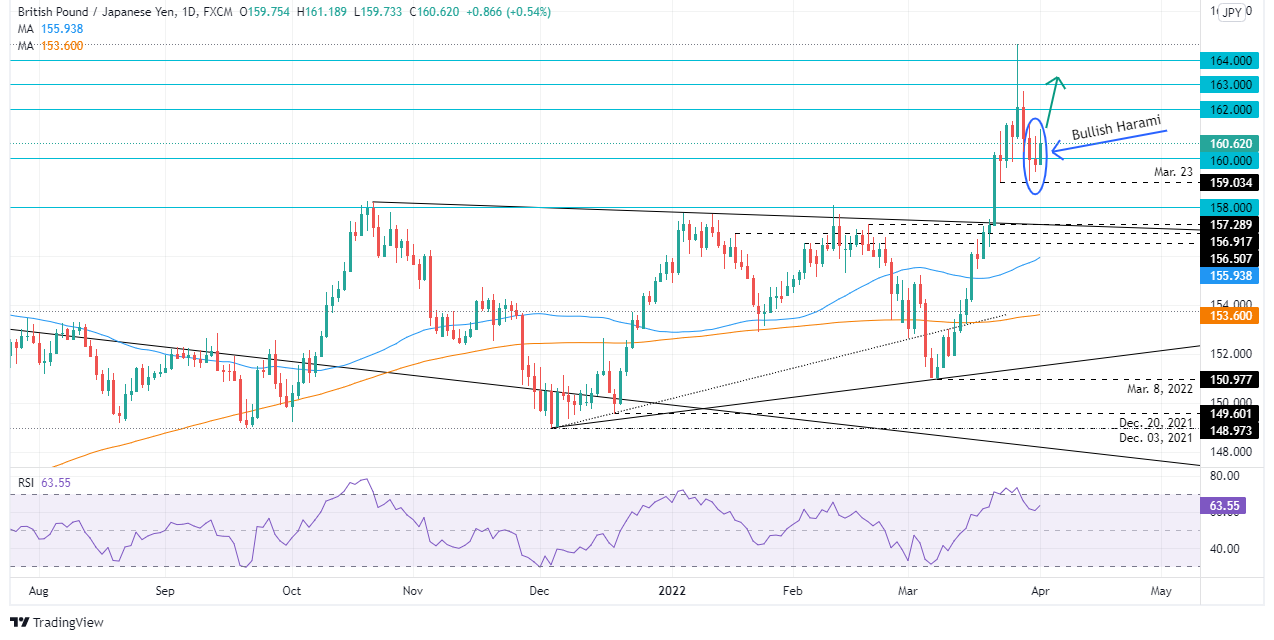
The GBP/JPY jumped off the 160.00 mark and is testing Thursday’s daily high at 160.88, but short of it. On Thursday, I noted that “a “quasi” gravestone doji” was forming; instead, an inverted hammer showed up, and it is worth noting that Thursday’s price action formed a bullish harami.
That said, the GBP/JPY uptrend is still intact, and the previous days’ price action formed a bottom around the 159.00-160.00 area. Upwards, the GBP/JPY first resistance would be 161.00. Breach of the latter would expose March 30 high at 161.36, followed by 162.00
Technical levels to watch for
- The AUD/USD fails to reclaim the 0.7500 mark for the seventh straight trading day.
- Mixed US macroeconomic data was no excuse for the greenback to rally vs. most G8 currencies.
- AUD/USD Price Forecast: The pair topped around the 0.7500 mark, exposing the AUD/USD to downward pressure.
The AUD/USD barely advances during the North American session as the market mood turns sour. US equities are recording losses, while US Treasury yields in the short-end of the curve are rising more than long-dated maturities, signaling that the US economy might slow down on aggressive Fed hiking. At the time of writing, the AUD/USD is trading at 0.7490.
Mixed US economic data and a risk-off mood boost the USD
Factors like the Russo-Ukraine conflict, and elevated global prices, shifted investors’ mood. Earlier in the day, the US Department of Labour unveiled March’s Nonfarm Payrolls report, which came at 431K jobs added, lower than the 490K foreseen by economists. Although that was slightly low than estimated, forecasts were from 0 to 700K, so the market perceived it as a solid report. Further, the Unemployment rate lowered from 3.8% YoY in February to 3.6% in March and beat the 3.7% expected.
Later the US ISM Manufacturing PMI, a leading indicator for the industry, fell to 57.1 in March from 58.6 in February, well below the 59 estimations by analysts.
Meanwhile, the US Dollar Index, a gauge of the greenback’s value against its peers, is rising 0.32%, sitting at 98.666, underpinned by high US Treasury yields. The US 10-year benchmark note rises three basis points, at 2.360%, though lower than 2s, which are at 2.428%, inverting the curve for the second time in the week.
AUD/USD Price Forecast: Technical outlook
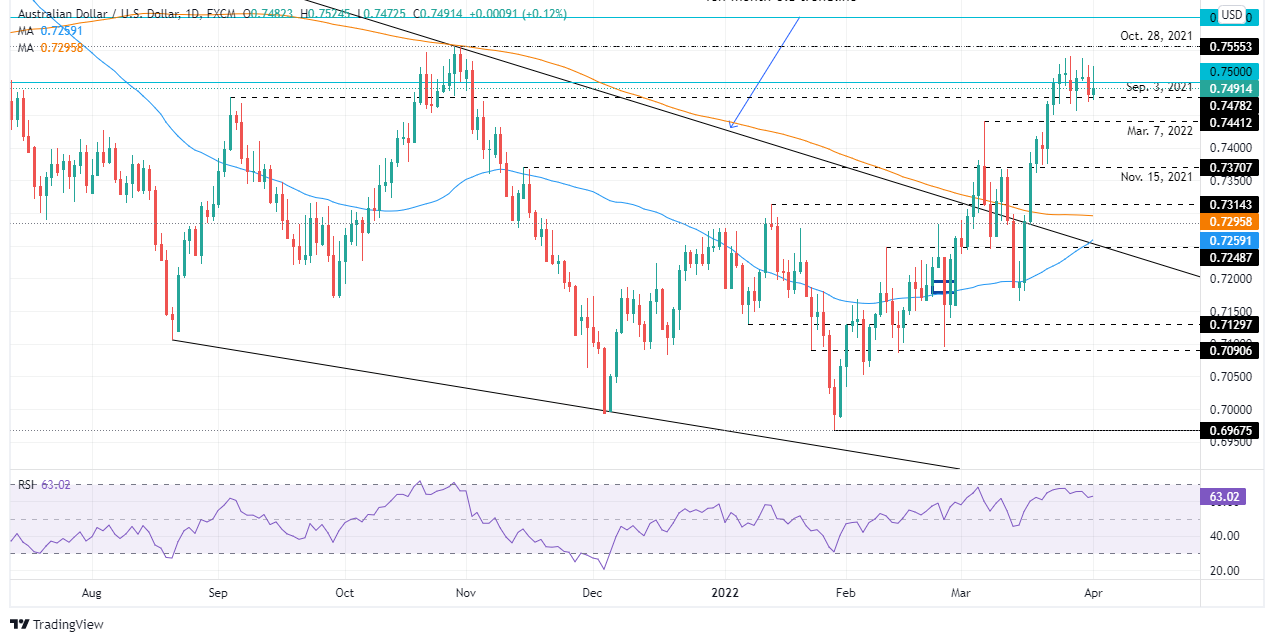
In the last seven days, AUD/USD price action has been meandering around the 0.7500 mark but so far has failed to sustain above it. It is worth noting that the candlesticks, most of them printed a larger wick on top of the real bodies, suggesting that solid resistance might cap latter moves. Also, failure to reclaim October 28, 2021, daily high at 0.7555, left the pair vulnerable to downward pressure.
Therefore, the AUD/USD first support level would be September 3, 2021, daily high at 0.7478. A sustained break would expose March 7 daily high at 0.7441, followed by 0.7400, and November 15, 2021, daily high at 0.7370.
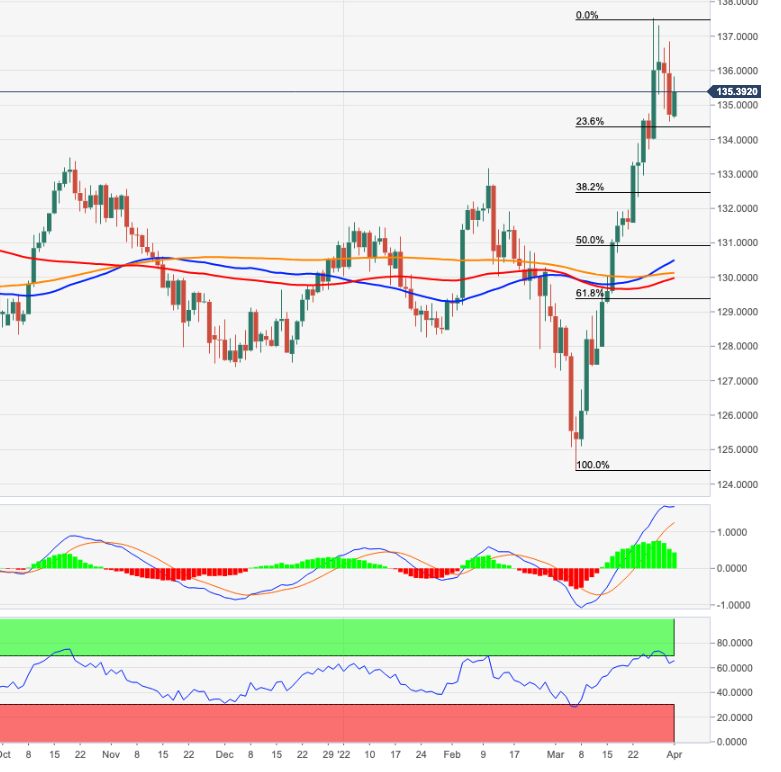
- EUR/JPY rebounded into the mid-135.00s as the yen suffered from higher yields and the euro benefitted from hot EZ inflation.
- ECB rhetoric was also notably more hawkish and, as a result, short-term EUR/JPY bulls are eyeing a retest of 137.00.
EUR/JPY rebounded back into the mid-135.00s on Friday as higher yields, particularly in the US weighed on the rate-sensitive yen and positive Russo-Ukraine rhetoric, hot Eurozone inflation and hawkish ECB commentary supported the euro. The pair, which hit lows in the 134.50 area during the Asia Pacific session, now trades with on-the-day gains of about 0.5% in the 135.30s. From a technical standpoint, recent price action isn't particularly notable, with the pair merely swinging within this week’s already well-established ranges.
With recent hot Eurozone inflation figures and increasingly hawkish sounding rhetoric from ECB members suggesting upside risks to Eurozone yields in the week ahead (lots of focus will be on the ECB minutes release on Thursday) many short-term bulls will be hoping that Friday’s recovery is the start of a more lasting move higher back towards this week’s highs in the 137.00 area. Geopolitical developments could make or break EUR/JPY’s short-term bullish prospects, with market participants waiting with abated breath to hear how Friday’s virtual Russo-Ukraine peace talks went.
Another geopolitical risk that EUR/JPY traders should be watching is the ongoing saga relating to Russia’s demands for rouble payments for gas exports. Any signs that Russia might cut gas to the Eurozone would be a big negative for the euro, as such an eventuality would quickly thrust the bloc’s economy into a deep recession amid energy rationing. Things don’t look like they are heading that way at the moment, so for now, EUR/JPY can maintain an upside bias.
- The greenback remains buoyant in the session, weighing on the Japanese yen.
- Upbeat US macroeconomic data boost US Yields.
- The yield curve is inverted in 2s-10s and 5s-30s.
- USD/JPY Price Forecast: The uptrend remains intact and might exacerbate an upward move towards 125.00 if it reclaims 123.00.
The USD/JPY recovers after dipping 350-pips in the week, rallying above the 122.00 mark on a buoyant market mood and a strong US dollar, lifted by solid US macroeconomic data and prospects of the Federal Reserve hiking rates by 50-bps in the May meeting. At the time of writing, the USD/JPY is trading 122.58.
Investors’ mood turned sour post the US macroeconomic data amid the extension of hostilities between Russia and Ukraine in Eastern Europe. The Russian Foreign Minister Lavrov said that Ukraine had understood the situation in Crimea and Donbas. Lavrov added that Russia was preparing a response to Ukraine’s proposals and said there is progress.
The US Dollar Index, a gauge of the greenback’s value vs. a basket of its peers, surges 0.29%, sits at 98.59, while the 10-year US Treasury yield advances five basis points, sits at 2.375%, underpins the USD/JPY.
It is worth noting that the yield curve in 2s-10s and 5s-30s has inverted at press time and is a signal that market players are expecting a slowing economy or even a risk of recession.
USD/JPY Price Forecast: Technical outlook
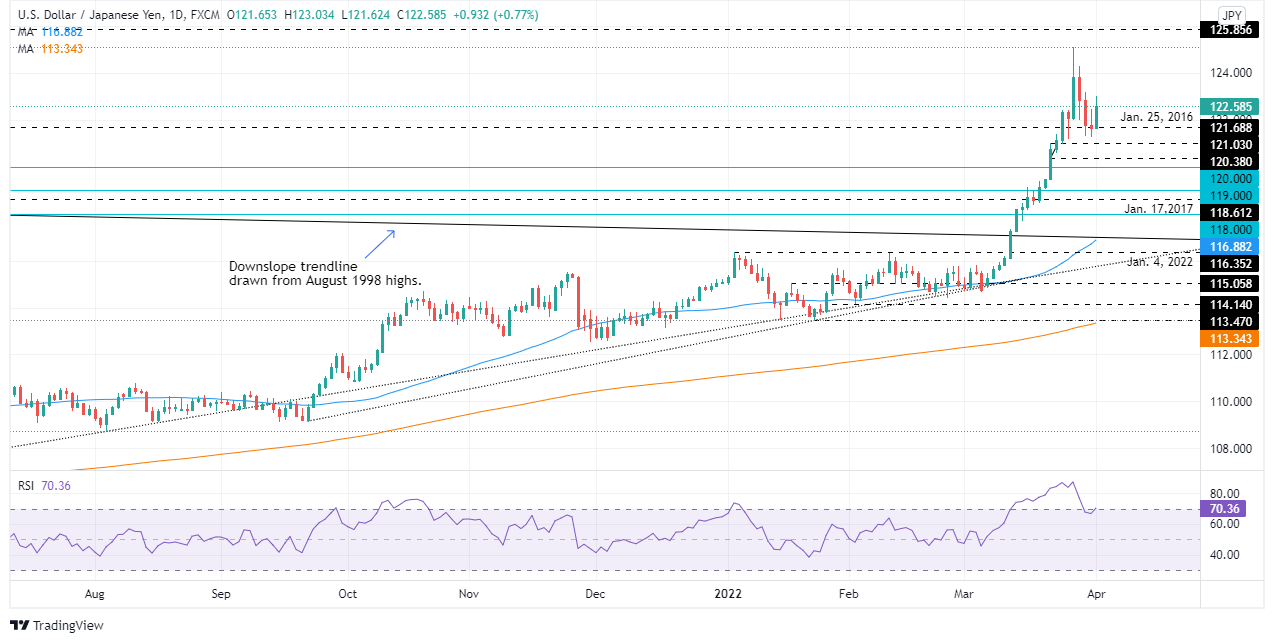
Friday’s price action witnessed a jump of the USD/JPY, from weekly lows, towards the mid-area of the trading range in the week. Furthermore, a “gravestone-doji” in a downtrend gave traders an early signal that the pair would either consolidate or resume upwards. So once confirmed that the USD/JPY recorded a bottom around 121.27, the uptrend is intact.
Therefore, the USD/JPY first supply zone to challenge would be 123.00. Breach of the latter would expose March 30, daily high at 123.20, once cleared, could pave the way towards 124.30, but first USD/JPY traders would need to reclaim 124.00.
Analysts at Rabobank forecast further upside for the USD/JPY pair towards the 125 level in the latter half of the year. They don’t see much upside in the short-term considering so much Federal Reserve policy tightening already priced to the dollar.
Key Quotes:
“USD/JPY has pulled back from its recent highs aided by verbal intervention from Japanese government officials. However, the JPY is not out of the woods. Another prolonged bout of severe selling pressure on the JPY could put pressure on the BoJ to re-think its QQE programme. We forecast further upside for USD/JPY towards the 125 level in the latter half of the year.”
“While we will be looking out for any further official commentary aimed at stalling the uptrend in USD/JPY, interest rate differentials and Japan’s position as a commodity importer suggest the possibility of further upside potential for USD/JPY this year. That said, due to the fact that so much Fed policy tightening is already priced to the USD, it is our central view that USD/JPY will only climb back to 125 in the latter half of the year. A rapid move to USD/JPY 125 and beyond would likely significantly increase the risk of the BoJ revising its QQE programme.”
Analysts at MUFG Bank, point out the higher price of crude oil should encourage a stronger Canadian dollar. They see the USD/CAD trading at 1.2200 by the end of the third quarter and at 1.2000 by the fourth quarter.
Key Quotes:
“The Canadian dollar strengthened in March along with AUD, NOK and NZD with the consistency being the obvious commodities linkage. These four currencies outperformed the US dollar while the rest of G10 depreciated. Mineral fuels, precious metals – mainly gold, timber, minerals and aluminium made up 5 of Canada’s top 10 exports, accounting for nearly 40% of exports.”
“USD/CAD was held back from steeper falls by the move in the US-CA spread in favour of the US dollar – the spread jumped by 18bps in March given the scale of shift in expectations for rate hikes by the Fed. Given Canada’s linkage to the US, moves in the 2yr spread tends to have a greater influence.”
“The hawkish Fed and expectations of a 50bp hike on 4th May likely means the BoC will hike by 50bps on 13th April. BoC vs Fed direction via the 2yr spread will remain the key driver of CAD direction and while crude oil volatility will at times influence CAD direction, the price action to date this year suggests oil developments will be secondary to spreads.”
- EUR/GBP flatlined in the 0.8420 area on Friday as hot Eurozone inflation failed to support the euro.
- While the pair is 1.0% off earlier weekly highs above 0.8500, it's still on course to end the week 1.1% higher.
- Evidence of growing ECB/BoE policy divergence could support a recovery in the pair next week.
EUR/GBP flatlined in the 0.8420 area on the final trading day of the week, with the bulls still licking their wounds following Thursday’s sharp pullback from multi-month highs above the 0.8500 mark. EUR/GBP has so far been unable to benefit from recent much hotter than anticipated Eurozone inflation readings, with the YoY HICP inflation rate hitting a staggering 7.5% in March according to data out on Friday. That could be because EUR/GBP had already staged a strong rally since the start of the week prior to the release of individual EU nation HICP and then aggregate HICP inflation data in the final two days of the week.
Indeed, even though the pair is over 1.0% lower versus Thursday’s highs, it remains on course to close out the week with a gain of about 1.1%. Despite the recent correction from highs which saw EUR/GBP lose its grip on the key 200-Day Moving Average at 0.8465, central bank divergence may continue to support the pair going forward. Various ECB policymakers were on the wires on Friday warning about how further deterioration in the inflation outlook could see the central bank hasten the end of its QE programme and potential start hiking rates as soon as the end of Q3.
The increasingly hawkish tone of ECB members is in stark contrast to the increasingly dovish tone of BoE policymakers. Governor Andrew Bailey on Friday said that the BoE had seen evidence of an economic slowdown that they expect to weigh on domestically generated inflation moving forward. That comes after the BoE softened its tone at its last meeting on the need for further rate hikes in the coming quarters to tackle inflation. Amid a lack of tier one data releases out of the Eurozone or UK next week, the main focus will be on commentary from BoE and ECB policymakers and Thursday’s ECB minutes. Further evidence of divergence between the two bank’s policy stance next week could easily see EUR/GBP reverse higher again and back above the 200DMA and onto towards the 0.8500 handle.
Data released on Friday showed employers added 431K jobs during March in the US. The unemployment rate fell to 3.6%. According to analysts from TD Securities, today’s numbers reinforce the strength of the labor market. They forecast a 50 bp rate hike in May and June.
Key Quotes:
“We think today's report does not change the calculus for the Fed. We continue to expect the Committee to increase rates by 50bp in both May and June, and to deliver a 25bp hike at each meeting through February 2023.”
“The payroll report reinforces the strength in the labor market, and we continue to look for 50bp Fed rate hikes in May and June, and 25bp hikes thereafter until February 2023. This should maintain the bear flattening pressure on the curve. The next key event for rates will be next week's FOMC minutes, which we expect to contain more discussion of QT.”
Analysts at MUFG Bank see the USD/INR moving to the upside in the coming months and they estimate the pair will trade at 78.500 by the end of the third quarter. They see global risk aversion and higher oil prices as negative for the Indian rupee.
Key Quotes:
“As the Ukraine war drags on, the rupee faces greater downside risks ahead as India’s terms of trade deteriorate substantially, ongoing risk aversion spur capital outflows and growth prospects dim in part due to higher inflationary pressures.”
“In view of the surge in oil and gold prices and India’s rather inelastic demand for oil, the trade deficit is expected to widen even further in the coming months. This will inevitably lead to a larger current account deficit possibly reaching 2.2% of GDP in FY22/23 versus an estimated 0.9% of GDP in FY21/22.”
“The lack of massive passive inflows into India’s bond market due to the delay of index inclusion, and another potential delay in the launch of India’s largest IPO that was originally slated for launch end-March, mean net portfolio flows on a BOP basis are tilted towards the downside. The RBI has since assuaged investors that it will step in to curb excessive INR volatility by utilising its foreign reserves. It has more than enough firepower given an import cover of slightly over 12 months.”
Chicago Fed President and FOMC member Charles Evans on Friday said that raising interest rates to just under 2.5% by March 2023 gives the Fed "optionality", reported Reuters. It is not a big risk if that rate-hike path includes "some" 50 bps hikes to get to the neutral rate sooner.
Monthly inflation reports should start to be lower in the second half of 2022, Evans said, but he added that the Fed's rhetoric won't change until 2023. Evans said that the latest US jobs report is not indicative of the economy overheating.
The US economy created 431K jobs in March, below the 490K of market consensus, according to the official employment report released on Friday. Analysts at Wells Fargo point out the number is lower than in recent months but it is nothing to be concerned about. They see the trend in hiring remains solid and today’s numbers support the prospect of a 50 bp rate hike from the Fed at the FOMC's May meeting.
Key Quotes:
“The slowdown in hiring in March leaves nothing to be concerned about on the labor front. Instead, the 431K increase in payrolls offers a cleaner read on the trend in hiring after the past few months' reports have been affected by unusual seasonal dynamics and the Omicron COVID wave. Hiring continues along at a robust pace that is still more than twice the average of the past expansion. If the March pace were to be sustained, payrolls would be back to their pre-COVID levels in July of this year.”
“Today, the employment report still contains relevant information for the FOMC, but it largely has taken a backseat to the inflation data.”
“We believe at least a 25 bp rate hike is locked for the May 3-4 FOMC meeting, and the door is now wide open for a 50 bp rate hike if the FOMC wants to walk through it. As of this writing, markets are nearly fully priced for a 50 bp hike in May, and we would not be surprised if the FOMC seizes the opportunity to accelerate the removal of monetary policy accommodation. The April 12 CPI release could be the final indicator that pushes markets to fully price a 50 bp hike for the May FOMC meeting.”
The conflict in Ukraine reinforces downside risks for the Turkish lira noted analysts at MUFG Bank. They forecast USD/TRY at 15.250 by the end of the second quarter and at 16.000 by the third quarter.
Key Quotes:
“The lira has re-weakened against the US dollar over the past month undermined primarily by the negative fallout from the Ukraine conflict.”
“The disruption of commodity and energy supplies from Russia is putting upward pressure on prices. The price of Brent has risen back above USD100/barrel. Our oil analyst expects the price of oil to rise further in Q2 and remain at higher levels through the rest of this year compared to last year’s average of USD71/barrel. The higher import bill will increase the likelihood that Turkey records a wider trade deficit.”
“Higher commodity and energy prices will also exacerbate worrying inflation dynamics in Turkey. Inflation pressures were already extreme prior to the Ukraine conflict with the headline rate rising to 54.4% in February. Building upside risks to the inflation outlook will further undermine confidence in current policy settings.”
“The CBRT provided no signal that it was prepared to tighten policy in response to higher inflation, and we continue to believe that current settings remain way too loose. The real policy rate after adjusting for inflation continues to move deeper into negative territory. It stands in contrast to the Fed’s updated plans to deliver larger rate hikes to front–load tightening. It leaves the lira vulnerable to further weakness in the year ahead.”
- The NZD/USD falls weighed by a firm US dollar and failure to break above 0.7000.
- US Nonfarm Payrolls advances by 431K lower than expected, but the Unemployment rate is down to 3.6%.
- The Russia-Ukraine conflict extends for the fifth consecutive week.
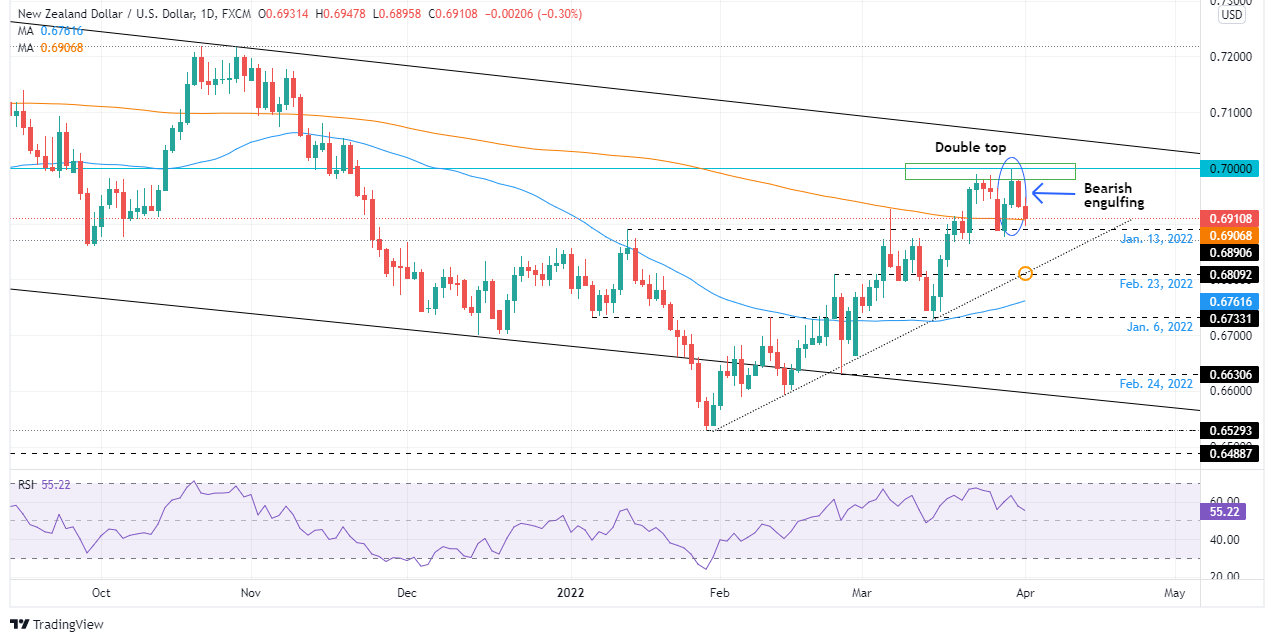
- NZD/USD Price Forecast: Friday’s price action confirms the double top.
The NZD/USD begins April on the wrong foot, extending Thursday’s losses and probing the 200-day moving average (DMA) at 0.6907 amidst a positive market mood. At 0.6913, it reflects the appetite for the greenback after a solid US employment report, which, even though it was softer than expected, is closing to recover to pre-pandemic levels.
Market mood and positive US jobs report boosts the USD
An upbeat market mood keeps global equities in the green. In the FX space, except for the New Zealand and Canadian Dollar, commodity-linked currencies like the Australian gain vs. the greenback. However, that does not reflect the current state of the Russia-Ukraine conflict, as the war extended for the fifth straight week while Ukraine shelled a Russian oil deposit in the city of Belgorod. Kremlin’s spokesman Dimitry Peskov condemned what happened, and he said that it “ isn’t what could be seen as creating conditions conducive to the continuation of talks.”
The US Department of Labour reported the Nonfarm Payrolls report for March. The US economy added just 431K jobs to the economy, lower than the 490K estimated. However, the positive is that Unemployment Rate keeps falling, from 3.8% in February to March’s 3.6%, lower than expectations, while Average Hourly Earnings for March rose by 5.6% y/y, higher than the 5.5% foreseen, further cementing the case for a second rate hike by the Fed.
Later the US ISM Manufacturing PMI, a leading indicator for the industry, fell to 57.1 in March from 58.6 in February, well below the 59 estimations by analysts.
The US Dollar Index, a measurement of the buck’s value vs. a basket of currencies, is rising 0.40% sitting at 98.710, underpinned by high US Treasury yields. The US 10-year benchmark note rises ten basis points, at 2.428%, though lower than 2s, which are at 2.456%, inverting the curve for the second time in the week.
NZD/USD Price Forecast: Technical outlook
Friday’s price action extended the NZD/USD losses and is “confirms” that a double-top chart pattern is in place. In fact, at press time, the pair is testing the 200-DMA and earlier reached a daily low at 0.6895, 20-pips short of the double’s-top neckline, which might send the NZD/USD towards 0.6780, as measured by the neckline to the highest top.
Therefore, the NZD/USD path of least resistance is downwards. The first support would be 0.6900. Once cleared, the next demand zone to challenge would be 0.6875, followed by February 23 daily high at 0.6809 and then 0.6780.
- EUR/USD falls on Friday on stronger dollar, sill up for the week.
- Mixed US March data: no surprises from employment, unexpected decline in the ISM Manufacturing PMI.
- Wall Street indices trim gains; European markets hold onto modest gains.
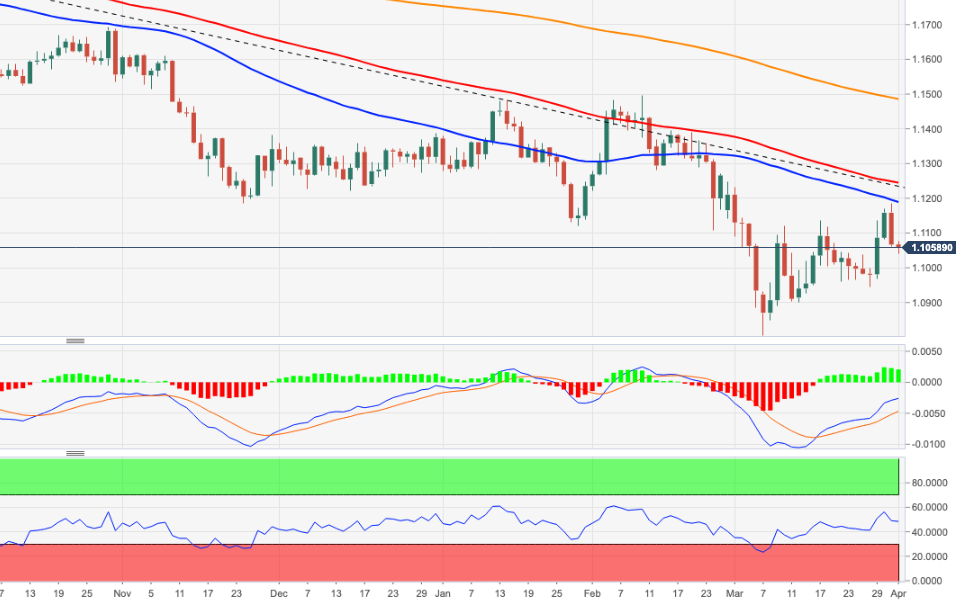
The EUR/USD dropped further and printed a fresh three-day low during the American session at 1.1026 as the US dollar gained momentum. The bias remains to the downside with the pair set to keep trimming weekly gains.
Dollar up after NFP, despite ISM
The US dollar strengthened after the beginning of the American session as market sentiment deteriorated with US stock indices trimming gains. Economic data from the US came in mixed but overall it appears to have helped the dollar.
The ISM Manufacturing index unexpectedly dropped to 57.1 in March, from 58.6; on the contrary, the S&P Global PMI was revised higher from 58.5 to 58.8. Earlier, the employment report showed the economy created 431K jobs in March, below the 490K expected, while the unemployment rate declined to the lowest since 2020 to 3.6%.
“A solid report does not change the dial for USD dynamics. If anything, this number should help validate market pricing for robust Fed tightening and our bias this quarter of fading EUR/USD extremes (within 1.08/12),” wrote TD Securities analysts.
EUR ends week on a negative tone
Despite losing ground on Friday for the second day in a row, EUR/USD is still up for the week. From Thursday’s top, it lost more than a hundred pips. So far it bottomed at 1.1026 and remains under pressure.
The dollar is set to end the week with losses, but not weak. The DXY is up 0.35% on Friday trading at 98.70, validating a recovery after trading under 98.00 during the previous two days.
Technical levels
- USD/CHF has been on the front foot in recent trade as the buck strengthens and US yields rally after strong US data.
- A solid US jobs report plus an inflationary ISM Manufacturing PMI survey helped the pair push into the upper 0.9200s.
- After finding support in the key 0.9200 area earlier this week, some technicians may now be targeting a test of the 21DMA near 0.9300.
US yields are sharply on the front foot in wake of the latest robust US labour market report, which spurred fresh bets on an aggressive approach to monetary tightening from the Fed in the coming quarters and this is giving the buck a boost. CHF and JPY are particularly sensitive to big moves higher in US yields given that the ultra-dovish stance of their respective central banks renders the yields of their respective governments comparatively lower.
Whilst the Swiss franc is performing as poorly as the yen, USD/CHF has still rallied about 0.5% to the 0.9260s, with 0.3% of that move coming over the last two hours since the US jobs data was released. Indeed, the jobs report was the initial catalyst that saw the pair push to the north of the 0.9250 level once again and break above Thursday’s highs at 0.9259. Traders also noted the latest ISM Manufacturing PMI survey, released recently at 1500BST, as bullish for the US dollar and US yields (and therefore for USD/CHF) given the sharp jump in the Prices Paid subindex.
USD/CHF found solid support at a medium-term uptrend in the 0.9200 area this week, an uptrend that links a series of lows going all the way back to the start of the year, as well as at the 200-Day Moving Average around 0.9210. That may be taken by some technicians as a bullish sign and with the pair now trading back above its 50DMA at 0.9256, many may now be targeting a move higher to test the 21DMA just above 0.9300.
Dutch Central Bank head and European Central Bank Governing Council member Klaas Knot said on Friday that the ECB will have to wind down its Asset Purchase Programme (APP) as quickly as possible, reported Reuters. However, Knot said he does not see the tapering of the ECB's QE programme ending before Q3. Rather, he continued, its more likely to end the APP at the beginning rather than end of Q3.
Referring to Friday's much higher than expected Eurozone HICP inflation reading, Knot said it was water under the bridge and emphasised that the ECB's gradualism is not a mistake. We can afford to be gradual as long as inflation is see converging towards the bank's long-term 2.0% target, he noted. Knot said that he doesn't see a recession, but instead sees "slowflation" and said that there could be a rate hike in September, October or December.
- DXY pushes higher and revisits the 98.70 region.
- US Nonfarm Payrolls came in below estimates at 431K.
- The ISM Manufacturing surprised to the downside in March.
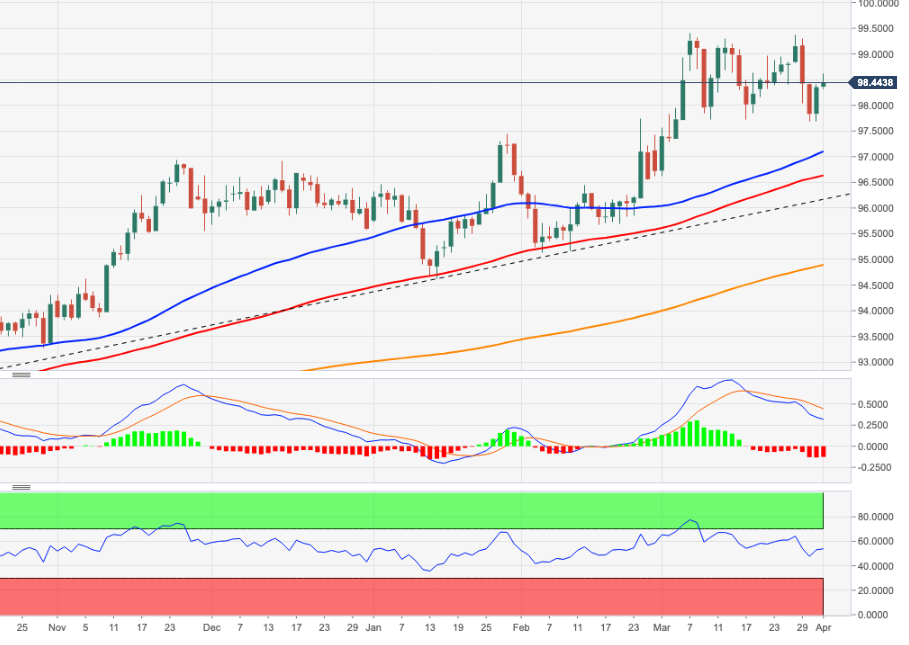
The US Dollar Index (DXY), which gauges the buck vs. a bundle of its main rivals, extends the daily upside to the 98.70 region on Friday.
US Dollar Index stronger post-NFP
The index accelerates gains and is up for the second session in a row, putting at the same time further distance from weekly lows in the 97.70 region recorded on March 30, 31.
The uptick in the dollar comes pari passu with the resumption of the uptrend in US yields across the curve: the short end flirts with recent cycle highs near 2.45%, the belly advances to 3-day tops near 2.45% and the long end approaches the 2.55% level.
The buying pressure on the dollar gathers extra steam after the US economy created 431K jobs in March and the jobless rate dropped more than expected to 3.6%. In addition, further evidence of the tightness of the labour market was seen after the Average Hourly Earnings rose 0.4% MoM and 5.6% from a year earlier.

Finally, Construction Spending expanded 0.5% MoM in February, the Manufacturing PMI came at 58.8 and the ISM Manufacturing unexpectedly deflated to 57.1, both prints for the month of March.
What to look for around USD
The index extends the bounce to the area well north of the 98.00 hurdle at the end of the week. In the meantime, very near-term price action in the greenback continues to be dictated by geopolitics, while the case for a stronger dollar in the medium/long term remains well propped up by the current elevated inflation narrative, a potentially more aggressive tightening stance from the Fed, higher US yields and the solid performance of the US economy.
Key events in the US this week: Nonfarm Payrolls, Unemployment Rate, Final Manufacturing PMI, ISM Manufacturing PMI (Friday).
Eminent issues on the back boiler: Escalating geopolitical effervescence vs. Russia and China. Fed’s rate path this year. US-China trade conflict. Futures of Biden’s Build Back Better plan.
US Dollar Index relevant levels
Now, the index is up 0.28% at 98.62 and a break above 99.36 (weekly high March 28) would open the door to 99.41 (2022 high March 7) and finally 100.00 (psychological level). On the flip side, the next down barrier emerges at 97.68 (weekly low March 30) seconded by 97.10 (55-day SMA) and then 96.62 (100-day SMA).
The dramatic surge higher in USD/JPY has stopped just shy of the 125.86 high of 2015. If the pair is able to surpass this level, a secular base would be completed, opening up the 147/153 zone, economists at Credit Suisse report.
USD/JPY to move into a broad 119/125 range in Q2, possibly lower
“With weekly momentum having moved to typical high extremes our bias for Q2 is to look for a deeper setback to the 23.6% retracement of the 2021/2022 rally at 119.79, potentially 119.09. We would then look for an attempt to find a floor here for an approximate 119/125 ranging phase.”
“Below 119.09 would warn of a deeper setback to what we would look to be better supported at 116.50/35.”
“If the 125.86 high of 2015 can be cleared this would suggest we have seen the completion of a secular base. If achieved we would see scope for a rise in USD/JPY over the coming years to 135.20 and eventually around 147/153.”
The headline ISM Manufacturing Purchasing Manager's Index (PMI) figure fell to 57.1 in March from 58.6 in February, a miss against expectations for a small rise to 59.0, according to the latest release by the Institute for Supply Management (ISM). There was a sharp rise in the Price Paid subindex to 87.1 from 75.6 in February, which was larger than the expected reading of 80.0. The Employment index rose to 56.3 from 52.9 in February, in fitting with the recently released strong official labour market data, while the New Orders index fell sharply to 53.8 from 61.7 in February.
Market Reaction
FX markets hardly budged in reaction to the data which, most notably, showed a surge in inflationary pressures in the manufacturing sector last month.
The US Dollar Index (DXY) remains in a consolidation phase following its impressive run higher. Still, economists at Credit Suisse stay bullish for a move to the top of the five-year range at 102/102.50.
DXY needs to hold support at 98.73/42 to avoid a near-term top
“Whilst we have concerns regarding momentum our bias remains, for now, to view this as a temporary pause ahead of a resumption of the core uptrend in due course to the 78.6% retracement of the 2020/2021 fall at 100.00/04 and eventually the top of the five-year range at 102.00/102.50.”
“Key for the DXY is a cluster of supports including its recent lows and 55-day average at 98.73/42. This needs to hold to maintain the current range for a move back to 99.42 and then 100.00/04.”
“Below 98.73/42 would see a top established to suggest the USD can retrace lower through the early phase of Q2 with support seen next at the uptrend at 98.26, with the ‘measured top objective’ at 96.05/00, where we would start to look for a fresh floor.”
USD/MXN remains within the broader medium-term range and analysts at Credit Suisse look for the market to remain in relatively balanced state in Q2 as well. Nonetheless, a break below 19.3843 would warn of further weakness.
January 2021 low and the uptrend form 2017 at 19.6550/3843 to serve as a solid floor
“We expect the January 2021 low and the uptrend form 2017 at 19.6550/3843 to serve as a solid floor for the recent weakness, with a bounce-back higher likely to take place in case this level is reached.”
“A break below 19.6550/3843 would see scope to fall all the way back to 18.6082/5155, which includes the 2020 low and the 50% retracement of the uptrend from 2011.”
Gold has seen a decisive rejection of its $2,075 record high to leave the core trend sideways. The yellow metal would need to surpass this mark to enjoy further upside, strategists at Credit Suisse report.
A break below $1,877 can further reassert the broad sideways
“Only above its $2,075 record high would be seen to resolve the lengthy sideways range higher for a fresh bull trend with resistance then seen at $2,280/2,300.”
“A break below $1,877 can further reassert the broad sideways range with support then seen next at $1,845, then $1,818/08.”
Without the support of additional hawkishness from the European Central Bank (ECB), economists see limited tailwinds for the EUR against higher-yielding/hawkish central bank currencies such as the USD and CAD over the coming quarters. The EUR may, however, gain some ground against currencies like the GBP and AUD, with markets anticipating even more misplaced hiking bets for their respective central banks.
EUR upside is narrowing
“With limited room for more hikes from the ECB over the coming year than what markets are anticipating, there are no major EUR tailwinds for the quarters ahead aside from a marked decline in energy prices alongside a Ukraine war ceasefire. Even with a détente, the eurozone is bound to face high energy prices that limit growth with sanctions on Russia maintained and the bloc meeting a higher share of its energy needs from other, costlier sources.”
“With markets, and some economists, anticipating that the Fed and the BoC will hike to 3% next year, yield differentials will remain an important drag on the EUR against the USD and the CAD – with EUR losses heading to 1.08 and 1.35 against these currencies, respectively.
“The EUR may fare better against the GBP since markets have placed even more unlikely bets on BoE hikes this year, seeing a policy rate of 2-2.25% by end-2022 – at least 75bps higher than BoE guidance suggests. Here, EUR/GBP looks set to climb to 0.87, at least, in coming weeks as the BoE douses tightening expectations.”
“An easing of overextended RBA expectations and a possible normalization of commodity prices should also help take EUR/AUD back above 1.50 while a very dovish SNB and an overvalued franc against the EUR points to the EUR/CHF targeting a test of 1.06.”
- Gold continues to trade on the back foot post-NFP amid the stronger US dollar and higher US yields, plus positive Russo-Ukraine newsflow.
- Bears will be eyeing a drop back towards $1900 and perhaps a test of the 50DMA just below it next week.
The latest broadly robust US labour market figures, which saw the Unemployment Rate in March fall back to near pre-pandemic levels at 3.6% after a solid 431,000 gain in jobs on the month, have not had a lasting impact on precious metals markets. Spot gold (XAU/USD) prices have continued to trade on the back foot and recently printed fresh session lows under $1924, a reflection of Friday’s slightly stronger US dollar and higher US bond yields. Data out of the US this week has on the whole been very much in fitting with the notion that the US labour market is very tight and inflation remains very high.
These two factors form the underpinning of the Fed’s recent hawkish policy shift that has been so supportive of both US yields and the US dollar, so perhaps in wake of Friday’s jobs data, it isn’t surprising to see these trends continue. Further weighing on gold has been 1) recent positive commentary from Russian Foreign Minister Sergey Lavrov regarding Russo-Ukraine peace talks and 2) downside in crude oil markets after the US reserve release announcement. The former has seen investors unwind some geopolitical risk premia, which typically benefits gold, while the latter has reduced demand for inflation protection, which, again, typically supports gold.
After failing to break back above its 21-Day Moving Average (DMA) earlier in the week in the $1950s, short-term XAU/USD bears may now be targeting a reversal lower towards $1900 and a test of the 50DMA, which resides just below it. Volumes are likely to decline from here ahead of the weekend, so such a move may have to wait until next week. But if the newsflow regarding Russo-Ukraine talks remains positive, the US data economically bullish and the Fed rhetoric (from policymakers and in the minutes) hawkish, the gold bears will be confident.
- USD/CAD struggled for a firm direction and oscillated in a range around the 1.2500 mark.
- The mixed technical setup warrants some caution before placing aggressive directional bets.
- Sustained strength beyond the 200-hour SMA would set the stage for a meaningful upside.
The USD/CAD pair seesawed between tepid gains/minor losses through the early North American session and held steady near the 1.2500 psychological mark post-US NFP.
Crude oil prices added to the previous day's heavy losses and undermined the commodity-linked loonie. This, along with sustained US dollar buying, acted as a tailwind for the USD/CAD pair. Bulls, however, have been struggling to lift spot prices beyond the 200-hour SMA, currently around the 1.2525 region, which should now act as a pivotal point.
Given that technical indicators on hourly charts have recovered from the negative territory, the bias seems tilted in favour of bullish traders. That said, bearish oscillators on the daily chart make it prudent to wait for some follow-through buying beyond the aforementioned barrier before confirming that the USD/CAD pair has bottomed out.
In the meantime, the 1.2480-1.2475 region now seems to protect the immediate downside ahead of the YTD low, around the 1.2430-1.2425 zone touched earlier this week. This is followed by the 1.2400 mark, which if broken decisively, will be seen as a fresh trigger for bearish trades and make the USD/CAD pair vulnerable to prolonging its recent decline.
On the flip side, bulls are likely to wait for sustained strength beyond the 1.2530-1.2535 area before positioning for any meaningful upside. The next relevant hurdle is pegged near the 1.2560 region, above which the USD/CAD pair is likely to aim to reclaim the 1.2600 mark and test the very important 200-day SMA around the 1.2615 zone.
USD/CAD 1-hour chart
-637844167056375749.png)
Technical levels to watch
The situation in Ukraine is likely to remain in focus for the foreseeable future. Subsequently, strategists at Deutsche Bank believe that the geopolitical situation will keep oil prices at elevated levels.
Scepticism on OPEC+ reaching its announced baseline production levels
“A deal with Iran could bring more capacity to the market and producers in the US are likely to start cashing in on price strength with the rig count gradually ticking up. This should result in supply potentially outpacing demand in the coming quarters.”
“OECD commercial inventories are at their tightest levels in more than seven years and roughly 8.5% below the previous five-year seasonal average. The fact that rebuilding these inventories to pre-Covid levels will be a lengthy process should cushion the price impact of a surplus market.”
“The situation in Ukraine is likely to remain in focus for the foreseeable future. Western demand for oil from outside Russia should provide a sustained tailwind for prices. We therefore expect a WTI price of $110/b by the end of March 2023.”
The Canadian dollar regains ground after mid-week stumble. Economists at Scotiabank note that prospects remain bullish for the loonie and expect the USD/CAD pair to tick down in the near-term.
Resistance is at 1.2530
“Intraday price signals are negative for the USD; spot has traded down from the low 1.25s seen in early European trade in relatively aggressive fashion, leaving bearish prints on the 1 and 6-hour charts, which should keep downside pressure on the USD in the short run.”
“We spot support at 1.2465 ahead of the mid-week low at 1.2430.”
“Resistance is 1.2530.”
Both the rising inflation expectations and the status ascribed to gold as a "safe haven" are currently causing prices to test new highs. Strategists at Deutsche Bank expect XAU/USD to advance nicely towards $2,100 by end-March 2023.
Rising inflation expectations and geopolitics will attract further investors to gold
“Were it not for the war in Ukraine, gold could likely have come under pressure due to the expected Fed rate hikes.”
“With central banks possibly acting more cautiously and inflation expectations rising at the same time, real interest rates in many industrialised countries are likely to remain in deeply negative range for quite some time.”
“Inflation and geopolitical risks will keep attracting investors towards the yellow metal. This should support the gold price, which we forecast at $2,100/oz at end-March 2023.”
EUR/USD slides back to the mid 1.10s. Although the pair seems far from the test of 1.12, economists at Scotiabank still expect EUR/USD to break above this level.
A break of 1.10 on the day would threaten the bottom of the channel around 1.0990
“Steep losses yesterday from an intraday high of 1.1185 to a close about 120pips lower leave the EUR far from the test of 1.12 that would have strengthened the technical picture. The EUR is nevertheless trading in a bullish channel since the early March lows that is targeting an eventual break of the 1.12 mark.”
“A break of 1.10 on the day, which stands as the next support marker after 1.1035/40 would threaten the bottom of the channel at ~1.0990.”
“Resistance is ~1.1075 and the figure area.”
The beginning of the invasion of Ukraine which put the supposed currency “safe havens” in focus. First and foremost, of course, was the US dollar. Economists at Deutsche Bank expect the greenback to remain supported in the near-term but forecast the EUR/USD pair moving upward to the 1.15 mark in 12 months.
EUR will strengthen especially in the second half of the year
“The USD is likely to remain supported in the short-term due to safe-haven demand.”
“While we now expect the ECB to hike less than initially thought as it tries to maintain favourable financing conditions in the region, the risk premia that have been baked into the EUR recently should reverse at least partially over the coming twelve months. In addition, the safe-haven flows into the USD are likely to moderate.”
“We think that the EUR will strengthen especially in the second half of the year, however, it may not be able to reach our pre-conflict forecast of 1.20. We now expect the EUR to trade vs. USD at 1.15 by end-March 2023.”
Chicago Fed President and FOMC member Charles Evans on Friday said that he expects the equivalent of seven 25 bps rate hikes in 2022 followed by a further three in 2023, reported Reuters.
"Developments may cause me to alter this assessment," he noted, adding that the Fed will learn more through the year and will be prepared to adjust policy as needed. Evans reiterated his call for "timely" rate hikes with a "cautious, humble and nimble" approach. Evans did not remark on the latest robust US jobs numbers.
- Sustained USD buying dragged GBP/USD lower during the early North American session.
- The US NFP report reaffirmed Fed rate hike bets and continued underpinning the buck.
- The risk-on mood might cap the safe-haven USD and help limit deeper losses for the pair.
The GBP/USD pair witnessed some selling during the early North American session and dropped to a fresh daily low, closer to the 1.3100 mark following the release of the US jobs report.
The headline NFP showed that the US economy added 431K jobs in March, less than the 490K expected. The disappointment, however, was largely offset by an upward revision of the previous month's reading to 750K from the 678K reported earlier. Furthermore, the unemployment rate fell to 3.6% from the 3.8% previous, while Average Hourly Earnings rose 0.4% MoM as compared to an upward revised 0.1% in February.
There were no big surprises in the report, though the details reinforced market bets that the Fed would hike interest rates by 100 bps over the next two meetings. This, in turn, pushed the US Treasury bond yields higher and continued underpinning the US dollar, which exerted some downward pressure on the GBP/USD pair. That said, a positive risk tone capped the safe-haven buck and extended some support to the major.
Bulls, so far, have managed to defend the 1.3100 round-figure mark, which should now act as a pivotal point. A convincing break below would expose the weekly low, around mid-1.3000s. Some follow-through selling would make the GBP/USD pair vulnerable to accelerating the slide to the YTD low, around the 1.3000 psychological mark.
With the key data out of the way, the market focus shifts back to fresh developments surrounding the Russia-Ukraine saga. Investors remain optimistic about the possibility of a breakthrough in the Russia-Ukraine peace talks and a diplomatic solution to end the way. This was evident from a goodish move up in the equity markets.
Hence, the incoming geopolitical headlines will continue to play a key role in influencing the broader market risk sentiment. This, along with the US bond yields, will drive the USD demand and produce some trading opportunities around the GBP/USD pair on the last day of the week.
Technical levels to watch
- EUR/USD keeps the bearish note near the 1.1050 region.
- US Nonfarm Payrolls rose by just 431K jobs in March.
- The unemployment rate ticked lower to 3.6%.
The selling interest around the single currency remains well in place at the end of the week and pushes EUR/USD back to the vicinity of the 1.1000 zone in the wake of US NFP.
EUR/USDnow looks to ISM
EUR/USD keeps the negative stance on Friday after the US economy created 431K jobs during March, missing estimates for a gain of 490K jobs. The Febuary reading was revised to 750K (from 678K).
Further data showed the jobless rate eased to 3.6% and the critical Average Hourly Earnings – a proxy for inflation via wages – rose 0.4% MoM and expanded 5.6% over the last twelve months. Another key gauge, the Participation Rate, improved a tad to 62.4%.
Later in the NA session, the ISM Manufacturing is due seconded by the final print of the Manufacturing PMI, both for the month of March.
EUR/USD levels to watch
So far, spot is losing 0.08% at 1.1057 and faces the next up barrier at 1.1184 (weekly high March 31) followed by 1.1187 (55-day SMA) and finally 1.1243 (100-day SMA). On the other hand, a drop below 1.0944 (weekly low March 28) would target 1.0900 (weekly low March 14) en route to 1.0805 (2022 low March 7).
- USD/JPY regained positive traction on Friday and snapped three successive days of the losing streak.
- The risk-on mood, Fed-BoJ policy divergence weighed on the JPY and continued lending support.
- Elevated US bond yields, mostly upbeat US NFP data underpinned the USD and favours bullish traders.
The USD/JPY pair held on to its intraday gains, above the mid-122.00s through the early North American session and had a rather muted reaction to the US monthly jobs report.
The headline NFP print showed that the US economy added 431K jobs in March as against 490K expected, though the disappointment was offset by an upward revision of the previous month's reading to 750K. Additional details revealed that the unemployment rate dropped to 3.6% from 3.8% in February and Average Hourly Earnings grew 0.4% from the 0.1% previous.
The data reaffirmed market bets that the Fed would hike interest rates by 100 bps over the next two meetings to combat stubbornly high inflation. This was reinforced by elevated US Treasury bond yields, which underpinned the US dollar. On the other hand, the Japanese yen was weighed down by the Bank of Japan's commitment to aggressively defend its 0.25% yield cap.
This, along with a generally positive tone around the equity markets, dented demand for safe-haven JPY and acted as a tailwind for the USD/JPY pair. Therefore, the USD/JPY posted the first daily gain in the previous four and assisted the pair to stall its pullback from levels above the 125.00 psychological mark, or the highest since August 2015 touched earlier this week.
With Friday's key data out of the way, the market focus shifts back to fresh developments surrounding the Russia-Ukraine saga. The incoming headlines will influence the broader market risk sentiment, which along with the US bond yields and the USD price dynamics, should provide some impetus to the USD/JPY pair and allow traders to grab some short-term opportunities.
Technical levels to watch
- Headline NFP was weaker than expected at 431K but a larger revision to February's number more than made up for this.
- Measures of labour market slack were stronger than expected and wage growth metrics were hot.
- The US dollar saw some initial knee-jerk strength but the DXY has since stabilised around pre-data levels.
Nonfarm Payrolls (NFP) rose by 431,000 in March, below the median economist forecast for a 490,000 rise, data published by the US Bureau of Labor Statistics showed on Friday. However, the February Non-Farm Payrolls number received a hefty 72,000 upwards revision to 750,000 from 678,000, more than making up for the 59,000 miss on the March headline expected number.
Private Nonfarm Payrolls rose by 426,000 in March, a little below expectations for a 480,000 rise, but as with the headline, the February Private Nonfarm Payrolls number also got a hefty upgrade to 739,000 from 654,000. This made up for the miss on the March Private Nonfarm Payrolls expected number. Government payrolls rose 5,000, a slowdown from the 11,000 rise in February, which had been revised lower from 24,000. Manufacturing Payrolls rose 38,000 in March, above the 30,000 expected gain and in line with February's gain also of 38,000, which had been revised slightly higher from 36,000.
Turning to measures of labour market slack; they were robust across the board. The unemployment rate slumped to 3.6% in March from 3.8% in February, larger than the expected drop to 3.7%. That larger than expected drop came despite a 0.1% gain in the Participation Rate to 62.4% in March from 62.3% in February. The U6 Underemployment Rate fell to 6.9% from 7.2%. Finally, Average Hourly Earnings growth came in a little hotter than expected, rising 5.6% YoY in March versus expectations for a rise to 5.5% from 5.2% in February. MoM, Average Hourly Earnings were up 0.4%, in line with expectations and higher versus February's 0.1% gain, which had been revised lower from 0.6%.
Market Reaction
The broadly robust jobs report saw the US dollar initially enjoy some knee-jerk upside, though prices have since pulled back to stabilise around pre-data levels in the 98.50 area.
- Oil was trading with a bearish bias on Friday amid Russo-Ukraine peace talk optimism and crude oil reserve release focus.
- WTI dipped below $100 per barrel and hit fresh weekly lows sub-$98.00, with bears eyeing March lows in the $93.00s.
Oil prices have continued to trade with a bearish bias on Friday, with front-month WTI futures dipping to fresh weekly lows under $98.00 as traders digest the recent announcement of a major crude oil reserve release in the US (1M barrels per day for six months) and a further tightening of lockdown measures in major Chinese economic zone Shanghai. Recent positive commentary from Russian Foreign Minister Sergey Lavrov regarding progress in Russo-Ukraine peace talks is also weighing on oil as geopolitical risk premia is further unwound. Having found resistance at its 21-Day Moving Average (DMA) in the $108 area earlier in the week, WTI is now probing its 50DMA to the downside in $98.00s.
International Energy Agency member nations recently commenced a meeting and the speculation is that other major oil consumer nations might also announce crude oil reserve releases alongside the US. US President Joe Biden said this could amount to a further 30-50M barrels of immediate supply. If confirmed, further newsflow pertaining to crude oil reserve releases could inject further bearishness into crude oil markets, with a test of March lows in the $93.00s on the cards.
But as was the case back in March, any dip into the mid or low $90s may well be seen by the longer-term bulls as a good buying opportunity. Commodity strategists noted that US crude oil reserve releases over the coming months will not be enough to make up for the loss of as much as 3M barrels per day in Russian supply as a result of sanctions. Meanwhile, OPEC+ this week resisted calls to increase output at a faster pace than the usual 400K barrels per day per month, suggesting the group is not eager to ease the global supply squeeze.
Meanwhile, OPEC+'s struggles to lift output in line with its own output quota hikes was on display again on Friday after a Reuters survey revealed output rose just 90K barrel per day MoM in March, well below the 400K target. That meant that the group’s compliance to its own supply cut pact rose to over 150% from 136% one month earlier. Commodity strategists will argue that against the backdrop of OPEC+ output struggles and sanction-caused Russian supply shut-ins, global oil markets will remain exceedingly tight for the foreseeable future, suggesting a structurally higher WTI (i.e. near or above $100 per barrel) continues to make sense.
- AUD/USD regained positive traction on Friday amid a generally positive risk tone.
- Some follow-through USD buying should cap the upside ahead of the US jobs data.
- The uncertainty over Ukraine might further hold back bulls from placing fresh bets.
The AUD/USD pair maintained its bid tone heading into the North American session and was last seen trading near the daily high, around the 0.7515-0.7520 region.
The pair attracted fresh buying on the last day of the week and reversed the overnight modest losses amid a positive risk tone, which tends to benefit the perceived riskier aussie. Despite a breakthrough in the Russia-Ukraine peace negotiations, hopes for a diplomatic solution to end the war boosted investors' confidence ahead of the resumption of talks on Friday.
The market sentiment, however, remains fragile amid the risk of a further escalation in the Russia-Ukraine conflict. In fact, Ukraine's President Volodymyr Zelensky warned that Russia is consolidating and preparing powerful strikes in the besieged Mariupol. This, along with hawkish Fed expectations, underpinned the US dollar and should cap gains for the AUD/USD pair.
Investors seem convinced that the Fed would hike interest rates by 100 bps over the next two meetings to combat stubbornly high inflation. This was evident from a fresh leg up in the US Treasury bond yields, which assisted the buck to capitalize on the overnight recovery move from a nearly two-week low. The USD bulls, however, seemed reluctant ahead of the US monthly jobs data.
The popularly known NFP report, scheduled for release during the early North American session, will influence market expectations about the Fed's next policy move. Apart from this, fresh developments surrounding the Russia-Ukraine saga should drive the USD demand. This, in turn, should provide a fresh impetus to the AUD/USD pair and allow traders to grab some short-term opportunities.
From a technical perspective, the AUD/USD pair has been oscillating in a familiar range over the past one week or so. This comes on the back of the recent rally from sub-0.7000 levels, or the YTD low and could be categorized as a bullish consolidation phase. That said, it will be prudent to wait for sustained breakout through the said trading band before positioning for any further gains.
Technical levels to watch
- US yields and the buck are a little higher pre-NFP and this is keeping silver prices on the back foot.
- Spot prices continue to see selling pressure ahead on the $25.00 level, with recent Russo-Ukraine commentary positive.
- If the US data is robust, XAG/USD might be pressured back towards weekly lows in the $24.00 area.
While off earlier session highs, US yields have picked up a little on Friday in the run-up to the release of the official March US labour market report at 1330BST, which is then followed by the release of the March US ISM Manufacturing PMI survey at 1500BST. This, coupled with a mild continued rebound in the US dollar which has seen the DXY recover to the 98.50 area, is weighing modestly on silver. Spot prices (XAG/USD) trade about 0.5% lower on the day in the $24.60s area. Notably, the $25.00 per troy ounce level has been acting as solid resistance since Tuesday.
This week’s US data so far (JOLTs, ADP, Initial Jobless Claims, Core PCE) have all been robust and supportive of the notion that the US economy remains strong, with a tight labour market and elevated inflation. Upcoming data on Friday should continue to signal this, which means that US yields and the US dollar are likely to remain supported close to recent highs. That suggests the prospect for a breakout above $25.00 on Friday isn’t great, particularly against the backdrop of recent positive commentary from Russian Foreign Minister Sergey Lavrov on Russo-Ukraine peace talks.
Talks between the two warring countries recommence on Friday, meaning that geopolitics is set to remain a key focus. Any signs that further progress has been made towards a peace deal, combined with what is very likely to be more robust US economic data, could weigh on XAG/USD. Short-term bears will be eyeing a potential retest of weekly lows in the $24.00 area, where the 200-Day Moving Average resides.
US monthly jobs report overview
Friday's US economic docket highlights the release of the closely-watched US monthly jobs data. The popularly known NFP report is scheduled for release at 12:30 GMT and is expected to show that the economy added 490K new jobs in March, down from the 678K reported in the previous month. The unemployment rate is expected to edge lower to 3.7% from 3.8% in February. Apart from this, investors will take cues from Average Hourly Earnings amid expectations for a more aggressive policy response to contain high inflation.
As Joseph Trevisani, Senior Analyst at FXStreet, explains: “It is becoming clear that the reconstitution of the labor market is not enough to prevent inflation from crippling the economic recovery. The crucial factor is consumer spending. About two-thirds of US economic activity can be directly traced to personal expenditures. The availability of jobs and the ability of workers to seek higher wages are the main supports for consumer spending.”
How could the data affect EUR/USD?
A stronger than expected reading would reaffirm market bets for a 50 bps Fed rate hike move at the next two meetings, which should push the US Treasury bond yields and the US dollar higher. Conversely, any disappointment could prompt some USD selling, though the reaction is likely to be short-lived amid fading hopes for a de-escalation in the Ukraine war. This, in turn, suggests that the path of least resistance for the EUR/USD pair is to the downside.
Meanwhile, Eren Sengezer, Editor at FXStreet, offered a brief technical outlook and outlined important technical levels to trade the major: “EUR/USD is trading below the 200-period SMA on the four-hour chart after managing to hold above that line mid-week. On the downside, 1.1040 (Fibonacci 50% retracement of the latest downtrend) aligns as the first support before 1.1020 (100-period SMA) and 1.1000 (psychological level, Fibonacci 38.2% retracement).”
“On the flip side, EUR/USD faces immediate resistance at 1.1080 (Fibonacci 61.8% retracement) before 1.1100 (psychological level, 200-period SMA). With a four-hour close above the latter, buyers could show interest in the shared currency and the near-term technical outlook could turn bullish. In that case, the pair could target 1.1160 (static level),” Eren added further.
Key Notes
• Nonfarm Payrolls March Preview: How long can plentiful jobs defray the dangers of inflation?
• Nonfarm Payrolls Preview: Three reasons for a downside surprise, triggering dollar buy opportunity
• NFP Preview: Forecasts from 10 major banks, another large gain for employment anticipated
About the US monthly jobs report
The nonfarm payrolls released by the US Department of Labor presents the number of new jobs created during the previous month, in all non-agricultural business. The monthly changes in payrolls can be extremely volatile, due to its high relation with economic policy decisions made by the Central Bank. The number is also subject to strong reviews in the upcoming months, and those reviews also tend to trigger volatility in the forex board. Generally speaking, a high reading is seen as positive (or bullish) for the USD, while a low reading is seen as negative (or bearish), although previous months reviews and the unemployment rate are as relevant as the headline figure.
- EUR/USD trades slightly on the defensive in the 1.1050/60 band.
- A deeper pullback could extend to the 1.0944 level.
EUR/USD keeps the offered stance well and sound in the second half of the week, at least ahead of the NFP release later on Friday.
Considering the ongoing price action, further decline should not be discarded with the immediate target at the weekly low at 1.0944 (March 28). The breach of this level exposes a retracement to the 1.0900 zone (March 14) prior to the 2022 low at 1.0807 (March 7).
The medium-term negative outlook for EUR/USD is expected to remain unchanged while below the key 200-day SMA, today at 1.1484.
EUR/USD daily chart
- DXY adds to recent gains above the 98.00 mark.
- Further recovery looks to regain the 99.00 neighbourhood.
The index extends the recovery to the 98.60 region ahead of the key Nonfarma Payrolls on Friday.
DXY manages well to extend further the bounce off decent contention area in the 97.70 zone (March 30,31) and the ongoing rebound is expected to target the 99.00 neighbourhood and beyond in the near term.
The current bullish stance in the index remains supported by the 6-month line near 96.20, while the longer-term outlook for the dollar is seen constructive while above the 200-day SMA at 94.87.
DXY daily chart
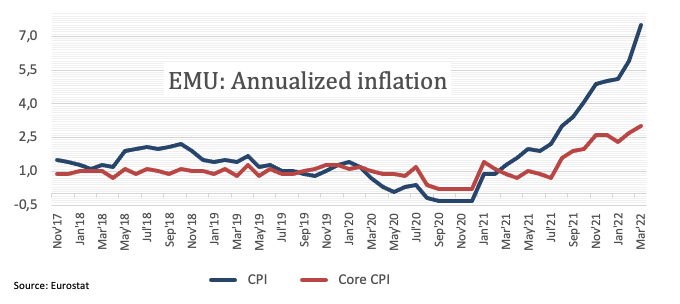
European Central Bank Chief Economist Philip Lane said on Friday that if the inflation outlook deteriorates, the ECB will rethink its timeline for ending Quantitative Easing (QE), reported Bloomberg. Lane's comments come after the preliminary estimate of the Harmonised Index of Consumer Prices (HICP) released earlier in the session showed Eurozone prices rose at a staggering 7.5% YoY pace in March, well above the expected pace of 6.6%, with the leap from 5.9% in February driven by a 3.0% MoM gain in prices, according to the HICP.
Lane commented that Friday's inflation reading was very high and said that there will be more momentum behind inflation from higher energy prices. At the upcoming meetings, he continued, we'll analyse the first-order impact of higher energy prices, as well as the hit to confidence. Signs of wage responses to inflation were very mild earlier this year, he noted, before cautioning that inflation has risen yet again. However, he noted, it remains the case that wages are responding in a very limited way. The ECB's chief economist commented that firms are facing higher costs and lower demand and have to take that into account when setting wages. We should take our time using quarterly forecasts, Lane said.
- EUR/JPY regains some composure and reverses the recent drop.
- The 134.40 region has so far turned up as a decent contention area.
EUR/JPY regains the smile and leaves behind two consecutive sessions with losses on Friday.
The underlying upside momentum in the cross remains unchanged for the time being. That said, the next hurdle remains at the 2022 high at 137.54 (March 28) prior to a probable visit to the August 2015 peak at 138.99 (August 15) and ahead of the round level at 140.00.
In the meantime, while above the 200-day SMA at 130.09, the outlook for the cross is expected to remain constructive.
EUR/JPY daily chart
UOB Group’s Senior Economist Julia Goh and Economist Loke Siew Ting comments on the updated economic outlook from the Bank Negara Malaysia (BNM).
Key Takeaways
“Bank Negara Malaysia (BNM) remains sanguine about the country’s economic outlook despite lingering downside risks. BNM projects real GDP growth of 5.3%-6.3% for 2022 (vs UOB est: 5.5%; 2021: 3.1%), trimming from earlier Ministry of Finance (MOF)’s projection of 5.5%-6.5%. Domestic demand is expected to be the main anchor of growth as the economy continues to normalise with the reopening of borders, full upliftment of restrictions, and higher investments. Key risks include COVID-19, geopolitical conflicts, and cost pressures.”
“Headline inflation is expected at 2.2%-3.2% in 2022 (vs MOF’s previous estimate of 2.1%; UOB est: 3.0%; 2021: 2.5%) while core inflation is projected at 2.0%-3.0% (UOB est: 2.0%; 2021: 0.7%) amid higher cost pressures, stronger demand, and base effects. Higher inflation pressures are contained with spare capacity in the labour market and price control measures. The unemployment rate is projected to ease further to average ~4.0% in 2022 (vs UOB est: 3.9%; 2021: 4.6%).”
“We noted a less neutral to hawkish tilt as BNM highlighted that the “degree of monetary accommodativeness should be consistent with the improving economic recovery” and “potential policy adjustments would be gradual and measured.” We maintain our view for the OPR to be raised twice this year (+25bps in 2Q22 and +25bps in 3Q22), bringing it to 2.25% by end-2022. The next monetary policy decision is on 11 May and Malaysia’s 1Q22 GDP will be released on 13 May.”
Economist at UOB Group Ho Woei Chen, CFA, assesses the latest PMI figures in the Chinese economy.
Key Takeaways
“China’s official manufacturing and non-manufacturing Purchasing Manager’s Indexes (PMIs) contracted in Mar. This is the first time both were in contraction at the same time since two years ago in Feb 2020 as China battles its worst pandemic outbreak since Wuhan in early-2020.”
“The non-manufacturing PMI slumped 3.2 points to 48.4 in Mar from 51.6 in Feb, the lowest reading since Sep 2021. In comparison, the impact of the pandemic lockdowns on manufacturing activities was more contained as the PMI dropped by a smaller 0.7 point to 49.5 in Mar from 50.2 in Feb.”
“Input prices increased for both manufacturing and non-manufacturing as cost pressures rose on the back of COVID-19 disruptions and higher global commodity prices.”
“The combination of weaker production/ consumption and higher cost pressures has increased downside risks to China’s outlook this year. Our forecast for China’s GDP growth is at 4.9% this year with 1Q22 GDP likely at around 4.5% y/y (4Q21: 4.0%).”
- EUR/USD remains on the defensive near 1.1050.
- EMU Flash CPI surprised to the upside in March.
- Markets’ attention now shifts to US Payrolls.
The selling bias still prevails around the European currency, with EUR/USD hovering around 1.1050 at the end of the week.
EUR/USD weaker on USD recovery, looks to NFP
EUR/USD extends the bearish note in the second half of the week on the back of the resumption of the demand for the greenback and unabated jitters surrounding the war in Ukraine.
Indeed, the bid bias in the dollar has been recently reignited following another failed attempt to advance on a negotiated solution to the Russia-Ukraine conflict, which has in turn forced spot to abandon the area of tops in the 1.1180/85 band (March 31).
The move lower in the pair comes in tandem with the continuation of the decline in the German 10y bund yields, down for the second straight session around the 0.57% area.
In the domestic docket, flash figures showed the CPI in the broader Euroland is expected to have risen 7.5% in the year to March and 3.0% when it comes to the Core CPI. Earlier in the session, the final Manufacturing PMI came at 56.9 and 56.5 in Germany and the EMU, respectively, for the month of March.
In the NA calendar, all the attention will be on the publication of the Nonfarm Payrolls for the month of March along with the Unemployment Rate and the ISM Manufacturing.
What to look for around EUR
EUR/USD extends recent losses and retests the 1.1050 zone in response to further improvement in the mood around the buck. As usual, pockets of strength in the single currency should appear reinforced by the speculation of the start of the hiking cycle by the ECB at some point by year end, while higher German yields, elevated inflation, the decent pace of the economic recovery and auspicious results from key fundamentals in the region are also supportive of a rebound in the euro.
Key events in the euro area this week: Final EMU, Germany Manufacturing PMI, EMU Flash Inflation Rate (Friday).
Eminent issues on the back boiler: Asymmetric economic recovery post-pandemic in the euro area. Speculation of ECB tightening/tapering later in the year. Presidential elections in France in April. Impact of the geopolitical conflict in Ukraine.
EUR/USD levels to watch
So far, spot is losing 0.17% at 1.1047 and faces the next up barrier at 1.1184 (weekly high March 31) followed by 1.1187 (55-day SMA) and finally 1.1243 (100-day SMA). On the other hand, a drop below 1.0944 (weekly low March 28) would target 1.0900 (weekly low March 14) en route to 1.0805 (2022 low March 7).
A Kremlin spokesperson said on Friday that Russia will not turn off gas supplies to Europe from April 1. "Payments on gas deliveries due after April 1 come in the second half of April and May," the spokesperson explained.
Additional takeaways
"Gazprom will closely work with its gas buyers."
"Russian President Vladimir Putin's order of gas payments in roubles is irreversible."
"Rouble is the most preferable and secure currency for us now."
"Germany's idea to nationalize Gazprom units would violate international law, such calls are unacceptable."
"Seeing a slew of illegal attempts to confiscate Russian property abroad."
"Observing such actions relating to international reserves."
"Attempts to nationalise Russian assets will bring nothing good."
Market reaction
The market mood remains relatively upbeat following these remarks and the Euro Stoxx 600 Index was last seen rising 0.6% on a daily basis.
- Gold edged lower on Friday and was weighed down by a combination of negative forces.
- Hawkish Fed expectations, rising US bond yields, stronger USD exerted some pressure.
- The uncertainty over Ukraine helped limit the downside ahead of the US jobs data (NFP).
Gold reversed an early European session dip to sub-$1,930 levels, though any meaningful recovery still seems elusive ahead of the US monthly jobs report. The incoming geopolitical headlines, so far, have failed to ease market worries about the possibility of a further escalation in the Russia-Ukraine conflict. In fact, Ukraine's President Volodymyr Zelensky warned that Russia is consolidating and preparing powerful strikes in the country's south, including besieged Mariupol. This, in turn, was seen as a key factor that extended some support to the safe-haven precious metal.
Investors, however, seemed optimistic about the possibility of a diplomatic solution to end the war ahead of the Russia-Ukraine peace talks, which are set to continue on Friday. This was evident from a generally positive tone around the equity markets. The risk-on impulse, along with hawkish Fed expectations, pushed the US Treasury bond yields higher and underpinned the US dollar. This might further cap the upside for the dollar-denominated gold, warranting some caution before positioning for an extension of this week's rebound from sub-$1,900 levels or the two-month low.
The markets seem convinced that the Fed would adopt a more aggressive policy stance and hike interest rates by 50 bps at the next two meetings to combat stubbornly high inflation. The bets were reaffirmed by Thursday's release of the US Core PCE Price Index, which rose to 5.4% YoY in February from the 5.2% previous. Despite the supporting factors, the USD bulls seemed reluctant and preferred to wait for the release of the closely-watched US monthly jobs data. The popularly known NFP report, due later during the early North American session and should provide a fresh impetus to gold prices.
The US economy is expected to have added 490K jobs in March, down from 678K in the previous month. Meanwhile, the unemployment rate is anticipated to edge lower to 3.7% from 3.8% in February. Nevertheless, the data would influence the Fed's policy outlook and drive the USD demand. This, along with fresh developments surrounding the Russia-Ukraine saga, will assist investors to determine the next leg of a directional move for gold.
Technical outlook
From a technical perspective, the commodity's inability to gain any meaningful traction and find acceptance above the 100-period SMA on the 4-hour chart favour bearish traders. That said, repeated failures to find acceptance below the $1,900 mark make it prudent to wait for some follow-through selling before confirming the negative outlook. In the meantime, the $1,914 area could act as immediate support ahead of the $1,895-$1,890 region. A convincing break through the latter would set the stage for a slide towards the next relevant support near the $1,872-$1.870 region.
On the flip side, the overnight high, around the $1.950 area should cap the immediate upside. Sustained strength beyond might trigger a short-covering move and push gold prices to an intermediate hurdle near the $1,964-$1.966 zone. The momentum could further get extended towards the next relevant barrier, around the $1,985-$1,988 region, above which bulls might aim to reclaim the key $2,000 psychological mark.
Gold 4-hour chart
-637844030549555181.png)
Key levels to watch
- USD/CHF regained traction on Friday and built on the overnight bounce from sub-0.9200 levels.
- The risk-on impulse undermined the safe-haven CHF and extended support amid a stronger USD.
- Hawkish Fed expectations, rising US bond yields benefitted the buck ahead of the US jobs report.
The USD/CHF pair held on to its modest intraday gains through the first half of the European session and was last seen trading near the daily high, just below the mid-0.9200s.
A combination of supporting factors assisted the USD/CHF pair to attract some buying on the last day of the week and built on the overnight bounce from sub-0.9200 levels, or a near four-week low. A generally positive risk tone undermined the safe-haven Swiss franc and acted as a tailwind amid some follow-through US dollar buying interest.
Despite growing uncertainty over Ukraine, investors turned optimistic about a possible breakthrough in the Russia-Ukraine peace negotiations. This was evident from a goodish rebound in the equity markets. This, along with hawkish Fed expectations, triggered a fresh leg up in the US Treasury bond yields and benefitted the greenback.
In fact, the markets seem convinced that the Fed would adopt a more aggressive policy stance and hike interest rates by 100 bps over the next two policy meetings to combat stubbornly high inflation. The bets were reaffirmed by Thursday's release of the US Core PCE Price Index, which rose to 5.4% YoY in February from the 5.2% previous.
From a technical perspective, bulls showed some resilience below the very important 200-day SMA. Hence, Friday's uptick could further be attributed to some technical buying. It, however, remains to be seen if the USD/CHF pair is able to capitalize on the move as the focus remains glued to the release of the closely-watched US monthly jobs data.
The popularly known NFP report, due later during the early North American session, will influence market expectations about the Fed's next policy move. This, in turn, will drive the USD demand in the near term. Apart from this, fresh developments surrounding the Russia-Ukraine saga should provide some meaningful impetus to the USD/CHF pair.
Technical levels to watch
The annualized Eurozone Harmonised Index of Consumer Prices (HICP) surged by 7.5% in March, coming in much higher than the previous reading of 5.9%, the latest data published by Eurostat showed on Friday. The consensus forecast was for a hotter reading of 6.6%.
The core figures arrived at 3.0% YoY in March when compared to 3.1% expectations and 2.7% booked in February.
The Euro area figures are reported a couple of days after Germany’s annual inflation for March rose way past expectations of 6.7%, arriving at 7.6% following a 5.5% increase reported in February.
The bloc’s HICP figures hold significance, as it helps investor assess the chances that the European Central Bank (ECB) might signal a faster than expected path for policy tightening.
Key details (via Eurostat)
“Looking at the main components of euro area inflation, energy is expected to have the highest annual rate in March (44.7%, compared with 32.0% in February), followed by food, alcohol & tobacco (5.0%, compared with 4.2% in February), non-energy industrial goods (3.4%, compared with 3.1% in February) and services (2.7%, compared with 2.5% in February).”
EUR/USD reaction
EUR/USD failed to show any reaction to the big jump in the Eurozone inflation figures. The spot is losing 0.07% on the day, currently trading at 1.1058.
The first quarter saw gold gain by nearly 6%. Market participants will be focusing on no fewer than two important events today, EU inflation figures and US labour market data. The first could lift the price of gold in euros while the second is unlikely to impact XAU/USD, economists at Commerzbank report.
Hot EU inflation data to lift gold in euros
“The Eurozone inflation rate for March will be published. The Bloomberg consensus of +6.7% is likely to prove considerably too low. Our economists anticipate a rise of 7.7%. This will further increase the pressure on the ECB to take steps to ensure price stability. Gold in euros could therefore rise in response to the data.”
“The Bloomberg consensus expects an increase of nearly 500K jobs, which would mean that the US labour market is continuing to run hot. The Fed is likely to see this as confirmation of the need to raise interest rates to a greater extent at its upcoming meetings. Since the market’s rate hike expectations have already picked up in recent weeks, however, we do not expect the labour market data to have any major impact on the gold price.”
See – NFP Preview: Forecasts from 10 major banks, another large gain for employment anticipated
UOB Group’s FX Strategists noted the selling pressure in USD/CNH should alleviate once the pair clears 6.3750.
Key Quotes
24-hour view: “We expected USD to weaken yesterday but we were of the view that ‘any weakness is expected to encounter solid support at 6.3530’. The anticipated weakness exceeded our expectations as USD dropped to 6.3452 before rebounding strongly. Downward pressure has eased with the rebound and USD has likely moved into a consolidation phase. In other words, USD is likely to trade sideways for today, expected to be between 6.3480 and 6.3650.”
Next 1-3 weeks: “Yesterday (31 Mar, spot at 6.3590), we highlighted that USD is likely to trade with a downward bias towards 6.3530, possibly 6.3450. Our view for a weaker USD turned out to be correct but we did not expect the subsequent sharp and swift drop to 6.3452. A break of 6.3450 would not be surprising but oversold shorter-term conditions could lead to 1-2 days of consolidation first. Overall, only a breach of 6.3730 (‘strong resistance’ level was at 6.3770 yesterday) would indicate that the current downward pressure has eased. Looking ahead, the next support below 6.36450 is at 6.3350.”
- The index adds to Thursday’s gains north of 98.00.
- US yields regain upside traction as bonds selloff resumes.
- US Nonfarm Payrolls, ISM Manufacturing PMI next of note.
The greenback, in terms of the US Dollar Index (DXY), extends the rebound to the 98.60 region, where some initial resistance seems to have turned up so far on Friday.
US Dollar Index looks to NFO, Ukraine
The index adds to the recent advance further north of the 98.00 hurdle at the end of the week amidst the resumption of the selloff in the debt market and lack of news from the geopolitical scenario.
Indeed, US yields regain the upside momentum across the curve following the recent knee-jerk against the backdrop of further selling pressure in global bond markets.
Furthermore, additional wings for the buck came in response to the lack of any progress in the Russia-Ukraine peace talks so far, despite both parties pledged to continue the negotiations in the next few days.
Very interesting day in the US docket, as Nonfarm Payrolls will take centre stage along with the Unemployment Rate, the ISM Manufacturing and Construction Spending, all for the month of March.
What to look for around USD
The index extends the bounce to the area well north of the 98.00 hurdle at the end of the week. In the meantime, very near-term price action in the greenback continues to be dictated by geopolitics, while the case for a stronger dollar in the medium/long term remains well propped up by the current elevated inflation narrative, a potential more aggressive tightening stance from the Fed, higher US yields and the solid performance of the US economy.
Key events in the US this week: Nonfarm Payrolls, Unemployment Rate, Final Manufacturing PMI, ISM Manufacturing PMI (Friday).
Eminent issues on the back boiler: Escalating geopolitical effervescence vs. Russia and China. Fed’s rate path this year. US-China trade conflict. Futures of Biden’s Build Back Better plan.
US Dollar Index relevant levels
Now, the index is up 0.13% 98 47 and a break above 99.36 (weekly high March 28) would open the door to 99.41 (2022 high March 7) and finally 100.00 (psychological level). On the flip side, the next down barrier emerges at 97.68 (weekly low March 30) seconded by 97.10 (55-day SMA) and then 96.62 (100-day SMA).
The UK manufacturing sector activity expanded less than expected in March, the final report from IHS Markit confirmed on Friday.
The seasonally adjusted IHS Markit/CIPS UK Manufacturing Purchasing Managers’ Index (PMI) was revised lower from 55.5 to 55.2 in March, beating expectations of 55.5.
Key points
New export orders contract for the second month running.
Inflationary pressures strengthen.
Rob Dobson, Director at S&P Global, commented on the survey
“March saw a marked growth slowdown in the UK manufacturing sector, with rates of expansion for production and new orders both easing and new export business suffering back-to-back declines. The slowdown in consumer goods output was especially marked.”
GBP/USD reaction
At the press time, GBP/USD is trading under pressure at around 1.3120, down 0.08% on the day.
GBP/USD has started to edge lower ahead of key US data. Further losses are likely with a drop below 1.31, FXStreet’s Eren Sengezer reports.
Sellers could take action in case cable drops below 1.31
“A risk-averse market environment is likely to cause GBP/USD to stay under bearish pressure and the US jobs report could further weigh on the pair. A positive shift in risk sentiment accompanied by an NFP-inspired dollar weakness could open the door for a rebound but this seems to be the less likely scenario.”
“1.31 (psychological level, Fibonacci 23.6% retracement of the latest downtrend) aligns as key support. With a daily close below that level, additional losses toward 1.3050 (static level) and 1.30 (psychological level, static level) could be witnessed.”
“On the upside, 1.3135 (100-period SMA) could be seen as interim resistance before 1.3160 (static level, Fibonacci 38.2% retracement, 50-period SMA) and 1.32 (psychological level, Fibonacci 50% retracement).”
See – NFP Preview: Forecasts from 10 major banks, another large gain for employment anticipated
- Modest USD strength prompted some intraday selling around NZD/USD on Friday.
- The risk-on impulse capped the safe-haven USD and extended support to the pair.
- Bulls managed to defend 200-day SMA as the focus remains on the US jobs report.
The NZD/USD pair reversed an intraday dip to a three-day low and was last seen trading in the neutral territory, around the 0.6930 region during the early European session.
The pair edged lower through the first half of the trading on Friday and moved further away from the YTD peak, around the 0.7000 psychological mark touched earlier this week. The downtick was sponsored by some follow-through buying around the US dollar, which drew some support from fading hopes for a diplomatic solution to end the war in Ukraine.
Apart from this, growing acceptance that the Fed would adopt a more aggressive policy stance and hike interest rates by 100 bps over the next two meetings to combat high inflation underpinned the buck. That said, a generally positive tone around the equity markets capped the safe-haven greenback and extended support to the perceived riskier kiwi.
Investors also seemed reluctant to place aggressive bets and preferred to wait on the sidelines ahead of the release of the closely-watched US monthly jobs data. This, in turn, assisted the NZD/USD pair to find some support near the technically significant 200-day SMA, warranting some caution before positioning for any meaningful corrective slide.
Nevertheless, the focus remains glued to the US NFP report, due later during the early North American session, which will play a key role in influencing the Fed's monetary policy outlook. This, along with developments surrounding the Russia-Ukraine saga, will drive the USD demand and produce some meaningful trading opportunities around the NZD/USD pair.
Technical levels to watch
EUR/USD lost more than 100 pips on Thursday and stays on the back foot near 1.1050. Economists at Bank of America sees scope for a bottom pattern in the making.
Since 1999 in April the euro had little seasonal tendency
"We continue to view the 1.08s as a place where the euro has a chance of bottoming or staging a larger bounce than most may anticipate.”
"Since 1999 in April the euro had little seasonal tendency, it was weaker in May 61% of the time and stronger in June 61% of the time."
- USD/CAD gained traction for the second straight day and was supported by a combination of factors.
- Declining crude oil prices underpinned the loonie and acted as a tailwind amid sustained USD buying.
- Investors now look forward to the US monthly jobs report (NFP) for some meaningful trading impetus.
The USD/CAD pair edged higher through the early European session and climbed back closer to the overnight swing high, around the 1.2525 region in the last hour.
A combination of factors assisted the USD/CAD pair to gain traction for the second successive day on Friday, with bulls now looking to build on this week's recovery from the YTD low. Crude oil prices added to the overnight losses and continued losing ground through the first half of the trading on the last day of the week. This, in turn, undermined the commodity-linked loonie and acted as a tailwind for the major amid some follow-through US dollar buying interest.
The White House on Thursday announced a plan to release 1 million barrels of oil per day from the US Strategic Petroleum Reserve (SPR) over the next six months. The International Energy Agency (IEA) will also meet later this Friday to discuss a further emergency oil release of around 60 million barrels. This, along with fears that fresh COVID-19 restrictions in China could impact fuel demand, exerted downward pressure on oil prices and weighed on the Canadian dollar.
On the other hand, fading hopes for a de-escalation in the Ukraine war drove some haven flows towards the greenback, which was further supported by hawkish Fed expectations. In fact, the markets seem convinced that the Fed would adopt a more aggressive policy stance and hike interest rate by 100 bps over the next two policy meetings to combat stubbornly high inflation. The bets were reaffirmed by Thursday's release of the US Core PCE Price Index, which rose to 5.4% YoY in February.
The fundamental backdrop seems tilted in favour of bullish traders and supports prospects for a further near-term appreciating move for the USD/CAD pair. That said, investors might refrain from placing aggressive bets and prefer to wait on the sidelines ahead of the closely-watched US monthly jobs data. The popularly known NFP report is due for release later during the early North American session and will play a key role in driving the near-term USD price dynamics.
Apart from this, traders will take cues from fresh developments surrounding the Russia-Ukraine saga, which might influence crude oil prices. This, in turn, should provide some meaningful impetus to the USD/CAD pair and allow traders to grab short-term opportunities on the last day of the week.
Technical levels to watch
EUR/GBP has been trading above the 0.84 level. Economists at ING expect the pound to regain some ground, dragging the EUR/GBP pair below the 0.83 mark.
Starting to recover
“The pound did not follow other European currencies higher in the rally induced by peace-talk optimism, and is now suffering very little from market doubts about an imminent de-escalation in the conflict.”
“The EUR/GBP downtrend may continue in the coming days, and we think a return to 0.83 remains likely in the near-term.”
Markets jumped back on long dollar positions yesterday as global risk sentiment deteriorated and equities came under pressure. Together with continued peace talks today, markets will focus on US March payrolls. The release should help markets cement expectations around two 50bp hikes in May and June, which could further support the dollar, economists at ING report.
Payrolls to support back-to-back 50bp Fed hikes
“The dollar, yen and Swiss franc are heading into the weekend with a tailwind, which will however be challenged by more peace talks between Russia and Ukraine today. Even if some fresh optimistic headlines dampen safe-haven demand, we think the dollar is the least likely to lose ground today, as US payrolls may offer some support.”
“We expect a 500K headline NFP reading today, in line with the consensus at 490K. This should be enough to help markets cement expectations around two 50bp rate hikes in May and June, which is also our base-case scenario. This, in turn, may leave the dollar more protected in the event of a rebound in risk appetite.”
See – NFP Preview: Forecasts from 10 major banks, another large gain for employment anticipated
Much of the CAD upside has come over recent sessions with USD/CAD losing ground during 14 of the last 16 trading days. Economists at Rabobank expect the pair to edge lower towards 1.24 over the next quarter.
Room for USD/CAD to rise back above 1.26 in the second half of 2022
“We have revised our USD/CAD forecasts down to 1.25 on a one-month basis and 1.24 in three months' time. This reflects a trifecta of factors. First, the aggressive repricing of the front-end of the curve. Second, there is the likely persistence of higher oil prices, which we expect to return to 125. And third, there is the potential for CAD to play catch-up on the crosses.”
“We must highlight a significant risk to the short-term lower USD/CAD call: namely, the potential for safe-haven flows driving USD higher. Further out, we see room for USD/CAD to rise back above 1.26 and we remain constructive of USD in general.”
The US Bureau of Labor Statistics (BLS) will release the March jobs report on Friday, April 1 at 12:30 GMT and as we get closer to the release time, here are the forecasts by the economists and researchers of 10 major banks regarding the upcoming employment data.
Economists expect an increase of 490K positions in March, down from the impressive 678K recorded in February, but similar to 481K in January.
Commerzbank
“In recent months, 500 to 700 thousand new jobs have been created on a regular basis. We expect a similar result for March (forecast 500K). High-frequency data on the number of restaurant diners and airline passengers, for example, point to a noticeable increase in jobs especially in the service sector, which is benefiting from the subsiding of the omicron wave. Accordingly, the labor market is tightening. We forecast a further decline in the unemployment rate to 3.7%. Already at last count, the 6 million unemployed could choose between 11 million unfilled jobs – a ratio that Federal Reserve Chairman Powell recently called ‘unhealthy’. The March employment report is thus likely to reinforce his inflation concerns.”
Westpac
“The US economy continues to produce jobs at a rapid rate, the average monthly gain over the past six months coming in circa 580K. In March, we expect a similar result of 500K. For now, it seems that risks remain to the upside, with participation’s intermittent move higher allowing labour supply to more fully meet demand. As a result, while in March we expect an unchanged participation rate, even if it does lift, the unemployment rate is still likely to move lower to 3.7%. Hourly earnings have surprised to the downside the past two months and so are due for a robust gain in March. Still, real wages growth will continue to decline.”
Nordea
“We expect solid job gains in Nonfarm Payrolls, around 350K, which should have JOLTs tickle down. Labour conditions continue to be extremely hot – to an unhealthy level as Chair Powell put it. The big picture is that the secular fall seems to have accelerated under the pandemic. Total US employment figures are 0.6m below the pre-covid level and 3.5m below the implied trend. So while the unemployment rate is at a historically low level it is flattered by a depressed participation rate.”
ING
“We are forecasting a payrolls gain of 500K, but it could well be lower. Like supply chain strains, a lack of suitable workers is holding back growth potential and putting up costs as wages get bid higher in a red hot jobs market. Consequently, we expect the details of the release to support our call of 50bp of hikes at both the May and June policy meetings.”
Danske Bank
“We look for a decent report with jobs growth around 450K, but the unemployment rate and wage growth will also be in focus to gauge underlying inflation pressures.”
TDS
“Employment likely continued to advance in March following two strong reports averaging +580k in Jan and Feb. That said, we expect some of that boost to fizzle, though to a still firm job growth pace of 350K. Indeed, job gains should lead to a new drop in the unemployment rate to a post-COVID low of 3.7%. We also expect wage growth to slow to a still firm 0.3% MoM pace.”
NBF
“Payrolls may have increased 450K in the third month of the year. The household survey is expected to show a similar gain, a development which could lead to a one-tick decrease of the unemployment rate to 3.7%.”
CIBC
“Employers likely added 490K to headcounts, with gains being concentrated in private services that were adversely impacted by the pandemic. Higher wages were likely on offer in an attempt to overcome the ongoing labor shortage, but with hiring likely skewed towards lower-paying positions within already lower value-added sectors, aggregate wages could have shown an only moderate 0.3% advance. We’re close enough to the consensus forecast to imply little market impact. Another strong month of hiring would add to the urgency for further Fed tightening, with a 50bps hike likely in store at the next FOMC.”
Citibank
“US March Nonfarm Payrolls – Citi: 490K, prior: 678K; Average Hourly Earnings YoY – Citi: 5.3%, prior: 5.1%; Unemployment Rate – Citi: 3.7%, prior: 3.8%. the trend of monthly payrolls growth over the last 9 months has been steady within a ~450K-650K range and we expect another increase consistent with this pace in March. Meanwhile, we expect a somewhat modest increase of 0.3% MoM in average hourly earnings in March given the bounce-back in total hours worked following reduced worker absences but the US unemployment rate should fall to 3.7% in March based on a similar pattern in the household survey of employment as last month.”
Deutsche Bank
“We expect NFP to increase by 400K, bringing the unemployment rate to a post-pandemic low of 3.7%.”
Here is what you need to know on Friday, April 1:
The negative shift witnessed in risk sentiment amid escalating geopolitical tensions helped the greenback gather strength against its rivals on Thursday. The US Dollar Index continues to push higher early Friday as focus shifts to inflation data from the euro area and the US March jobs report. The US economic docket will also feature the ISM's Manufacturing PMI survey. Market participants will continue to keep a close eye on developments surrounding the Russia-Ukraine conflict ahead of the weekend.
Nonfarm Payrolls March Preview: How long can plentiful jobs defray the dangers of inflation?
Russian President Vladimir Putin announced on Thursday that buyers of Russian gas "must open rouble accounts in Russian banks" to execute purchases from April 1. "If such payments are not made, we will consider this a default on the part of buyers, with all the ensuing consequences," warned Putin in a televised speech. Following this development, Russia's foreign ministry said that they will respond if the European Union were to impose sanctions.
In the meantime, the US announced late Thursday that they have decided to impose additional sanctions targeting the Russian technology sector. Wall Street's three main indexes lost more than 1% on Thursday but US stock index futures are trading flat early Friday.
Crude oil prices fell sharply on Thursday following the OPEC meeting and the US' decision to release strategic oil reserves to ease pressures on energy prices. Later in the day, the International Energy Agency (IEA) will hold an emergency meeting to discuss a possible release of its strategic reserves. The barrel of West Texas Intermediate (WTI), which fell nearly 6% on Thursday, was last seen losing nearly 2% on the day at $99.20.
OPEC+ agrees on 432K BPD output quota hike in May as expected, next meeting to be held on May 5.
EUR/USD lost more than 100 pips on Thursday and stays on the back foot near 1.1050 early Friday. Inflation in the euro area, as measured by the Harmonised Index of Consumer Prices (HICP) is expected to rise to 6.6% on a yearly basis in March from 5.9% in February.
GBP/USD closed virtually unchanged on Thursday and continues to move sideways above 1.3100 in the European morning.
Gold advanced toward $1,950 on Thursday but erased a large portion of its daily gains before closing below $1,940. XAU/USD stays under modest bearish pressure on Friday with the benchmark 10-year US Treasury bond yield staging a rebound following a three-day drop.
US March Nonfarm Payrolls Preview: Analyzing gold's reaction to NFP surprises.
USD/JPY reversed its direction and rose toward 122.50 on Friday after closing the previous three days deep in negative territory.
Bitcoin fell sharply amid risk aversion on Thursday and extended its slide early Friday. BTC/USD was last seen losing more than 1% on the day below $45,000. Ethereum lost 3% on Thursday and continues to edge lower toward $3,200.
The kiwi rally failed to break 0.70 and is lower near the 0.69 level. Economists at ANZ Bank believe that the NZD/USD could resume its advance as the dollar weakens early in the hiking cycle.
Crosscurrents remain, and much depends on how the USD fares
“There remain significant crosscurrents – Omicron doesn’t seem to be as disruptive as feared, interest rates are high but other countries are catching up, commodity prices are high but not extending, the dollar is fading but EUR and JPY weakness complicate the picture.”
“There seems little NZ-specific to drive further strength, but if the USD does weaken, as it typically does early in the hiking cycle, more NZD upside is possible.”
“Support 0.6540/0.6715 – Resistance 0.6995/0.7105/0.7225.”
- GBP/USD oscillated in a narrow trading band for the second successive day on Friday.
- Hawkish Fed expectations underpinned the USD and capped the upside for the major.
- Investors, however, preferred to wait on the sidelines ahead of the key US jobs report.
The GBP/USD pair lacked any firm directional bias and seesawed between tepid gains/minor losses, below the mid-1.3100s through the early European session.
The pair, so far, has struggled to capitalize on this week's goodish rebound from mid-1.3000s and extended its sideways/consolidative price move for the second successive day on Friday. The British pound drew some support from Thursday's better-than-expected release of the final UK GPD print, which showed that the economy expanded by 1.3% in Q4 2021 as against the 1.0% estimated. That said, the Bank of England's sofer tone over the need for further interest rate hikes, along with a broad-based US dollar strength, kept a lid on any meaningful gains for the GBP/USD pair.
In fact, the USD built on the previous day's solid rebound from a nearly two-week low and drew some support from fading hopes for a de-escalation in the Ukraine war. Apart from this, expectations that the Fed would adopt a more aggressive policy stance to combat stubbornly high inflation acted as a tailwind for the buck. In fact, the markets have been pricing in an almost 100 bps rate hike over the next two policy meetings and the bets were reinforced by the US Core PCE Price Index released the previous day, which rose to 5.4% YoY in February from the 5.2% previous.
The fundamental backdrop seems tilted in favour of the USD bulls, though investors seemed reluctant to place aggressive bets and preferred to wait on the sidelines ahead of the US monthly jobs data. The popularly known NFP report, due for release later during the early North American session, will influence the Fed's monetary policy outlook. Apart from this, developments surrounding the Russia-Ukraine saga will drive the USD and provide a fresh impetus to the GBP/USD pair.
Technical levels to watch
The USD/JPY pair is scaling sharply higher after a correction near 121.30. Economists at TD Securities see 120 as a floor for the time being and forecast a return to 125 in the second quarter.
A weak sided bet
“We see a real risk of too low a terminal rate, and ultimately, this will leave USD/JPY strategically exposed to the topside until the end of the Fed tightening begins to take shape or the BoJ magically decides to follow suit. At the very minimum, we think it introduces a 120 floor until we pass through the acute phase of Fed tightening. The earliest we see this happening is sometime in Q3. But for now, USD/JPY dips should be faded.”
“A return to 125 remains the anchor point, but an even more aggressive Fed could easily push the pair further above.”
Measured since the start of the war in Ukraine, the AUD is the best performing G10 currency. Economists at Rabobank expect the AUD/USD pair to hit the 0.75 level sooner than expected fueled by robust energy prices.
Higher prices for alternative energy sources to support the aussie
“Even in the best case scenario of a peace deal for Ukraine, it is likely that Europe will continue to strive for more energy independence from Russia. This suggests higher prices for alternative energy sources for some time, which is likely to maintain support for currencies such as the AUD.”
“There are questions about how much additional LNG Australia could supply to Europe without breaking existing contracts or running the risk of a gas shortage on its own east coast. Irrespective, Australia remains the world second-largest exporter of coal.”
“We have brought forward our six-month 0.75 AUD/USD forecast to a three-month view and expect a move towards 0.76 in six-months.”
EUR/USD has pivoted around the 1.10 area since early March. Despite the relatively upbeat mood of the euro, risks remain. Consequently, economists at Rabobank expect the pair to move downward to 1.08 over next month.
Concrete signs of peace can likely shift EUR/USD range to 1.10 to 1.12
“We maintain that the value of EUR/USD is set to remain lower this year than it would have been without the conflict and energy uncertainties, and we retain a one-month forecast of 1.08 to reflect the continued risks to the eurozone economy. That said, if the market remains confident that eurozone can avoid recession, it is likely that the EUR can hold a 1.09 to 1.11 range in the coming months.”
“More concrete signs of peace can likely shift that range to 1.10 to 1.12.”
USD/JPY is now expected to keep the range bound theme between 121.00 and 124.00 in the next weeks, noted FX Strategists at UOB Group.
Key Quotes
24-hour view: “Our expectations for USD to ‘move higher to 123.30’ yesterday were incorrect as it dropped to 121.26 before rebounding. The current price actions appear to be part of a broad consolidation and USD is likely to trade between 121.30 and 122.60 for today.”
Next 1-3 weeks: “Two days ago (30 Mar, spot at 122.80), we highlighted that the recent USD rally has come to an end and we expect USD to consolidate and trade between 121.00 and 124.50. There is no change in our view even though a 121.00/124.00 range is likely enough to contain the movement in USD, at least for these few days. Looking ahead, a clear break of 121.00 would indicate that USD could pullback in a sustained manner.”
- Chinese indices are outperforming despite a downbeat Caixin Manufacturing PMI.
- Falling oil prices are likely to support the oil-importing nations going forward.
- The spotlight will remain on US NFP, which will be released in the early American session.
Markets in the Asian domain are reflecting a mixed response on Friday as Japan’s Nikkie225 and Hang Sang are showing rough responses while Chinese markets and Indian bourses are attracting bids.
At the press time, Japan’s Nikkie225 sheds 0.50%, Hang Seng eases 1%, while India’s Nifty50 jumps 0.50% and ChinaA50 spikes 1.80%.
Chinese markets are outperforming in the Asian region despite the downbeat Caixin Manufacturing Purchase Managers Index (PMI) figures. The IHS Markit has reported the Caixin Manufacturing PMI at 48.1 much lower than the market consensus of 49.7 and the previous figure of 50.4. It seems that the Chinese markets have already discounted the plunge in the economic data and are following a ‘buy on rumor and sell on news’ indicator.
Oil prices nosedived more than 6% on Thursday after US President Joe Biden announced a release of one million barrels per day for six months out of their Strategic Petroleum Reserve (SPR) from May. The announcement of 180 million barrels of oil release by the SPR is going to bring some price stability in the oil market and henceforth a relief for the commodity importing countries.
Going forward, the spotlight will remain on the US Nonfarm Payrolls (NFP), which will be released on Friday. The market estimates of 490k against the earlier print of 678k is indicating an underperformance on the payrolls front, which may also affect the likely monetary policy action from the Federal Reserve (Fed). Meanwhile, CME Group's FedWatch tool is showing 71% odds of a half-point rate increase by the Fed.
Considering preliminary reading from CME Group for natural gas futures markets, traders added around 12.4K contracts to their open interest positions on Thursday, reaching the third consecutive daily advance. In the same line, volume went up for the second straight day, now by around 119.1K contracts.
Natural Gas poised for extra advances
Prices of natural gas clinched new 2022 highs past $5.80 per MMBtu on Thursday. The uptick was in tandem with increasing open interest and volume, adding to the prospect for the continuation of the uptrend in the very near term.
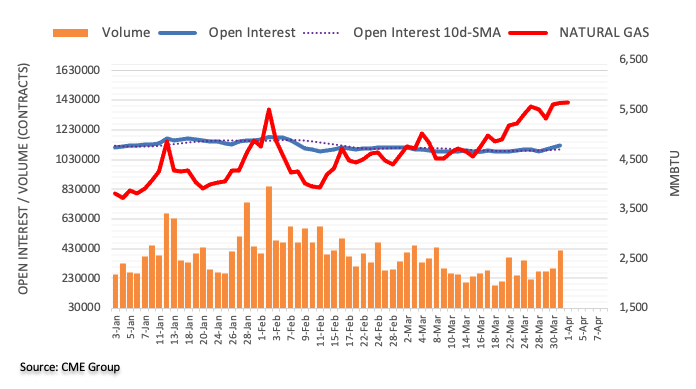
Heading into the NFP showdown this Friday, gold price is lacking a clear directional bias. The next price direction in gold totally depends on the outcome of the US payrolls and to some extent the peace talks, FXStreet’s Dhwani Mehta reports.
All eyes remain on the US NFP and Russia-Ukraine peace talks for fresh cues
“Markets await the Russia-Ukraine online peace talks for some clarity on the ongoing saga. The US NFP, however, will emerge as the main market drive for gold, as it will offer fresh insights on the Fed’s next interest rate move.”
“Gold bulls need acceptance above the horizontal 21-Daily Moving Average (DMA) at $1,953 is critical to extending this week’s uptrend. Meanwhile, the ascending 50-DMA at $1,898 will emerge as powerful support if bears fight back control.”
“On the upside, the previous year’s high at $1,960 will be the level to beat for bulls should 21-DMA resistance cave in. Alternatively, the February 24 low of $1,878 could come to the rescue of gold optimists on a firm break below the 50-DMA.”
In opinion of FX Strategists at UOB Group, AUD/USD needs to clear the 0.7520 level to allow for the continuation of the uptrend in the near term.
Key Quotes
24-hour view: “We expected AUD to ‘trade sideways between 0.7480 and 0.7530’ yesterday. However, AUD dipped to 0.7471 before rebounding to close on a soft note at 0.7485 (-0.34%). Downward momentum has improved a tad and AUD is likely to edge lower. That said, the strong support at 0.7440 is unlikely to come under threat (there is another support at 0.7460). Resistance is at 0.7505 followed by 0.7520.”
Next 1-3 weeks: “We have held a positive view in AUD for two weeks now. As AUD struggles to extend its gains, in our latest narrative from three days ago (29 Mar, spot at 0.7500), we highlighted that ‘upward momentum is waning but only a breach of 0.7440 would indicate that AUD strength has run its course’. AUD traded sideways the past couple of days and upward momentum has waned further. From here, AUD has to close above 0.7520 within these 1-2 days or the chance for further AUD strength would diminish quickly.”
FX option expiries for April 1 NY cut at 10:00 Eastern Time, via DTCC, can be found below.
- EUR/USD: EUR amounts
- 1.0975 430m
- 1.1000 366m
- 1.1085 318m
- 1.1100 748m
- 1.1110 341m
- USD/JPY: USD amounts
- 120.00 575m
- 121.50 1.2b
- AUD/USD: AUD amounts
- 0.7460 601m
- 0.7525 578m
- 0.7550 595m
- 0.7600 555m
- USD/CAD: USD amounts
- 1.2480 275m
- 1.2500 298m
- 1.2635 301m
- 1.2680 337m
Open interest in crude oil futures markets dropped for the second session in a row on Thursday, now by around 8.3K contracts according to advanced prints from CME Group. Volume followed suit and rose sharply by around 553.1K contracts, the largest drop since March 1.
WTI could still retest $95.00 and below
Thursday’s noticeable pullback in prices of the WTI was on the back of rising open interest and volume, leaving the door open to further retracement in the very near term. Against that, the commodity could attempt a move to the monthly low near $93.50 (March 15).
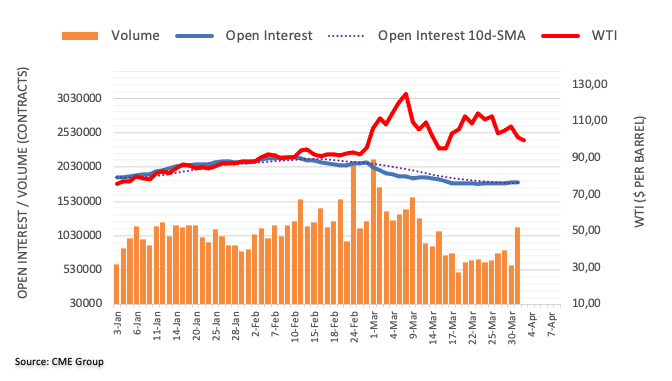
Cable entered a consolidative phase and is expected to trade within the 1.3050-1.3250 range in the next weeks, suggested FX Strategists at UOB Group.
Key Quotes
24-hour view: “Our expectations for GBP to ‘test the resistance at 1.3195’ yesterday did not materialize as it traded between 1.3107 and 1.3176 before closing little changed at 1.3145 (+0.06%). Momentum is ‘flattish’ and GBP is likely to trade sideways for today, expected to be within a range of 1.3110/1.3185.”
Next 1-3 weeks: “There is not much to add to our update from yesterday (31 Mar, spot at 1.3140). As highlighted, GBP is likely to trade between 1.3050 and 1.3250 for now.”
- Elongated consolidation near a five-month high is indicating an inventory adjustment.
- Flat 20 and 50-period EMAs are signaling a lackluster move.
- Aussie bulls can take control if the asset oversteps 0.7540.
The AUD/USD pair is witnessing an escalated consolidation after printing a yearly high at 0.7540. Aussie bulls seem to fail to sustain above 0.7500 and have displayed multiple failed attempts on breaching the yearly highs.
On a four-hour scale, AUD/USD is oscillating in a range of 0.7460-0.7540 from the last week. Usually, an elongated oscillation after a firmer rally indicates an inventory adjustment in which the institutional investors shift their inventory to the retail participants.
The 20 and 50-period Exponential Moving Averages (EMAs) at 0.7495 and 0.7475 have turned horizontal, which signals a consolidation in the asset.
While the momentum oscillator, Relative Strength Index (RSI) (14) has shifted into a range of 40.00-60.00 from a bullish range of 60.00-80.00 indicating a lackluster move going forward. Also, the aussie bulls have lost their strength.
A slippage below March 29 low at 0.7455 will drag the asset towards March 10 high at 0.7369, followed by the round level support at 0.7300.
On the flip side, aussie bulls can dictate the price if the asset oversteps March 28 high at 0.7541, which will drive the pair towards the round level resistance at 0.7600, followed by the 17 June 2021 high at 0.7646.
AUD/USD four-hour chart
-637843874705432819.png)
CME Group’s flash data for gold futures markets noted open interest shrank by around 9.1K contracts on Thursday, reversing the previous daily build. Volume, instead, rose by around 9.3K contracts, partially eroding Wednesday’s sharp drop.
Gold remains capped near $1970
Thursday’s uptick in gold prices briefly tested the $1950 level amidst shrinking open interest, indicative that extra gains appear somewhat out of favour in the very near term. That said, occasional bullish attempts in the precious metal look so far limited around recent weekly peaks around the $1970 per ounce troy.
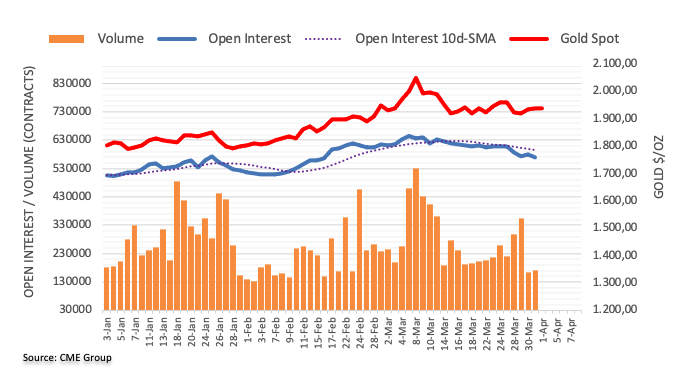
FX Strategists at UOB Group now see EUR/USD navigating within the 1.0990-1.1170 range for the time being.
Key Quotes
24-hour view: “We highlighted yesterday that the ‘advance in EUR could extend above 1.1190 first before easing’. EUR subsequently rose to 1.1184 before staging a surprisingly sharp decline (low has been 1.1059). While the rapid drop appears to be running ahead of itself, EUR could decline further to 1.1035. The major support at 1.0990 is unlikely to come under threat. On the upside, a breach of 1.1125 (minor resistance is at 1.1100) would indicate the current downward pressure has eased.”
Next 1-3 weeks: “Two days ago (30 Mar, spot at 1.1085) we highlighted that the risk for EUR has shifted to the upside. We added, a clear break of 1.1140 could lead to EUR strengthening to 1.1190. As EUR rose, we highlighted yesterday (31 Mar, spot at 1.1155) that ‘if EUR breaks 1.1190, the chance for further EUR strength to 1.1240 would increase’. EUR did not break 1.1190 as it rose to 1.1184 before falling sharply to a low of 1.1059. While our ‘strong support’ level at 1.1055 is not breached, upward momentum has more or less dissipated. EUR appears to have moved into a consolidation phase and is likely to trade between 1.0990 and 1.1170 for now.”
- USD/INR has jumped near 76.00 as oil prices took a plunge on higher supply.
- Biden’s 180 million barrel oil release announcement has hammered the oil prices.
- Investors will focus on US NFP as it will dictate the extent of the rate hike by the Fed.
The USD/INR pair has reclaimed 76.00 amid falling oil prices after US President Joe Biden announced a release of one million barrels per day for six months out of their Strategic Petroleum Reserve (SPR) from May. The move has brought a bloodbath in the oil market as oil prices have plunged more than 6% on Thursday.
India, being a major importer of oil is going to benefit from the falling oil prices going forward. To corner the soaring inflation, US President Joe Biden has urged US oil exploration companies to utilize their spare capacities and pump more oil, which will support price stability in the oil market. This is high time to think about the individuals and American families in place of the prolonged investors who have drawn sheer dividends earlier. It is the third event in the last six months when the US administration has announced an oil release from the SPR.
Meanwhile, the US dollar index (DXY) has witnessed an open-test drive session on Friday in which the initial downtick is violated decisively by the bulls. The DXY has been established above 98.00 amid uncertainty over the US Nonfarm Payrolls (NFP), which is due on Friday. A preliminary estimate shows NFP release at 490k against the previous figure of 678k. This will have a significant impact on the likely monetary policy decision by the Federal Reserve (Fed) in May.
- Gold price is testing bearish commitments ahead of the critical US NFP.
- The US dollar firms further as Treasury yields rebound. Peace talks also eyed.
- Gold Price Analysis: XAU/USD flirts with a key daily 61.8% golden ratio.
Gold price has kicked off a new quarter on a positive note, consolidating the recent recovery ahead of the all-important US Nonfarm Payrolls release. This week’s corrective pullback in the US Treasury yields across the curve has boded well for the non-yielding gold, as the bond rout took a breather. Looking forward, it remains to be seen if gold price can sustain the upside, as investors await the US jobs data, which will likely seal in a 50bps May Fed rate hike. Also, in focus remains the Russia-Ukraine online peace talks due later this Friday.
Read: US March Nonfarm Payrolls Preview: Analyzing gold's reaction to NFP surprises
Gold Price: Key levels to watch
The Technical Confluences Detector shows that gold price is testing the Fibonacci 38.2% one-day at $1,939, as it target the next upside target at $1,943 – the Fibonacci 23.6% one-day.
Gold bulls need to crack the $1,946, the Fibonacci 38.2% one-week, to accelerate the bullish moves towards $1,953. That level is the confluence of the Fibonacci 23.6% one-week, Bollinger Band one-day Middle and pivot point one-day R1.
The intersection of the previous year’s high and the Fibonacci 61.8% one-month at $1,960 will be the level to beat for gold buyers.
On the flip side, the immediate cushion is seen at $1,935, where the SMA5 one-day converges with the SMA200 four hour.
Acceptance below the latter will call for a test of the $1,931 demand area, the Fibonacci 61.8% one-week and one-day.
The next relevant downside cap is pegged at $1,925, which is the pivot point one-week S1.
Here is how it looks on the tool
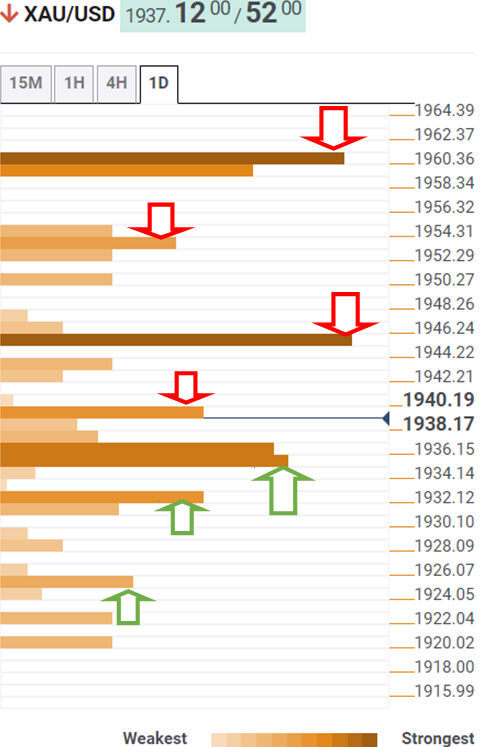
About Technical Confluences Detector
The TCD (Technical Confluences Detector) is a tool to locate and point out those price levels where there is a congestion of indicators, moving averages, Fibonacci levels, Pivot Points, etc. If you are a short-term trader, you will find entry points for counter-trend strategies and hunt a few points at a time. If you are a medium-to-long-term trader, this tool will allow you to know in advance the price levels where a medium-to-long-term trend may stop and rest, where to unwind positions, or where to increase your position size.
- USD/CAD holds in bearish territory ahead of the NFP data.
- The BoC will be in focus for the month of April.
USD/CAD is trading near flat on the day within the bearish territory on the daily chart, consolidating nearer-term ahead of the US session's Nonfarm Payrolls data.
Meanwhile, the Canadian dollar has steadied against its US counterpart while investors cheered Canada's potential combination of increased government spending and interest rate hikes. On the other hand, the price of oil has taken a nosedive this week on the back of US President Joe Biden launching the largest release ever from the US emergency oil reserve.
One of Canada's major exports, oil, has fallen nearly 9% lower to fall below $100 a barrel. The move has seen the loonie fall from its strongest intraday level in nearly five months at 1.2427. For March, it was up 1.5%, while it has advanced 1.2% since the start of the year.
Meanwhile, the Bank of Canada will be back in focus now that Canadian Prime Minister Justin Trudeau's surprise political deal this month could lead to an increase in spending that further fuels inflation. The Bank of Canada is expected to hike its key interest rate in half-percentage-point increments. The April 13 meeting is therefore in focus.
Meanwhile, the Nonfarm Payrolls is coming up. ''Employment likely continued to advance in March following two strong reports averaging +580k in Jan and Feb,'' analysts at TD Securities said. ''That said, we expect some of that boost to fizzle, though to a still firm job growth pace of +350k. Indeed, job gains should lead to a new drop in the unemployment rate to a post-COVID low of 3.7%. We also expect wage growth to slow to a still firm 0.3% MoM pace.''
- USD/JPY has attracted bids near 122.60 ahead of the US Nonfarm Payrolls.
- Rising odds of a 50 bps rate hike by the Fed are strengthening the DXY.
- BOJ’s officials are cautious over rising commodity prices.
The USD/JPY pair is scaling sharply higher after a correction near 121.30 as the Bank of Japan (BOJ) has shown fears over the rising commodity prices. The elevated prices of base metals, food items, and energy amid Russia’s invasion of Ukraine have made a devastating impact on the Japanese yen. Japan, being a major importer of commodities is facing a serious threat of a wider fiscal deficit.
The impact of rising commodity prices has been reflected on the yen in the past trading sessions. The asset has gained almost 8% in March. Mitsuhiro Furusawa, who was the head of currency intervention at Japan's Ministry of Finance, has shown worries over the vulnerable yen citing that it is not good for the yen to keep dropping as it reflects Japan's competitiveness.
Also, the bids on the yen have been faded after the wrap-up of the bond-buying program. The aggressive buying of Japanese Government Bonds (JGBs) to cap the yields at 25 basis points concluded on Thursday.
Meanwhile, the US dollar index (DXY) has climbed near 98.50 on rising odds of a 50 basis point (bps) interest rate hike by the Federal Reserve (Fed). CME Group's FedWatch tool is showing 71% odds of a half-point rate increase. Adding to that, uncertainty over the release of US Nonfarm Payrolls on Friday is improving the demand for the greenback.
- EUR/USD bears are moving in in the 50% mean reversion.
- A 61.8% Fibo ratio is eyed that has a confluence with the neckline of the W-formation.
EUR/USD is flat on the session so far as economic uncertainties from the Federal Reserve's tightening monetary policy and Russia's intervention in Ukraine keeps the US dollar underpinned. This is leaving a bearish prospect on the chats for the euro which is illustrated in the following chart.
EUR/USD daily chart
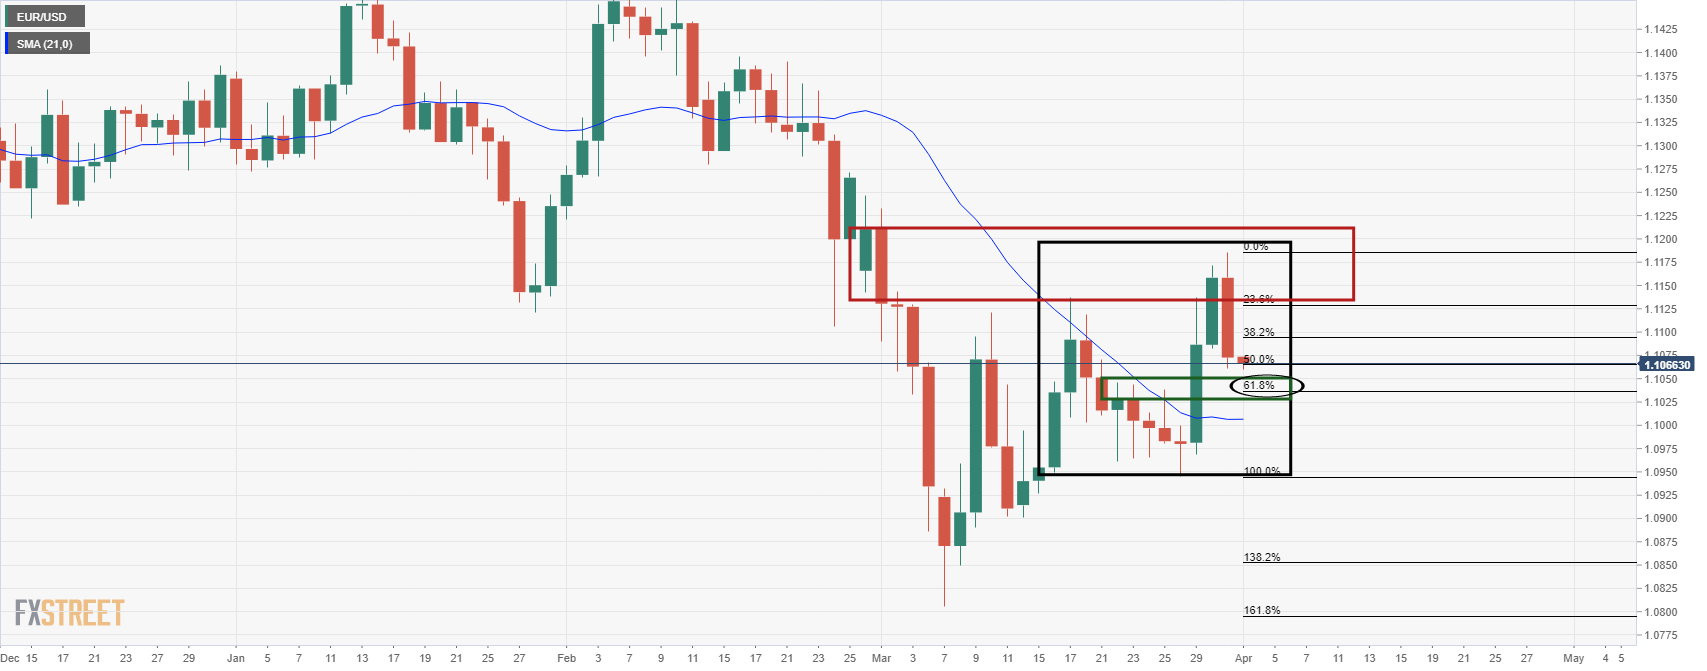
The price of the pair has reached a 50% mean reversion and is homing in on the 61.8% golden ratio that meets the neckline of the W-formation. This is near 1.1030. Should the price beak here, then the focus will be on the downside with prospects of a break of 1.10 the figure. However, should it hold, the price would be expected to move in on 1.12 the figure.
- GBP/JPY has found a decent buying interest near 160.00 on broader selling in yen.
- BOJ officials have held rising commodities prices responsible for the weakening yen.
- Pound bulls have been underpinned by strong GDP numbers.
The GBP/JPY pair has attracted some significant offers near 159.50 amid a broad-based selling in the Japanese yen after the hangover of the unlimited bond-purchase program by the Bank of Japan (BOJ). The cross is surging sharply and has gained almost 0.7% on Friday from its previous close at the press time.
The hangover of extreme buying of the Japanese Government Bonds (JGBs) to cap the yields at 25 basis points seems over after the conclusion of the four-day bond-buying on Thursday. It looks like the market participants were waiting for the completion of JGBs distribution from market participants to the BOJ and merely a simple pullback after a firmer rally has been capitalized by investors.
The Japan Chief Cabinet Secretary Matsuno believes that as per the BOJ Tankan survey the economy is looking upward but issues from the Covid-19 pandemic persist. Also, the BOJ officials have emphasized rising commodity prices stating that Japanese manufacturers have mainly pointed to the impact of rising raw material prices and parts shortages on current business conditions.
Meanwhile, the pound has been underpinned against the yen on decent performance from UK’s Gross Domestic Product (GDP). The quarterly GDP on Thursday landed at 1.3% higher than the market estimate and prior figure of 1%. While the yearly GDP has been recorded at 6.6% slightly higher than the street consensus and previous print of 6.5%.
US President Joe Biden's 180mn barrel release would help the oil market rebalance in 2022, increasing supply by 1 million b/d for six months, analysts at Goldman Sachs said in the latest note.
Key quotes
“Dropped its H2 2022 Brent forecast by $15/bbl to $120/bbl.”
“The extra supply would "not resolve the structural supply deficit, [that has taken] years in the making."
"In fact, lower prices in 2022 would support oil demand while slowing the acceleration in shale production, leaving, for now, a deficit in 2023, as well as the likely requirement to refill the SPR."
“The release, in lowering prices, would therefore lower the incentive for shale producers. This is microeconomics 101 so it should not be news to anyone.”
“Could raise its 2023 Brent oil prices $5/b above its current $110/b forecast for the year, reflecting higher demand and lower shale supply exiting 2022.”
Related reads
- US Pres. Biden team weighs a massive oil release to combat inflation, oil heavily offered
- WTI plunges below $100.00 on Biden’s 180 million barrel oil release
- AUD/USD holds the support despite the Chinese data miss.
- All eyes turn to the US Nonfarm Payrolls with attention paid to Ukraine and Russian peace talks.
AUD/USD is firming on the short term time frames near 0.7480 although the bias is with the bears while the price is below 0.75 the figure.
Meanwhile, Chinese data has failed to move the needle in any significant way as traders get set for the Nonfarm Payrolls for the US session. At 0.7485, the price is a touch in the green and remains within a 0.7477 and 0.7500 range so far.
China's March Caixin Manufacturing PMI arrived at 48.1 vs. 49.7 expected and February’s 50.4, showing that the country’s business conditions deteriorated amidst the latest covid outbreak last month. Prior to that, China's official Manufacturing PMI contracted to 49.5 in March from 50.2 booked in February and against the 49.9 expected, the National Bureau of Statistics (NBS) reported on Thursday.
Meanwhile, the focus has been on the Ukraine crisis with no meaningful resolution in sight. The dollar rose on Thursday as a lack of progress in peace talks between Russia and Ukraine boosted demand for the safe-haven currency. Peace talks resume today.
Additionally, month- and quarter-end flows have caused some additional volatility for markets, but trade is likely to muted ahead of Friday's US Nonfarm Payrolls figures, said Shaun Osborne, chief FX strategist at Scotiabank.
The NFP data are expected to continue reflecting healthy gains in employment growth in March and the Unemployment Rate is expected to come in lower.
''The historically tight labour market should continue to support average hourly earnings (Westpac f/c: 0.3%mth, 5.4% year),'' analysts at Westpac said.
Meanwhile, analysts at ANZ Bank explained that ''given the strength in the labour market and upward pressure on wages, the Fed’s expectation of a swift reduction in inflation to average levels in 2023 may be optimistic.''
''The Fed needs to target a reduction in demand in order to rein in surging inflation pressures, and that won’t be easy at a time when supply-side pressures are continuing to add fuel to the inflation fire. Avoiding a hard landing will require expert judgment and no shortage of luck,'' the analysts argued.
China's March Caixin Manufacturing PMI came in at 48.1 vs. 49.7 expected and February’s 50.4, showing that the country’s business conditions deteriorated amidst the latest covid outbreak last month.
Earlier on, China's official Manufacturing PMI contracted to 49.5 in March from 50.2 booked in February and against the 49.9 expected, the National Bureau of Statistics (NBS) reported on Thursday.
Comments from Dr. Wang Zhe, Senior Economist at Caixin Insight Group
“In the manufacturing sector, both supply and demand shrank. In March, Covid-19 flared up in several regions across China, disrupting manufacturing supply chains and impacting production. Market demand weakened, especially for consumer goods.”
“In March, both the gauges of output and total new orders came in at the lowest levels since February 2020. Overseas demand fell sharply, and global transportation conditions deteriorated. The gauge for new export orders hit its lowest in 22 months in March.”
Market reaction
AUD/USD is little changed below 0.7500 despite the awful Chinese PMI report, trading at 7483, as of writing. The spot is up 0.05% on the day.
Warning the European Union (EU) on confrontation with Russia, the country’s Foreign Ministry official said Friday that will are prepared to respond to the EU sanctions, per RIA.
Key quotes
“Russia will respond to EU sanctions.”
“Hopes the EU realizes that confrontation with Moscow is not in its interests.”
Russia threatened Thursday to cut off its gas supplies to Europe if the old continent fails to pay in roubles, as the war in Ukraine rages on.
Meanwhile, NATO and Kyiv warned that Russian troops were regrouping for new attacks.
Market reaction
EUR/USD is licking its wounds near 1.1070 after the big drop seen on Thursday. All eyes remain on the Eurozone inflation and US NFP releases.
- The price of gold is meeting a 61.8% Fibonacci retracement
- Should gold price break this 61.8% ratio, then there will be prospects of a move to $1,970.
- Eyes on US NFP and Russian peace talks with Ukraine.
Trading at $1,935, the gold price is a touch lower at the start of the last day of the week, down some 0.1%. The yellow metal has travelled from a high of $1,937.92 to a low of $1,932.56 so far.
Overnight, the precious metal was better bid its status as a safe-haven asset kept the bulls in play as markets await Russian & Ukraine peace talks to start again today. ''While geopolitical crises do not last forever, we expect the secondary impacts of the Russia-Ukraine crisis to provide a strong level of support for gold prices this year,'' analysts at ANZ Bank said.
Additionally, the analysts said that their ''gold valuation model shows that exogenous forces can widen the spread between the spot price and fair value. That premium has shot from zero to USD300/oz since Russia invaded Ukraine, suggesting a hefty risk premium.''
''Finally, the analysts explained that the ''broader isolation of Russia will see a structural shift in the energy sector, which will be inflationary. There is also a higher risk of weaker economic growth (particularly in Europe). This should create a positive backdrop for investor demand for the foreseeable future.''
Eyes on the Fed & NFP
Meanwhile, an eye a series of 50bps hikes from the Federal Reserve is expected during Q2 combined with quantitative tightening. The markets, in this regard, are awaiting today's key event in the Nonfarm Payrolls report. More on that below, but this will be an important set of data for the Federal Open Market Committee as it deliberates raising rates by 50bps in May.
Meanwhile, the US dollar climbed on Thursday as a lack of progress in peace talks between Russia and Ukraine boosted demand for the safe-haven currency. The dollar index (DXY), which weighs the greenback against a basket of six global peers, was up 0.76% by the close of the North American session and is stable in a quite pre-NFP Asian session so far. The greenback has attracted safe-haven flows since Russia's Feb. 24 invasion of Ukraine and is on track for a rise of around 1.6% for the month of March, and around 2.8% for the first quarter, hamstringing the advances in the yellow metal.
However, at the same time, the 2y-10y curve flirting with inversion has further fueled talk of a recession on the horizon Analysts at TD Securities explained that this is ''offering another positive dynamic for the gold market.'' On Thursday, the US bond yields were mixed and the curve continued to steepen, with the 2-10yr curve now almost flat. The 2-year government bond yields rose from 2.30% to 2.34% while the 10-year government bond yields slid back to 2.34%.
As for data, US personal income and spending in February rose 0.5%m/m (matching expectations) and 0.2%m/m (est. +0.5%MoM). The PCE deflator rose 6.4%y/y (prior 6.0%YoY), with core slightly below expectations at 5.4% YoY (est. 5.5% YoY, prior 5.2% YoY).
The March Chicago PMI jumped to 62.9 (est. 57.0, prior 56.3) while the employment segment rose to 48.1 from 43.5. Weekly Initial Jobless Claims edged up to 202k (est. 196k, prior 199k), with continuing claims at 1.307m (est. 1.340m, prior 1.342m).
Looking to the Nonfarm Payrolls today, they are expected to continue reflecting healthy gains in employment growth in March and the Unemployment Rate is expected to come in lower. ''The historically tight labour market should continue to support average hourly earnings (Westpac f/c: 0.3%mth, 5.4% year),'' analysts at Westpac said.
Meanwhile, analysts at ANZ bank explained that ''given the strength in the labour market and upward pressure on wages, the Fed’s expectation of a swift reduction in inflation to average levels in 2023 may be optimistic.''
''The Fed needs to target a reduction in demand in order to rein in surging inflation pressures, and that won’t be easy at a time when supply-side pressures are continuing to add fuel to the inflation fire. Avoiding a hard landing will require expert judgment and no shortage of luck,'' the analysts argued.
Gold technical analysis
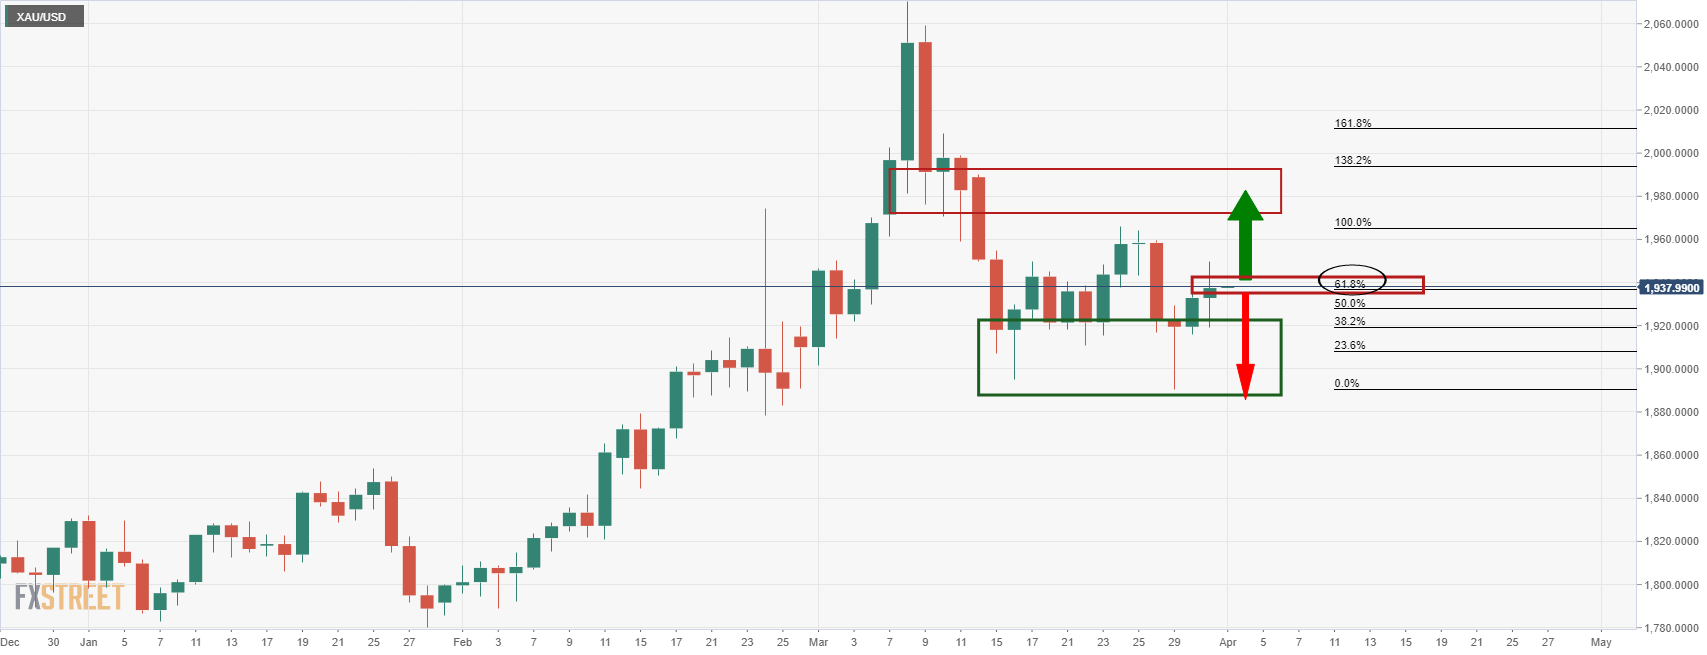
The price of gold is meeting a 61.8% Fibonacci retracement on the prior daily bearish impulse. If this holds, then there will be prospects of a move back into the demand area that has been holding up the bears for a number of trading days. On the other hand, should the price break this 61.8% ratio, then there will be prospects of a move into test the neckline of the M-formation higher up near $1,970.
The People’s Bank of China (PBOC) set the USD/CNY reference rate at 6.3509 on Friday when compared to the previous fix and the previous close at 6.3482 and 6.3393 respectively.
- GBP/USD is auctioning around 1.3150 ahead of the US NFP.
- Risk-off impulse has improved the safe-haven appeal.
- An outperformance of the UK’s GDP has failed to underpin the sterling against the greenback.
The GBP/USD pair is displaying back and forth moves in 1.3106-1.3176 as a rebound in the US dollar index (DXY) has paused the risk-perceived currencies. The volatility in cable has been contracted sharply despite an outperformance from the UK’s Gross Domestic Product (GDP). The quarterly GDP landed at 1.3% higher than the market estimate and prior figure of 1%. While the yearly GDP has been recorded at 6.6% slightly higher than the street consensus and previous print of 6.5%.
The pound has been looking for a significant trigger to attract bids from investors as the war between Russia and Ukraine has dampened the supply chain in England. Rising commodity and oil prices are hurting the commodity-importing countries and the pound is not finding interest from the market participants. Despite a principal elevation in the interest rates by the Bank of England (BOE), the pound has failed to fetch buying interest.
By that time, the DXY has rebounded sharply after plunging below 98.00 amid an ongoing negative market sentiment. Also, the US Treasury yields have started moving higher amid optimism over a 50 basis point (bps) interest rate hike by the Federal Reserve (Fed) in May’s monetary policy.
Uncertainty over the disclosure of the US Nonfarm Payrolls (NFP) is keeping investors on the sidelines. An underperformance is likely from the US NFP as a preliminary estimate has slipped to 490K against the previous figure of 678k.
The Japan chief Cabinet Secretary Matsuno said that he believes that the BoJ Tankan survey shows that economy looking upward overall but issues from pandemics remain.
Another Bank of Japan official commented surrounding recent data ad said Japanese manufacturers that saw business conditions worsen mainly pointed to the impact of rising raw material prices, parts shortages.
Sentiment worsened for a wide range of sectors among non-manufacturers, it was stated, which mainly pointed to the impact of a resurgence in covid-19 infections, rising input costs.
Not many firms were responding to the Tankan talking about the direct impact of the Ukraine war, though the crisis likely affected firms via a rise in raw material costs. Tankan japan firms' inflation forecast 1 year ahead, at 1.8%, is highest on record.
Additionally, the official said that more firms in the Tankan survey saw a weak yen as a factor pushing up import costs rather than boost to earnings. Meanwhile, Mitsuhiro Furusawa, who was the head of currency intervention at Japan's Ministry of Finance, said that it is not good for the yen to keep dropping as it reflects Japan's competitiveness. ''Its meaningless to set a line in the sand for USD/JPY...speed of yen moves more important in gauging the authorities' alarm over a weak yen.''
The Japanese Finance Minister, Suzuki, said that FX stability is important and that sharp fx moves are undesirable. he adds that the government will take appropriate steps on fx policies and will be in close communication with the US & other currency authorities, based on international agreements. Suzuki said that yen's recent weakening could affect Japan's economy, although the BoJ has an inflation target, not a target for FX rates.
- NZD/USD bulls are stepping in at 4-hour support.
- Bulls are looking for a continuation of the bull trend for fresh daily highs.
NZD/USD is setting up for a possible bullish continuation on the daily chart and the following illustrates the market structure there and lower down on the 4-hour chart:
NZD/USD daily chart
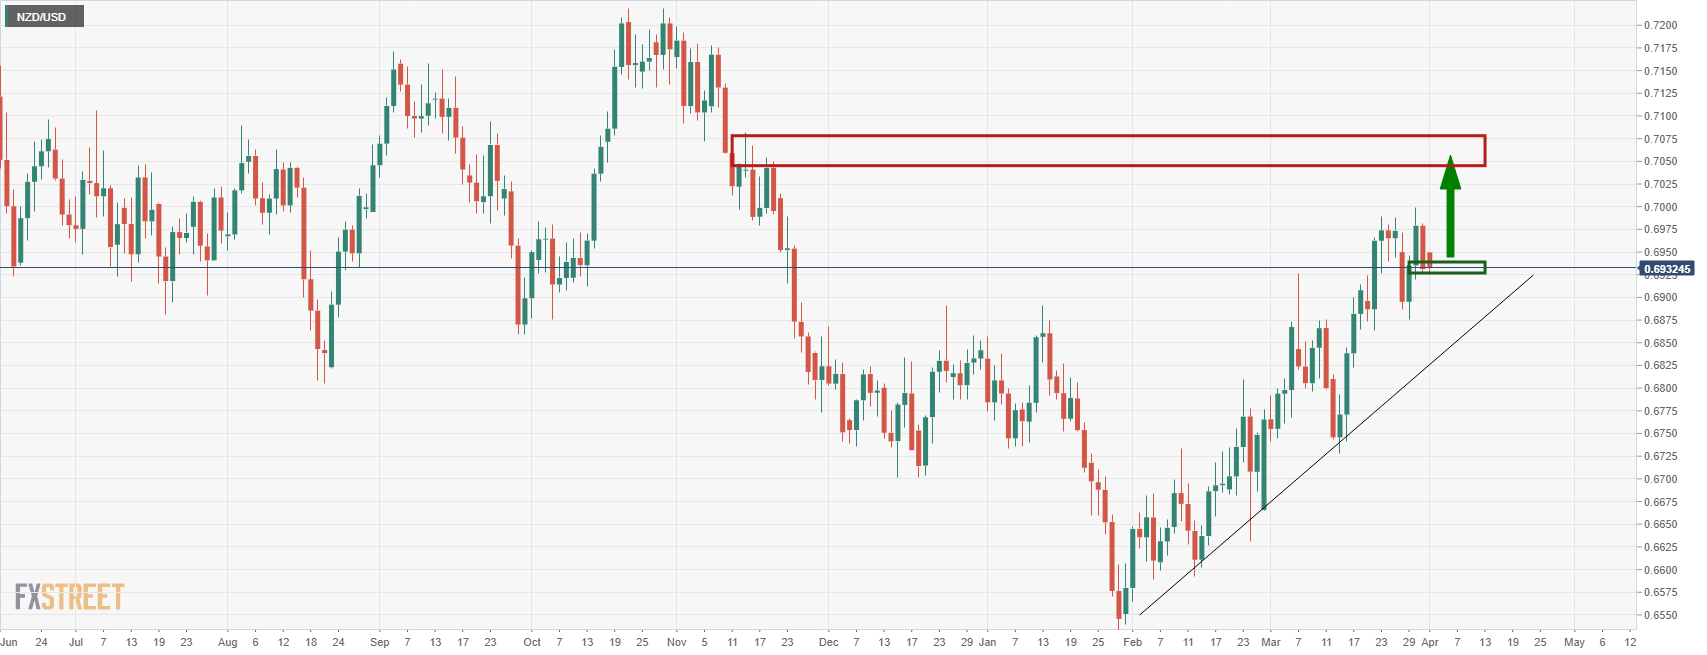
The price has corrected back to test the prior resistance that is now acting as support. Should this hold, the bulls could be encouraged to commit to the broader bullish trend and a higher high could be on the cards for the foreseeable future. 0.7050 will be a focus in this regard.
NZD/USD H4 chart
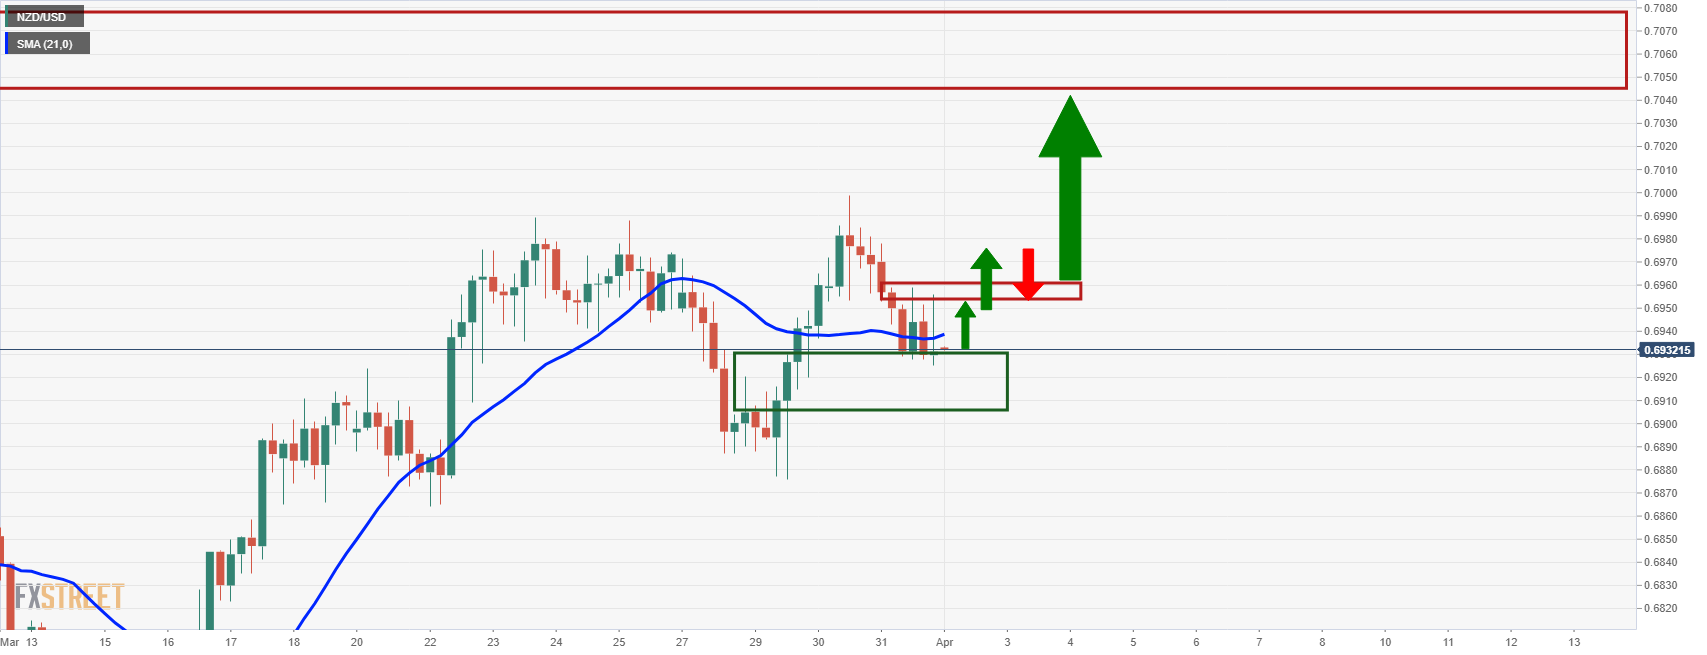
The 4-hour chart shows the price establishing a support structure from which the bulls have engaged at. A break of the recently printed 4-hour highs near 0.6960 would be encouraging.
- AUD/USD is hovering around 0.7500 as investors await the next batch of US data.
- Caixin manufacturing PMI is likely to keep the aussie bulls on the sidelines.
- Aussie has been a top performer amid rising commodity prices.
The AUD/USD pair is oscillating in a range of 0.7456-0.7537 the whole week as investors are waiting for the release of the US Nonfarm Payrolls and Caixin Manufacturing Purchase Managers Index (PMI) data.
A preliminary estimate for the Caixin China Manufacturing PMI is 49.7 lower than the earlier print of 50.4. Australia, being a major exporter to China possesses a positive relationship with the above-mentioned data. The aussie dollar has remained a frontline performer in the Fx domain after Russia’s invasion of Ukraine. Rising prices of commodities have underpinned the antipodean against major currencies. Even a ceasefire between Russia and Ukraine will continue to push the push aussie higher as Europe’s aim to attain independence from Russian oil will shift its dependency for energy on the commodity-exporting currency.
The US dollar index (DXY) has advanced near 98.40 on downbeat market sentiment as global equities lose shine on fading optimism over the Russia-Ukraine peace talks. The DXY has sensed a sheer responsive buying near 97.70 after being a value bet for the market participants. Thursday’s data batch has brought some optimism for the greenback despite a slightly lower Core Personal Consumption Expenditure (PCE) inflation at 5.4% than the estimate of 5.5%.
A power-pack action is expected on Friday as the US docket will report Nonfarm Payrolls (NFP), which is likely to land at 490k, much lower than the previous figure of 678k. This will have a significant impact on the likely decision on the interest rates from the Federal Reserve (Fed).
| Pare | Closed | Change, % |
|---|---|---|
| AUDUSD | 0.74848 | -0.33 |
| EURJPY | 134.651 | -0.96 |
| EURUSD | 1.1067 | -0.81 |
| GBPJPY | 159.859 | -0.12 |
| GBPUSD | 1.31374 | 0.04 |
| NZDUSD | 0.69324 | -0.6 |
| USDCAD | 1.25037 | 0.19 |
| USDCHF | 0.92266 | -0.03 |
| USDJPY | 121.672 | -0.16 |


© 2000-2026. All rights reserved.
This site is managed by Teletrade D.J. LLC 2351 LLC 2022 (Euro House, Richmond Hill Road, Kingstown, VC0100, St. Vincent and the Grenadines).
The information on this website is for informational purposes only and does not constitute any investment advice.
The company does not serve or provide services to customers who are residents of the US, Canada, Iran, The Democratic People's Republic of Korea, Yemen and FATF blacklisted countries.
Making transactions on financial markets with marginal financial instruments opens up wide possibilities and allows investors who are willing to take risks to earn high profits, carrying a potentially high risk of losses at the same time. Therefore you should responsibly approach the issue of choosing the appropriate investment strategy, taking the available resources into account, before starting trading.
Use of the information: full or partial use of materials from this website must always be referenced to TeleTrade as the source of information. Use of the materials on the Internet must be accompanied by a hyperlink to teletrade.org. Automatic import of materials and information from this website is prohibited.
Please contact our PR department if you have any questions or need assistance at pr@teletrade.global.
transfers