- Analytics
- News and Tools
- Market News
Analytics, News, and Forecasts for CFD Markets: currency news — 16-04-2018.
| Pare | Closed | % change |
| EUR/USD | $1,2380 | +0,41% |
| GBP/USD | $1,4336 | +0,68% |
| USD/CHF | Chf0,95959 | -0,23% |
| USD/JPY | Y107,13 | -0,20% |
| EUR/JPY | Y132,62 | +0,21% |
| GBP/JPY | Y153,572 | +0,50% |
| AUD/USD | $0,7781 | +0,27% |
| NZD/USD | $0,7363 | +0,16% |
| USD/CAD | C$1,25651 | -0,38% |
| Time | Region | Event | Period | Previous | Forecast |
| 03:30 | Australia | RBA Meeting's Minutes | | | |
| 05:00 | China | Retail Sales y/y | March | 9.7% | 9.7% |
| 05:00 | China | Industrial Production y/y | March | 7.2% | 6.4% |
| 05:00 | China | Fixed Asset Investment | March | 7.9% | 7.7% |
| 05:00 | China | NBS Press Conference | | | |
| 05:00 | China | GDP y/y | I quarter | 6.8% | 6.8% |
| 07:30 | Japan | Industrial Production (MoM) | February | -6.8% | 4.1% |
| 07:30 | Japan | Industrial Production (YoY) | February | 1.4% | 2.3% |
| 11:30 | United Kingdom | Average earnings ex bonuses, 3 m/y | February | 2.6% | 2.8% |
| 11:30 | United Kingdom | Average Earnings, 3m/y | February | 2.8% | 3% |
| 11:30 | United Kingdom | ILO Unemployment Rate | February | 4.3% | 4.3% |
| 11:30 | United Kingdom | Claimant count | March | 9.2 | 13.3 |
| 12:00 | Eurozone | ZEW Economic Sentiment | April | 13.4 | 7.3 |
| 12:00 | Germany | ZEW Survey - Economic Sentiment | April | 5.1 | -0.8 |
| 15:30 | Canada | Foreign Securities Purchases | February | 5.68 | |
| 15:30 | Canada | Manufacturing Shipments (MoM) | February | -1% | 1.1% |
| 15:30 | USA | Housing Starts | March | 1.236 | 1.269 |
| 15:30 | USA | Building Permits | March | 1.298 | 1.33 |
| 16:15 | USA | Capacity Utilization | March | 78.1% | 77.9% |
| 16:15 | USA | Industrial Production YoY | March | 4.4% | |
| 16:15 | USA | Industrial Production (MoM) | March | 1.1% | 0.3% |
| 16:15 | USA | FOMC Member Williams Speaks | | | |
| 17:00 | USA | FOMC Member Quarles Speaks | | | |
| 18:00 | USA | FOMC Member Harker Speaks | | | |
| 20:40 | USA | FOMC Member Charles Evans Speaks | | |
-
Says pricing power of businesses more limited than we're used to at this stage of expansion
-
Sees cyclical wage pressures building in 2018
-
Without structural reforms U.S. economic growth will be sluggish in mid- and long-term
Builder confidence in the market for newly-built single-family homes edged down one point to a level of 69 in April on the National Association of Home Builders/Wells Fargo Housing Market Index (HMI) but remains on firm ground.
"Strong demand for housing is keeping builders optimistic about future market conditions," said NAHB Chairman Randy Noel, a custom home builder from LaPlace, La. "However, builders are facing supply-side constraints, such as a lack of buildable lots and increasing construction material costs. Tariffs placed on Canadian lumber and other imported products are pushing up prices and hurting housing affordability."
Manufacturers' and trade inventories, adjusted for seasonal variations but not for price changes, were estimated at an end-of-month level of $1,928.8 billion, up 0.6 percent (±0.1 percent) from January 2018 and were up 4.0 percent (±0.3 percent) from February 2017.
The total business inventories/sales ratio based on seasonally adjusted data at the end of February was 1.35. The February 2017 ratio was 1.37.
Advance estimates of U.S. retail and food services sales for March 2018, adjusted for seasonal variation and holiday and trading-day differences, but not for price changes, were $494.6 billion, an increase of 0.6 percent from the previous month, and 4.5 percent above March 2017. Total sales for the January 2018 through March 2018 period were up 4.1 percent from the same period a year ago. The January 2018 to February 2018 percent change was unrevised from down 0.1 percent.
Retail trade sales were up 0.6 percent from February 2018, and 4.7 percent above last year. Gasoline Stations were up 9.7 percent (±1.6 percent) from March 2017, while Nonstore Retailers were up 9.7 percent (±1.4 percent) from last year.
The Producer and Import Price Index fell in March 2018 by 0.2% compared with the previous month, reaching 102.3 points (December 2015 = 100). This decline was due in particular to lower prices for petroleum products and pharmaceutical preparations. Compared with March 2017, the price level of the whole range of domestic and imported products rose by 2.0%.
-
Says oil producers, companies must invest to meet future oil demand, compensate for annual decline rate
-
Says unless U.S. makes some meaningful changes, NAFTA agreement by end of april is unlkely
-
Japan told Chinese side that steps must be taken to address overcapacity of steel production
-
Shared understanding with Chinese side that a trade war would have serious effect on world economy
As reported by the Federal Statistical Office, the selling prices in wholesale trade increased by 1.2% in March 2018 from the corresponding month of the preceding year. In February 2018 and in January 2018 the annual rates of change were +1.2% and +2.0%, respectively.
From February 2018 to March 2018 the index did not change.
EUR/USD
Resistance levels (open interest**, contracts)
$1.2442 (2115)
$1.2425 (1393)
$1.2394 (215)
Price at time of writing this review: $1.2332
Support levels (open interest**, contracts):
$1.2264 (3470)
$1.2227 (4047)
$1.2185 (3786)
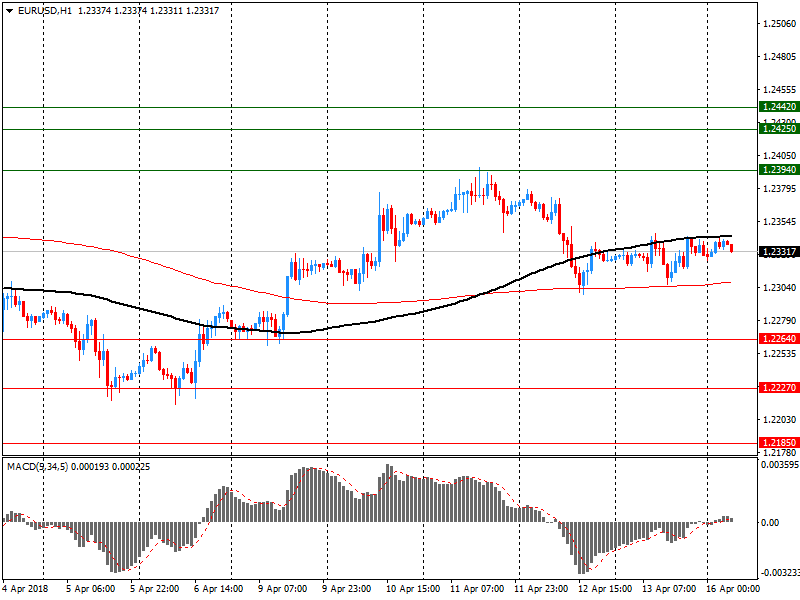
Comments:
- Overall open interest on the CALL options and PUT options with the expiration date May, 4 is 77327 contracts (according to data from April, 13) with the maximum number of contracts with strike price $1,2650 (4066);
GBP/USD
Resistance levels (open interest**, contracts)
$1.4338 (2092)
$1.4309 (2028)
$1.4287 (883)
Price at time of writing this review: $1.4256
Support levels (open interest**, contracts):
$1.4191 (408)
$1.4166 (464)
$1.4136 (899)
Comments:
- Overall open interest on the CALL options with the expiration date May, 4 is 22602 contracts, with the maximum number of contracts with strike price $1,4400 (3207);
- Overall open interest on the PUT options with the expiration date May, 4 is 23721 contracts, with the maximum number of contracts with strike price $1,3850 (2488);
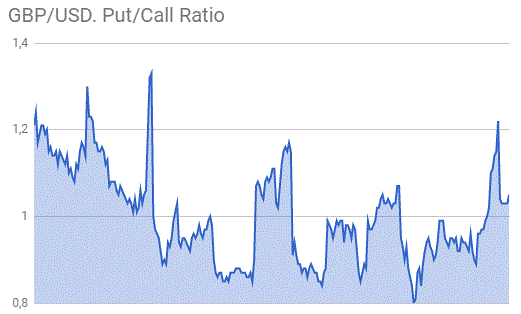
- The ratio of PUT/CALL was 1.05 versus 1.03 from the previous trading day according to data from April, 13
* - The Chicago Mercantile Exchange bulletin (CME) is used for the calculation.
** - Open interest takes into account the total number of option contracts that are open at the moment.


© 2000-2026. All rights reserved.
This site is managed by Teletrade D.J. LLC 2351 LLC 2022 (Euro House, Richmond Hill Road, Kingstown, VC0100, St. Vincent and the Grenadines).
The information on this website is for informational purposes only and does not constitute any investment advice.
The company does not serve or provide services to customers who are residents of the US, Canada, Iran, The Democratic People's Republic of Korea, Yemen and FATF blacklisted countries.
Making transactions on financial markets with marginal financial instruments opens up wide possibilities and allows investors who are willing to take risks to earn high profits, carrying a potentially high risk of losses at the same time. Therefore you should responsibly approach the issue of choosing the appropriate investment strategy, taking the available resources into account, before starting trading.
Use of the information: full or partial use of materials from this website must always be referenced to TeleTrade as the source of information. Use of the materials on the Internet must be accompanied by a hyperlink to teletrade.org. Automatic import of materials and information from this website is prohibited.
Please contact our PR department if you have any questions or need assistance at pr@teletrade.global.
transfers