- Analytics
- News and Tools
- Market News
CFD Markets News and Forecasts — 01-01-2001
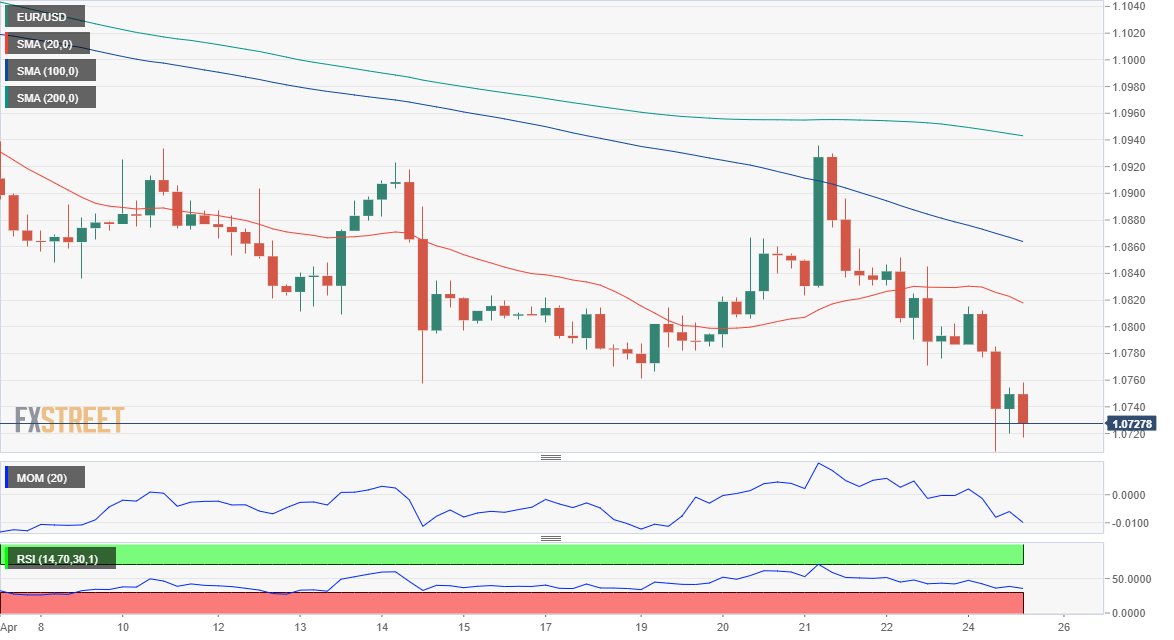
EUR/USD Current Price: 1.0727
- Growing coronavirus cases in China exacerbate global growth concerns.
- Global stocks are on the back foot as investors rush into safety.
- EUR/USD is technically bearish and poised to test the 2020 low at 1.0635
Risk aversion took over financial markets at the weekly open amid Chinese growth-related headlines. The government put under lockdown some Beijing districts due to a coronavirus outbreak, while Apple’s prime supplier Foxconn Technology Group halted operations at two of its plants in eastern China, exacerbating supply-chain issues, which jeopardize economic progress. The EUR/USD pair plunged to 1.0706, its lowest since March 2020, when the pandemic sent it to a multi-year low of 1.0635
Meanwhile, in France, Emmanuel Macron won the presidential reelection, which brought relief to European democracy. Nevertheless, the far-right got record support in the divided country, as Marine Le Pen got 41.4% or 13.3 million votes. Additionally, the EU is studying more sanctions on Russia, cutting oil imports from the country.
Those combined factors weighed on high-yielding equities, resulting in substantial losses in Asian and European indexes. Wall Street is set to open sharply down after plummeting on Friday, somehow hinting at continued demand for the safe-haven dollar.
Data wise, Germany published the April IFO survey on Business Climate, which came in better than anticipated, improving to 91.8 from 90.8. The EU released February Construction Output, up 1.9% in the month, while the US published the March Chicago Fed National Activity Index, which printed at 0.44. The rest of the day will be quiet in terms of data, as the only report pending is the US Dallas Fed Manufacturing Business Index.
EUR/USD short-term technical outlook
The EUR/USD pair bounced from the mentioned low but remains on the losing side, trading at around 1.0723 at the beginning of the American session. The daily chart shows that there’s room for additional declines, as the pair keeps developing far below bearish moving averages and reaching lower lows. The Momentum indicator lacks directional strength but remains within negative levels, while the RSI indicator heads firmly south at around 34.
The 4-hour chart shows that the risk remains skewed to the downside, as the pair hovers near the mentioned daily low with a strong bearish momentum. The longer moving averages head firmly south far above the current level while the 20 SMA is gaining bearish traction. The Momentum indicator heads south almost vertically, while the RSI indicator approaches oversold readings without signs of bearish exhaustion. The pair has room now to test the 2020 low at 1.0635.
Support levels: 1.0700 1.0665 1.0630
Resistance levels: 1.0770 1.0810 1.0845
View Live Chart for the EUR/USD
THIS ANALYSIS HAS BEEN DEPRECATED. CORRECT LINK: https://www.fxstreet.com/analysis/gbp-usd-forecast-pound-eyes-fresh-multi-year-lows-amid-risk-aversion-202209010915
- GBP/USD has been struggling to stage a convincing recovery.
- Technical outlook shows sellers retain control of the pair's action.
- Pound is likely to suffer additional losses with safe-haven flows dominating the markets.
GBP/USD has failed to shake off the bearish pressure after having modestly rebounded from the multiyear low it touched at 1.1569 earlier in the day. The risk-averse market environment is not allowing the British pound to find demand and the near-term technical outlook shows that there is more room on the downside for the pair.
The greenback lost some interest on Wednesday after the monthly ADP showed a smaller than expected increase in private sector employment in August. With Wall Street's main indexes suffering heavy losses on the last trading day of August, however, the dollar managed to stay resilient against its rivals and forced GBP/USD to stay on the backfoot.
The UK's FTSE 100 Index is down 1.6% in the European morning on Thursday and US stock index futures are losing between 0.6% and 1.2%, confirming the view that investors continue to seek refuge.
Liz Truss, the frontrunner in the UK’s leadership race, said on Thursday that they would deliver "immediate support" to households to make sure that they could afford energy bills but this comment failed to help the mood improve.
Meanwhile, the S&P Global's UK Manufacturing PMI for August got revised higher to 47.3 from the initial estimate of 46. Nevertheless, market participants paid little to no attention to this data. The Bank of England’s (BOE) latest Decision Maker Panel revealed that overall business uncertainty, specifically related to the Russia-Ukraine war and Brexit, rose in August.
In the second half of the day, the ISM will release the US August Manufacturing PMI survey. Rather than the headline figure, which is expected to edge slightly lower to 52 from 52.8 in July, investors will likely react to the inflation component. The Prices Paid Index is forecast to decline to 55.5 in July from 60 and a lower-than-expected print could make it difficult for the dollar to continue to gather strength in the second half of the day. On the other hand, a strong producer inflation reading should support the dollar ahead of Friday's August jobs report.
GBP/USD Technical Analysis
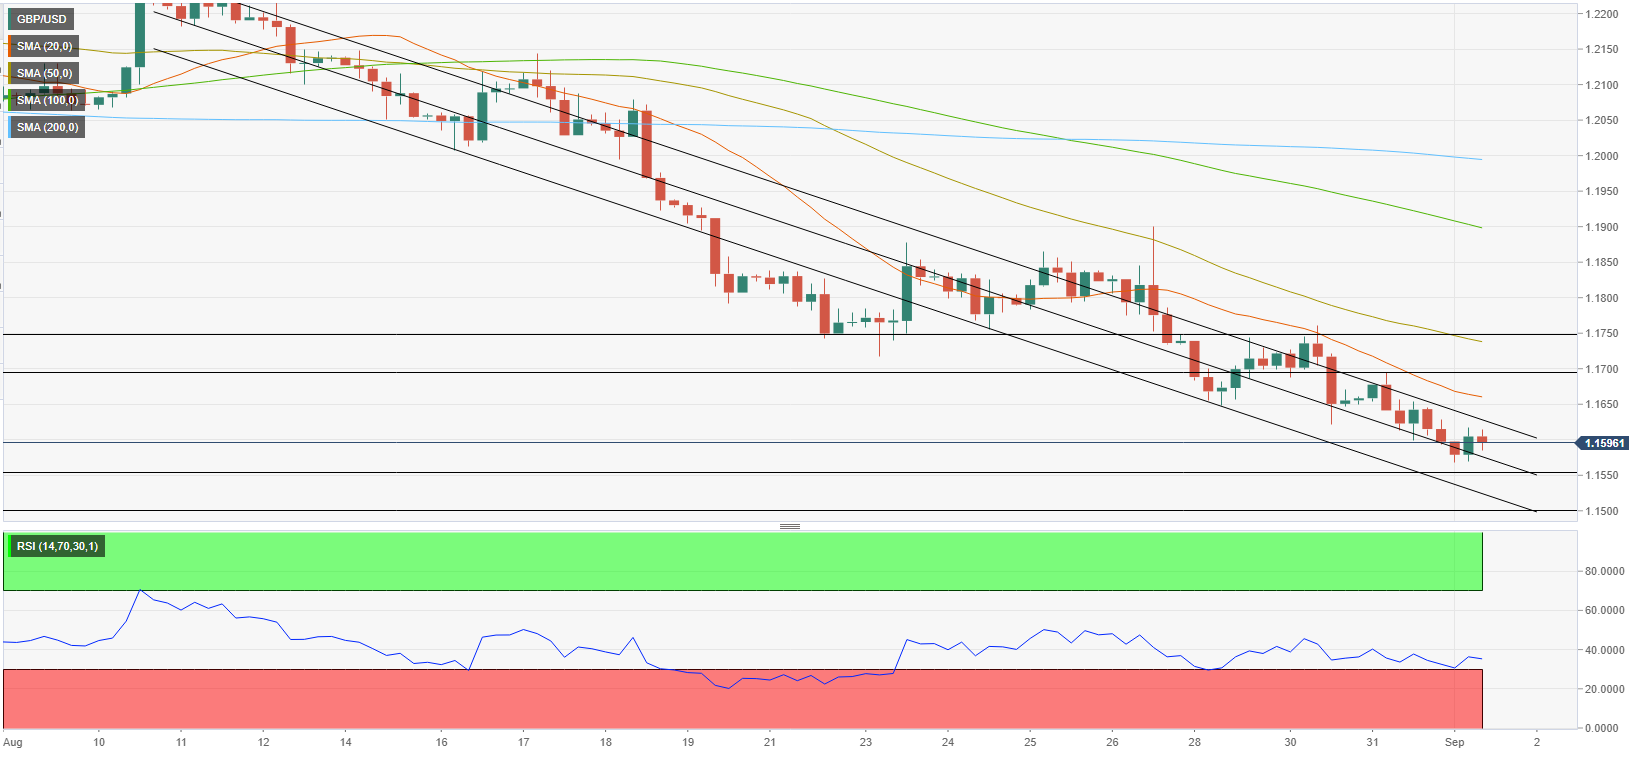
GBP/USD continues to trade within the descending regression channel coming from early August and the Relative Strength Index (RSI) indicator on the four-hour chart stays well below 50, confirming the bearish bias.
On the downside, 1.1550 (static level, mid-point of the descending channel) aligns as first support ahead of 1.1500 (psychological level).
Resistances are located at 1.1600 (psychological level, upper-limit of the descending channel) 1.1650 (20-period SMA) and 1.1700 (psychological level, static level).
- Gold price has got acceptance above $1,960.00 ahead of the US inflation data.
- The energy component is expected to keep significant pressure on US inflation.
- A clash of US CPI data and a volatile contraction pattern by the Gold price is going to deliver an explosion.
Gold price (XAU/USD) has shifted its auction above the crucial resistance of $1,960.00 ahead of the release of the United States Consumer Price Index (CPI) data, which will release at 12:30 GMT. The precious metal is expected to show volatile moves as investors are keenly awaiting the US inflation numbers to deduce cues about Federal Reserve’s (Fed) interest rate policy.
S&P500 futures are holding gains added from the Asian session as the odds of a neutral interest rate decision by the Fed are extremely solid. Market sentiment is quite upbeat and the appeal of risk-sensitive assets is stronger.
The US Dollar Index (DXY) is looking vulnerable near its two-week low around 103.20 as the market participants are anticipating that the energy component will keep significant pressure on the US inflation.
Analysts at NBF expect the energy component may have had a negative impact on the headline index as prices likely fell in both the gasoline and natural gas segments. Expected gains for shelter could still result in a 0.2% monthly increase in headline prices. If we’re right, the annual rate should come down from 4.9% to a two-year low of 4.1%. The core index, meanwhile, could have advanced 0.3% on a monthly basis, something which would translate into a 5.1% annual gain.
The pressure of higher chances for a neutral Fed policy is visible on US Treasury yields. The return delivered on 10-year US Treasury bonds has dropped to near 3.72%.
Gold technical analysis
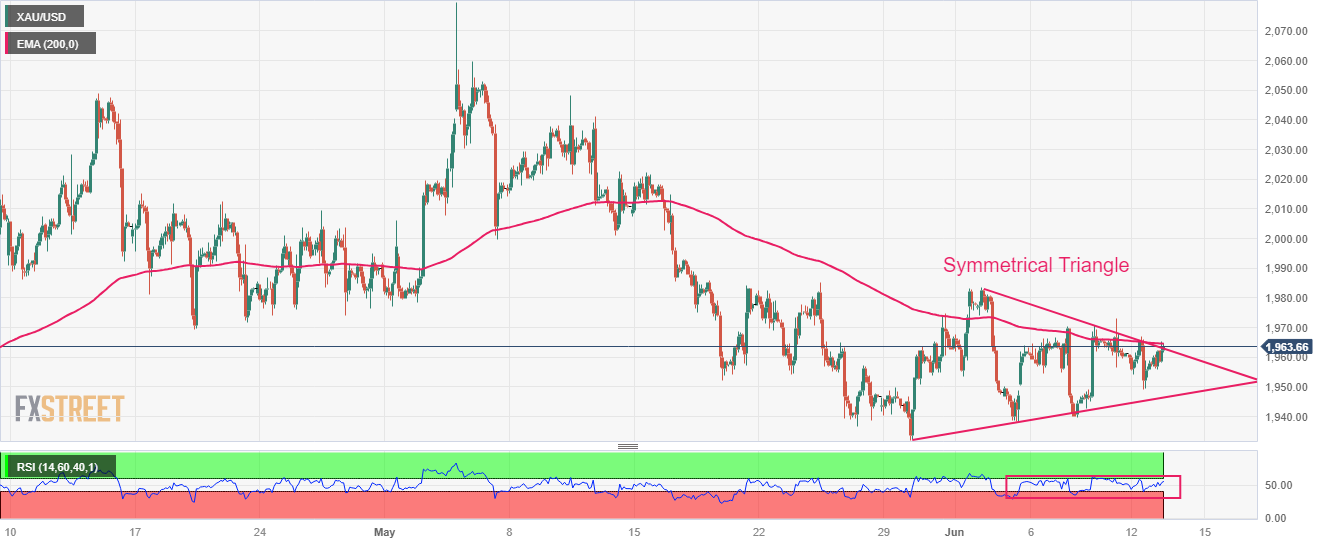
Investors should be prepared for a sheer volatile action by the Gold price ahead of the US inflation data. Gold price has been forming a Symmetrical Triangle chart pattern on a two-hour scale and a clash of first-tier US economic data and a volatile contraction pattern is going to deliver an explosion, which will be followed by wider ticks and heavy volume.
The 50-period Exponential Moving Average (EMA) at $1,964.48 is sticky with the Gold price, portraying non-directional movements.
Adding to that, the Relative Strength Index (RSI) (14) is oscillating in the 40.00-60.00 range, which indicates that investors await crucial data.
Gold two-hour chart

- Gold price has got acceptance above $1,960.00 ahead of the US inflation data.
- The energy component is expected to keep significant pressure on US inflation.
- A clash of US CPI data and a volatile contraction pattern by the Gold price is going to deliver an explosion.
Gold price (XAU/USD) has shifted its auction above the crucial resistance of $1,960.00 ahead of the release of the United States Consumer Price Index (CPI) data, which will release at 12:30 GMT. The precious metal is expected to show volatile moves as investors are keenly awaiting for the US inflation numbers to deduce cues about Federal Reserve’s (Fed) interest rate policy.
S&P500 futures are holding gains added from the Asian session as the odds of a neutral interest rate decision by the Fed are extremely solid. Market sentiment is quite upbeat and the appeal of risk-sensitive assets is stronger.
The US Dollar Index (DXY) is looking vulnerable near its two-week low around 103.20 as the market participants are anticipating that the energy component will keep significant pressure on the US inflation.
Analysts at NBF expects the energy component may have had a negative impact on the headline index as prices likely fell in both the gasoline and natural gas segments. Expected gains for shelter could still result in a 0.2% monthly increase in headline prices. If we’re right, the annual rate should come down from 4.9% to a two-year low of 4.1%. The core index, meanwhile, could have advanced 0.3% on a monthly basis, something which would translate into a 5.1% annual gain.
The pressure of higher chances for a neutral Fed policy is visible on US Treasury yields. The return delivered on 10-year US Treasury bonds has dropped to near 3.72%.
Gold technical analysis
Investors should be prepared for a sheer volatile action by the Gold price ahead of the US inflation data. Gold price has been forming a Symmetrical Triangle chart pattern on a two-hour scale and a clash of first-tier US economic data and a volatile contraction pattern is going to deliver an explosion, which will be followed by wider ticks and heavy volume.
The 50-period Exponential Moving Average (EMA) at $1,964.48 is sticky with the Gold price, portraying non-directional movements.
Adding to that, the Relative Strength Index (RSI) (14) is oscillating in the 40.00-60.00 range, which indicates that investors await crucial data.
Gold two-hour chart
Original content: EUR/USD Forecast: Euro recovery likely to be capped at 1.1040
- EUR/USD has regained its traction after dropping to two-week lows.
- The pair could find it difficult to clear the 1.1040 hurdle.
- Eyes on Russia-Ukraine talks, US consumer confidence data.
EUR/USD has reversed its direction after having touched its weakest level in two weeks at 1.0944 on Monday. The pair is holding above 1.1000 in the early European session but it could find it difficult to break above the 1.1040 resistance.
The improving market mood is not allowing the greenback to gather strength early Tuesday and helping EUR/USD clings to its recovery gains.
Markets are hopeful that Russia and Ukraine will make progress toward a cease-fire at Tuesday's talks. Reflecting the risk-positive market environment, the Euro Stoxx 600 Index is rising more than 1% on a daily basis and US stock index futures are up between 0.2% and 0.3%.
In case the headlines coming out of the Russia-Ukraine negotiations convince market participants that there will not be a further escalation of the conflict, risk flows could continue to provide a boost to the shared currency.
In the second half of the day, the Conference Board will release the US Consumer Confidence report for March. Several FOMC policymakers, including NY Fed President John Williams and Atlanta Fed President Raphael Bostic, will be delivering speeches as well.
The latest remarks from Fed officials fueled expectations of a 50 basis points rate hike in May and triggered a rally in the US T-bond yields. The fundamental outlook highlighted by the policy divergence between the Fed and the ECB should continue to favour the dollar over the euro, suggesting that the pair's recovery attempts are likely to remain technical in the near term.
EUR/USD Technical Analysis
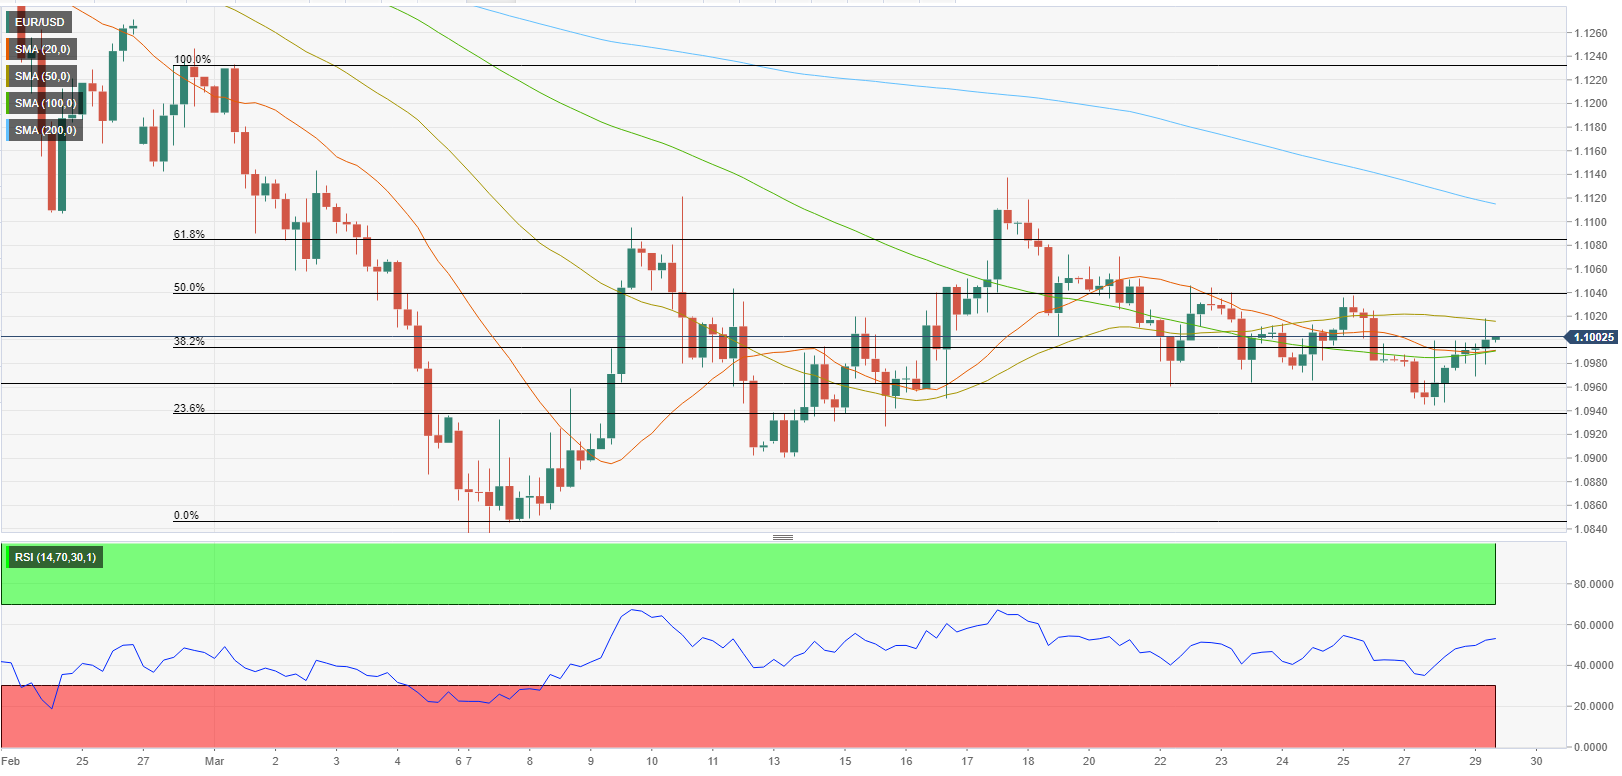
EUR/USD is trading above the 100-period SMA on the four-hour chart. Confirming the bullish tilt in the technical picture, the Relative Strength Index (RSI) indicator is edging higher above 50 on the same chart.
On the upside, 1.1020 (50-period SMA) aligns as interim resistance ahead of 1.1040 (Fibonacci 50% retracement of the latest downtrend). In case the latter turns into support, the next bullish target could be seen at 1.1080 (Fibonacci 61.8% retracement).
On the other hand, immediate support is located at 1.1000 (psychological level, Fibonacci 38.2% retracement, 100-period SMA) before 1.0960 (static level) and 1.0940 (Fibonacci 23.6% retracement).
- GBP/USD edges lower for the second straight day amid a modest pickup in the USD demand.
- The UK political uncertainty overshadows a stronger CPI and does little to lend any support.
- Bets for a jumbo 100 bps BoE rate hike in November act as a tailwind and limit the downside.
The GBP/USD pair remains on the defensive for the second successive day on Wednesday amid a modest pickup in demand for the US dollar. Growing acceptance that the Federal Reserve will stick to its faster rate-hiking cycle to tame inflation continues to act as a tailwind for the greenback. In fact, the CME's FedWatch tool indicates a nearly 100% chance of the fourth successive supersized 75 bps rate increase at the next FOMC meeting in November. The bets were reaffirmed by hotter US consumer inflation figures released last week and the recent hawkish comments by several Fed officials.
Reiterating the Fed's commitment to bring inflation under control, Minneapolis Fed President Neel Kashkari said on Tuesday that the benchmark policy rate could rise above 4.75% if underlying inflation does not stop rising. This, in turn, assists the yield on the rate-sensitive 2-year US government bond and the benchmark 10-year Treasury note to hold steady near a multi-year peak. This helps offset the prevalent risk-on mood and provides a modest lift to the safe-haven greenback. Apart from this, the UK UK political uncertainty exerts additional downward pressure on the British pound.
In fact, rebels within the ruling Tory Party are coming together to replace the newly-elected UK Prime Minister Liz Truss in the wake of the recent tax cut fiasco. This, along with looming recession risks, overshadows hotter UK consumer inflation figures, which does little to lend any support to the GBP/USD pair. The UK Office for National Statistics reported that the headline CPI rose more than expected by 10.1% YoY in September. Moreover, the core inflation (excluding volatile food and energy items) surpassed estimates and climbed to 6.5% YoY from 6.3% in August. The data lifted bets for a jumbo 100 bps rate hike by the Bank of England in November, though fails to impress bulls.
The downside, however, remains cushioned, at least for the time being, allowing spot prices to hold above the mid-1.1200s. This warrants some caution for aggressive bearish traders and before confirming that the recent strong recovery move from an all-time low has run out of steam. Market participants now look forward to the US housing market data - Building Permits and Housing Starts - for a fresh impetus. In the meantime, the US bond yields, along with the broader risk sentiment, will drive the USD demand and produce short-term trading opportunities around the GBP/USD pair.
Technical Outlook
From a technical perspective, nothing seems to have changed for the major and a descending trend-line extending from September monthly high continues to cap the upside. The said barrier, currently near the 1.1380 region, is closely followed by the 1.1400 round figure. A sustained move beyond should allow the GBP/USD pair to aim back to retest the monthly high, just ahead of the 1.1500 psychological mark. Some follow-through buying will be seen as a fresh trigger for bullish traders and pave the way for a further near-term appreciating move.
On the flip side, the weekly swing low, around the 1.1210-1.1200 zone, might continue to protect the immediate downside. The next relevant support is pegged near the mid-1.1100s, below which the GBP/USD pair could turn vulnerable to test the 1.1100 mark. Failure to defend the said support levels will negate any near-term positive outlook and shift the bias back in favour of bearish traders. This, in turn, will set the stage for a fall towards the 1.1055-1.1050 intermediate support en route to the 1.1000 psychological mark.
-638017622241208226.png)
In the opinion of Economist Lee Sue Ann and Markets Strategist Quek Ser Leang at UOB Group, the downtrend in GBP/USD should pick up further pace once 1.1330 is cleared.
Key Quotes
24-hour view: “Yesterday, we expected GBP to ‘trade in a choppy manner between 1.1430 and 1.1550’. Our view for choppy trading was not wrong even though GBP traded within a much wider range than expected (1.1388/1.1565). The weak daily closing of 1.1390 (-0.83%) suggests downside risk for GBP today. That said, a sustained drop below the major support at 1.1330 is unlikely (next support is at 1.1260). Resistance is at 1.1430, followed by 1.1480.”
Next 1-3 weeks: “Our latest narrative was from Tuesday (01 Nov, spot at 1.1470) where GBP ‘appears to have moved into a consolidation phase and is likely to trade between 1.1330 and 1.1635 for the time being’. Yesterday (02 Nov), GBP dropped sharply to 1.1388 and short-term downward momentum is beginning to improve. That said, GBP has to break below 1.1330 before a sustained decline is likely. The chance of GBP breaking 1.1330 would remain intact as long as GBP does not move above the ‘strong resistance’ level (currently at 1.1525) within the next couple of days.”
- EUR/USD plunged to a near three-week low after the ECB announced its decision on Thursday.
- The lack of a clear signal for 50 bps disappointed investors and weighed on the shared currency.
- Elevated US bond yields, the risk-off mood benefitted the USD and contributed to the selling.
- The focus now shifts to the crucial US consumer inflation figures for May, due later this Friday.
The EUR/USD pair witnessed a dramatic intraday turnaround on Thursday and tumbled over 150 pips from the weekly high after the European Central Bank (ECB) announced its policy decision. As was widely expected, the ECB decided to leave key interest rates unchanged and end its long-running asset purchase program as of July 1, 2022. In the accompanying policy statement, the central bank sent a clear signal that it would deliver its first rate hike since 2011 in July and left the door open for a potentially larger move in September. The shared currency did get a minor lift in the wake of the hawkish outlook, though struggled to capitalize on the move.
The ECB failed to specify the size of the rate hike in September and said that it will be dependent on the inflation forecasts at that time. In the post-meeting press conference, ECB President Christine Lagarde said that if September projections put 2024 inflation at 2.1% or higher, the rate hike would be bigger than 25 bps. The conditional jumbo hike in September and the lack of additional details disappointed some investors, which, in turn, was seen as a key factor that acted as a headwind for the common currency. Apart from this, resurgent US dollar demand exerted heavy downward pressure on the EUR/USD pair and contributed to the steep intraday decline.
The ECB's forward guidance unnerved investors amid doubts that major central banks can hike interest rates to curb inflation without impacting economic growth. This, in turn, led to the overnight selloff in the US equity markets, which, along with elevated US Treasury bond yields, provided a strong boost to the safe-haven greenback. In fact, the yield on the benchmark 10-year US government bond held steady above the 3.0% threshold amid concerns about rising inflation, which might force the Fed to tighten its policy at a faster pace. Hence, the focus now shifts to the US consumer inflation figures for May, due later during the early North American on Friday.
The crucial US CPI report could influence the scale and speed of the Fed's monetary tightening path. This would play a key role in driving the near-term USD demand and provide a fresh directional impetus to the EUR/USD pair. Heading into the key data risk, the USD was seen consolidating the overnight gains to a three-week peak, which, in turn, assisted the pair to gain some positive traction during the Asian session. The upside, however, seems limited as investors might prefer to wait on the sidelines and wait for a fresh catalyst before placing aggressive bets.
Technical outlook
From a technical perspective, the overnight slide confirmed a near-term bearish breakdown through a two-and-half-week-old trading range. A subsequent fall below the previous monthly low, around the 1.0625 region, supports prospects for further losses. Some follow-through selling below the 1.0600 mark will reaffirm the negative bias and drag the EUR/USD pair towards the 1.0550-1.0545 area, or the 23.6% Fibonacci retracement level of the 1.1185-1.0350 fall. The downward trajectory could further get extended towards the 1.0500 psychological mark, which if broken would expose the YTD low, around mid-1.3000s with some intermediate support near the 1.0400 round figure.
On the flip side, any meaningful recovery attempt now seems to confront stiff resistance near the 1.0670-1.0675 area, or the 38.2% Fibo. level. The said barrier now coincides with the 50-day SMA and should act as a pivotal point. Sustained strength beyond might trigger a short-covering rally and lift the EUR/USD pair further beyond the 1.0700 mark, towards testing the 1.0775-1.0780 supply zone, or the 50% Fibo. level.
-637904347422392354.png)
- Gold price is looking to build on the previous rebound above $1,800.
- Risk tone remains firmer despite doubts over ‘soft-landing’ amid hawkish Federal Reserve bets.
- United States Durable Goods Orders disappoint, Consumer Confidence next of note.
- Gold price awaits Falling Wedge confirmation on a daily closing above $1,814.
Gold price is extending the recovery momentum from two-month lows of $1,807 into early Tuesday. The United States Dollar is struggling to find its footing amid sluggish US Treasury bond yields and an upbeat market mood. All eyes turn to the US Conference Board (CB) Consumer Confidence data.
United States data to lead the Federal Reserve sentiment
Gold price staged a solid rebound on Monday after hitting the lowest level in two months in the early part of the day, as the US Dollar bulls remained in control amidst Friday’s hot United States Core Personal Consumption Expenditures (PCE) Price Index and escalating geopolitical tensions between the West and China over Russia.
The tide, however, turned against Gold sellers in American trading after the top-tier US Durable Goods Order disappointed and rekindled doubts whether the United economy could see a ‘soft-landing’, as the US Federal Reserve is set to maintain rates higher for longer. The headline US Durable Goods Orders sank 4.5% in January vs. -4.0% expected and 5.1% previous. The US Dollar Index pulled back sharply from multi-week highs of 105.36 on the data release to fall as low as 104.55, lifting Gold price to the $1,820 round figure. The retreat in the US Treasury bond yields also boded well for the non-yielding Gold. The benchmark 10-year US Treasury bond yield continues to face stiff resistance just shy of the 4.0% key level.
However, the further upside in the Gold price remained capped, as the US central bank is still anticipated to deliver three more 25 basis points (bps) rate hikes this year. Strong US Pending Home Sales data also partly helped limit the Gold price rebound. Next of relevance for the Gold price remains the US CB Consumer Confidence data, which will be released alongside other minority reports. Speeches from Federal Reserve officials will be also closely scrutinized for fresh trading impetus.
Upbeat market mood checks US Dollar bounce
Ahead of the US economic data releases, the market mood remains upbeat, as investors continued to weigh the potential for a soft landing, especially after Monday’s weak US Durable Goods data and comments from US Treasury Secretary Janet Yellen. In an exclusive interview with CNN News on Monday, Yellen said that she believes US inflation remains too high but that a soft landing is on the radar.
A firmer risk tone is reflective of the 0.20% gain in the US S&P 500 Futures while the Asian equities track the Wall Street higher. The risk-on market profile is limiting the recovery attempts in the United States Dollar, underpinning the Gold price for another potential upside this Tuesday.
Gold price technical analysis: Daily chart
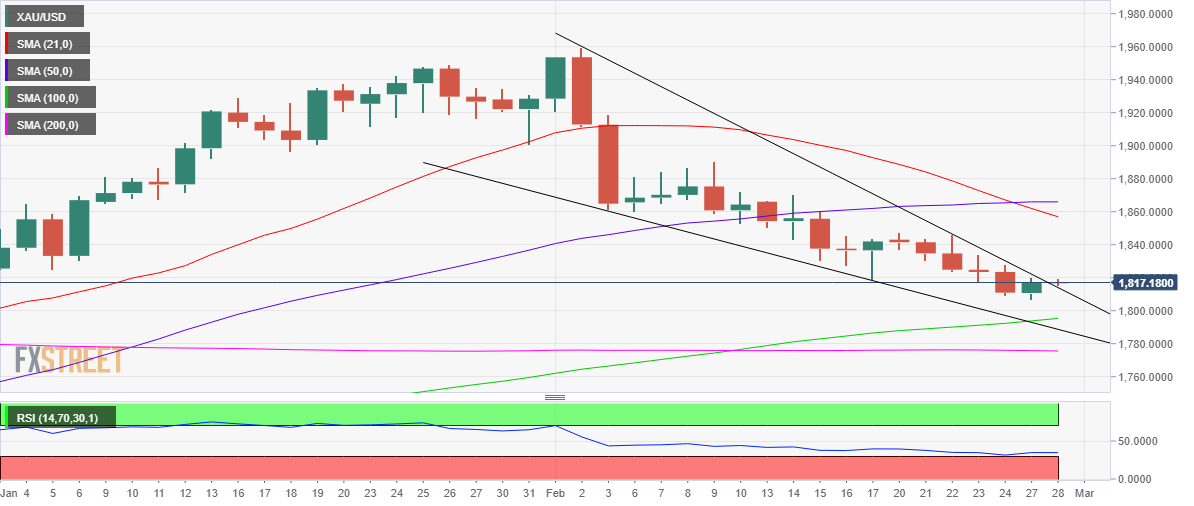
Gold price is teasing a falling wedge formation on the daily chart, having opened Tuesday above the falling trendline resistance at $1,814.
Daily closing above the latter is needed to validate the bullish reversal pattern, with an immediate test of Friday’s high at $1,828 on Gold buyers’ radars.
Further up, the $1,730 round number will be retested, above which the previous week’s high at $1,846 will lure bulls on the road to recovery.
However, with the bearish 14-day Relative Strength Index (RSI) and the 21 and 50-Daily Moving Averages (DMA) bearish crossover still in play, any rebound in the Gold price is likely to be sold off at higher levels.
On the downside, crucial support is seen at Monday’s low of $1,807, below which the $1,800 mark will be put to test.
Additional declines will challenge the bullish 100 DMA at $1,795. The last line of defense for Gold buyers is seen at the falling trendline (wedge) support, now at $1,789.
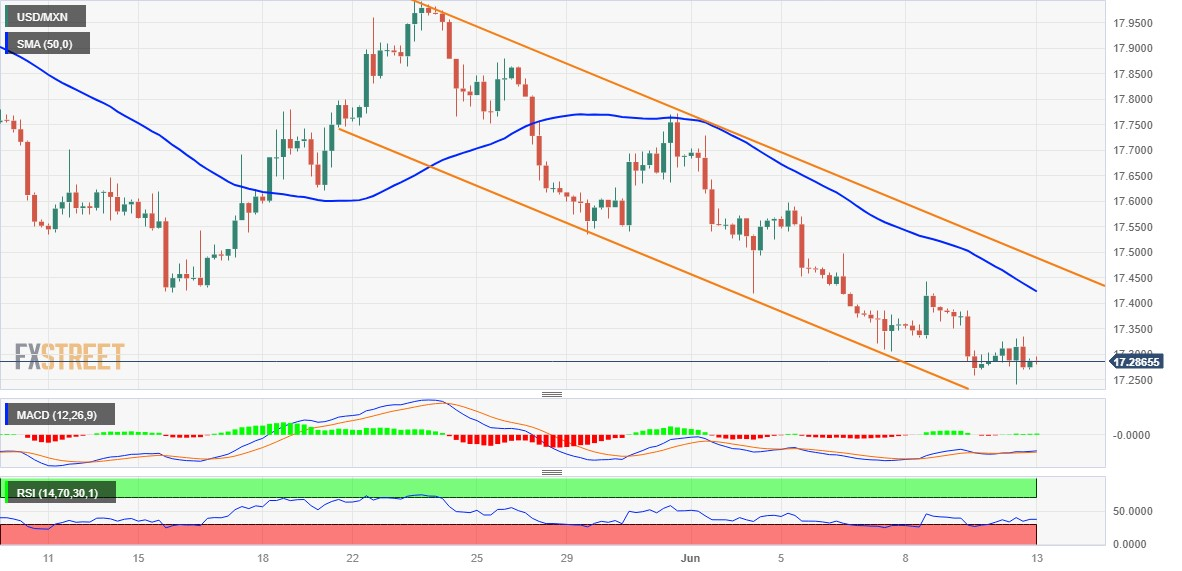
- USD/MXN extends its consolidative price move near a multi-year low touched on Monday.
- The formation of a descending channel points to a well-established short-term downtrend.
- A sustained strength beyond the mid-17.00s is needed to negate the near-term negative bias.
The USD/MXN pair continues with its struggle to register any meaningful recovery and oscillates in a range near its lowest level since May 2016 touched on Monday. The pair remains confined in a narrow band, around the 17.30-17.25 area, through the Asian session on Tuesday and the lack of any buying interest suggests that the downward trajectory witnessed over the past three weeks or so is still far from being over.
From a technical perspective, the USD/MXN pair has been drifting lower along a downward-sloping channel extending from the vicinity of the 18.00 mark touched on May 23. This points to a well-established short-term bearish trend and supports prospects for a further depreciating move. That said, the Relative Strength Index (RSI) on the daily chart has moved on the verge of breaking into the oversold territory and warrants some caution.
Hence, it will be prudent to wait for some near-term consolidation or a modest recovery before placing fresh bearish bets around the USD/MXN pair. Nevertheless, spot prices remain on track to challenge support marked by the lower end of the trend channel, currently around the 17.15 region, which is followed by the 17.00 round figure. A convincing break below the latter will mark a fresh breakdown and pave the way for further losses.
On the flip side, any meaningful recovery attempt is likely to confront stiff resistance ahead of the mid-17.00s, representing the top end of the aforementioned channel. A sustained strength beyond might trigger a short-covering rally and lift the USD/MXN pair towards the 17.70 intermediate resistance en route to the 18.00 round figure. The latter should act as a pivotal point, which if cleared decisively will suggest that spot prices have formed a near-term bottom.
USD/MXN 4-hour chart
Key levels to watch
German Finance Ministry came out with a statement late Thursday, citing a dire economic outlook.
Key quotes
“Germany's economic outlook is bleak.”
It is “clouded by rising energy prices and supply chain issues.”
Reuters reported, quoting the Jiji news agency, that the ´´Bank of Japan is considering a projection for consumer prices for the 2025 fiscal year to rise 1.6-1.9% in a move seen to keep market players from betting on the central bank to head to exit from stimulus.´´
Such a forecast diminishes the prospects of a tweak to the yield curve control policy that is in place to sustainably achieve the 2% inflation target whereby Kazuo Ueda has predicted the CPI growth will slow below 2% around the middle of this fiscal year as base effects fade away.
USD/JPY update
-
USD/JPY Price Analysis: Bulls stay front side of trend and above the 134 figure but correction eyed
With the bulls still in control, there are prospects of a continuation toward the greyed price imbalance area in the 135s, however, if bears move in, there will be risks of a test of the trendline support that guards the 132.50s:
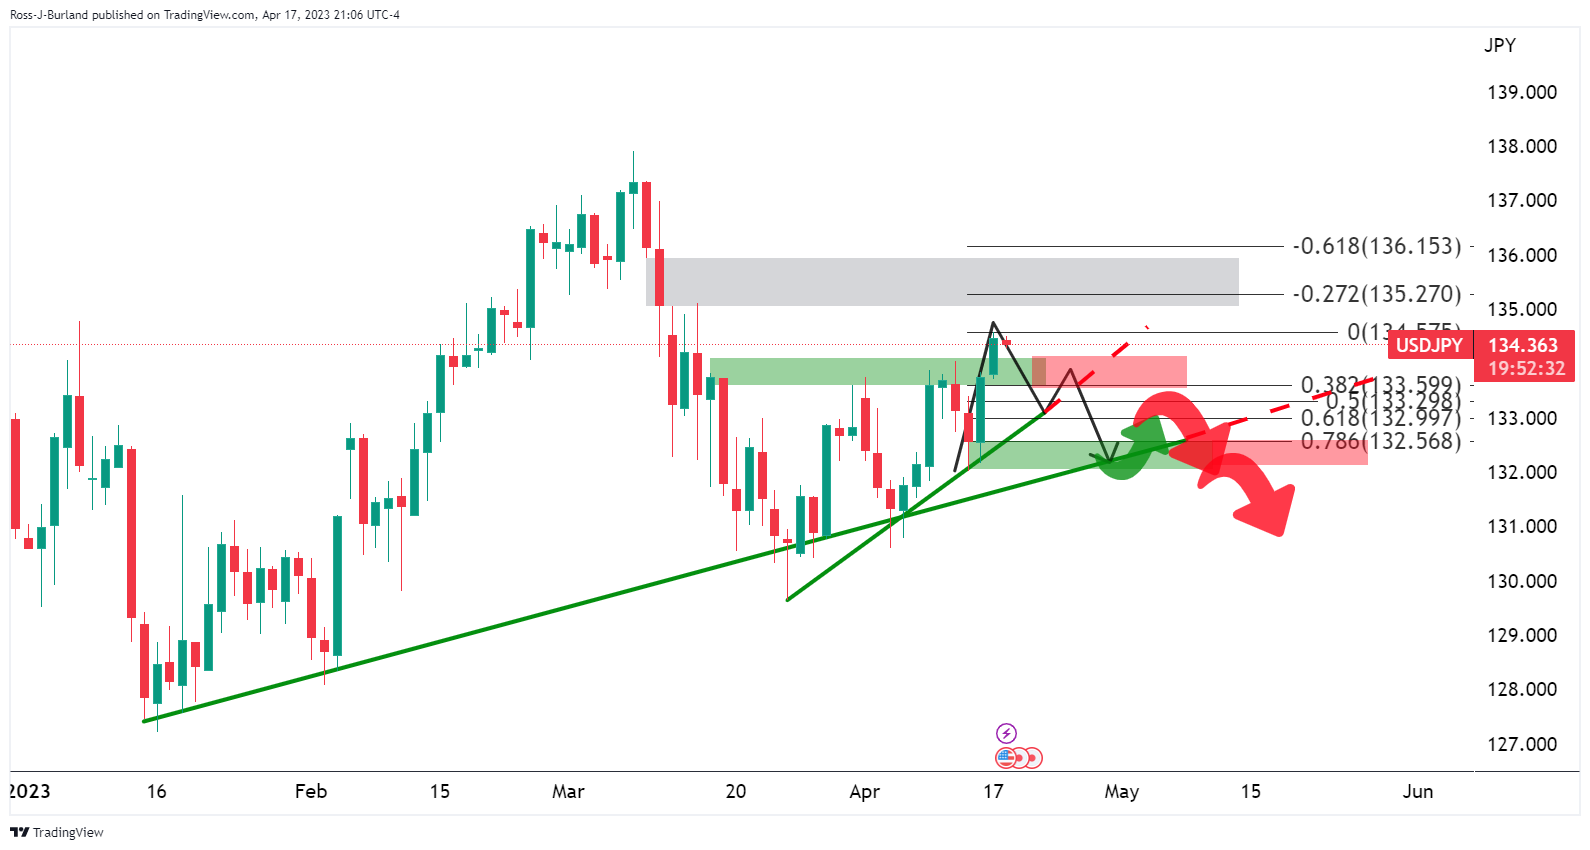
The above chart illustrates a theoretical bearish schematic.


© 2000-2026. All rights reserved.
This site is managed by Teletrade D.J. LLC 2351 LLC 2022 (Euro House, Richmond Hill Road, Kingstown, VC0100, St. Vincent and the Grenadines).
The information on this website is for informational purposes only and does not constitute any investment advice.
The company does not serve or provide services to customers who are residents of the US, Canada, Iran, The Democratic People's Republic of Korea, Yemen and FATF blacklisted countries.
Making transactions on financial markets with marginal financial instruments opens up wide possibilities and allows investors who are willing to take risks to earn high profits, carrying a potentially high risk of losses at the same time. Therefore you should responsibly approach the issue of choosing the appropriate investment strategy, taking the available resources into account, before starting trading.
Use of the information: full or partial use of materials from this website must always be referenced to TeleTrade as the source of information. Use of the materials on the Internet must be accompanied by a hyperlink to teletrade.org. Automatic import of materials and information from this website is prohibited.
Please contact our PR department if you have any questions or need assistance at pr@teletrade.global.
transfers