- Analytics
- News and Tools
- Market News
CFD Markets News and Forecasts — 10-03-2021
| Time | Country | Event | Period | Previous value | Forecast |
|---|---|---|---|---|---|
| 00:00 (GMT) | Australia | Consumer Inflation Expectation | March | 3.7% | |
| 08:00 (GMT) | Switzerland | SECO Economic Forecasts | |||
| 12:45 (GMT) | Eurozone | ECB Interest Rate Decision | 0% | ||
| 13:30 (GMT) | U.S. | Continuing Jobless Claims | February | ||
| 13:30 (GMT) | U.S. | Initial Jobless Claims | March | ||
| 13:30 (GMT) | Eurozone | ECB Press Conference | |||
| 15:00 (GMT) | U.S. | JOLTs Job Openings | January | 6.646 | |
| 18:30 (GMT) | Canada | BOC Deputy Governor Lawrence Schembri Speaks | |||
| 21:30 (GMT) | New Zealand | Business NZ PMI | February | 57.5 | |
| 23:50 (GMT) | Japan | BSI Manufacturing Index | Quarter I | 21.6 |
FXStreet notes that the prices of industrial metals have continued to climb higher in recent months as fiscal stimulus in China has prompted a surge in demand. In fact, since the start of the year, the price of copper has risen by around 12% and aluminium by 6%. Despite this, strategists at Capital Economics think that prices will end the year lower.
“Prices seem to have lost touch with their fundamentals. For one, our in-house metals demand proxies suggest that prices cannot be justified by consumption patterns. What’s more, the latest PMI data suggest that economic activity in China is beginning to slow, with construction particularly hard hit.”
“Supply is set to bounce back. We expect production to revive strongly this year, in large part because virus-related restrictions on output will be eased. Moreover, high prevailing prices mean that firms are likely to maximise their output.”
“Prices may hold up in the first half of 2021, as investor risk appetite remains high and the global economy continues to recover, but we are confident that prices will fall by year-end. That said, we expect that in many cases prices will still be higher than their pre-virus levels.”
The U.S. Energy
Information Administration (EIA) revealed on Wednesday that crude inventories climbed
by 13.798 million barrels in the week ended March 5, following a record build
of 21.563 million barrels in the previous week. Economists had forecast a gain
of 0.816 million barrels.
At the same
time, gasoline stocks tumbled 11.869 million barrels, while analysts had
expected a decline of 3.467 million barrels. Distillate stocks plunged by 5.504
million barrels, while analysts had forecast a drop of 3.533 million barrels.
Meanwhile, oil
production in the U.S. surged by 900,000 barrels a day to 10.900 million
barrels a day.
U.S. crude oil
imports averaged 5.7 million barrels per day last week, decreased by 0.6
million barrels per day from the previous week.
The Bank of
Canada (BoC) maintained its benchmark interest rates unchanged at 0.25 percent
on Wednesday, as widely expected.
In its policy
statement, the Canadian central bank noted:
- Canada’s economy is proving to be more resilient than anticipated to second wave of Covid and associated containment measures;
- GDP growth in Q1 is now expected to be positive, rather than contraction forecast in January;
- Consumers and businesses are adapting to containment measures, and housing market activity has been much stronger than expected; improving foreign demand and higher commodity prices have also brightened the prospects for exports and business investment;
- Despite stronger near-term outlook, there is still considerable economic slack and uncertainty about evolution of the virus and economic growth;
- Labour market is long way from recovery;
- Spread of more transmissible variants of the virus poses largest downside risk to activity;
- CPI inflation is near the bottom of 1-3 percent target band but is likely to move temporarily to around top of the band in next few months due to base-year effects;
- While economic prospects have improved, BoC’s Governing Council judges that recovery continues to require extraordinary monetary policy support;
- We remain committed to holding policy interest rate at the effective lower bound until economic slack is absorbed so that 2 percent inflation target is sustainably achieved (BoC’s January projection suggests this does not happen until into 2023);
- To reinforce this commitment and keep interest rates low across the yield curve, BoC will continue its QE program until recovery is well underway;
- As Governing Council continues to gain confidence in the strength of recovery, the pace of net purchases of Government of Canada bonds will be adjusted as required;
- We will continue to provide the appropriate degree of monetary policy stimulus to support the recovery and achieve the inflation objective.
- Says Russia will increase oil output by 890,000 bpd from May
- Expects oil inventories falling to 5-year average in 2021
- Sees demand at pre-crisis level in 2022
- Sees risk that non-OPEC+ raises output amid higher oil prices
U.S. stock-index futures rose on Wednesday, as investors reacted positively to the U.S. February CPI data, which showed underlying inflation remained tame, easing worries about an increase in borrowing costs in the near term.
Global Stocks:
Index/commodity | Last | Today's Change, points | Today's Change, % |
Nikkei | 29,036.56 | +8.62 | +0.03% |
Hang Seng | 28,907.52 | +134.29 | +0.47% |
Shanghai | 3,357.74 | -1.55 | -0.05% |
S&P/ASX | 6,714.10 | -57.10 | -0.84% |
FTSE | 6,718.55 | -11.79 | -0.18% |
CAC | 5,967.51 | +42.54 | +0.72% |
DAX | 14,516.91 | +78.97 | +0.55% |
Crude oil | $64.55 | +0.84% | |
Gold | $1,716.20 | -0.04% |
(company / ticker / price / change ($/%) / volume)
3M Co | MMM | 181.84 | 0.66(0.36%) | 1330 |
ALCOA INC. | AA | 30.43 | 0.49(1.64%) | 28524 |
ALTRIA GROUP INC. | MO | 47.8 | 0.12(0.25%) | 24583 |
Amazon.com Inc., NASDAQ | AMZN | 3,080.20 | 17.35(0.57%) | 44288 |
American Express Co | AXP | 145.53 | 0.43(0.30%) | 2485 |
AMERICAN INTERNATIONAL GROUP | AIG | 46.83 | 0.21(0.45%) | 577 |
Apple Inc. | AAPL | 121.39 | 0.31(0.25%) | 2432016 |
AT&T Inc | T | 29.74 | 0.10(0.34%) | 67498 |
Boeing Co | BA | 234.6 | 3.99(1.73%) | 273737 |
Chevron Corp | CVX | 109.4 | -0.10(-0.09%) | 56644 |
Cisco Systems Inc | CSCO | 48.04 | 0.15(0.31%) | 48469 |
Citigroup Inc., NYSE | C | 71.4 | 0.41(0.58%) | 57417 |
Exxon Mobil Corp | XOM | 60.14 | 0.21(0.35%) | 170002 |
Facebook, Inc. | FB | 267.5 | 1.76(0.66%) | 84093 |
FedEx Corporation, NYSE | FDX | 259.39 | 1.47(0.57%) | 4023 |
Ford Motor Co. | F | 12.69 | 0.12(0.95%) | 458601 |
Freeport-McMoRan Copper & Gold Inc., NYSE | FCX | 34.01 | 0.15(0.44%) | 84830 |
General Electric Co | GE | 13.72 | -0.28(-2.00%) | 7367565 |
General Motors Company, NYSE | GM | 55.01 | 0.36(0.66%) | 82630 |
Goldman Sachs | GS | 332.28 | 1.69(0.51%) | 6130 |
Home Depot Inc | HD | 265.5 | 2.19(0.83%) | 13426 |
Intel Corp | INTC | 62.72 | 0.05(0.08%) | 101170 |
International Business Machines Co... | IBM | 125.5 | 1.32(1.06%) | 13173 |
International Paper Company | IP | 54.2 | -0.59(-1.08%) | 172 |
Johnson & Johnson | JNJ | 158.85 | 1.15(0.73%) | 38545 |
JPMorgan Chase and Co | JPM | 152.5 | 0.67(0.44%) | 32412 |
McDonald's Corp | MCD | 208.98 | 0.43(0.21%) | 2439 |
Merck & Co Inc | MRK | 74.86 | 0.72(0.97%) | 24982 |
Microsoft Corp | MSFT | 234.9 | 1.12(0.48%) | 152156 |
Nike | NKE | 136.99 | 1.04(0.77%) | 5266 |
Pfizer Inc | PFE | 34.56 | 0.11(0.32%) | 112046 |
Procter & Gamble Co | PG | 126.3 | 0.12(0.10%) | 1890 |
Starbucks Corporation, NASDAQ | SBUX | 106.84 | 0.29(0.27%) | 12157 |
Tesla Motors, Inc., NASDAQ | TSLA | 695.9 | 22.32(3.31%) | 1844752 |
The Coca-Cola Co | KO | 51.02 | 0.16(0.31%) | 54646 |
Twitter, Inc., NYSE | TWTR | 68.68 | 1.16(1.72%) | 148068 |
UnitedHealth Group Inc | UNH | 353 | 1.02(0.29%) | 1075 |
Verizon Communications Inc | VZ | 56.4 | 0.20(0.36%) | 33407 |
Visa | V | 221.03 | 0.67(0.30%) | 12998 |
Wal-Mart Stores Inc | WMT | 129.23 | 0.34(0.26%) | 56387 |
Walt Disney Co | DIS | 197.2 | 2.69(1.38%) | 127189 |
Yandex N.V., NASDAQ | YNDX | 63.89 | 0.40(0.63%) | 16862 |
FXStreet reports that S&P 500 has extended its recovery for a break above its near-term downtrend to inject an upward bias in what analysts at Credit Suisse still look to be a lengthier consolidation phase within the core bull trend. The index is also back above its now rising 13-day exponential average as well as its rising 63-day average, now at 3799.
“Whilst we suspect strength can extend further near-term, we remain of the view a lengthy consolidation/corrective phase is still likely and we are thus reluctant to materially chase either strength or weakness. Our base case remains though to view this consolidation as a temporary pause in the core underlying uptrend.”
“The immediate risk is seen higher in the range with resistance seen at 3904 initially, then 3915.”
“Near-term support moves to 3852/47, with a break below 3819 needed to reinforce thoughts of a broader range with support then seen at the 63-day average at 3799. A close below here would warn of a retest of the 3723 low.”
Chevron (CVX) resumed with a Neutral at Citigroup; target $105
Chevron (CVX) target raised to $113 from $111 at Cowen
Chevron (CVX) downgraded to Sector Perform from Sector Outperform at Scotiabank; target $115
The Labor
Department announced on Wednesday the U.S. consumer price index (CPI) rose 0.4
percent m-o-m in February, following an unrevised 0.3 percent m-o-m gain in the
previous month.
Over the last
12 months, the CPI increased 1.7 percent y-o-y, accelerating from +1.4 percent y-o-y
reported for the period ending in January. This was the highest reading since February
2020.
Economists had
forecast the CPI to increase 0.4 percent m-o-m and 1.7 percent y-o-y in the
12-month period.
According to
the report, a 6.4 percent m-o-m jump in the gasoline index accounted for over
half of the seasonally adjusted increase in the all items index in February. In
addition, the energy index surged 3.9 percent m-o-m and the food index rose 0.2
percent m-o-m.
Meanwhile, the
core CPI excluding volatile food and fuel costs edged up 0.1 percent m-o-m in February
after an unrevised flat m-o-m figure in the previous month.
In the 12
months through February, the core CPI rose 1.3 percent compared to an unrevised
1.4 percent surge for the 12 months ending January.
Economists had
forecast the core CPI to increase 0.2 percent m-o-m and to jump 1.4 percent
y-o-y last month.
FXStreet reports that EUR/USD has stabilized as expected at the rising 200-day moving average (DMA), currently seen at 1.1826 and analysts at Credit Suisse continue to look for a floor here, for now at least. Big picture though, the risk is seen growing for a break lower to expose the 38.2% retracement of the entire 2020/2021 uptrend at 1.1695.
“EUR/USD has stabilized for now as expected just ahead of our target of the rising 200-day average, currently seen at 1.1826. With further price resistance not far below from the late November low at 1.1800, we continue to look for a floor in this 1.1823/00 zone, for now at least.”
“Post a near-term rebound, our bias stays lower for a closing break of 1.1826 to see the risk stay directly bearish with support then seen next 1.1800 ahead of 1.1745 and then more importantly at the 38.2% retracement of the entire 2020/2021 uptrend at 1.1695, with a fresh floor expected here.”
| Time | Country | Event | Period | Previous value | Forecast | Actual |
|---|---|---|---|---|---|---|
| 07:45 | France | Industrial Production, m/m | January | -0.7% | 0.5% | 3.3% |
USD strengthened against its major rivals in the European session on Wednesday, as investors awaited the U.S. CPI data due later today (13:30 GMT), which are expected to show a slight acceleration in a consumer price increase in February.
The U.S. Dollar Index (DXY), measuring the U.S. currency's value relative to a basket of foreign currencies, rose 0.11% to 92.06.
Meanwhile, the U.S. Treasury yields declined, following the first auction this week of a total of $120 billion in new government debt, which revealed a solid overall demand for 3-year Treasuries. The 10-year Treasury traded at 1.567% on Wednesday, down 3 basis points from 1.596% at Tuesday's close. But market participants worry that the yields could spike in case of weak demand in the 10-year auction later today or 30-year auction tomorrow.
The U.S. dollar index has closely tracked climbs in U.S. Treasury yields in recent weeks, both because higher yields heighten the currency’s appeal and as the turmoil in the bond market shakes investor confidence, bolstering demand for the safest assets.
The U.S. currency was also supported by the OECD's newly-released estimates for the U.S. economy, which now suggest that the world's biggest economy will grow 6.5% in 2021.
AUD/USD: Selling pressure looks diminished - UOB
FXStreet reports that in the opinion of FX Strategists at UOB Group, the downward pressure in AUD/USD seems to have lost impulse.
24-hour view: “Our view for AUD yesterday was that ‘a break of the major support at 0.7625 would not be surprising but AUD is unlikely able to maintain a foothold below the next support at 0.7600’. While AUD subsequently breached 0.7625 and dropped to 0.7621, the swift bounce from the low came as a surprise (high has been 0.7726). The rapid rebound appears to be overdone and further sustained advance in AUD is unlikely. AUD is more likely to consolidate and trade within a 0.7660/0.7740 range.”
Next 1-3 weeks: “While AUD breached the 0.7625 level, it rebounded strongly after touching 0.7621. Downward momentum has waned and a break of 0.7740 (no change in ‘strong resistance’ level) would indicate that the current downside risk has dissipated. Barring a sudden surge in downward momentum within these 1 to 2 days, a break of 0.7740 would not be surprising.”
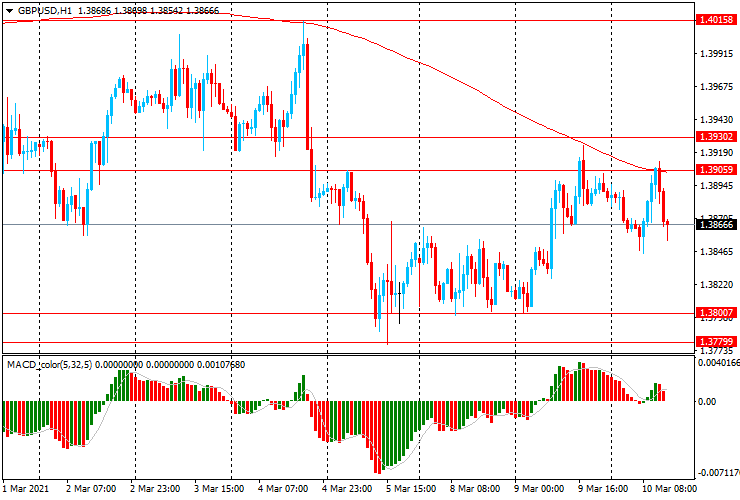
Today, the GBP/USD pair is trading in the range of $1.3845-1.3910, having retreated from a one-month low yesterday. On the hourly chart, the pair remains below the moving average line MA (200) H1 ($1.3905), but on the four-hour chart it broke through MA (200) H4 ($1.3845). Technically speaking, the resistance of $1.3905-30 may keep prices from rising further. If it breaks through, the pair may rise to $1.4015. The lower bound of $1.3775 represents the nearest support level.
⦁ Resistance levels are: $1.3905-30, $1.4015, $1.4085
⦁ Support levels are: $1.3775-1.3800, $1.3680, $1.3565
The main scenario for the pair's promotion - if the resistance of $1.3905-30 (March 5 and 9 highs, session high, MA (200) H1) is broken, the pair can rise to $1.4015 (March 4 high)
An alternative scenario - correction and may be a decline to $1.3775-1.3800 (March 5-9 lows)
U.S. weekly
mortgage applications drop 1.3 percent
The Mortgage
Bankers Association (MBA) reported on Wednesday the mortgage application volume
in the U.S. fell 1.3 percent in the week ended March 5, following a 0.5 percent
increase in the previous week.
According to
the report, refinance applications declined 5.0 percent, while applications to
purchase a home went surged 7.2 percent.
Meanwhile, the
average fixed 30-year mortgage rate climbed from 3.23 percent to 3.26 percent,
the highest since the week ended July 3.
“Signs of
faster economic growth, an improving job market and increased vaccine
distribution are pushing rates higher,” noted Joel Kan, MBA’s associate vice
president of economic and industry forecasting. “The run-up in mortgage rates
continues to cool demand for refinance applications. Activity declined last
week for the fourth time in five weeks.”
FXStreet reports that economists at OCBC Bank note that the USD/CAD will look to the Bank of Canada (15:00 GMT) for further directionality, with a breach of the 1.2600 to 1.2750 range potentially at hand.
“Policy tweaks are not expected. They should continue to sound optimistic, and perhaps lay down some groundwork for a reduction in asset purchases (at C$4b/week now) in the coming meetings."
“There is potential for the USD/CAD pair to breach the 1.2600-1.2750 range, pending the market read on the BoC decision.”
FXStreet reports that FX Strategists at UOB Group notes that extra gains in USD/JPY now look under pressure.
24-hour view: “Our expectation for USD to ‘grind higher to 109.50’ was incorrect as it fell sharply to an overnight low of 108.40 (high has been 109.23). Upward momentum has more or less dissipated and the current movement is viewed as part of a consolidation phase. In other words, USD is expected to trade sideways, likely within a 108.30/108.95 range.”
Next 1-3 weeks: “USD subsequently rose to a fresh high of 109.23 but the advance was short-lived as it fell sharply to an overnight low of 108.40. Rapid loss in shorter-term momentum has diminished the odds for further USD strength but only a break of 108.00 (no change in ‘strong support’ level) would indicate that 109.23 is the extent of the current positive phase in USD.”
FXStreet reports that GBP/USD maintains a “head & shoulders” top and analysts at Credit Suisse stay biased lower for a deeper corrective setback to the 55-day moving average (DMA) at 1.3753.
“Cable’s strength has been capped at the 13-day exponential average at 1.3905 and with a small ‘head & shoulders’ top in place we continue to look for a more concerted phase of corrective weakness. Below 1.3800 is needed to add weight to this view for a fall back to 1.3779/76, then the 55-day average at 1.3753, which we look to hold at first.”
“Our bias is now for a break below the 55-day average at 1.3753 for a test of 1.3741/31 next and then the medium-term uptrend from March 2020, today seen at 1.3680."
FXStreet reports that economists at Natixis believe this rise in long-term interest rates is not dangerous, and may even be good news for several reasons.
“As long as long-term interest rates are lower than growth rates, there cannot be any solvency problem for borrowers, since debt ratios spontaneously decline (debt increases at the rate of interest and so is outpaced by income growth). In this configuration, asset values can remain very high, since assets’ fundamental value is infinite: the discounted sum of future dividends or rents tends to infinity as long as the interest rate is lower than growth.”
“The steepening of the yield curve has the beneficial effect of lifting banks’ profitability by increasing intermediation margins, thereby enabling an increase in the supply of bank credit. A gradual rise in long-term interest rates reduces the risk of asset price bubbles and abnormally low risk premia.”
Reuters reports that data from the country's statistics service ELSTAT showed that Greece's annual EU-harmonised inflation stayed negative for an 11th month in a row in February.
The reading was -1.9% year-on-year from -2.4% in January. The data also showed headline consumer price inflation at -1.3%, from -2.0% in the previous month.
Prices were led lower by transport, housing and consumer durables, affected by a second lockdown the country imposed to stem a surge in COVID-19 infections.
Greece went through a deflationary phase during its debt crisis as wage and pension cuts and a lengthy recession took a heavy toll on household incomes.
FXStreet reports that Benjamin Wong, Strategist at DBS Bank said that XAU/USD driven towards a test of a 1,660-1,670 support confluence zone.
“Gold ETF demand sprouted from September 2019 onwards, and back-testing that against an average line costing, such holdings are average costed around 1680. Both gold longs either on ETFs or futures positioning are reducing longs – hence, unless gold secures a sustained return over 1,760-1,765 and the 200-day moving average at 1,859, the risks would be both ways until the bull reasserts its presence.”
FXStreet reports that economists at Danske Bank expect higher long-term US yields, but mainly in the second half of the year.
“We expect US rates and yields to continue to tick up in H2 21 as the US recovery gains speed, inflation expectations and real interest rates continue to rise and markets really begin to discuss the timing of Fed QE tapering. 10Y US yields look set to hit 2.1% by the end of 2021.”
“The markets are likely to reprice the Fed, pricing earlier and a larger number of policy rate hikes, putting further upward pressure on 5Y US yields. We expect no US rate hikes for the next two years, but the market could well begin to speculate with a vengeance in the Fed hiking as early as 2022.”
CNBC reports that US inflation is just warming up, but by late spring it could get downright hot, even if temporarily.
February’s consumer price index — a measure of inflation — is expected to be up moderately when it is released Wednesday at 13:30 GMT. By May, the pace of headline consumer inflation on an annualized basis could be double February’s pace.
The debate in the market is whether the spike is transitory as the Fed and many economists say, or the start of a bigger trend.
Economists expect the consumer price index rose 0.4% in February, or up 1.7% from a year ago. That compares to a 0.3% increase in January, and a 1.4% rise on an annual basis.
When energy and food are excluded, the core CPI is expected to be up 0.1% in February, or an annual pace of 1.3%.
Signs of inflation are already showing up in the goods side of the economy, and economists expects that to spread to the service side.
Consumers will soon be armed with another stimulus check. Pent-up demand should start sending up prices on things like airfare, public transportation, hotels, dining out, and rental cars as more people feel comfortable leaving their homes.
FXStreet reports that economists at Westpac believe in the US and the dollar strengthened further this month but continue to think the USD upturn will prove transitory.
“Our core view remains that the recovery in global growth will be greater in scale and longevity than that seen in the US, seeing DXY fall back through the 91.0 level of 5 February by December 2021, to just below 88.0 towards the end of 2022.”
“Currently, the growth differential between the US and DXY constituents is heavily in favour of the US, particularly for euro. Immediate market expectations for growth are similarly skewed towards the US; but the US stimulus that is driving both actual and expected outcomes is heavily front-loaded in 2021, after which US growth prospects become more uncertain.”
Reuters reports that according to the data from People's Bank of China, Chinese banks extended 1.36 trillion yuan ($208.86 billion) in new local-currency loans in February. Analysts had predicted new yuan loans would fall to 950 billion yuan in February, down from 3.58 trillion yuan in the previous month and compared with 905.7 billion yuan a year earlier.
Broad M2 money supply in February grew 10.1% from a year earlier, above estimates of 9.4% forecast in the Reuters poll. It rose 9.4% in January.
eFXdata reports that MUFG Research discusses USD/JPY outlook.
"According to technical indicators such as the RSI, USD/JPY is now the most overbought since late in 2016. On that occasion USD/JPY jumped from just below the 105.00-level to a high of 118.66 between November and December 2016 before falling back towards the 110.00-level in the following months. A similar setup is also evident for the 10-year US Treasury yield where the RSI recently reached its most overbought levels since late 2016. The historical precedent suggests that USD/JPY is likely to correct lower from overbought levels once the sharp move higher in longterm US yields loses upward momentum," MUFG adds.
| Time | Country | Event | Period | Previous value | Forecast | Actual |
|---|---|---|---|---|---|---|
| 01:30 | China | PPI y/y | February | 0.3% | 1.5% | 1.7% |
| 01:30 | China | CPI y/y | February | -0.3% | -0.4% | -0.2% |
| 07:45 | France | Industrial Production, m/m | January | -0.7% | 0.5% | 3.3% |
During today's Asian trading, the dollar rose against the euro and the yen. The ICE index, which tracks the dollar's performance against six currencies (euro, swiss franc, yen, canadian dollar, pound sterling and swedish krona), rose 0.17%.
The dollar fell on the eve of a decline in US Treasury yields on the background of a general increase in risk appetite due to growing expectations of the adoption by the US Congress of a package of measures to support the economy of $1.9 trillion, proposed by US President Joe Biden.
The U.S. Senate over the weekend approved the stimulus package, making some changes to the draft of the House of Representatives, which now has to approve the final version of the bill.
Support for the dollar, despite the general increase in risk appetite, which usually contributes to the weakening of the US currency, is provided by the optimism of traders associated with expectations of a rapid recovery in the US economy. Meanwhile, the yen, also considered a "safe haven" asset, is getting cheaper relative to most of the world's major currencies.
Meanwhile, the head of the Reserve Bank of Australia, Philip Lowe, made it clear that expectations of a rise in the Central Bank's base rate in 2022 are unfounded. "In the last couple of weeks, financial markets have begun to lay the possibility of a rate hike as early as 2022 and then again in 2023. We do not share these expectations, " Lowe said during a conference on Wednesday.
According to the report from Insee, in January 2021, output bounced back in the manufacturing industry (+3.3%, after −1.4%) as well as in the whole industry (+3.3%, after −0.7%). Economists had expected a 0.5% increase in the whole industry. Compared to February 2020 (the last month before the first general lockdown), output remained lower in the manufacturing industry (−2.6%), as well as in the whole industry (−1.7%).
In January, output recovered sharply in “other manufacturing” (+3.9% after −0.8%) and in the manufacture of machinery and equipment goods (+8.4% after −3.3%). It remained dynamic in mining and quarrying, energy, water supply (+2.9% after +3.4%). It bounced back in the manufacture of food products and beverages (+1.6% after −2.0%) and in the manufacture of coke and refined petroleum due to the re-opening of several refineries that had been shut down over the previous month (+7.2% after−30.7%). Conversely, it fell back in the manufacture of transport equipment (−2.9% after +1.2%).
In January 2021, output yet remained below its February 2020 level in most industrial activities. It slumped in the manufacture of coke and refined petroleum (−27.3%) and in the manufacture of transport equipment (−16.0%), especially in the manufacture of other transport equipment (−22.9%). Compared to February 2020, output increased in the manufacture of machinery and equipment goods (+1.2%). It edged up in “other manufacturing” (+0.2%), thanks to pharmaceuticals (+25.6%), while most sub-branches in "other manufacturing" remained behind.
FXStreet reports that analysts at the ING bank said that “Fed believes there is enough spare capacity in the economy to dampen price pressures.”
“Annual rates will start to rise quickly though in March-July as price pressures in a depressed, locked down economy 12 months ago are compared with price levels in a vibrant re-opening economy in 2021.”
“We expect to see headline inflation move above 3.5% in 2Q which could lead to a change in language from the Fed at the June FOMC meeting surrounding the prospects for a tapering of asset purchases.”
“We also think inflation could be stickier due to improved corporate pricing power in a supply-constrained economy.”
EUR/USD
Resistance levels (open interest**, contracts)
$1.2058 (285)
$1.2029 (459)
$1.2004 (3712)
Price at time of writing this review: $1.1881
Support levels (open interest**, contracts):
$1.1822 (1145)
$1.1772 (2816)
$1.1757 (2263)
Comments:
- Overall open interest on the CALL options and PUT options with the expiration date April, 9 is 46954 contracts (according to data from March, 9) with the maximum number of contracts with strike price $1,1900 (3712);
GBP/USD
$1.4074 (358)
$1.4013 (705)
$1.3928 (675)
Price at time of writing this review: $1.3872
Support levels (open interest**, contracts):
$1.3769 (290)
$1.3751 (505)
$1.3705 (1916)
Comments:
- Overall open interest on the CALL options with the expiration date April, 9 is 7314 contracts, with the maximum number of contracts with strike price $1,4100 (1230);
- Overall open interest on the PUT options with the expiration date April, 9 is 16550 contracts, with the maximum number of contracts with strike price $1,3200 (3386);
- The ratio of PUT/CALL was 2.26 versus 2.26 from the previous trading day according to data from March, 9
* - The Chicago Mercantile Exchange bulletin (CME) is used for the calculation.
** - Open interest takes into account the total number of option contracts that are open at the moment.
CNBC reports that according to S&P Global Ratings’ Asia-Pacific chief economist, China’s services sector has been slow to rebound from the Covid-19 pandemic — and that’s one aspect of its economic recovery that’s been downplayed.
China was the only major economy that grew last year despite challenges posed by the Covid-19 pandemic. It reported a growth of 2.3% in 2020, but the performance across sectors was uneven with exports staying resilient while consumption has continued to lag.
“This is one of the most understated aspect of China’s recovery, the fact that it is so unbalanced. China’s Covid strategy has been successful from a health perspective, but it is imposing a long-run economic cost in the sense that ... we’re seeing the services sector come back much more slowly than people thought. That’s depressing jobs and that in turn is depressing consumer confidence,” Shaun Roache told CNBC.
Roache pointed out that Chinese retail sales have not recovered to levels seen before the pandemic. For most of 2019, China reported monthly retail sales growth of above 8% year-on-year. But sales have been contracting every month since March last year, as Covid-19 forced large swathes of the economy to shut down.
Reuters reports that according to the report from the National Bureau of Statistics, China's factory gate prices rose at the fastest pace since November 2018 in February as manufacturers raced to fill export orders.
The producer price index (PPI) rose 1.7% from a year earlier, compared with the median forecast for a 1.5% rise and speeding up from a 0.3% pickup in January. The price data, in part driven by a low base a year earlier, was slightly firmer than expected.
As producer prices extended their gains, consumer inflation remained downbeat, suggesting continued subdued household demand, a lagging driver of broader economic growth.
The consumer price index fell 0.2% in February from a year earlier, the statistics bureau said in a separate statement, compared with the median forecast for a 0.4% fall and a 0.3% decline in January.
"We do not think the recent period of consumer price deflation is likely to persist. Shifting pork price base effects will nudge up food inflation, a tightening labour market will push up core inflation and energy inflation will rebound thanks to rising oil prices," said Julian Evans-Pritchard, senior China economist at Capital Economics, in a note.
| Time | Country | Event | Period | Previous value | Forecast |
|---|---|---|---|---|---|
| 01:30 (GMT) | China | PPI y/y | February | 0.3% | |
| 01:30 (GMT) | China | CPI y/y | February | -0.3% | |
| 07:45 (GMT) | France | Industrial Production, m/m | January | -0.8% | |
| 13:30 (GMT) | U.S. | CPI, m/m | February | 0.3% | 0.4% |
| 13:30 (GMT) | U.S. | CPI excluding food and energy, m/m | February | 0% | 0.2% |
| 13:30 (GMT) | U.S. | CPI excluding food and energy, Y/Y | February | 1.4% | 1.4% |
| 13:30 (GMT) | U.S. | CPI, Y/Y | February | 1.4% | 1.6% |
| 15:00 (GMT) | Canada | Bank of Canada Rate | 0.25% | ||
| 15:30 (GMT) | U.S. | Crude Oil Inventories | March | 21.563 | |
| 19:00 (GMT) | U.S. | Federal budget | February | -163 | |
| 21:45 (GMT) | New Zealand | Food Prices Index, y/y | February | 2.1% |
| Pare | Closed | Change, % |
|---|---|---|
| AUDUSD | 0.77198 | 1.05 |
| EURJPY | 129.094 | 0.13 |
| EURUSD | 1.18983 | 0.44 |
| GBPJPY | 150.66 | 0.15 |
| GBPUSD | 1.38867 | 0.48 |
| NZDUSD | 0.71728 | 0.75 |
| USDCAD | 1.264 | -0.15 |
| USDCHF | 0.92792 | -0.75 |
| USDJPY | 108.489 | -0.3 |


© 2000-2026. All rights reserved.
This site is managed by Teletrade D.J. LLC 2351 LLC 2022 (Euro House, Richmond Hill Road, Kingstown, VC0100, St. Vincent and the Grenadines).
The information on this website is for informational purposes only and does not constitute any investment advice.
The company does not serve or provide services to customers who are residents of the US, Canada, Iran, The Democratic People's Republic of Korea, Yemen and FATF blacklisted countries.
Making transactions on financial markets with marginal financial instruments opens up wide possibilities and allows investors who are willing to take risks to earn high profits, carrying a potentially high risk of losses at the same time. Therefore you should responsibly approach the issue of choosing the appropriate investment strategy, taking the available resources into account, before starting trading.
Use of the information: full or partial use of materials from this website must always be referenced to TeleTrade as the source of information. Use of the materials on the Internet must be accompanied by a hyperlink to teletrade.org. Automatic import of materials and information from this website is prohibited.
Please contact our PR department if you have any questions or need assistance at pr@teletrade.global.
transfers