- Analytics
- News and Tools
- Market News
CFD Markets News and Forecasts — 14-05-2021
On Monday, at 02:00 GMT, China will announce changes in fixed asset investment, industrial production and retail trade for April. At 06:00 GMT, Japan will announce a change in machine tool orders for April. At 06:30 GMT, Switzerland will publish the producer and import price index for April. At 10:00 GMT, in Germany, the Bundesbank's monthly report will be released. The Eurogroup will also meet on Monday. At 12:15 GMT, Canada will announce a change in housing starts for April, and at 12:30 GMT - a change in foreign securities purchases for March. Also at 12: 30 GMT, the US will publish the NY Fed Empire State manufacturing index for May. At 14:00 GMT, the US will present the NAHB housing market index for May. At 20: 00 GMT, the US will report changes in the net and total volume of purchases of long-term US securities by foreign investors for March. At 23:50 GMT, Japan will announce the change in GDP for the 1st quarter.
On Tuesday, at 01:30 GMT, Australia will release the RBA Meeting's Minutes. At 04:30 GMT, Japan will present the index of activity in the service sector for March. At 06:00 GMT, Britain will report changes in the number of applications for unemployment benefits for April, as well as the unemployment rate and average earnings for March. At 09:00 GMT, the euro zone will announce changes in GDP and employment for the 1st quarter, as well as the foreign trade balance for March. At 12:30 GMT, the United States will announce changes in building permits and the housing starts for April. At 22:45 GMT, New Zealand will present the producer price index for the 1st quarter.
On Wednesday, at 00:30 GMT, Australia will release the leading economic indicators index from MI and the consumer confidence index from Westpac for May. At 01:30 GMT, Australia will publish the labor cost index for the 1st quarter. At 04:30 GMT, Japan will announce a change in industrial production for March. At 06:00 GMT, Britain will present the consumer price index, the retail price index, the producer purchase price index and the producer selling price index for April. At 09:00 GMT, the euro zone will publish the consumer price index for April. At 12:30 GMT, Canada will release the consumer price index for April. At 14: 30, the United States will announce changes in oil reserves according to the Department of Energy. At 18:00 GMT, the US will publish the Fed meeting minutes for April. At 23:50 GMT, Japan will announce changes in the volume of orders for machinery and equipment for March and the foreign trade balance for April.
On Thursday, at 01:30 GMT, Australia will report changes in the unemployment rate and the number of people employed for April. At 06:00 GMT, Germany will release the producer price index for April. At 08:00 GMT, the euro zone will announce a change in the balance of payments for March. At 10:00 GMT, Britain will publish the CBI industrial order books balance for May. At 12:30 GMT, Canada will release the new home price index for April. Also at 12: 30 GMT, the US will present the Fed-Philadelphia manufacturing index for May and announce a change in the number of initial applications for unemployment benefits. At 14:00 GMT, the US will publish the index of leading indicators for April. At 23:01 GMT, Britain will release the GfK consumer confidence indicator for May. At 23:30 GMT, Japan will present the consumer price index for April.
On Friday, at 00:30 GMT, Japan will release the manufacturing PMI and the service sector PMI for May. At 01:30 GMT, Australia will announce the change in retail sales for April. At 06:00 GMT, Britain will report the change in retail sales for April. Then the focus will be on the indices of business activity in the manufacturing sector and the service sector for April: at 07:15 GMT, France will report, at 07:30 GMT - Germany, at 08:00 GMT - the eurozone, and at 08:30 GMT - Britain. At 12:30 GMT, Canada will announce the change in retail sales for March. At 13:45 GMT, the US will publish the index of business activity in the manufacturing sector and the service sector for May. At 14:00 GMT, the US will announce the change in existing home sales for April. Also at 14:00 GMT, the euro zone will release the consumer confidence index for May. At 17:00 GMT, in the United States, the Baker Hughes report on the number of active oil drilling rigs will be released.
Statistics
Canada released its Monthly Survey of Manufacturing, which showed that the
Canadian manufacturing sales climbed 3.5 percent m-o-m in March to CAD57.84 billion
(highest level since June 2019), following a revised 1.1 percent m-o-m drop in February
(originally a 1.6 percent m-o-m decline). This marked the largest monthly
increase in manufacturing sales since July 2020.
Economists
had anticipated a gain of 3.5 percent m-o-m for March.
According
to the survey, sales grew in 17 of 21 industries, led by the motor vehicle (+10.5
percent m-o-m), petroleum and coal product (+6.2 percent m-o-m) and food manufacturing
(+2.7 percent m-o-m) industries.
Overall,
sales of durable goods surged 4.3 percent m-o-m in March, while sales of
non-durable goods rose 2.7 percent m-o-m.
The
Commerce Department announced on Friday that business inventories rose 0.3
percent m-o-m in March, following a revised 0.6 percent m-o-m gain in February
(originally a 0.5 percent m-o-m increase).
That
was in line with economists’ forecast for a 0.3 percent m-o-m advance.
According
to the report, stocks at wholesalers jumped 1.3 percent m-o-m, while inventories
at manufacturers rose by 0.7 percent m-o-m. At the same time, stocks at
retailers declined 1.4 percent m-o-m.
In
y-o-y terms, business inventories remained unchanged in March.
A report
from the University of Michigan revealed on Friday the preliminary reading for
the Reuters/Michigan index of consumer sentiment decreased 6.2 percent m-o-m to
82.8 in early May. This was the lowest reading since February.
Economists
had expected the index would increase to 90.4 this month from April’s final
reading of 88.3.
According
to the report, the index of current U.S. economic conditions fell 6.6 percent
m-o-m to 90.8 in May from 97.2 in the previous month. Meanwhile, the index of
consumer expectations dropped 6.2 percent m-o-m to 77.6 this month from 82.7 in
April.
“Consumer
confidence in early May tumbled due to higher inflation - the highest expected
year-ahead inflation rate as well as the highest long term inflation rate in
the past decade,” noted Surveys of Consumers chief economist, Richard Curtin. “Rising
inflation also meant that real income expectations were the weakest in five
years,” he added.
The
Federal Reserve reported on Friday the U.S. industrial production rose 0.7
percent m-o-m in April, following a revised 2.4 percent m-o-m gain in March
(originally a 1.4 percent m-o-m advance).
Economists
had forecast industrial production would increase 1.0 percent m-o-m in April.
According
to the report, the output of utilities surged 2.6 percent m-o-m
in April, while mining production grew 0.7 percent m-o-m and manufacturing
output rose 0.4 percent m-o-m, despite a drop in motor vehicle assemblies that
principally resulted from shortages of semiconductors.
Capacity
utilization for the industrial sector increased 0.5 percentage point m-o-m to
74.9 percent in April. That was 0.1 percentage point below economists’ forecast
and 4.7 percentage points below its long-run (1972-2020) average.
In y-o-y terms, the industrial output jumped
16.5 percent in April, following an unrevised 1.0 percent increase in the prior
month, but
it was 2.7 percent below its pre-pandemic level
U.S. stock-index futures rose on Friday, as the equities continued to rebound for the second consecutive day after a sharp sell-off earlier this week, despite disappointing U.S. retail sales data for April.
Global Stocks:
Index/commodity | Last | Today's Change, points | Today's Change, % |
Nikkei | 28,084.47 | +636.46 | +2.32% |
Hang Seng | 28,027.57 | +308.90 | +1.11% |
Shanghai | 3,490.38 | +60.84 | +1.77% |
S&P/ASX | 7,014.20 | +31.50 | +0.45% |
FTSE | 7,016.73 | +53.40 | +0.77% |
CAC | 6,353.96 | +65.63 | +1.04% |
DAX | 15,312.66 | +112.98 | +0.74% |
Crude oil | $64.37 | +0.86% | |
Gold | $1,836.70 | +0.70% |
- We're really focused on inflation expectations
- We should expect month-to-month volatility in data
- Fed's policy is in good place
- Time now is for watchful waiting, not adjusting policy
- Fed will stay on path until we get more people into job market
- We want to get back to maximum employment
(company / ticker / price / change ($/%) / volume)
3M Co | MMM | 203.6 | 0.19(0.09%) | 1321 |
ALTRIA GROUP INC. | MO | 50.35 | 0.23(0.46%) | 18633 |
Amazon.com Inc., NASDAQ | AMZN | 3,192.73 | 31.26(0.99%) | 27748 |
American Express Co | AXP | 155.5 | 1.42(0.92%) | 3173 |
Apple Inc. | AAPL | 126.53 | 1.56(1.25%) | 961982 |
AT&T Inc | T | 32.28 | 0.07(0.22%) | 42749 |
Boeing Co | BA | 225.5 | 2.86(1.28%) | 94047 |
Caterpillar Inc | CAT | 240.8 | 0.73(0.30%) | 6230 |
Chevron Corp | CVX | 107.85 | 1.17(1.10%) | 15113 |
Cisco Systems Inc | CSCO | 52.74 | 0.25(0.48%) | 23559 |
Citigroup Inc., NYSE | C | 75.59 | 0.30(0.40%) | 28233 |
Deere & Company, NYSE | DE | 380.5 | 2.39(0.63%) | 468 |
E. I. du Pont de Nemours and Co | DD | 82.52 | 0.90(1.10%) | 328 |
Exxon Mobil Corp | XOM | 59.9 | 0.60(1.01%) | 82316 |
Facebook, Inc. | FB | 308.04 | 2.78(0.91%) | 55143 |
FedEx Corporation, NYSE | FDX | 305 | 1.60(0.53%) | 4322 |
Ford Motor Co. | F | 11.63 | 0.08(0.69%) | 403902 |
Freeport-McMoRan Copper & Gold Inc., NYSE | FCX | 41.65 | -0.32(-0.76%) | 216702 |
General Electric Co | GE | 13.18 | 0.21(1.62%) | 814303 |
General Motors Company, NYSE | GM | 55.04 | 0.44(0.81%) | 75683 |
Goldman Sachs | GS | 361.84 | 3.03(0.84%) | 10055 |
Hewlett-Packard Co. | HPQ | 32.64 | 0.25(0.77%) | 1730 |
Home Depot Inc | HD | 327.49 | 2.07(0.64%) | 18801 |
HONEYWELL INTERNATIONAL INC. | HON | 225 | 1.32(0.59%) | 1027 |
Intel Corp | INTC | 54.49 | 0.48(0.89%) | 96649 |
International Business Machines Co... | IBM | 144.8 | 0.63(0.44%) | 17126 |
International Paper Company | IP | 62.5 | -0.02(-0.03%) | 180 |
Johnson & Johnson | JNJ | 170.5 | 0.54(0.32%) | 3724 |
JPMorgan Chase and Co | JPM | 162.18 | 0.68(0.42%) | 19634 |
McDonald's Corp | MCD | 231.62 | 1.85(0.81%) | 765 |
Merck & Co Inc | MRK | 78.88 | 0.19(0.24%) | 4986 |
Microsoft Corp | MSFT | 245.69 | 2.66(1.09%) | 114545 |
Nike | NKE | 134.42 | 0.81(0.61%) | 3021 |
Pfizer Inc | PFE | 40.16 | 0.06(0.15%) | 62821 |
Procter & Gamble Co | PG | 138.1 | 0.38(0.28%) | 1690 |
Starbucks Corporation, NASDAQ | SBUX | 110.85 | 0.36(0.33%) | 7543 |
Tesla Motors, Inc., NASDAQ | TSLA | 585 | 13.31(2.33%) | 568030 |
The Coca-Cola Co | KO | 54.65 | 0.14(0.26%) | 13690 |
Twitter, Inc., NYSE | TWTR | 50.6 | 0.49(0.98%) | 65634 |
UnitedHealth Group Inc | UNH | 410.5 | 1.94(0.47%) | 815 |
Verizon Communications Inc | VZ | 58.95 | 0.14(0.24%) | 13766 |
Visa | V | 225.98 | 2.24(1.00%) | 6291 |
Wal-Mart Stores Inc | WMT | 139 | 0.76(0.55%) | 11368 |
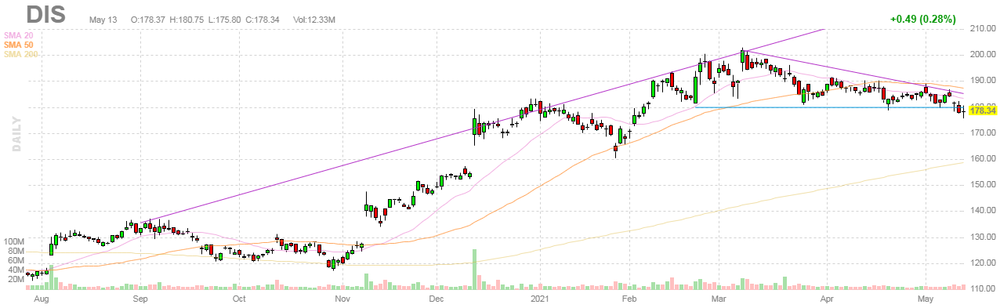
Walt Disney Co | DIS | 171.2 | -7.14(-4.00%) | 641557 |
Yandex N.V., NASDAQ | YNDX | 62.65 | 0.11(0.18%) | 9091 |
The
Commerce Department reported on Friday the sales at U.S. retailers were flat
m-o-m in April, following a revised 10.7 percent m-o-m surge in March
(originally a 9.8 percent m-o-m jump).
Economists
had expected total sales would increase 1.0 percent m-o-m in April.
According
to the report, advances in retail sales at food services and drinking places (+3.0
percent m-o-m), motor vehicles and part dealers (+2.9 percent m-o-m) and
electronics (+1.2 percent m-o-m) were offset by declines at clothing stores
(-5.1 percent m-o-m), general merchandise stores (-4.9 percent m-o-m), sporting
goods, hobby, musical instruments and books (-3.6 percent m-o-m), gasoline
stations (-1.1 percent m-o-m) and nonstore retailers (-0.6 percent m-o-m).
Excluding
auto, retail sales fell 0.8 percent m-o-m in April after a revised 9.0 percent
m-o-m jump in the previous month (originally an 8.4 percent m-o-m increase),
being worse than economists’ forecast of a 0.7 percent m-o-m gain.
Meanwhile, closely watched core retail sales,
which exclude automobiles, gasoline, building materials and food services, and
are used in GDP calculations, dropped 1.5 percent m-o-m in April after a
revised 7.6 percent m-o-m jump in March (originally a 6.9 percent m-o-m climb).
The
Labor Department reported on Friday the import-price index, measuring the cost
of goods ranging from Canadian oil to Chinese electronics, rose 0.7 percent
m-o-m in April, following a revised 1.4 percent m-o-m gain in March (originally
a 1.2 percent m-o-m gain). Economists had expected prices to increase 0.6
percent m-o-m last month.
According
to the report, the April gain was driven by higher prices for both fuel (+0.5
percent m-o-m) and nonfuel (+0.7 percent m-o-m) imports.
Over
the 12-month period ended in April, import prices surged 10.6 percent, with
higher fuel (+126.5 percent; the largest 12-month advance since February 2000)
and nonfuel (+5.0 percent; the largest 12-month gain since September 2011)
prices contributing to the climb. This was the largest over-the-year increase
since the year ended October 2011.
Meanwhile,
the price index for U.S. exports went up 0.8 percent m-o-m in April, following
a revised 2.4 percent m-o-m climb in the previous month (originally a 2.1 percent
m-o-m growth).
The April
rise was driven by higher prices for both agricultural exports (+0.6 percent
m-o-m) and nonagricultural exports (+0.9 percent m-o-m).
Over
the past 12 months, the price index for exports jumped 14.4 percent, reflecting
surges in prices of both agricultural exports (+25.2 percent; the largest
over-the-year rise since July 2011) and nonagricultural exports (+13.1 percent;
the largest over-the-year advance since the index was first published in March
1985). This represented the largest over-the-year increase since the index was first published in September 1983.
| Time | Country | Event | Period | Previous value | Forecast | Actual |
|---|---|---|---|---|---|---|
| 11:30 | Eurozone | ECB Monetary Policy Meeting Accounts |
USD fell against its major rivals in the European session on Friday as risk appetite improved, as investors focused on re-opening prospects, while fears of tighter policy in response to accelerating inflation were eased by Federal Reserve policymakers.
The U.S. Dollar Index (DXY), measuring the U.S. currency's value relative to a basket of foreign currencies, dropped 0.34% to 90.45.
Investors also awaited U.S. data on retail sales and industrial production for April, due at 12:30 GMT and 13:15 GMT respectively, which are expected to provide more clues about the pace of the economic recovery.
The
ECB released account of its April 21-22 monetary policy meeting. It noted that:
- Incoming information, including high-frequency indicators, indicated that economic activity was likely to have contracted again in Q1, but pointed to resumption of growth in Q2
- Progress with vaccination campaigns and envisaged gradual relaxation of containment measures underpinned expectation of firm rebound in economic activity, especially in H2 of 2021
- Risks to Eurozone's growth outlook continued to be on downside in near term, but remained more balanced over medium term
- Underlying price pressures were subdued in context of weak demand and significant slack in labour and product markets, but were expected to increase somewhat in 2021
- Inflation would exhibit some volatility for the remainder of the year
- As regards external communication, two aspects were important: 1) Governing Council needed to reaffirm its current practice of conducting comprehensive joint evaluation of prevailing state of financing conditions against inflation outlook at monetary policy meetings in which policy deliberations were informed by new round of staff projections (new comprehensive joint assessment should be conducted at ECB's next monetary policy meeting in June); 2) it was important to highlight that calibrating purchases under PEPP so as to counter adverse effects of the pandemic on medium-term inflation outlook was only one element in achieving aim of stabilising medium-term inflation around levels below, but close to, 2%. Ample monetary policy support remained crucial beyond pandemic period in order to support inflation and return it to inflation aim. Governing Council, therefore, needed to continue to stand ready to adjust all of its instruments, as necessary, to fulfil its mandate
- With respect to latest exchange rate developments, it was noted that euro had appreciated slightly since Governing Council’s last meeting. It was underlined that a further appreciation of the exchange rate could have adverse implications for inflation outlook
- It was also stressed that outlook for both growth and inflation remained dependent on support of fiscal policy measures and very accommodative monetary policy stance
- Members generally expected stronger recovery to take place in H2 of 2021 but emphasised that uncertainty surrounding near-term growth outlook remained high
- With regard to recent developments in inflation expectations, members noted that longer-term inflation expectations reported in ECB Survey of Professional Forecasters were unchanged, at 1.7%, while market-based indicators of inflation expectations had increased, although this increase mainly reflected increase in risk premia
- Members expressed broad agreement with proposal made by Mr. Lane to leave ECB’s monetary policy configuration unchanged and to reconfirm the very accommodative stance
- It was also widely agreed that it should be highlighted that future pace of purchases under PEPP was data-dependent and would continue to be based on joint assessment of financing conditions and inflation outlook
- Governing Council’s decision in March to undertake significantly higher PEPP purchases than during first few months of the year remained appropriate
FXStreet reports that the Credit Suisse analyst team suggests that EUR/USD can maintain an upward bias still within the broader range above key price and retracement support at 1.1999/86.
“Resistance stays seen at 1.2110/14 initially, with a break above 1.2152 needed to reassert an upward bias for strength back to 1.2182/85, then what we expect to be tougher resistance at the 78.6% retracement of the Q1 fall and February high at 1.2212/43, where we will look for a fresh cap. Should strength directly extend, this can expose the top of the broader range and YTD high at 1.2325/1.2350.”
“Below 1.2052/51 can clear the way for a test of what we see as more important support at 1.1999/86 – the early May low and 38.2% retracement of the March/May rally.”
FXStreet reports that analysts at Credit Suisse note that the NZD/USD pair has held above the 0.7170 uptrend from the 2021 lows – which maintains a mild upward tilt for a move back to 0.7306.
“The break above resistance at 0.7180 should relieve the downward pressure and confirm that the uptrend has held, with next resistance thereafter at 0.7245/47, then the recent highs at 0.7306/16, which recently stalled the market, before the 78.6% retracement of the Q1 fall at 0.7353, where we would expect another pause.”
FXStreet notes that investors are sounding the alarm over inflation, fearful that the Fed's Average Inflation Targeting framework along with a greater focus on full employment may lead to a policy error. The reality is more nuanced, with three key scenarios emerging, Daniel Ghali, Commodity Strategist at TD Securities suggests.
“Inflation is not transitory and the market will force the Fed's hand. This scenario plays into recent fears, as the market pulls forward future rate hikes, weighing on risk assets. Gold's bull market would be likely to die.”
“Inflation is not transitory, but the Fed is behind the curve. During this time, gold would ultimately surge along with inflation-hedging assets, particularly energy and industrial commodities.”
“Inflation is transitory and the Fed stays on message. Here, inflation risk is nearly peaking, which should translate into a weaker USD as AIT prolongs a period of uber-dovish policies. This should firm both risky and real assets, including gold.”
“TD Securities sits in the transitory camp, which paints a positive picture for gold.”
Walt Disney (DIS) reported Q2 FY 2021 earnings of $0.79 per share (versus $0.60 per share in Q2 FY 2020), beating analysts’ consensus estimate of $0.27 per share.
The company’s quarterly revenues amounted to $15.613 bln (-13.4% y/y), missing analysts’ consensus estimate of $15.986 bln.
The company also reported Disney+ added 8.7 mln new subscribers, to reach 103.6 mln at the end of Q2 FY 2021. Analyst consensus had been for about 14.4 mln new Disney+ subscribers, to hit about 109 mln worldwide at the end of March.
DIS fell to $171.49 (-3.84%) in pre-market trading.
FXStreet notes that USD/JPY has successfully held its uptrend from January at 108.43. Economists at Credit Suisse look for a break above 109.95/97 for strength back to test the 110.97 March high.
“Key near-term resistance remains seen at 109.95/97, above which is needed to clear the way for strength back to the late March high and potential downtrend from February 2020 at 110.83/97.”
“Whilst a fresh rejection from 110.83/97 should be expected, above in due course can open the door to a test of much important resistance at 111.96/112.40, beyond which would raise the prospect of a much more significant base.”
“Support moves to 109.41 initially, then 109.27/22, which we look to try and hold."
Reuters reports that global investors continued to buy equity funds in the week ended May 12, driven by hopes of an economic rebound and expectations of faster vaccine rollouts to curb the pandemic.
According to Refinitiv data, global equity funds received $15.1 billion worth of inflows, the biggest in four weeks.
However, the inflows mainly involved cyclical stocks, while growth funds, which invest in fast-expanding sectors such as tech, faced outflows on concerns over rising inflation levels.
Financials and mining sector funds received $1.3 billion each, while tech sector funds faced outflows worth $1.2 billion in the week, the data showed.
Growth stocks are hit the most when there are increased expectations of higher inflation and interest rates, as they lower the present value of future cash flows, making the stocks less attractive.
FXStreet reports that economists at Credit Suisse discuss USD/CHF prospects.
“We look for a turn back lower from 0.9083. Going forwards, a sustained move back below 0.9030 would confirm a near-term peak. Thereafter, the next levels are seen at 0.9000/8985, which stalled the market on Monday, then 0.8922/10, before 0.8871/62, which is an important price low. With weekly MACD crossing back below MACDA, we would not even rule out a test of the 2021 low at 0.8757.”
“Resistance stays at the 200-day average at 0.9083/9115, which should now ideally cap to keep the risks directly lower.”
Reuters reports that the private-sector advisers to Japanese Prime Minister Yoshihide Suga called for raising minimum wages this fiscal year to stimulate private consumption.
The four advisers at the Council for Economic and Fiscal Policy called on the government to stick to its budget-balancing target as massive coronavirus-related spending has strained the industrial world's heaviest public debt burden.
The proposals, which were made at the council's gathering, could be reflected in government's mid-year policy guidelines, which will provide the basis for next fiscal year's budget, to be compiled in late December.
If the economy makes a progress towards normalisation with the help of vaccinations, real GDP is expected to return to pre-pandemic levels as early as this autumn, the advisers told the meeting.
However, downside risks warrant close attention, they added, given that a third state of coronavirus emergency was enacted for the capital, Tokyo, and some other areas in late April and has been extended until the end of this month.
FXStreet reports that economists at MUFG Bank discuss USD/CAD prospects.
“Governor Macklem expressed more concern over Canadian dollar strength. He stated that ‘a stronger dollar creates some risk for our outlook. It is moved a lot further that could have a material impact on our outlook.”
“Our technical RSI signal shows that the Canadian dollar has become heavily overbought in the near-term which increases the risk it continues to correct lower in the near-term. Any weakness is likely to prove short-lived though while the Bank of Canada continues to signal that it plans to begin raising rates next year and is backed up by better than expected economic data releases from Canada.”
RTTNews reports that final results from the statistical office INE showed that Spain's consumer price inflation accelerated to the highest level in more than two years, as initially estimated, in April.
The consumer price index rose 2.2 percent year-on-year, following a 1.3 percent increase in March.
The rate came in line with the preliminary estimate published on April 29 and was the highest since October 2018, when the inflation rate was 2.3 percent.
Core consumer prices remained flat on year, after rising 0.3 percent each in March and February, data showed.
On a monthly basis, the overall CPI advanced 1.2 percent, up from 1 percent in March and matched the flash estimate.
Inflation, based on the harmonized index of consumer prices or HICP, accelerated to 2 percent from 1.2 percent in March. The rate was slightly above the flash estimate of 1.9 percent.
FXStreet reports that in the view of economists at Charles Schwab, a confluence of factors has increased the likelihood for the energy sector to outperform the overall market.
“The ongoing recovery of the global economy bodes well for rising oil demand. Supply remains constrained by OPEC and cautious producers, and inventories are down – driving oil prices higher.”
“The expansion phase of the business cycle can support cyclical-value energy companies, and large diversified energy companies are becoming more disciplined with expenses and investment. Meanwhile, attractive valuations are reinforced by rising earnings expectations.”
“Except for some near-term headlines noise and measured rise in regulations, however, a dramatic impact from the clean energy movement on the energy sector landscape is likely years away.”
“Weighing the issues, we believe the Energy sector is poised to outperform during the next three to six months.”
Reuters reports that BofA's weekly fund flow statistics showed that investors have taken money out of tech equity funds and loaded up on inflation protection amid fears the Fed might alter its ultra accommodative monetary policy as inflation picks up.
The week to May 12 saw the largest flows towards Treasury Inflation-Protected Securities funds in 23 weeks with an inflow of $1.9 billion, BofA said, citing EPFR data.
At the same time, tech equity funds saw their first outflow in five weeks.
All in all, equity funds saw $25.7 billion in inflows, while $13.6 billion went into cash and $6.9 billion went into bonds, BofA said.
FXStreet reports that ING said that AUD/USD is set to experience a sharper correction lower if the pair fails to surpass the 0.7740/50 area.
“After surging 10% on Monday, Iron Ore is now falling 10% today. Driving this move seems to be the intervention of Chinese policymakers, wary that a surge in commodity prices could undermine the recovery. Here, officials have raised margins and imposed fees on steel trading and made it clear that speculators will be frowned upon.”
“The synchronised recovery in global demand suggests the rally in commodities is an enduring one. But for the short-term, corrective forces are at play – which could take its toll on the AUD – a key exporter of iron ore.”
During today's Asian trading, the US dollar fell against most major currencies. Traders continue to evaluate the statistical data on the US economy published the day before, and are also waiting for reports on retail sales and consumer confidence for April, which should help them form an opinion on the prospects for consumer spending.
According to data from the US Department of Labor, released on Thursday, the number of Americans applying for unemployment benefits for the first time last week decreased by 34 thousand - to 473 thousand people, the lowest since the beginning of the COVID-19 pandemic.
Traders are trying to combine conflicting signals - the weak April labor market report released last week, and data on the growth of inflation last month.
Christopher Waller, a member of the Board of Governors of the Federal Reserve System (Fed), said yesterday that the Fed needs to evaluate the statistical data on the labor market and inflation for several more months before deciding when to start reducing stimulus.
The ICE index, which tracks the dollar's performance against six currencies (euro, swiss franc, yen, canadian dollar, pound sterling and swedish krona), fell 0.21%.
FXStreet reports that strategists at DBS Bank discuss XAU/USD prospects.
“The three factors which are biased against gold prices are in the process of reversing – US bond yields have retreated, the US dollar has weakened, and the US employment outlook has faltered. Even as gold underperformed last quarter, we believe the price can resume its upward trend towards the USD2,000 level. This comes from the positive view on demand change, which is derived from central banks and discretionary spending.”
“Gold mining securities should benefit from higher demand and gold prices. We believe it will be a production growth story this year for miners. Miners should be able to maintain all-in costs with higher production volume despite threats from higher operating costs such as wages and fuel prices.”
EUR/USD
Resistance levels (open interest**, contracts)
$1.2189 (2398)
$1.2158 (3612)
$1.2134 (506)
Price at time of writing this review: $1.2108
Support levels (open interest**, contracts):
$1.2059 (324)
$1.2045 (772)
$1.2025 (1110)
Comments:
- Overall open interest on the CALL options and PUT options with the expiration date June, 4 is 62791 contracts (according to data from May, 13) with the maximum number of contracts with strike price $1,2200 (4332);
GBP/USD
$1.4205 (963)
$1.4173 (2345)
$1.4124 (1078)
Price at time of writing this review: $1.4064
Support levels (open interest**, contracts):
$1.3971 (349)
$1.3947 (291)
$1.3920 (247)

Comments:
- Overall open interest on the CALL options with the expiration date June, 4 is 21032 contracts, with the maximum number of contracts with strike price $1,5000 (2696);
- Overall open interest on the PUT options with the expiration date June, 4 is 22449 contracts, with the maximum number of contracts with strike price $1,3100 (3953);
- The ratio of PUT/CALL was 1.07 versus 0.95 from the previous trading day according to data from May, 13

* - The Chicago Mercantile Exchange bulletin (CME) is used for the calculation.
** - Open interest takes into account the total number of option contracts that are open at the moment.
CNBC reports that according to new research from JP Morgan, slowing population growth across the globe could have a major impact on real interest rates.
With more old people saving for retirement and fewer young people borrowing for things like properties, cars and education, demographics are weighing heavy on interest rates in a trend that is set to continue, Jesse Edgerton, a senior economist at JP Morgan, told.
“The slowdown in population growth, which we’ve been seeing for decades in both developed and emerging markets, is a reason to expect lower real interest rates,” Edgerton told.
Japan, Europe and the U.S. have all experienced declining real interest rates in recent decades, as birth rates and gross domestic product (GDP) have fallen, and life expectancy rates have risen in tandem.
China is now “fairly far down that path,” said Edgerton, referring to its slowing birth rate and aging population.
Emerging markets — where population growth remains higher — can expect to follow suit as they develop over time, he added.
That’s because money is not being put to work in the same way, driving down returns and interest rates, said Edgerton.
eFXdata reports that Societe Generale Research discuss EUR/USD prospects.
"The question for the dollar is still more one of what happens elsewhere. Bund yields are at -0.1%, their highest level in almost two years. With vaccination rates picking up, economic optimism is likely to improve too and whether the FOMC holds its resolve in the face of upside CPI surprises or not, we can be pretty sure the ECB will be alarmed if they see any significant uptick in inflation. We’ll be surprised if EUR/USD goes down much as Bund yields rise, even if US yields rise slightly more," SocGen adds.
RTTNews reports that the latest survey from BusinessNZ showed that the manufacturing sector in New Zealand continued to expand in April, albeit at a slower pace.
Manufacturing Index was 58.4 in April. That's down from 63.6 in March, although it remains well above the boom-or-bust line of 50 that separates expansion from contraction. Individually, production (64.5), employment (52.7), new orders (60.9), finished stocks (55.2) and deliveries (52.4) all were in expansion territory.
"Firms' commentary to April's PMI noted improving conditions internationally, in addition to many global PMIs clearly pointing to economic activity expanding strongly in significant portions of the world right now," BNZ Senior Economist Craig Ebert said.
| Raw materials | Closed | Change, % |
|---|---|---|
| Brent | 66.99 | -2.63 |
| Silver | 27.067 | 0.21 |
| Gold | 1826.627 | 0.66 |
| Palladium | 2860.84 | 0.39 |
| Time | Country | Event | Period | Previous value | Forecast |
|---|---|---|---|---|---|
| 06:00 (GMT) | Japan | Prelim Machine Tool Orders, y/y | April | 65.0% | |
| 11:30 (GMT) | Eurozone | ECB Monetary Policy Meeting Accounts | |||
| 12:30 (GMT) | Canada | Manufacturing Shipments (MoM) | March | -1.6% | |
| 12:30 (GMT) | U.S. | Import Price Index | April | 1.2% | 0.6% |
| 12:30 (GMT) | U.S. | Retail sales | April | 9.8% | 1% |
| 12:30 (GMT) | U.S. | Retail Sales YoY | April | 27.7% | |
| 12:30 (GMT) | U.S. | Retail sales excluding auto | April | 8.4% | 0.7% |
| 13:15 (GMT) | U.S. | Capacity Utilization | April | 74.4% | 75% |
| 13:15 (GMT) | U.S. | Industrial Production YoY | April | 1% | |
| 13:15 (GMT) | U.S. | Industrial Production (MoM) | April | 1.4% | 1% |
| 14:00 (GMT) | U.S. | Reuters/Michigan Consumer Sentiment Index | May | 88.3 | 90.4 |
| 14:00 (GMT) | U.S. | Business inventories | March | 0.5% | 0.3% |
| 17:00 (GMT) | U.S. | Baker Hughes Oil Rig Count | May | 344 |
| Pare | Closed | Change, % |
|---|---|---|
| AUDUSD | 0.77257 | 0 |
| EURJPY | 132.219 | -0.1 |
| EURUSD | 1.20809 | 0.09 |
| GBPJPY | 153.745 | -0.23 |
| GBPUSD | 1.40473 | -0.05 |
| NZDUSD | 0.718 | 0.29 |
| USDCAD | 1.21641 | 0.28 |
| USDCHF | 0.90523 | -0.39 |
| USDJPY | 109.439 | -0.19 |


© 2000-2026. All rights reserved.
This site is managed by Teletrade D.J. LLC 2351 LLC 2022 (Euro House, Richmond Hill Road, Kingstown, VC0100, St. Vincent and the Grenadines).
The information on this website is for informational purposes only and does not constitute any investment advice.
The company does not serve or provide services to customers who are residents of the US, Canada, Iran, The Democratic People's Republic of Korea, Yemen and FATF blacklisted countries.
Making transactions on financial markets with marginal financial instruments opens up wide possibilities and allows investors who are willing to take risks to earn high profits, carrying a potentially high risk of losses at the same time. Therefore you should responsibly approach the issue of choosing the appropriate investment strategy, taking the available resources into account, before starting trading.
Use of the information: full or partial use of materials from this website must always be referenced to TeleTrade as the source of information. Use of the materials on the Internet must be accompanied by a hyperlink to teletrade.org. Automatic import of materials and information from this website is prohibited.
Please contact our PR department if you have any questions or need assistance at pr@teletrade.global.
transfers