- Analytics
- News and Tools
- Market News
CFD Markets News and Forecasts — 15-05-2023
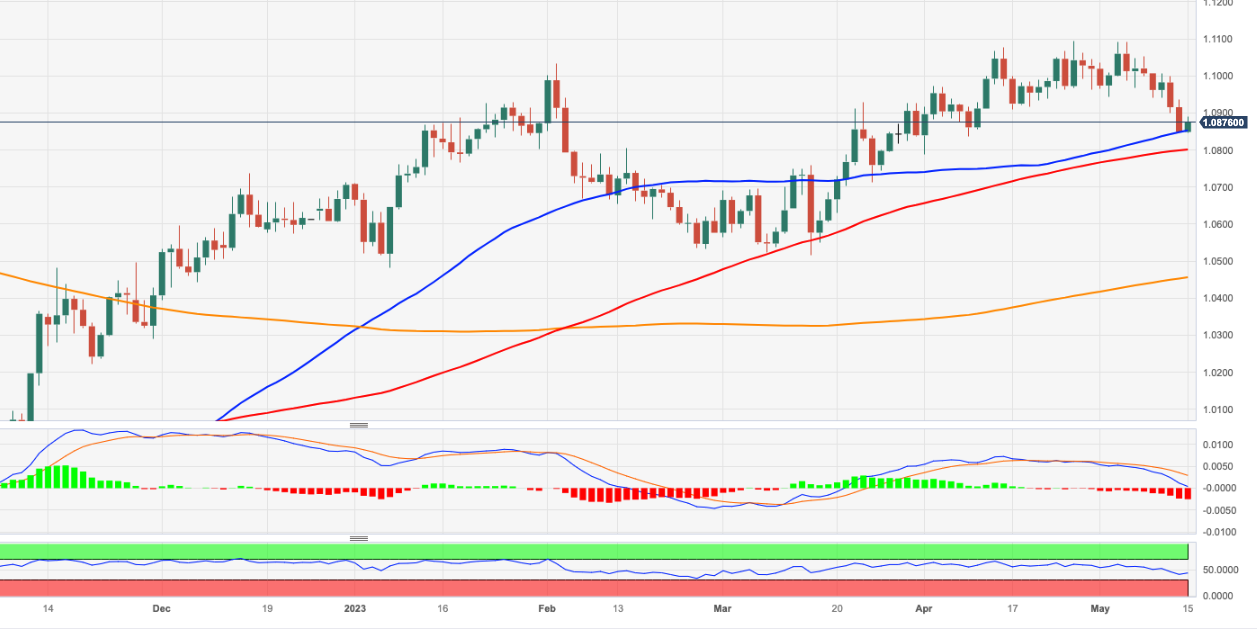
- USD/JPY has slipped below 136.00 as expectations for a Fed’s policy-tightening pause have soared.
- Tight credit conditions by US regional banks have resulted in a decline in loan disbursals.
- Approval of an increase in the US debt-ceiling will also undermine the USD Index as it will impact the long-term outlook of the US economy.
The USD/JPY pair has slipped below the crucial support of 136.00 in the Tokyo session. The asset is expected to remain on tenterhooks as investors are waiting for the US borrowing cap negotiations between the White House and congressional Republicans.
S&P500 futures have generated nominal losses in early Asia after a decent bullish Monday, portraying a minor caution in the overall risk-on market mood. US equities remained in a positive trajectory as the Federal Reserve (Fed) is considering a pause in its aggressive rate-hiking spell. Tight credit conditions by US regional banks have resulted in a decline in loan disbursals for small-scale firms while a pause in the policy-tightening spell will provide them a sigh of relief.
Meanwhile, Atlanta Federal Reserve President Raphael Bostic told Bloomberg on Monday that, if he were voting now, he would vote to hold rates in June. However, he warned that he has to keep a possible rate hike on the table.
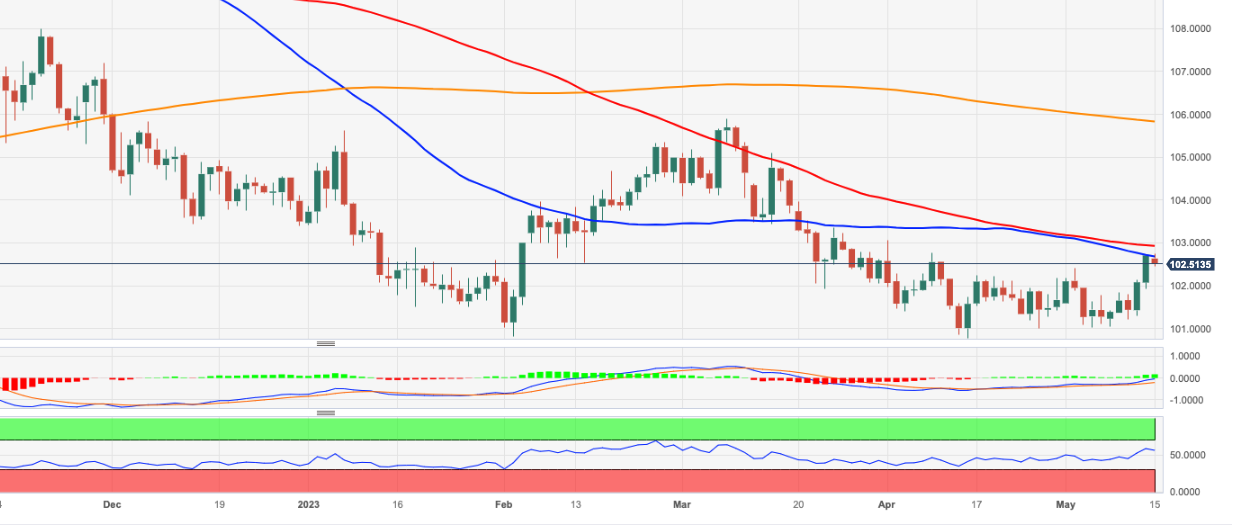
The US Dollar Index (DXY) seems vulnerable above 102.40 on expectations of a stable monetary policy. Apart from that, approval of an increase in THE US debt-ceiling will also impact the USD Index as it will impact the long-term outlook of the United States economy, which will increase volatility for the US Dollar and S&P500.
On the Japanese Yen front, April’s Producer Price Index (PPI) softened on Monday. Monthly economic data accelerated at a slower pace of 0.2% than forecasted at 0.3%. Annual PPI data slowed down to 5.8% vs. the estimates of 6.0% and the former release of 7.4%. This would force the Bank of Japan (BoJ) to keep the dovish monetary policy active ahead.
- AUD/USD grinds near intraday high after rising the most in a month, snapping two-day downtrend.
- Risk-on mood, PBoC inaction and hopes of hawkish RBA Minutes underpin Aussie pair’s run-up.
- Hopes of avoiding US default, softer US data favor sentiment and weigh on US Dollar of late.
- RBA Minutes, China/US Retail Sales eyed for immediate directions but US debt ceiling talks are the key.
AUD/USD grinds near 0.6700 as the bulls await the Reserve Bank of Australia (RBA) Meeting Minutes on early Tuesday. In doing so, the Aussie pair also benefits from the market’s cautious optimism due to the US debt ceiling hopes, as well as upbeat signals from the People’s Bank of China (PBOC) and likely hawkish statements from the RBA.
It’s worth noting that the Aussie pair rose the most in one month the previous day while printing the first daily gains in three amid broad US Dollar weakness, mainly due to the market’s hopes of overcoming the US default and downbeat US data.
On Monday, the largest fall US NY Empire State Manufacturing Index since April 2020, to -31.8 for May, joined mixed Fed talks to also weigh on the US Dollar. That said, Atlanta Fed President Raphael Bostic told CNBC on Monday that there is still a long distance to go on inflation and added that they may have to "go up on rates," as reported by Reuters. Bostic further noted that he will not be looking at cutting rates until well into 2024 in his baseline scenario. On the contrary, Chicago Federal Reserve Bank President Austan Goolsbee said in an interview with CNBC on Monday that a lot of impact of rate hikes is still in the pipeline. Furthermore, Minneapolis Fed President Neel Kashkari stated that signaled that the Fed has a long way to go to get inflation to 2.0%.
Elsewhere, the White House announced a meeting between President Joe Biden and Republican House of Representatives Speaker Kevin McCarthy to overcome the looming US default. Ahead of the event, the US policymakers appear somewhat optimistic about extending the debt ceiling limit before the June expiry.
People's Bank of China (PBOC) keeps the one-year Medium-term Lending Facility (MLF) rates unchanged at 2.75%, per the latest update. The news joins the PBOC’s highest daily fix since March 10 to propel the USD/CNH price. Additionally, the Chinese central bank also released its quarterly economic report stating that China's economy isn’t experiencing deflation and that the economic growth is set to rebound sharply.
Moving on, the RBA Minutes need to defend its latest hawkish surprise to keep the AUD/USD bulls on the table. That said, the latest quarterly Statement of Monetary Policy (SoMP) from the Aussie central bank isn’t too impressive and hence risks of a pullback on the event can’t be ruled out.
Additionally, China’s Retail Sales and Industrial Production for April, as well as the US Retail Sales for the said month, will precede the US debt ceiling talks, scheduled for 19:00 GMT, to direct short-term AUD/USD moves.
Technical analysis
A clear bounce off the 12-day-old ascending support line directs AUD/USD bulls toward the 200-DMA hurdle of around 0.6720.
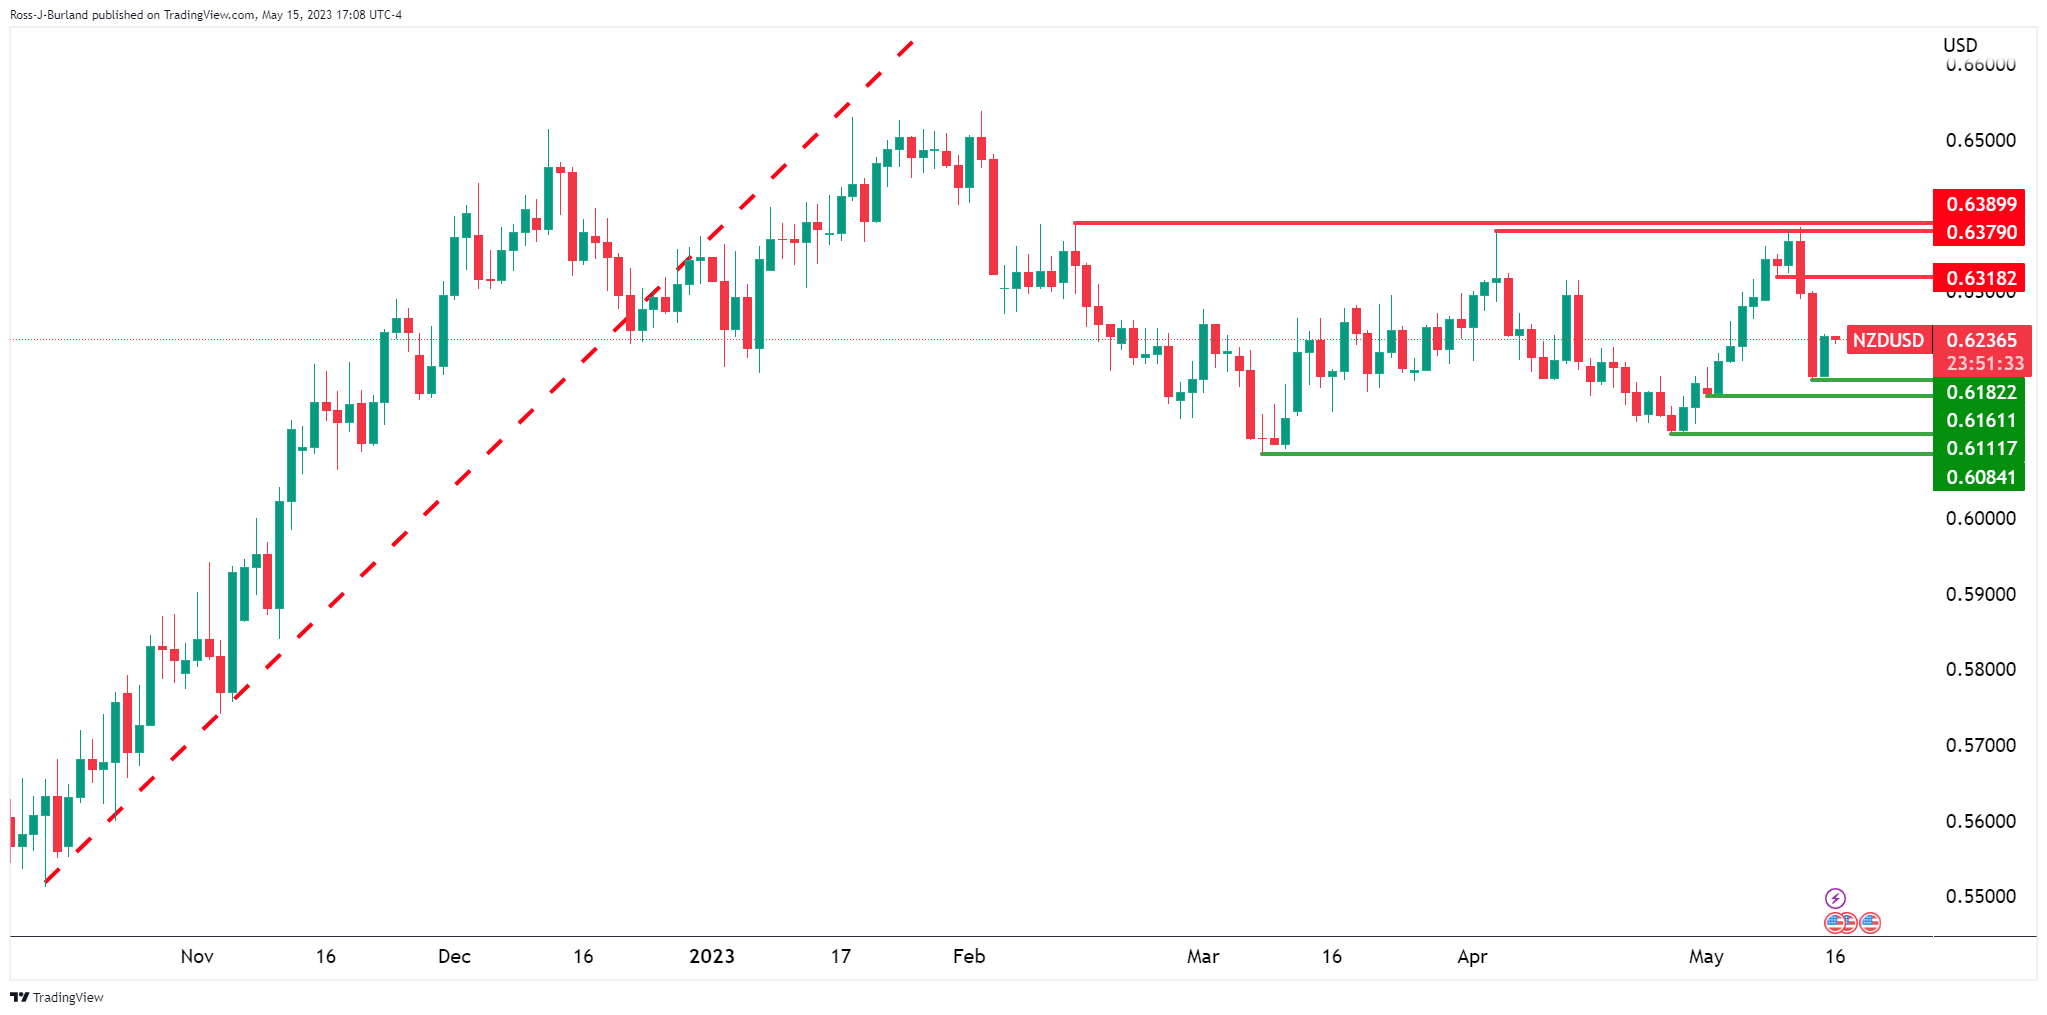
- NZD/USD picks up bids to extend week-start rebound from short-term support line.
- MACD conditions, 200-day EMA prod Kiwi pair buyers.
- 23.6% Fibonacci retracement level adds strength to 0.6190 immediate support.
NZD/USD renews intraday high around 0.6250 to stretch the previous day’s recovery amid early Tuesday’s Asian session. In doing so, the Kiwi pair cheers the US Dollar weakness ahead of China’s Retail Sales and Industrial Production for April, as well as the US Retail Sales for the said month. Also important are the US debt ceiling talks, scheduled for 19:00 GMT on Tuesday.
Also read: NZD/USD bulls in the market and eye a firm correction
However, the impending bear cross on the MACD and the 200-day Exponential Moving Average (EMA) challenges the NZD/USD pair’s immediate upside near 0.6255.
Following that, the 50% and 61.8% Fibonacci retracement of the Kiwi pair’s February-March fall, respectively near 0.6310 and 0.6365, will challenge the pair buyers.
Even if the NZD/USD bulls manage to cross the 0.6365 hurdle, a horizontal area comprising multiple hurdles marked since early February, near 0.6385-95, will be a tough nut to crack for them.
On the flip side, a convergence of an upward-sloping trend line from April 26 and 23.6% Fibonacci retracement highlights the 0.6190 as short-term key support.
Should the NZD/USD bears keep the reins past 0.6190, the previous monthly low of around 0.6110 may offer an intermediate halt before directing the bears toward the yearly bottom marked in March around 0.6085.
NZD/USD: Daily chart
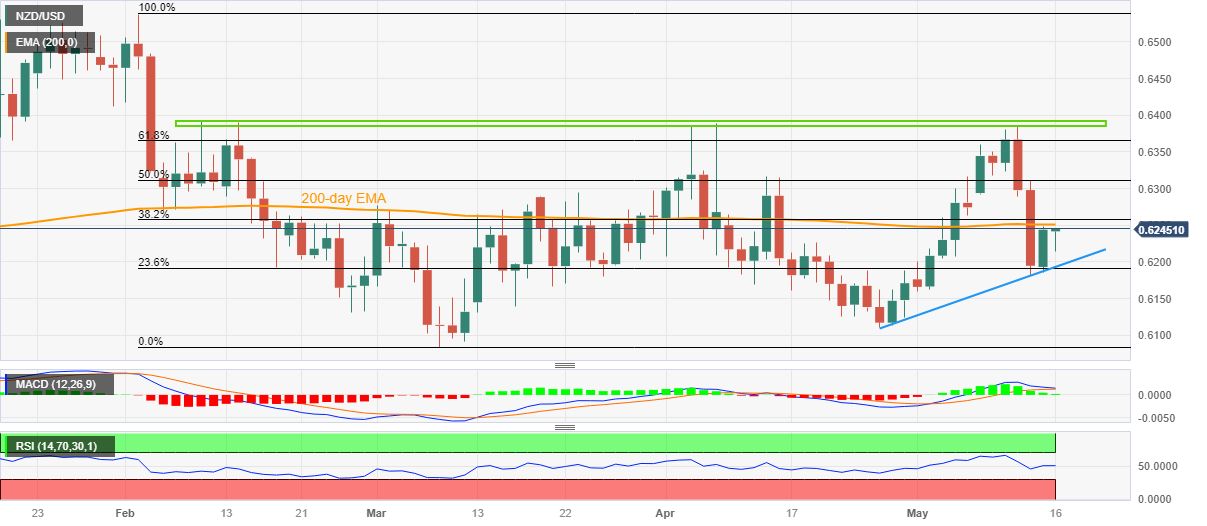
Trend: Further recovery expected
- EUR/JPY tests neckline as the confluence with last year's high of 148.40 poses a challenge for buyers.
- • Pair remains neutrally biased, with RSI and 3-day RoC indicators suggesting a pause in the uptrend.
- • A break above 148.40 confluence could spur a rally towards a new YTD high at 151.61.
The EUR/JPY aims toward the head-and-shoulders neckline after the cross-currency pair cracked the 20-day Exponential Moving Average (EMA) at 147.66. However, it remains shy of achieving a decisive break that could invalidate the pattern. As the Asian session begins, the EUR/JPY is trading at around 147.90s, down 0.06%.
EUR/JPY Price Analysis: Technical outlook
EUR/JPY remains neutrally biased, though in the near term, slightly tilted to the downside. The Relative Strength Index (RSI) indicator suggests the uptrend might pause as the RSI’s turned flat at bullish territory, while the 3-day Rate of Change (RoC), it’s neutral.
Even though the EUR/JPY spot price tests the head-and-shoulders neckline, the pattern remains intact. The confluence of the neckline and the last year’s high of 148.40 can prove challenging for buyers while a good zone for EUR/JPY sellers.
If EUR/JPY falls below the 20-day EMA, that will exacerbate a fall toward the current week’s low of 147.18. A breach of the latter will expose 147.00, followed by the 50-day EMA 146.17, before reaching the March 31 daily high-turned-support.
Conversely, if EUR/JPY breaks above the 148.40 confluence, the EUR/JPY might rally toward a new YTD high at 151.61.
EUR/JPY Price Action – Daily chart
- USD/CHF has shown a recovery move to near 0.8950 despite a consistent decline in the USD Index.
- The overall market mood is still cheerful as the Fed is expected to pause its policy-tightening spell.
- US Retail Sales data is expected to show an expansion of 0.7% against a contraction of 0.6%, recorded for March.
The USD/CHF pair has attempted a recovery after correcting to near 0.8940 in the early Asian session. The Swiss franc asset is required to pass more filters for building confidence among investors. The US Dollar Index (DXY) has not shown an n recovery action yet but is looking vulnerable above the immediate support of 102.40.
S&P500 futures are showing nominal losses in early Asia, portraying signs of caution ahead of US debt ceiling negotiations between congressional Republicans and US President Joe Biden. The overall market mood is still cheerful as the Federal Reserve (Fed) is expected to pause its policy tightening spell to avoid further damage to the economy.
The USD Index is expected to remain in action as the release of the United States Retail Sales (April) data will provide further guidance for June’s monetary policy. As per the consensus, monthly Retail Sales data are showing some recovery. The economic data is expected to show an expansion of 0.7% against a contraction of 0.6%, recorded for March.
Apart from that, US debt-ceiling talks will remain in the spotlight. A raise in debt-ceiling limit is highly required to save US Treasury from reporting default in making obligated payments. Economists at ANZ Bank believe that a deal will be reached to suspend the debt limit for a few months to provide more time to negotiate a mutually satisfactory outcome. Negotiations over that period are likely to be fractious, causing financial market volatility and disrupting growth.”
On the Swiss franc front, monthly Producer and Import Prices data accelerated by 0.2% in line with the prior release while the street was anticipating a contraction by 0.1%. On an annual basis, the economic data softened to 1.0% vs. the estimates of 1.1% and the former release of 2.1%. Consistency in the increase in offered prices for end consumers could force the Swiss National Bank (SNB) to remain hawkish ahead.
- WTI crude oil price grinds higher after snapping three-day downtrend.
- EIA anticipated record high US shale production in June.
- Canada wildfire, OPEC+ output cut and geopolitical woes favor Oil supply woes and WTI bulls.
- Softer US Dollar, cautious optimism add strength to commodity’s recovery.
WTI crude oil stays defensive near $71.40 after an upbeat week-start, grinding higher following the first daily run-up in three amid early Tuesday’s Asian session. In doing so, the black gold portrays the market’s cautious mood amid mixed catalysts from the energy industry, as well as due to anxiety ahead of the key data/events.
That said, the price-negative reports from the US Energy Information Administration failed to impress WTI crude oil bears on Monday amid fears of depleting supply due to geopolitical concerns and the OPEC+ supply cuts. Adding strength to the energy benchmark’s price was a pullback in the US Dollar, amid cautious optimism.
“US Oil output from the seven biggest shale basins is due to rise in June to the highest on record,” per the latest EIA report released on Monday. Oil output is set to rise by 41,000 barrels per day (bpd) to 9.33 million bpd, adds the EIA.
On the other hand, wildfires rage again in Canada’s key Oil producing state Alberta and restricted global oil supplies. Reuters quotes Mizuho analyst Robert Yawger while saying that At least 300,000 barrels of Oil equivalent per day (boepd) production was shut in last week in Alberta.
On the other hand, OPEC+ leaders’ defense of the latest output cut and the Group of Seven (G7) nations’ plan to tighten sanctions on Russia join the downbeat US Dollar allows the WTI buyers to retake control, after a three-day absence, as well as the People’s Bank of China’s (PBOC) inaction. That said, the US Dollar Index (DXY) snapped a two-day uptrend while retreating from the five-week high.
Looking ahead, WTI crude oil buyers will pay attention to the US Retail Sales for April and a solution to the US debt ceiling problem for further ruling. Also important will be the weekly private oil inventory data from the American Petroleum Institute. Furthermore, China’s Industrial Production and Retail Sales for April will be also important for immediate Oil price direction.
Technical analysis
A three-week-old descending resistance line challenges WTI crude oil buyers around $71.55 even if $69.80-75 limits the short-term downside of the black gold price.
- USDCAD stays depressed after snapping two-day winning streak, reversing from 50-DMA.
- Failure to stay beyond 50-DMA, two-month-old descending resistance line keeps Loonie pair sellers hopeful despite sluggish MACD signals.
- Rising support line from early February restricts immediate downside; Bulls need validation from April’s peak.
USD/CAD bears flirt with the 200-DMA surrounding 1.3465 as they take a breather after the Loonie pair’s biggest daily fall in over a week, especially on the release day of the US Retail Sales and Canada inflation data.
Also read: USD/CAD dives as the Canadian Dollar rides on higher oil prices, soft USD
The Loonie pair reversed from the 50-DMA the previous day to snap a two-day uptrend. The pair’s following declines, however, failed to gain support from the MACD and hence the USD/CAD bears struggle near the 200-DMA support near 1.3465-60 by the press time.
Even if the quote breaks the 200-DMA key support, an upward-sloping support line from early February, close to 1.3365 by the press time. It’s worth noting that the 1.3400 round figure may act as an intermediate halt between the key DMA and the stated support line.
In a case where the USD/CAD bears keep the reins past 1.3365, the odds of witnessing a slump toward the yearly low marked in February near 1.3260 can’t be ruled out. Though, lows marked in April and mid-February, near 1.3340 and 1.3270 respectively, may prod the pair sellers.
On the flip side, the USD/CAD pair’s recovery can aim for the 50-DMA hurdle of around 1.3560 ahead of challenging a 10-week-old descending resistance line, close to 1.3585 by the press time.
Should the quote remains firmer past 1.3585, the previous monthly high of near 1.3665 will be crucial for the Loonie pair buyers before targeting the late March swing high of 1.3805.
USD/CAD: Daily chart
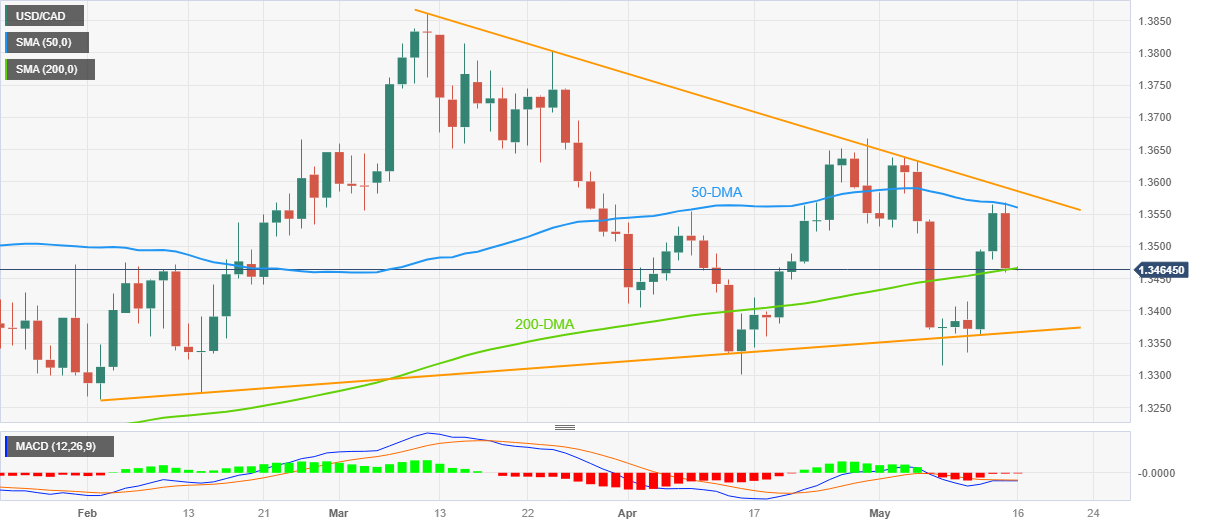
Trend: Further downside expected
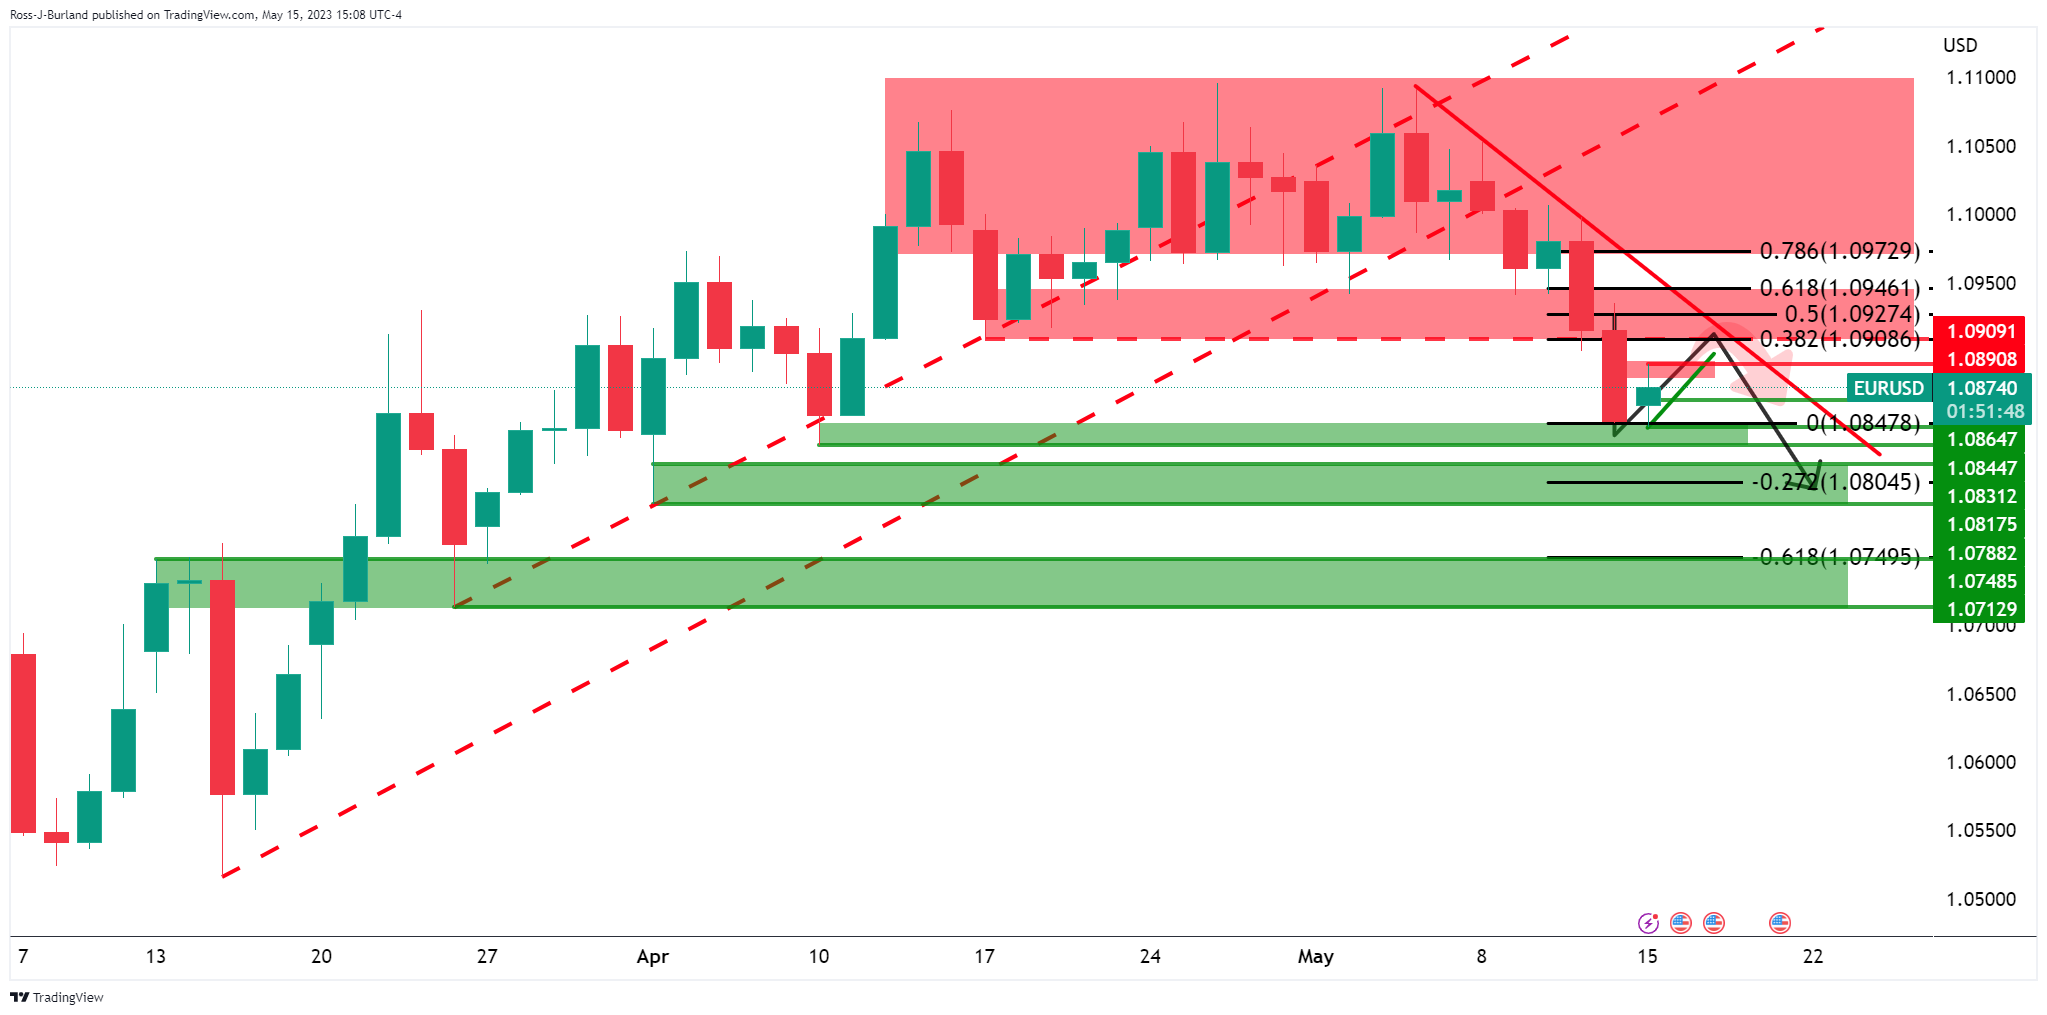
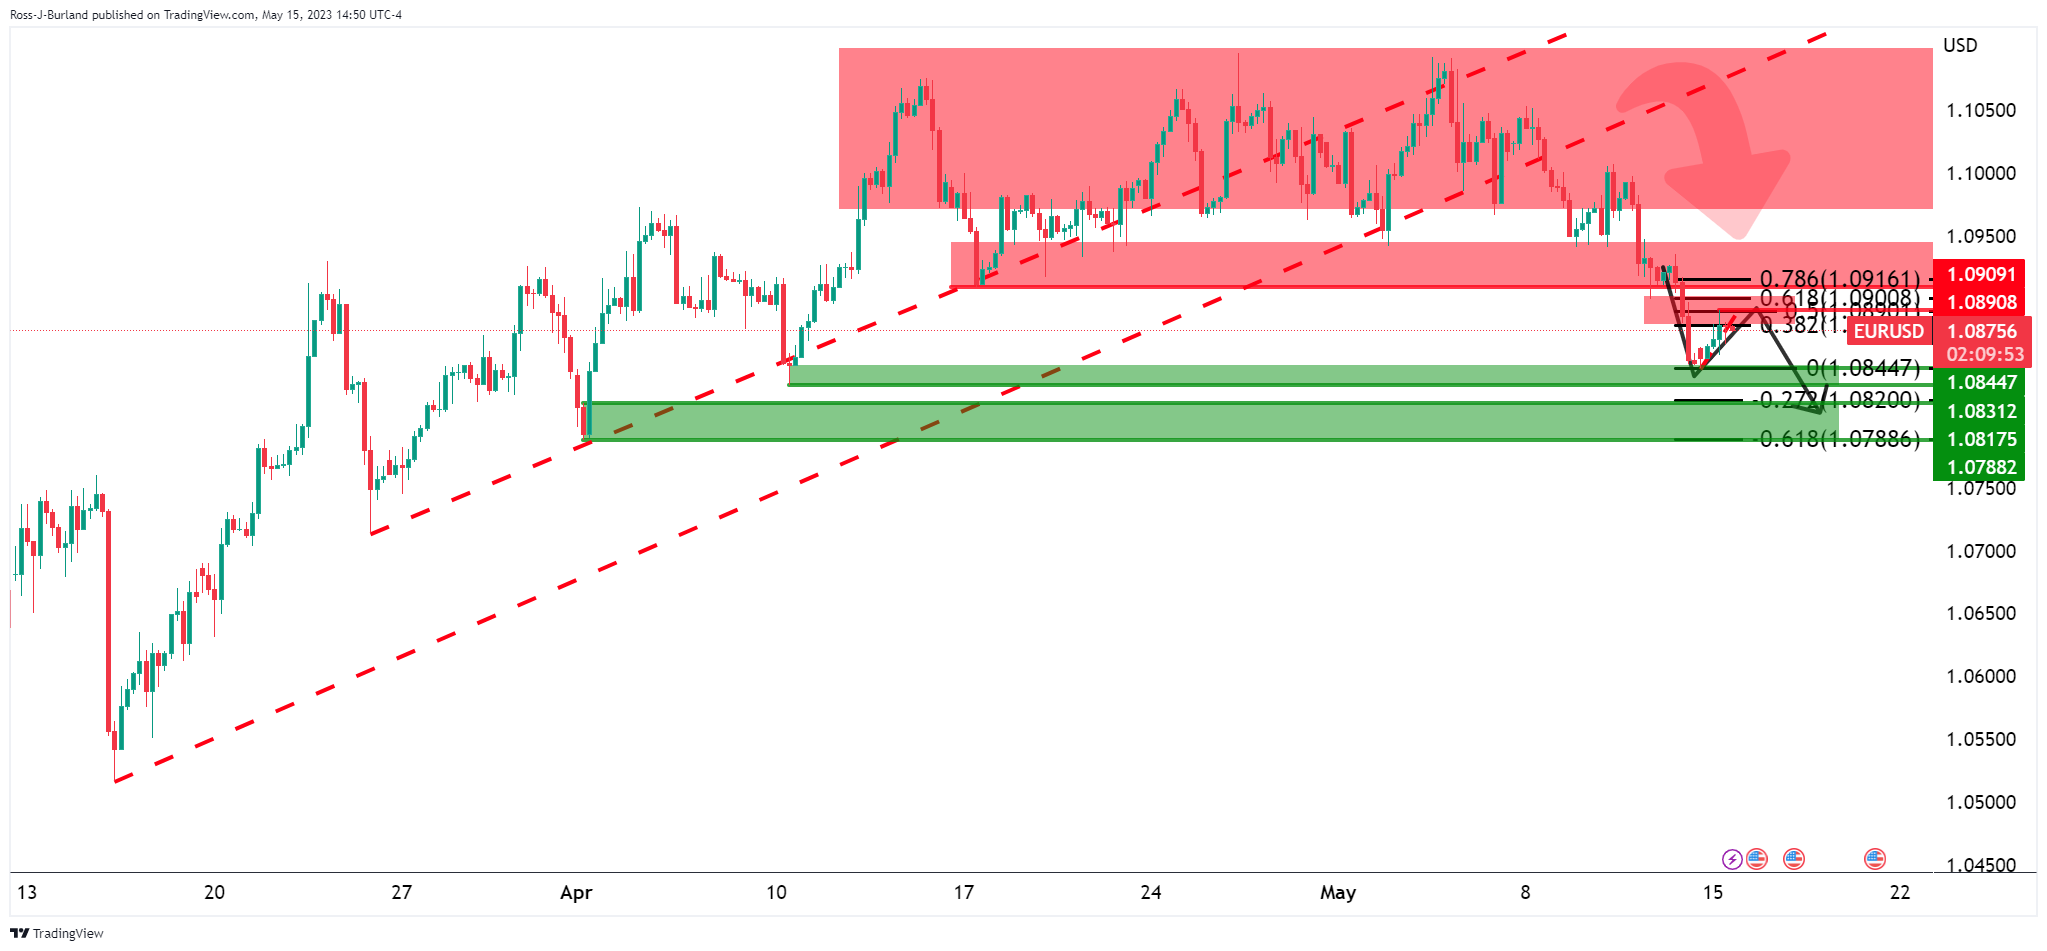
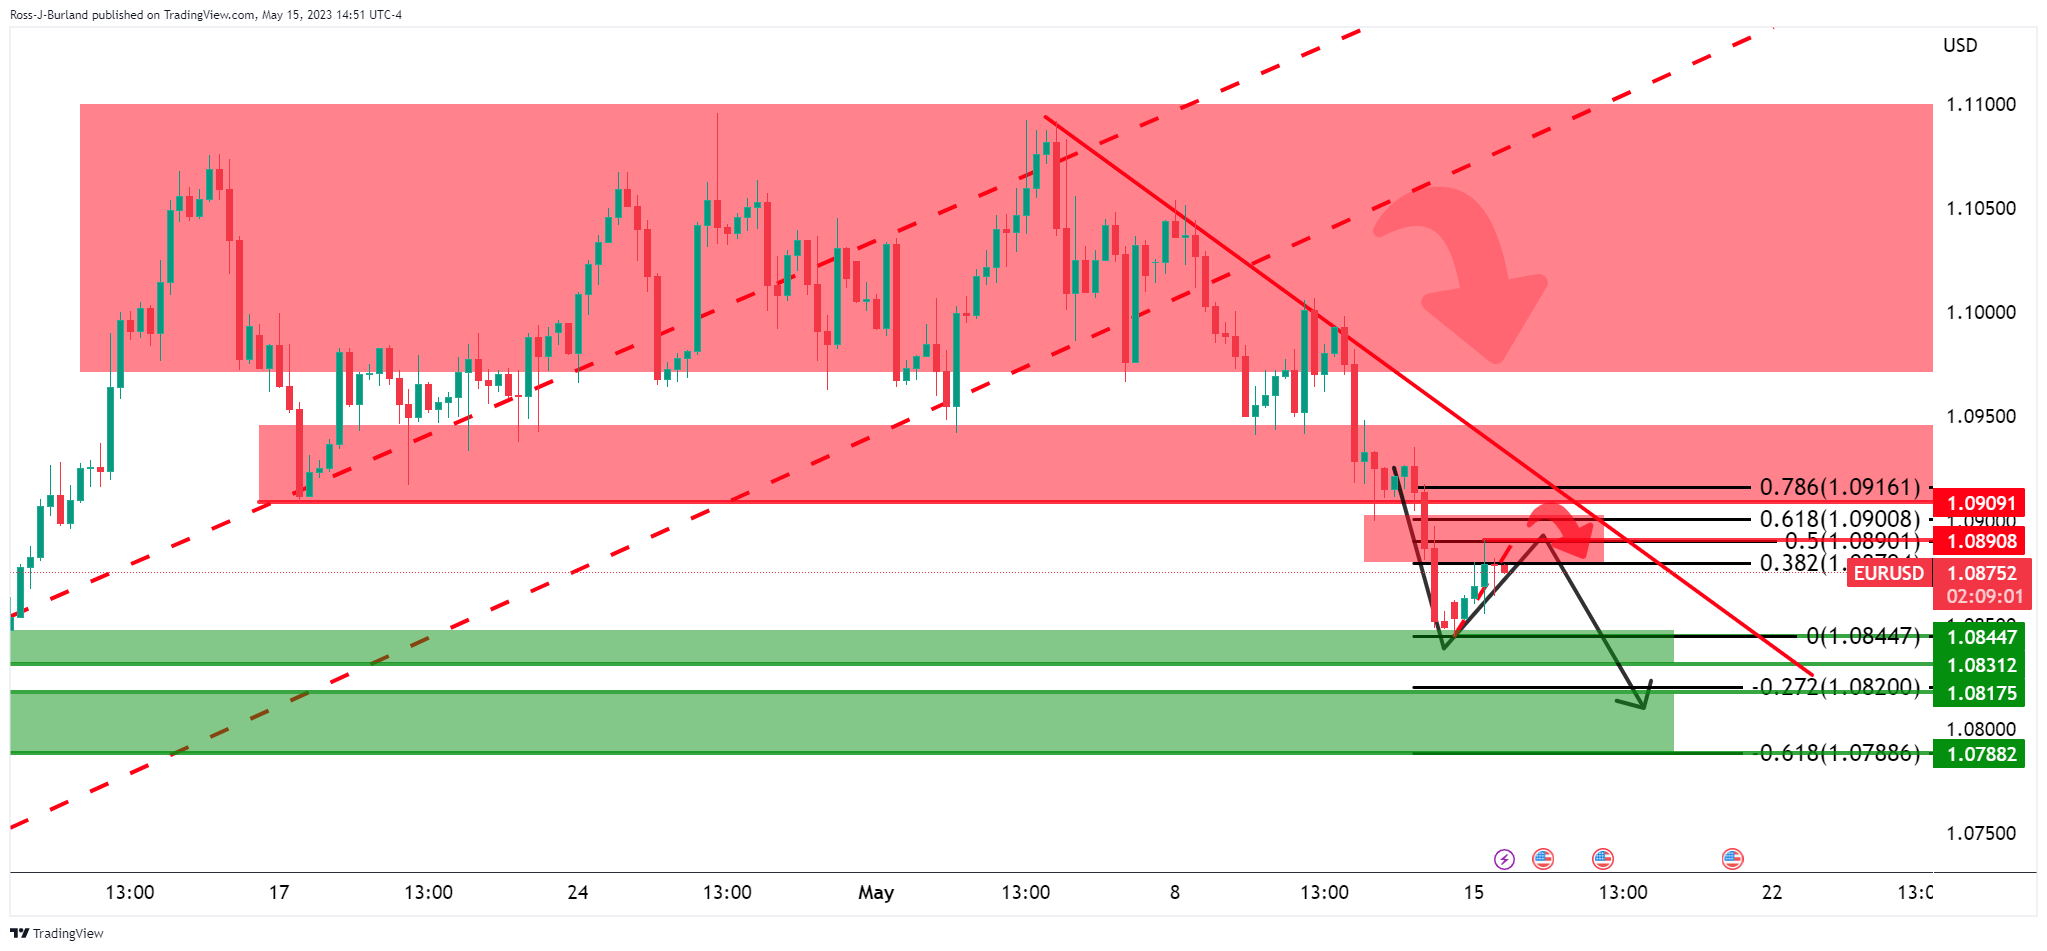
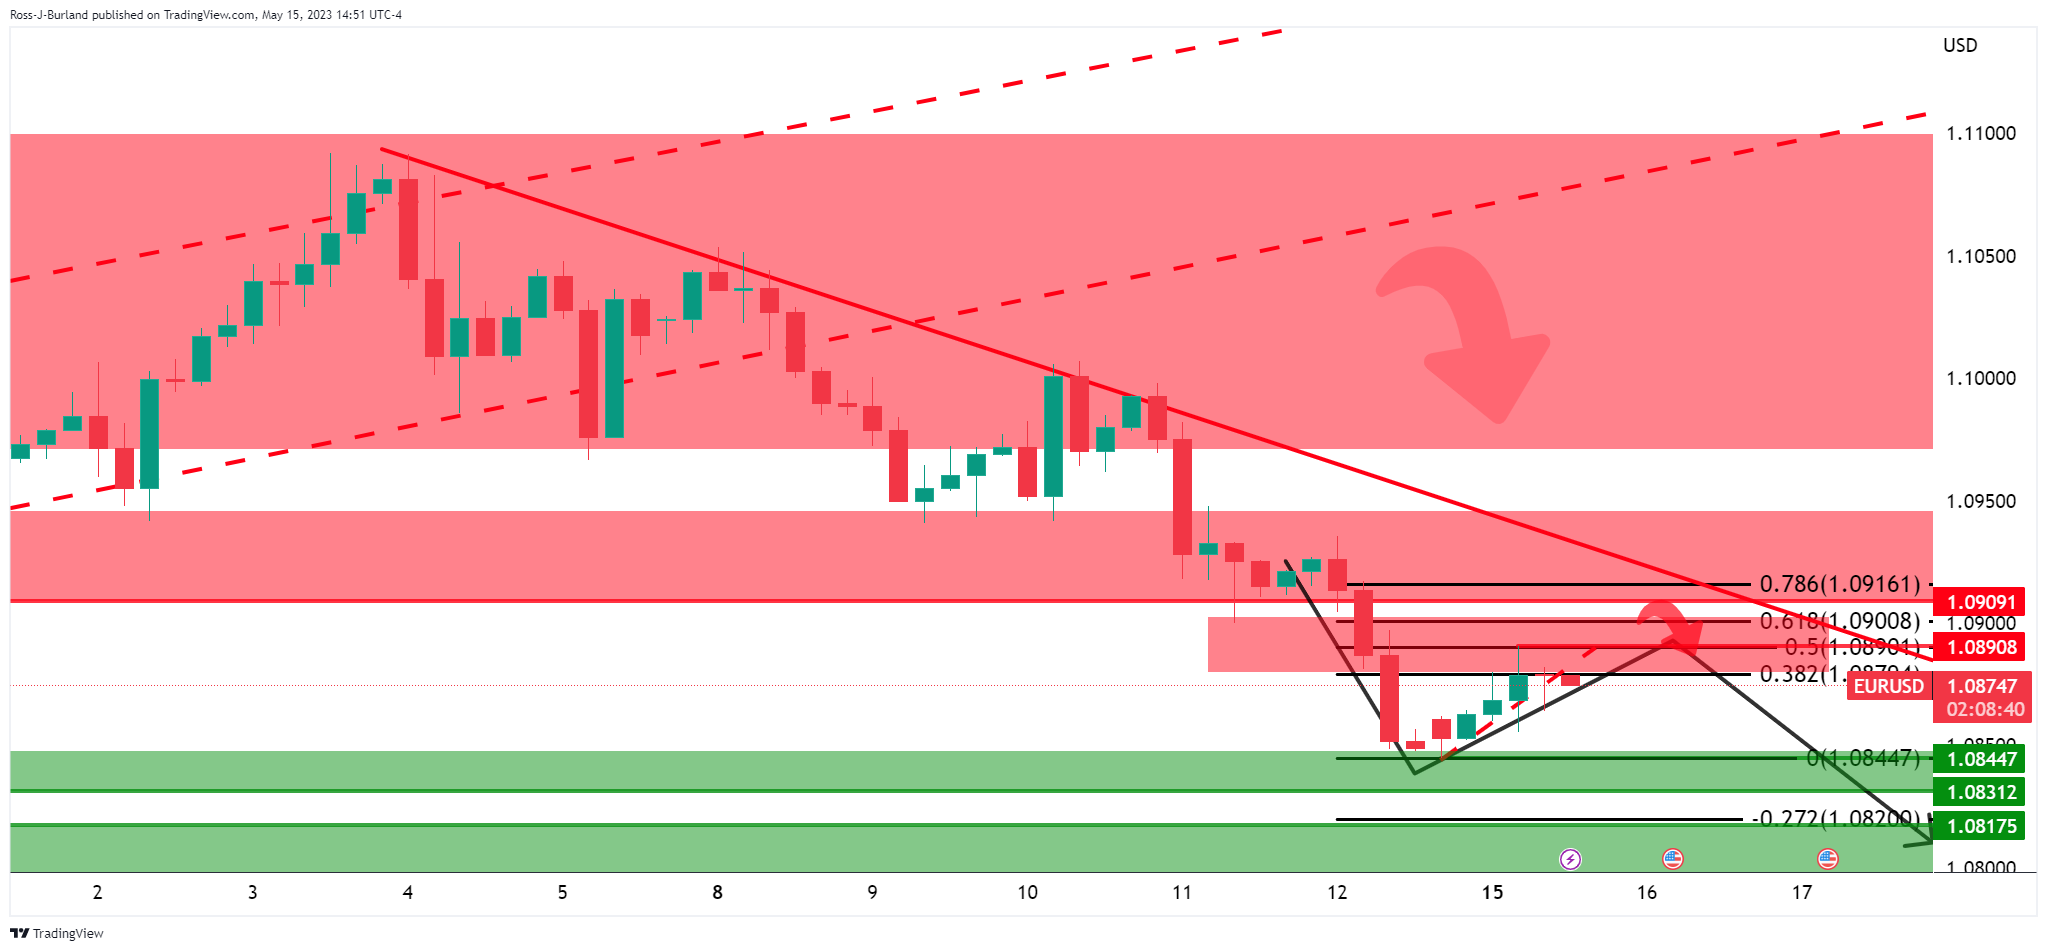
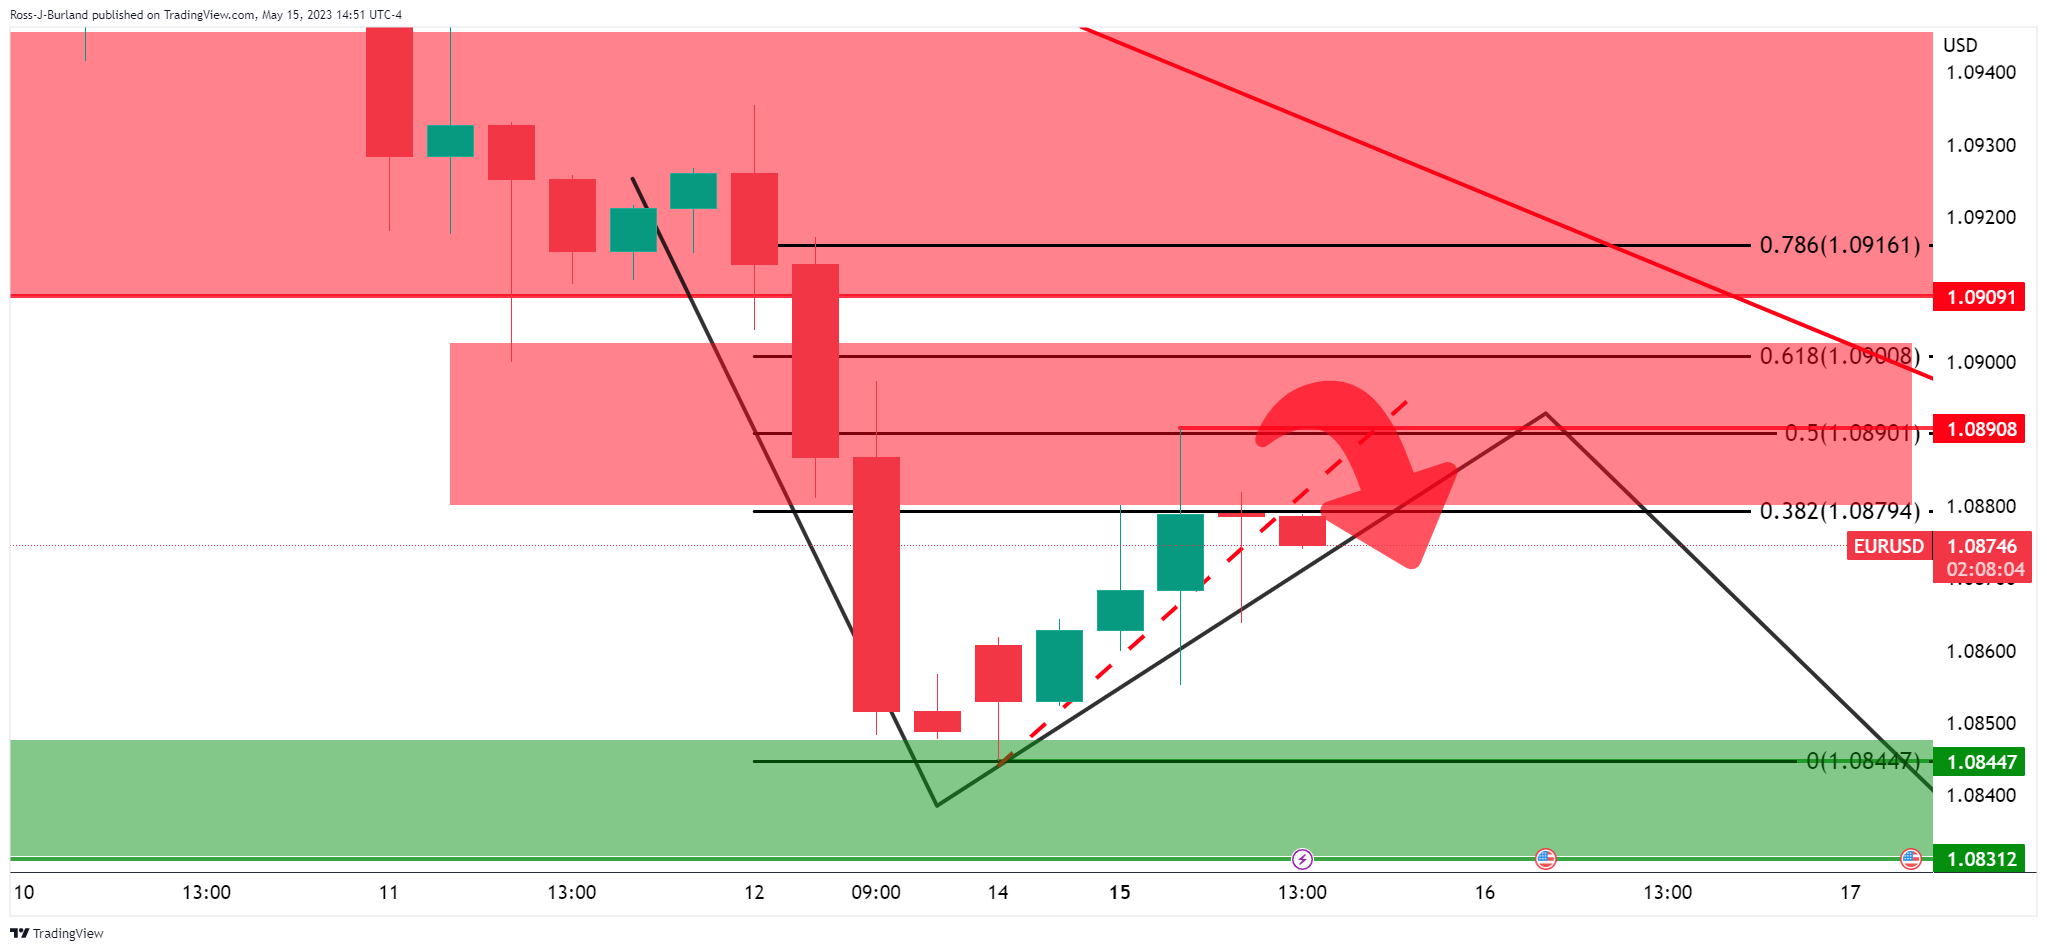
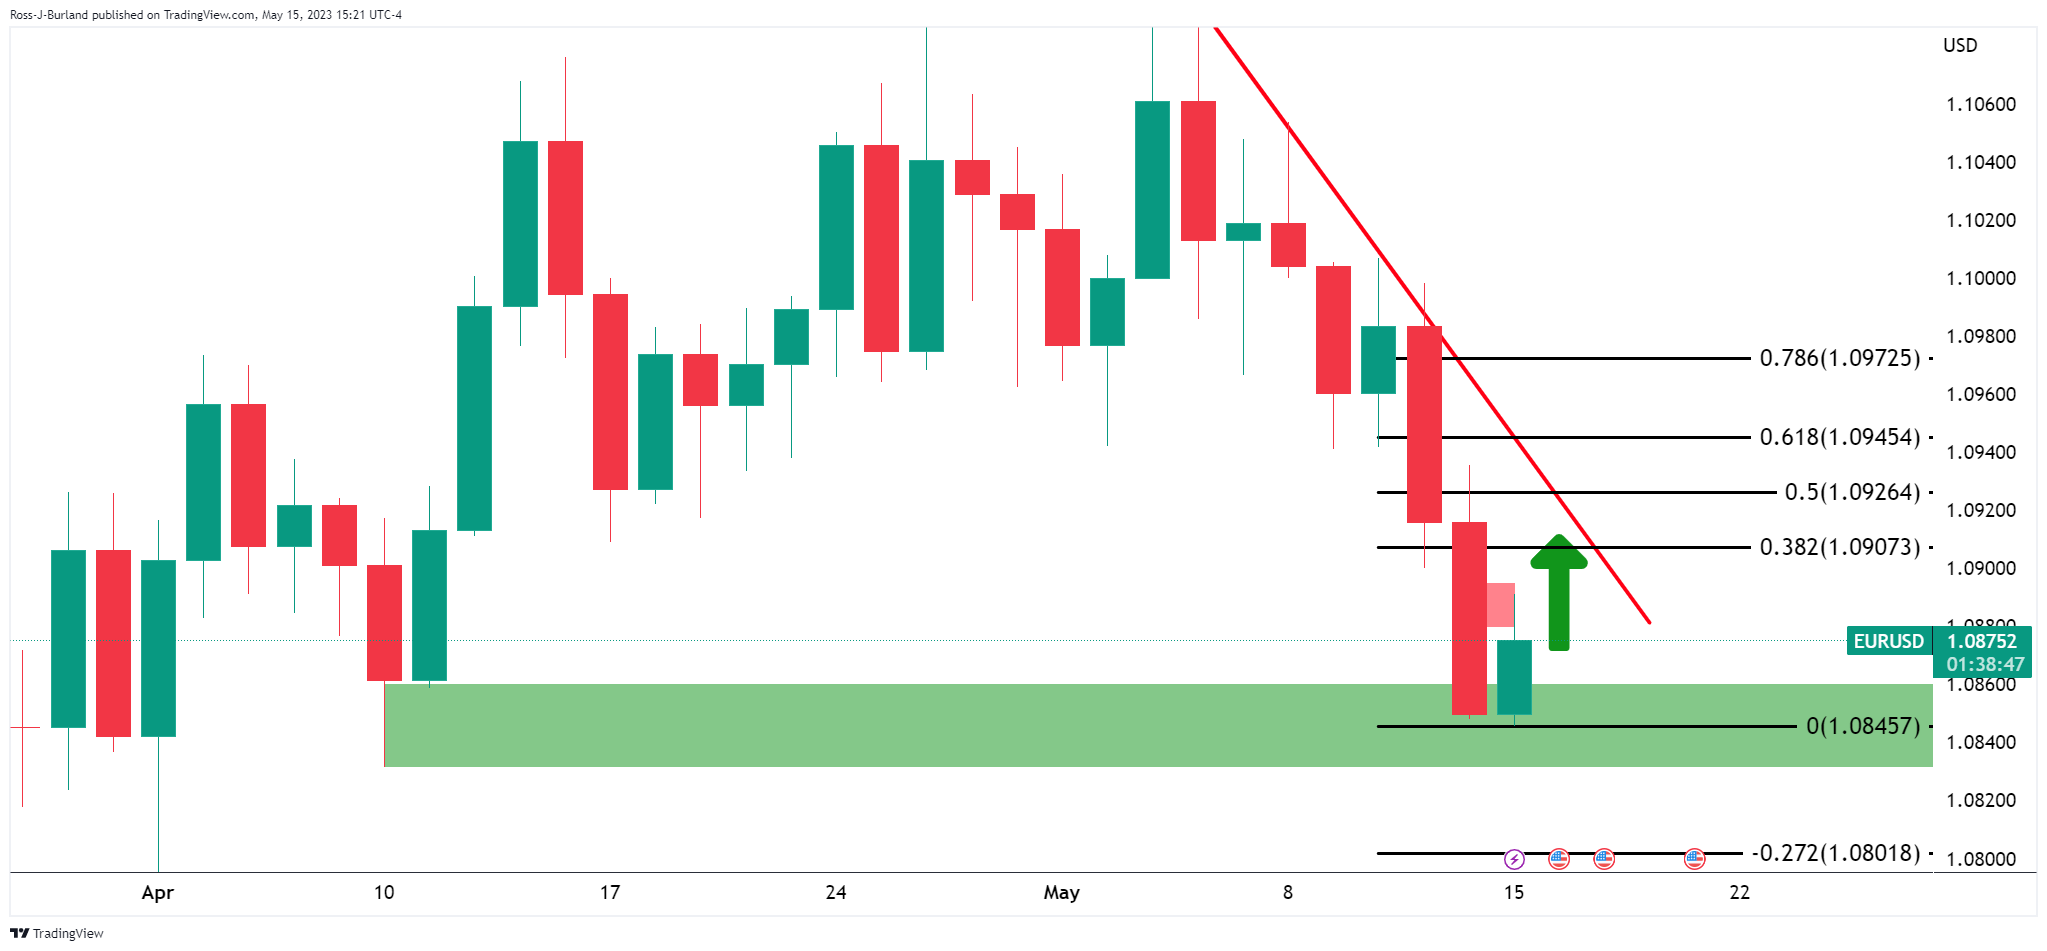
- EUR/USD is looking for a break above 1.0880 amid a cheerful market mood.
- The US Treasury expects that it would be able to pay bills only through June 1 without a debt limit increase.
- Eurozone GDP is seen unchanged on a quarterly and an annual basis at 0.1% and 1.3% respectively.
The EUR/USD pair is showing a back-and-forth action below the immediate resistance of 1.0880 in the Asian session. The major currency pair is expected to surpass the immediate resistance as the US Dollar Index (DXY) is still in a corrective mode.
S&P500 futures added decent gains on Monday as the Federal Reserve (Fed) is perceived to pause the interest-rate hiking spell. Easing fears of recession due to no further restriction on the interest rate policy will induce optimism among investors and general producers.
The USD Index is expected to extend its correction further below 102.40 amid dovish commentary from Atlanta Federal Reserve President Raphael Bostic. Fed policymaker told Bloomberg on Monday that, if he were voting now, he would vote to hold rates in June. However, he warned that he has to keep a possible rate hike on the table.
On Tuesday, investors will keenly focus on US debt-ceiling negotiations. Reuters reported that “The US Treasury Department reiterated on Monday it expects that it would be able to pay the US government's bills only through June 1 without a debt limit increase, increasing pressure on congressional Republicans and the White House to reach a deal in coming days.”
Meanwhile, Eurozone investors will keep focusing on preliminary Gross Domestic Product (GDP) data for the first quarter of CY2023. The pace in GDP growth is seen unchanged on a quarterly and an annual basis at 0.1% and 1.3% respectively.
The street is confused about the number of interest rate hikes from the European Central Bank (ECB). MNI reported on Monday that the ECB was most likely to raise key rates once or twice more in this tightening cycle.
According to MNI, the majority of the ECB Governing Council still sees it unlikely for the policy rate to reach 4%.
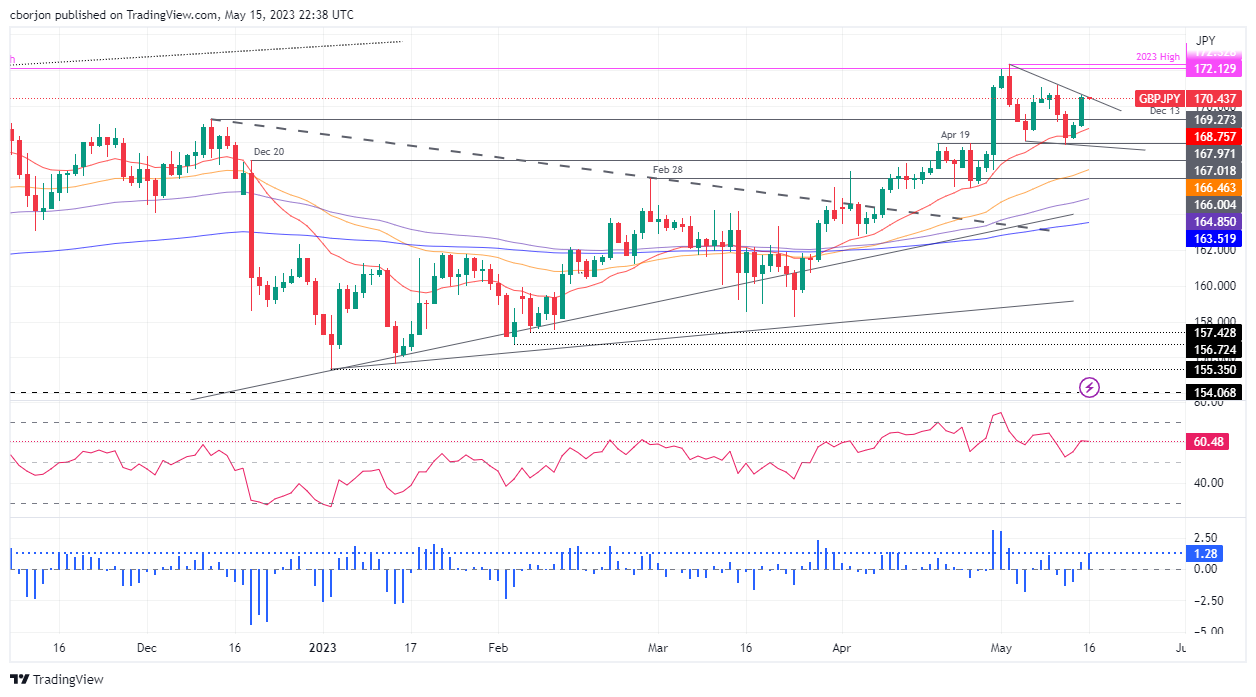
- GBP/JPY forms a falling wedge and double bottom chart pattern, piercing the 20-day EMA.
- The pair must crack the two-week-old resistance trendline to aim for a YTD high of 172.33.
- RSI and 3-day RoC indicators support further upside potential for GBP/JPY.
After forming a bullish-harami candlestick pattern last Friday, GBP/JPY prints back-to-back positive gains, later confirmed by Monday’s price action. The GBP/JPY reached a low of 168.86 before rallying sharply, towards 170.49. At the time of writing, the GBP/JPY is trading at 170.47.
GBP/JPY Price Analysis: Technical outlook
Since the last days of April, the GBP/JPY began to form a falling wedge that also turned into a double bottom chart pattern in the daily chart. The GBP/JPY bottomed at around 167.84 and pierced the 20-day Exponential Moving Average (EMA) at 168.76 before climbing back toward the 170.00 figure area.
On its way up, the GBP/JPY must crack a two-week old resistance trendline at around 170.30/50. Once done, the GBP/JPY would aim toward the year-to-date (YTD) high of 172.33. But firstly, the GBP/JPY needs to clear some resistance levels. The first supply zone would be the May 10 daily high of 171.17. A breach of the latter will expose 172.13, the last year’s high, before testing 172.33.
Conversely, a drop below 170.00, the GBP/JPY can pull back toward the December 13 daily high-turned-support at 169.27, followed by the 20-day EMA at 168.75. Downside risks lie at the 168.00 figure before testing the 167.50 area.
The Relative Strength Index (RSI) indicator suggests further upside is warranted, and the 3-day Rate of Change (RoC), portrays the GBP/JPY could register another leg-up towards testing the YTD high.
GBP/JPY Price Action – Daily chart
“The US Treasury Department reiterated Monday it expects to be able to pay the US government's bills only through June 1 without a debt limit increase, increasing pressure on congressional Republicans and the White House to reach a deal in coming days, reported Reuters.
The news also quotes US Treasury Secretary Janet Yellen saying, “The debt ceiling could become binding by June 1.”
"If Congress fails to increase the debt limit, it would cause severe hardship to American families, harm our global leadership position, and raise questions about our ability to defend our national security interests," adds US Treasury Secretary Yellen.
That said, Reuters also reported that Democratic and Republican staff were working to find common ground on spending levels and energy regulations before a planned Tuesday meeting between Biden, McCarthy and the three other top congressional leaders.
Also read: Forex Today: US Dollar corrects lower amid cautious markets
- GBP/USD grinds higher after posting the biggest daily jump in two weeks, bouncing off the lowest levels in fortnight.
- Cautious optimism surrounding US debt ceiling solution allows US Dollar bulls to take a breather.
- UK employment details will be crucial for Pound Sterling buyers after BoE, UK growth numbers came in mixed.
- US Retail Sales for April, President Biden’s debt ceiling negotiations with House Speaker McCarthy eyed too.
GBP/USD portrays typical pre-data anxiety above 1.2500, following the biggest daily rebound in a fortnight as the key Tuesday begins. That said, the Cable pair managed to cheer hawkish comments from the Bank of England (BoE) Chief Economist, as well as a broad US Dollar retreat amid mildly positive sentiment, the previous day. However, traders remain cautious as they approach monthly readings of the UK employment readings, US Retail Sales and the all-important US debt ceiling talks.
“The Bank of England needs to guard against second-round inflationary effects which could see inflation bottom out at 4% or 5%, rather than return to its 2% target, BoE Chief Economist Huw Pill said on Monday,” per Reuters.
On the other hand, the White House announced a meeting between President Joe Biden and Republican House of Representatives Speaker Kevin McCarthy to overcome the looming US default. Ahead of the event, the US policymakers appear somewhat optimistic about extending the debt ceiling limit before the June expiry.
Apart from the risks, the largest fall US NY Empire State Manufacturing Index since April 2020, to -31.8 for May, joined mixed Fed talks to also weigh on the US Dollar. That said, Atlanta Fed President Raphael Bostic told CNBC on Monday that there is still a long distance to go on inflation and added that they may have to "go up on rates," as reported by Reuters. Bostic further noted that he will not be looking at cutting rates until well into 2024 in his baseline scenario. On the contrary, Chicago Federal Reserve Bank President Austan Goolsbee said in an interview with CNBC on Monday that a lot of impact of rate hikes is still in the pipeline. Furthermore, Minneapolis Fed President Neel Kashkari stated that signaled that the Fed has a long way to go to get inflation to 2.0%.
Amid these plays, Wall Street closed with mild gains and the US Treasury bond yields dribbled in a positive territory. That said, the US Dollar Index (DXY) snapped a two-day uptrend while retreating from the five-week high.
During the last week, the preliminary readings of the UK’s first quarter (Q1) Gross Domestic Product (GDP) mark 0.1% QoQ growth versus 0.1% expected and prior readouts. That said, the monthly GDP for March, however, dropped -0.3% compared to 0.0% market forecasts and previous readings. Further, the British Manufacturing and Industrial Production details for March marked mixed outcomes. Following the UK data dump, British Finance Minister Jeremy Hunt said, “Good news the economy is growing, but need to stay focus on tax, labor supply and productivity.”
It’s worth noting that the Bank of England’s (BoE) dovish hike also highlights today’s UK Claimant Count Change for April, Average Earnings for three months to March and ILO Unemployment Rate for three months to March. Should the scheduled data portrays downbeat figures, which is less likely, the GBP/USD may pare recent gains.
More importantly, upbeat prints of the US Retail Sales for April and a solution to the US debt ceiling problem, which is less likely, may allow the Pound Sterling to remain firmer.
Technical analysis
Although a one-month-old ascending trend line restricts short-term GBP/USD downside near 1.2450, the Cable buyers need validation from the mid-April peak of around 1.2550 for conviction.
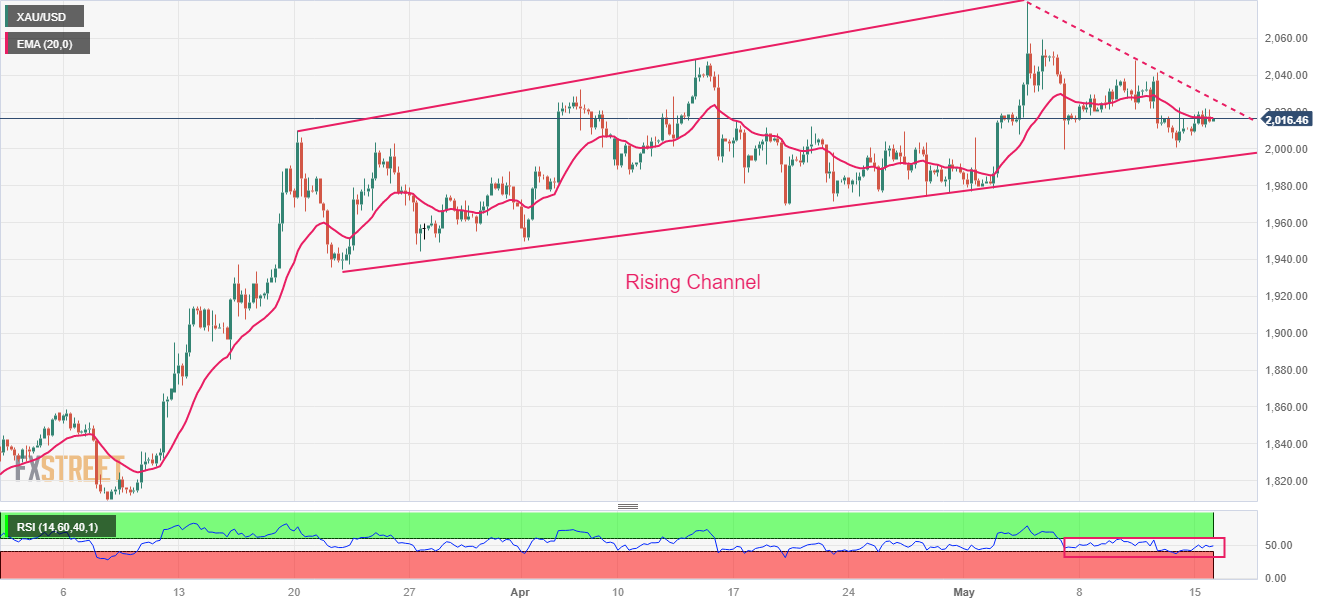
- Gold price is awaiting the US Retail Sales data release and the outcome of US debt ceiling talks for further guidance.
- The USD Index corrected gradually to near 102.43 amid accelerating odds of a pause in the rate-hike spell by the Fed.
- The downward-sloping trendline plotted from all-time highs at $2,079.78 is acting as a barricade for the Gold bulls.
Gold price (XAU/USD) remained choppy on Monday as investors shifted to the sidelines for the release of the United States Retail Sales data. The precious metal traded in a narrow range of $2,012-2,022 as investors believe that the outcome of US debt ceiling talks and the release of the US Retail Sales data will be an important trigger for further guidance.
S&P500 ended with decent gains on Tuesday as investors perceive that the Federal Reserve (Fed) will pause its aggressive interest rate hike policy. The street is anticipating that further monetary policy restrictions would make severe damage to the economy.
The US Dollar Index (DXY) corrected gradually to near 102.43 amid accelerating odds of a pause in the rate-hike spell by Fed chair Jerome Powell. US inflation has significantly slowed down and labor market conditions have also softened, which is providing luxury to the Fed for keeping the monetary policy stable. Contrary, the 10-year US Treasury yields jumped above 3.50%.
Going forward, monthly Retail Sales (April) data is seen expanding by 0.7% vs. a contraction of 0.6%. This indicates a rebound in the households’ retail demand, which could propel inflationary pressures again.
Gold technical analysis
Gold price is auctioning in a Rising Channel chart pattern on a four-hour scale. The upper portion of the aforementioned chart pattern is plotted from March 20 high at $2,009.88 while the lower portion is placed from March 22 low at $1,934.34. The downward-sloping trendline plotted from all-time highs at May 03 high at $2,079.78 is acting as a barricade for the Gold bulls.
The 20-period Exponential Moving Average (EMA) at $2,016.50 is overlapping the Gold price, indicating a lackluster move ahead.
The Relative Strength Index (RSI) (14) is oscillating in the 40.00-60.00, which indicates that investors await a fresh trigger for further action.
Gold four-hour chart
- AUD/USDs W-formation´s neckline could be holding up as support for the day ahead.
- Bulls eye bullish continuation with 0.6720 eyed.
AUD/USD has moved up to challenge the 0.6700 area in a 38.2% Fibonacci retracement of the bearish run in the M-formation, a pattern illustrated in the pre-open market analysis at the end of Friday:
- AUD/USD Price Analysis: Bears will be looking for a premium in the open
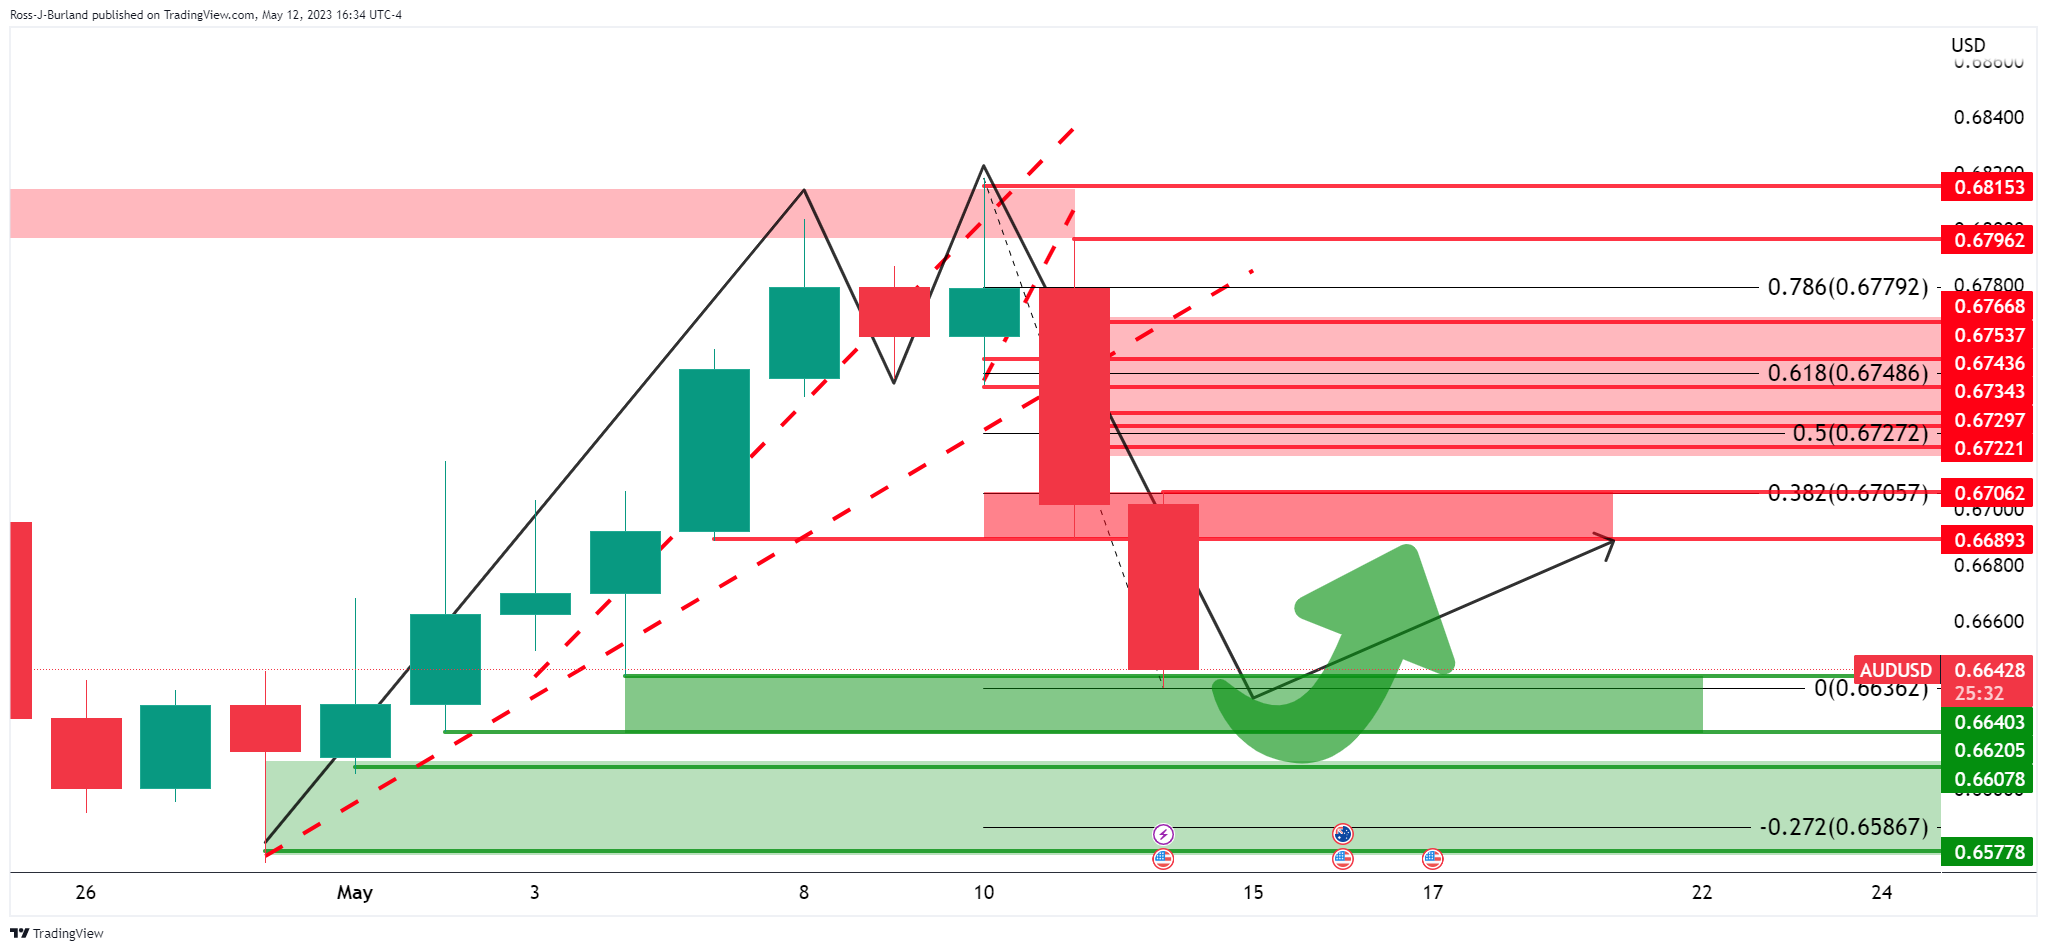
It was stated that the 0.6640s and 0.6620s were highlighted as the first support zone and that there could be a correction from this point.
AUDU/SD update
AUD/USD has rallied from the lows and has completed a test of the 38.2% Fibonacci retracement. A continuation would be expected at this juncture for the day ahead.
AUD/USD H1 chart
If we zoom down to the 1-hour charts, we can see the price is forming an inverse head and shoulders and is on the backside of the prior bearish trendline:
The W-formation´s neckline could be holding up as support for the day ahead and we might see a bullish continuation with 0.6720 eyed.
- Double top formation in XAG/USD daily chart targets a fall toward $22.91.
- Silver surpasses crucial support levels, turning resistance at 20-day and 50-day EMAs.
- Oscillators like RSI and 3-day RoC suggest selling pressure fading as the Silver price recovers.
Silver price bounced off after dipping below the 50-day Exponential Moving Average (EMA) at $24.27, erasing some of its earlier losses that sent the white metal to a new daily low of $23.88. At the time of writing, the XAG/USD is trading at $24.05, above its opening price by 0.45%.
Silver Price Analysis: XAG/USD Technical outlook
The XAG/USD daily chart portrays the formation of a double top, which targets a fall toward $22.91. After XAG/USD failed to crack the $26.13 year-to-date (YTD) high, it opened the door for a pullback, dragging Silver’s price toward $24.00.
As XAG/USD fell, the white metal surpassed crucial support levels, turning resistance like the 20-day EMA at $24.88 and the 50-day EMA at $24.27. Nevertheless, if XAG/USD crosses below $24.00, it would exacerbate a test of the 100-day EMA at $23.48, followed by the double top target of $22.90, a few pips above the 200-day EMA at $22.76.
Oscillators, like the Relative Strength Index (RSI) indicator at bearish territory, have made a U-turn as the white metal recovers; while the 3-day Rate of Change (RoC) shows that selling pressure has begun to fade.
Silver Price Action – XAG/USD Daily chart

- NZD/USD bulls are moving on a soft US Dollar.
- Bears are lurking in the Fibonacci scale below 0.6320.
NZD/USD is down on the day, losing some 0.12%, and has fallen from a high of 0.6240 and reached a low of 0.6232.
The Kiwi has picked up a touch off yesterday’s lows, reflecting a combination of a weaker USD, and market chatter about the possibility of the OCR perhaps needing to climb to 6% given the migration boom.,´´ analysts at ANZ Bank explained.
´´It is certainly a risk and as we have said for a while, we do think local rates markets are overplaying cuts when the battle against inflation isn’t even won yet, but New Zealand faces fiscal and current account challenges as well, so other than higher carry, it’s not clear whether these challenges and presumably the prospect of moderating growth is good for the Kiwi,´´ the analysts added.
´´In the US, debt ceiling negotiations are dragging on, and Fed speakers are pushing back against market calls for cuts; that’s helping the USD,´´ the analysts concluded.
NZD/USD technical analysis
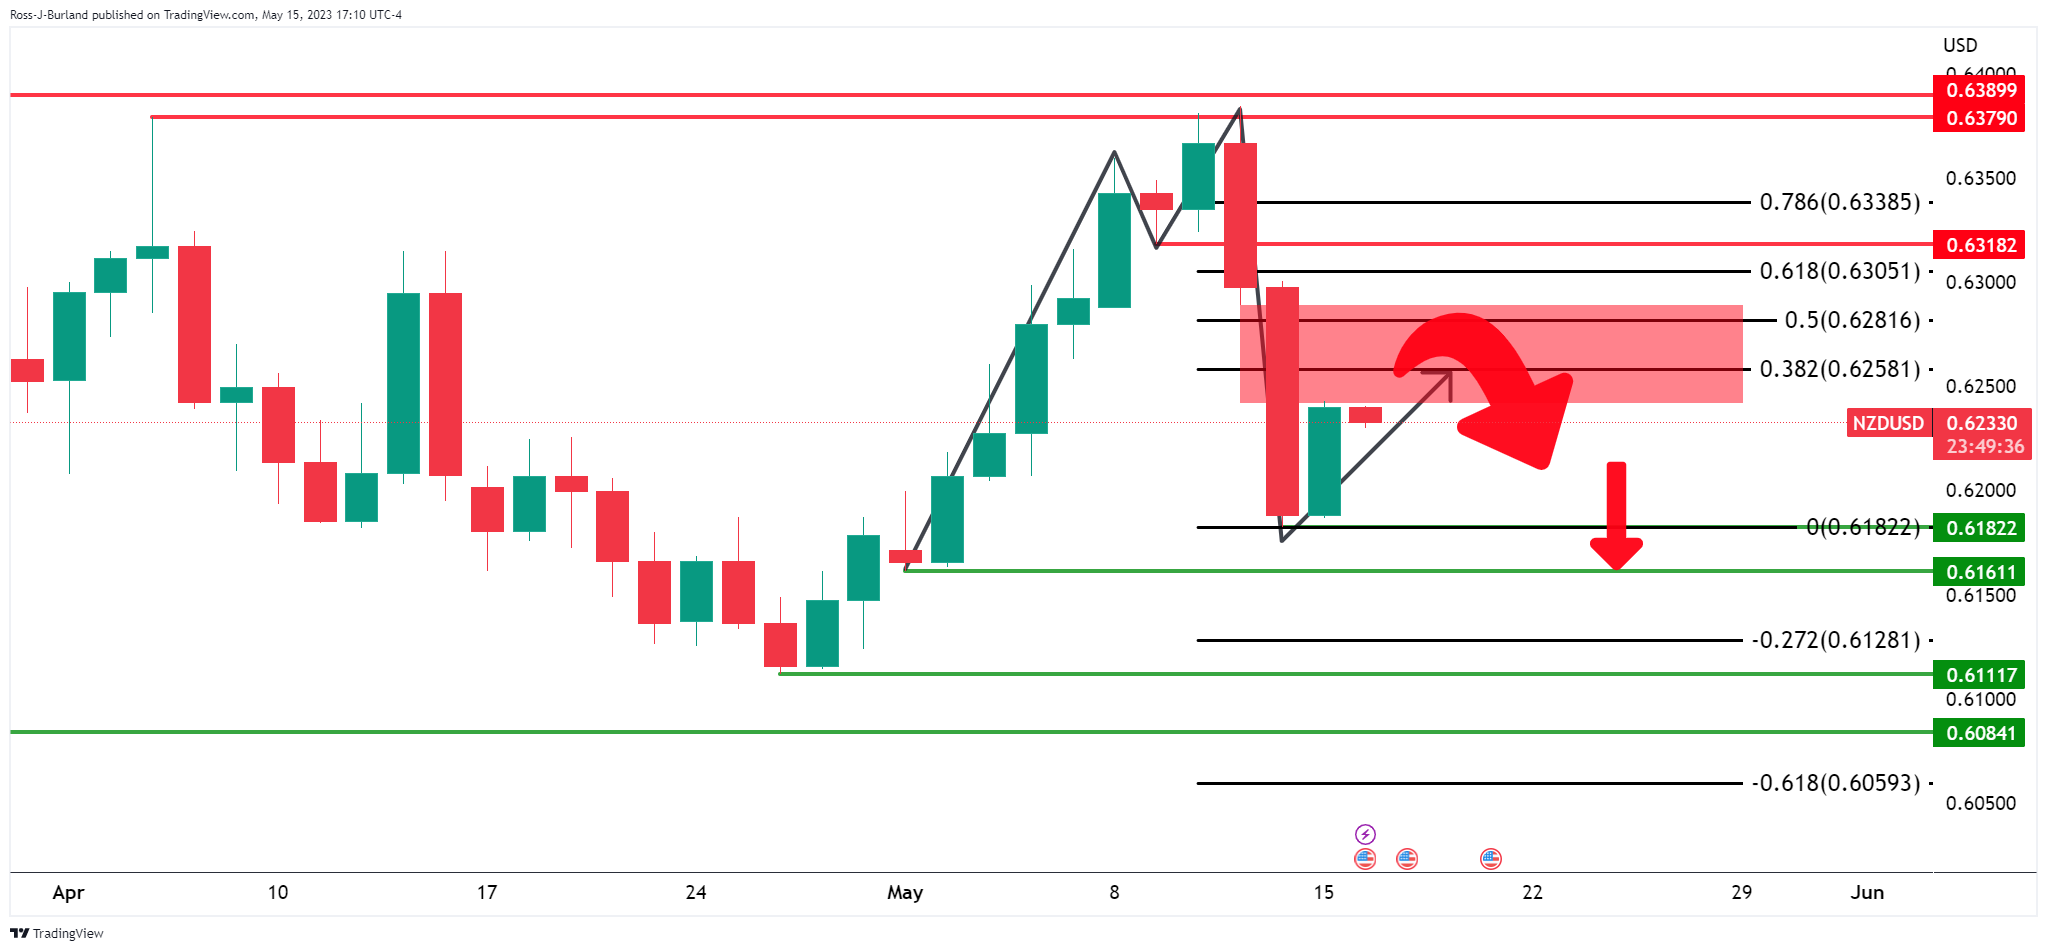
From a daily perspective, the M-formation is pulling the price into the Fibonacci scale with a focus on the 0.6320s as a key resistance area if bulls were to commit.
On Tuesday, the Reserve Bank of Australia is scheduled to release its minutes. Additionally, Chinese data is also due, while the UK will report employment figures and the Eurozone will provide growth data. Furthermore, US President Biden will meet with McCarthy, and the US will release Retail Sales data.
Here is what you need to know on Tuesday, May 16:
The US Dollar dropped on Monday, as equity prices rose modestly in Wall Street. US yields rose again, with the 10-year Treasury yield climbing above 3.50%, and the 2-year above 4.0%.
Economic data from the US surprised to the downside, with the New York Empire Manufacturing falling from 10.8 to -31.8, the largest fall since April 2020. On Tuesday, the Retail Sales data is due.
Market participants will continue to watch closely the debt ceiling drama; the White House announced that President Biden will meet on Tuesday with House Speaker Kevin McCarthy.
EUR/USD rose from monthly lows and closed around 1.0870. The Euro lagged on Monday; Eurozone GDP and Employment data are due on Tuesday.
GBP/USD jumped back above 1.2500 and EUR/GBP posted the lowest daily close in five months below 0.8680. The UK will report employment on Tuesday.
The Japanese Yen was the worst performer, affected by higher government bond yields. USD/JPY rose for the third consecutive day, climbing above 136.00.
AUD/USD rebounded, erasing Friday's losses and retaking 0.6700. The Reserve Bank of Australia (RBA) will release the minutes of its latest meeting on Tuesday; the Employment report is due on Thursday.
NZD/USD rose after losing 180 pips during the previous two sessions, approaching 0.6250.
USD/CAD pulled back to 1.3450, weakened by a slide of the US Dollar and a rally in crude oil prices, which rallied 1.80%. Canada will report April consumer inflation on Tuesday.
Canadian CPI Preview: Forecasts from five major banks, inflation likely to ease again
Gold rose modestly but failed to hold above $2,020/oz; Silver closed above $24.00.
Like this article? Help us with some feedback by answering this survey:
- The US Dollar is meeting resistance near 102.80.
- Bears eye a break below the 101.70s, then 100.80s.
The US Dollar fell from a five-week high on Monday as traders move away from the greenback due to the debt ceiling issue, which could force the US government to default on its debt if not resolved.
US Dollar, DXY, daily charts
DXY is on the backside of the prior bullish trend and the market is breaking down.
Bears need to get below the 101.30s and the triple-bottom lows, or, otherwise face a bullish correction with 102.80 resistance eyed.
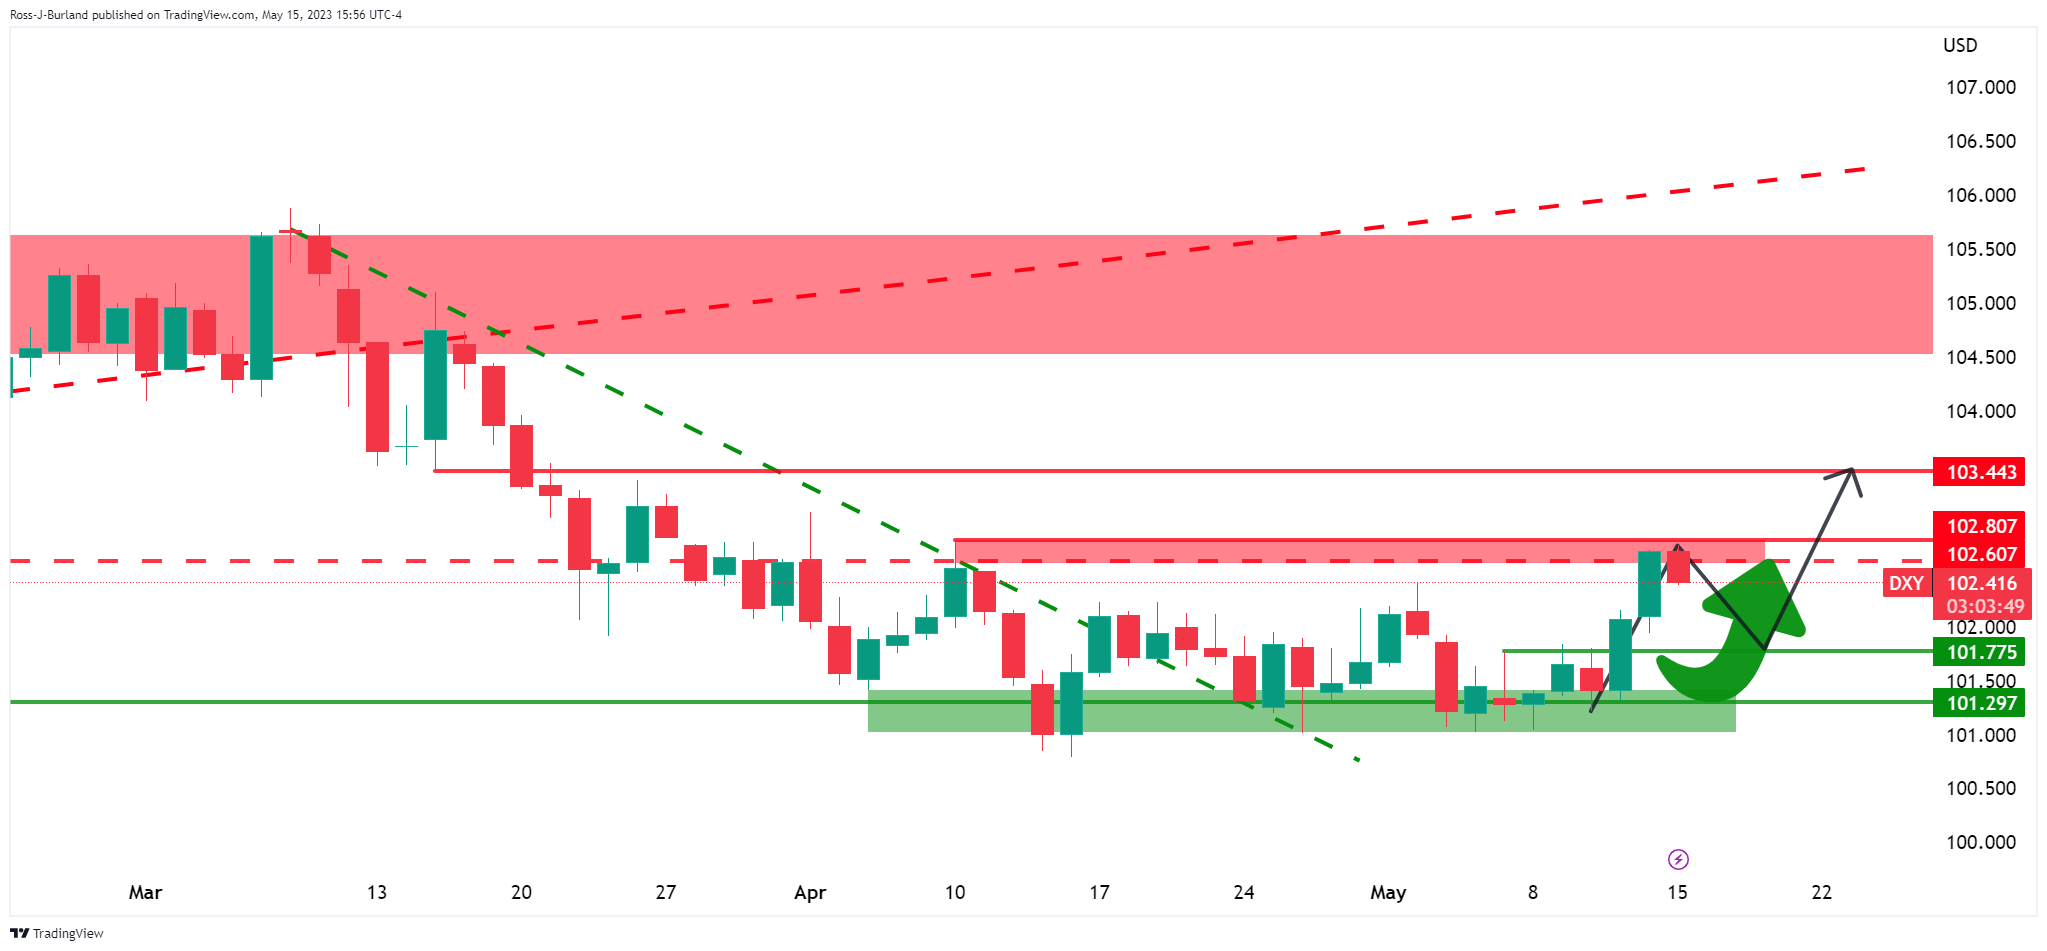
DXY bearish scenario
If the bears commit at resistance then the downside breakout will be at risk in a continuation of the general bearish structure.
- Market anticipation for Banxico’s monetary policy decision influences USD/MXN trading activity.
- Disappointing New York Empire State Manufacturing Index adds to the US Dollar’s struggles.
- US debt ceiling talks and mixed messages from Federal Reserve speakers impact market sentiment.
USD/MXN prolongs its fall as the Mexican Peso (MXN) continues to strengthen, with the USD/MXN falling to a new seven-year low at around 17.4339, surpassing the July 2017 low of 17.4498, amidst a risk-on impulse that keeps most US equities on the green. The safety status of the US Dollar (USD), has been compromised, as a light US economic agenda, would leave investors leaning on market sentiment, and central bank speaking. At the time of writing, the USD/MXN is trading at 17.4424, down by 0.80%.
Risk-on impulse and light US economic agenda contribute to USD weakness
The week’s highlight is Banxico’s monetary policy decision, where the central bank is expected to keep rates unchanged at 11.25%. However, a few analysts are looking for a 25 bps rate hike to 11.50% after the bank decided to lift rates at a more gradual pace of 25 bps, with the central bank changing its language, saying that since the last monetary policy meeting, “annual headline inflation has decreased more than expected. For its upcoming decision, the Board will take into account the inflation outlook, considering the monetary policy stance already attained.”
Analysts at BBH noted that since Banxico’s last monetary policy meeting, “both headline and core have continued to fall, so we believe rates will likely be kept steady this week. The swaps market sees a steady rate for the next three months followed by the start of an easing cycle over the subsequent three months, which seems too soon to us.”
Therefore, the USD/MXN’s reaction on Monday could be traders positioning ahead of the Bank of Mexico’s decision.
Meanwhile, the US economic calendar revealed the New York Empire State Manufacturing Index disappointed investors, slumping to -31.3 vs. the -3.9 estimated. The report revealed that nearly 50% of respondents to the survey said business conditions worsened, with the orders index sipping, while a gauge of prices showed an increase, and the employment component shrank.
The price rise would likely keep the US Federal Reserve (Fed) from pausing on its monetary policy, as Jerome Powell and Co. opened the door for a pause on the subsequent monetary policy reunions.
Meanwhile, discussions about raising the US debt ceiling in the United States (US) continued to grab the headlines. US President Joe Biden commented that talks were “moving along,” while Lael Brainard, the National Economic Director, commented that negotiations between both parties were serious and constructive.
Federal Reserve speakers had crossed news wires, with a solid battle between the hawks and the doves continuing. On the hawkish side, the Minnesota Fed President Neil Kashkari, although emphasizing that inflation is high but slowing down, said that the Fed has more work to do. Echoing some of his comments, Richmond’s Fed President Thomas Barkin said, “If inflation persists, or God forbid accelerates, there’s no barrier in my mind to further increases in rates,” he said to the Financial Times.
USD/MXN Price Analysis: Technical outlook
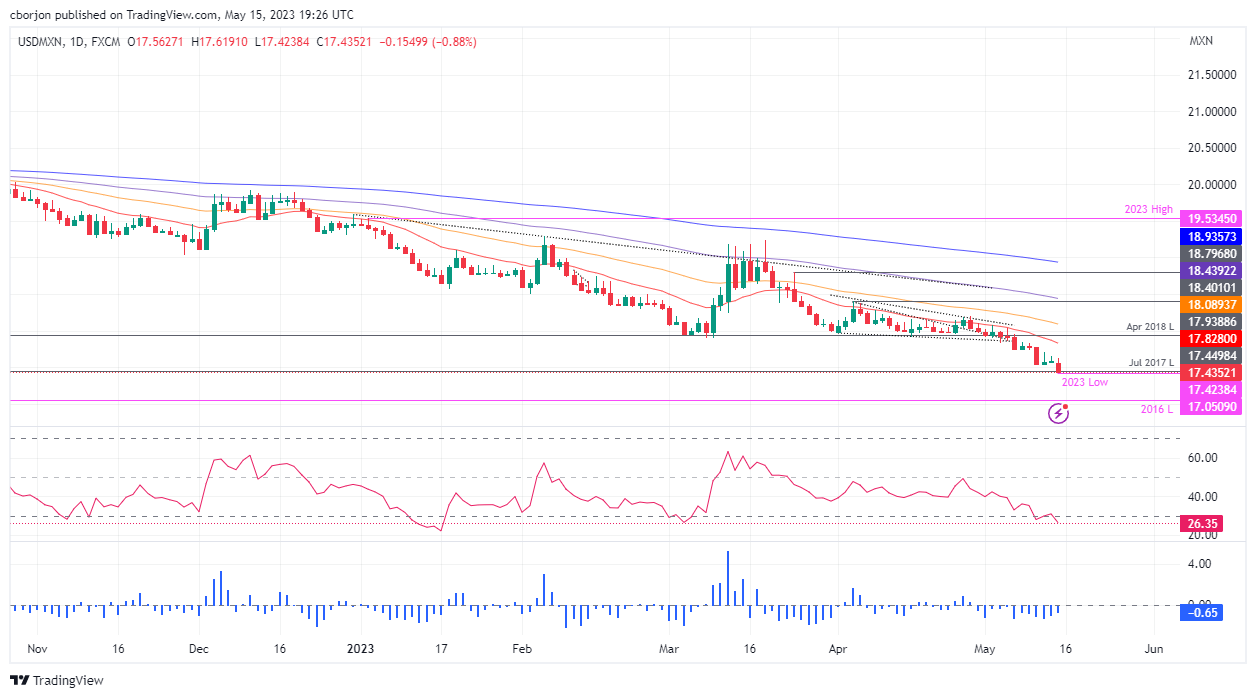
The USD/MXN would likely continue to trend lower, as shown by price action. Given that Banxico would keep rates unchanged or surprise the markets with a 25 bps rate hike do not discount the USD/MXN’s could fall as low as the 2016 yearly low of 17.0509, ahead of cracking the 17.0000 figure. Nevertheless, if USD/MXN buyers reclaim 17.5000, that could clear the path towards testing the 20-day EMA at 17.8281 before reclaiming the 18.0000 psychological level.
- A strong test of the trendline resistance in EUR/USD could be on the cards.
- US Dollar is pressured and gives EUR bulls an advantage from daily support.
EUR/USD bull's eye a strong continuation on the correction to the 38.2% Fibonacci 1.0900 and then1.0920s as the 50% mean reversion area.
EUR/USD daily chart
The case for the downside will build when we see a deceleration of the correction which might still be in its initial days.
EUR/USD H4 charts
However, there are prospects of a move lower on the lower time frames, such as the H4 chart above and the H1 chart below:
EUR/USD H1 chart

With all that being said, however, the daily chart remains biased to the upside:
A 38.2% Fibonacci correction comes in near 1.0900 and 1.0920s and thereafter sees the 50% mean reversion area that would make for a strong test of the trendline resistance.
Atlanta Federal Reserve President Raphael Bostic told Bloomberg on Monday that, if he were voting now, he would vote to hold rates in June. However, he warned that he has to keep a possible rate hike on the table.
Regarding inflation, Bostic mentioned that there is still a way to go. According to him, there has been “some really good progress” made. He forecast inflation to be in the high 3s by year-end.
Market reaction
Bostic's comments triggered no surprises, as market participants are currently pricing in a pause at the FOMC's June meeting. The US Dollar Index is falling by 0.30% on Monday, trading near 102.50.
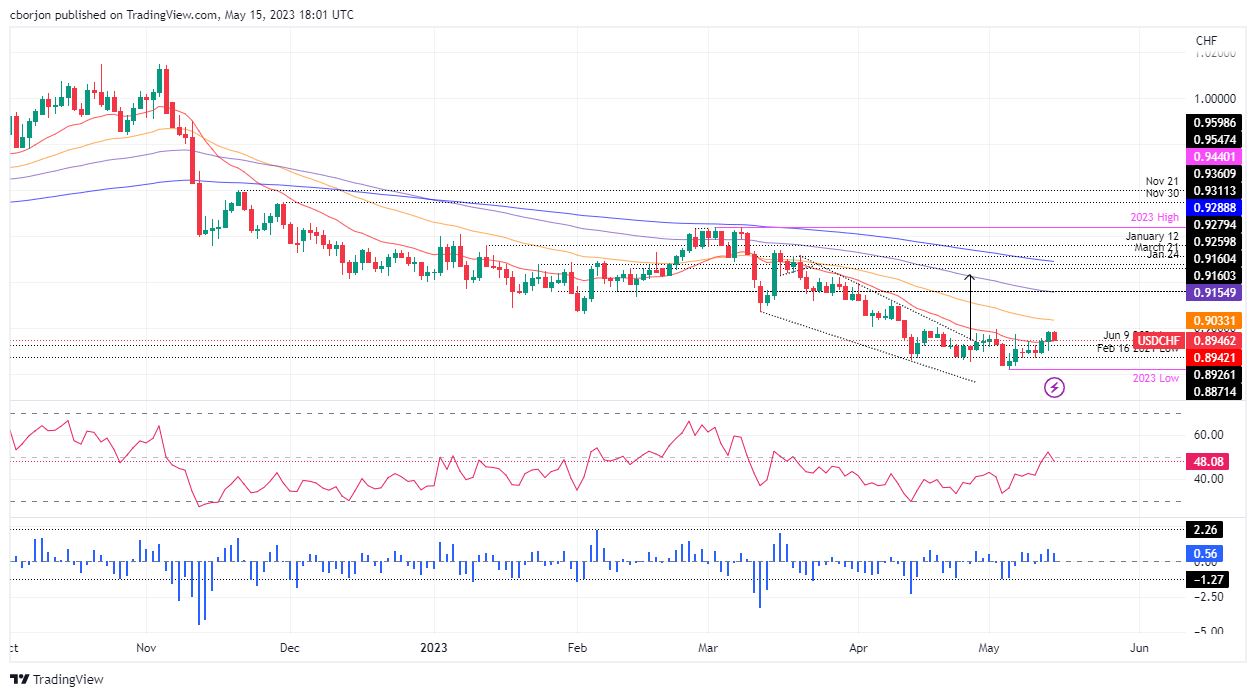
- Swiss Producer and Import Prices for April remain stable at 0.2% MoM, with a 90% chance of a 25 bps rate hike by SNB in June.
- New York Fed’s manufacturing index nosedives, while Fed speakers emphasize high inflation and the need for higher interest rates.
- USD/CHF tests solid support faces downward bias as bearish RSI and 3-day RoC indicators suggest sellers remain in control.
The USD/CHF marched down after hitting a daily high of 0.8987, but US Dollar (USD) bulls’ lack of strength, weak US economic data, and expectations of an aggressive Swiss National Bank (SNB) bolstered the Swiss Franc (CHF). At the time of writing, the USD/CHF is trading at 0.8944, down 0.40%.
Fundamental backdrop
At the beginning of the week, the USD/CHF continued to trend lower, but it’s facing solid support at around the 20-day Exponential Moving Average (EMA). Data in the European session showed that the Producer and Import Prices for April in Switzerland were unchanged at 0.2% MoM, while annually based, ticked lower from 2.1% to 1%. Money market futures odds for a 25 bps rate hike by the SNB are at 90% by the June meeting.
On the US front, the New York Fed announced that its manufacturing index plummeted to -31.3 from the -3.9% contraction expected. Further data showed that the labor market is easing, but prices are rising. Regarding Fed speakers crossing the wires, they reiterated that inflation is high, that there’s some work to do, and that higher interest rates are still working its way through the economy.
USD/CHF Price Analysis: Technical outlook
The USD/CHF is downward biased but testing solid support, which, if it holds, can pave the way for further upside. Nevertheless, the Relative Strength Index (RSI) indicator at 48.19 is in bearish territory, suggesting that sellers remain in charge, while the 3-day Rate of Change (RoC) remains above zero but is about to turn bearish.
If USD/CHF resumes below the 20-day EMA At 0.8942, the next support would be 0.8900. The break below will expose the May 10 daily low of 0.8868 before challenging the YTD low of 0.8879. Conversely, the USD/CHF first resistance would be the 0.9000 figure. A breach of the latter will expose the 50-day EMA At 0.9033, followed by the 100-day EMA at 0.9155.
- USD/JPY bulls are keeping the price elevated above key 135.80-70 structure.
- Bears eye 135.50 in the near term on a break of hourly trendline support.
Despite being broadly softer at the start of the week across a basket of currencies, the US Dollar was up 0.24% against the Yen in midday trade on Wall Street. USDJPY is currently trading at 136.05 and has moved between a low of 135.62 and a high of 136.32.
The US Dollar index, DXY, fell to a low of 102.382 on the day and was down from 102.752, a five-week high, pressured by a weak manufacturing index in New York state and amid fears about the debt ceiling and the US economy. This falls into the hands of the Yen and tallies with the following technical analysis:
USD/JPY daily charts
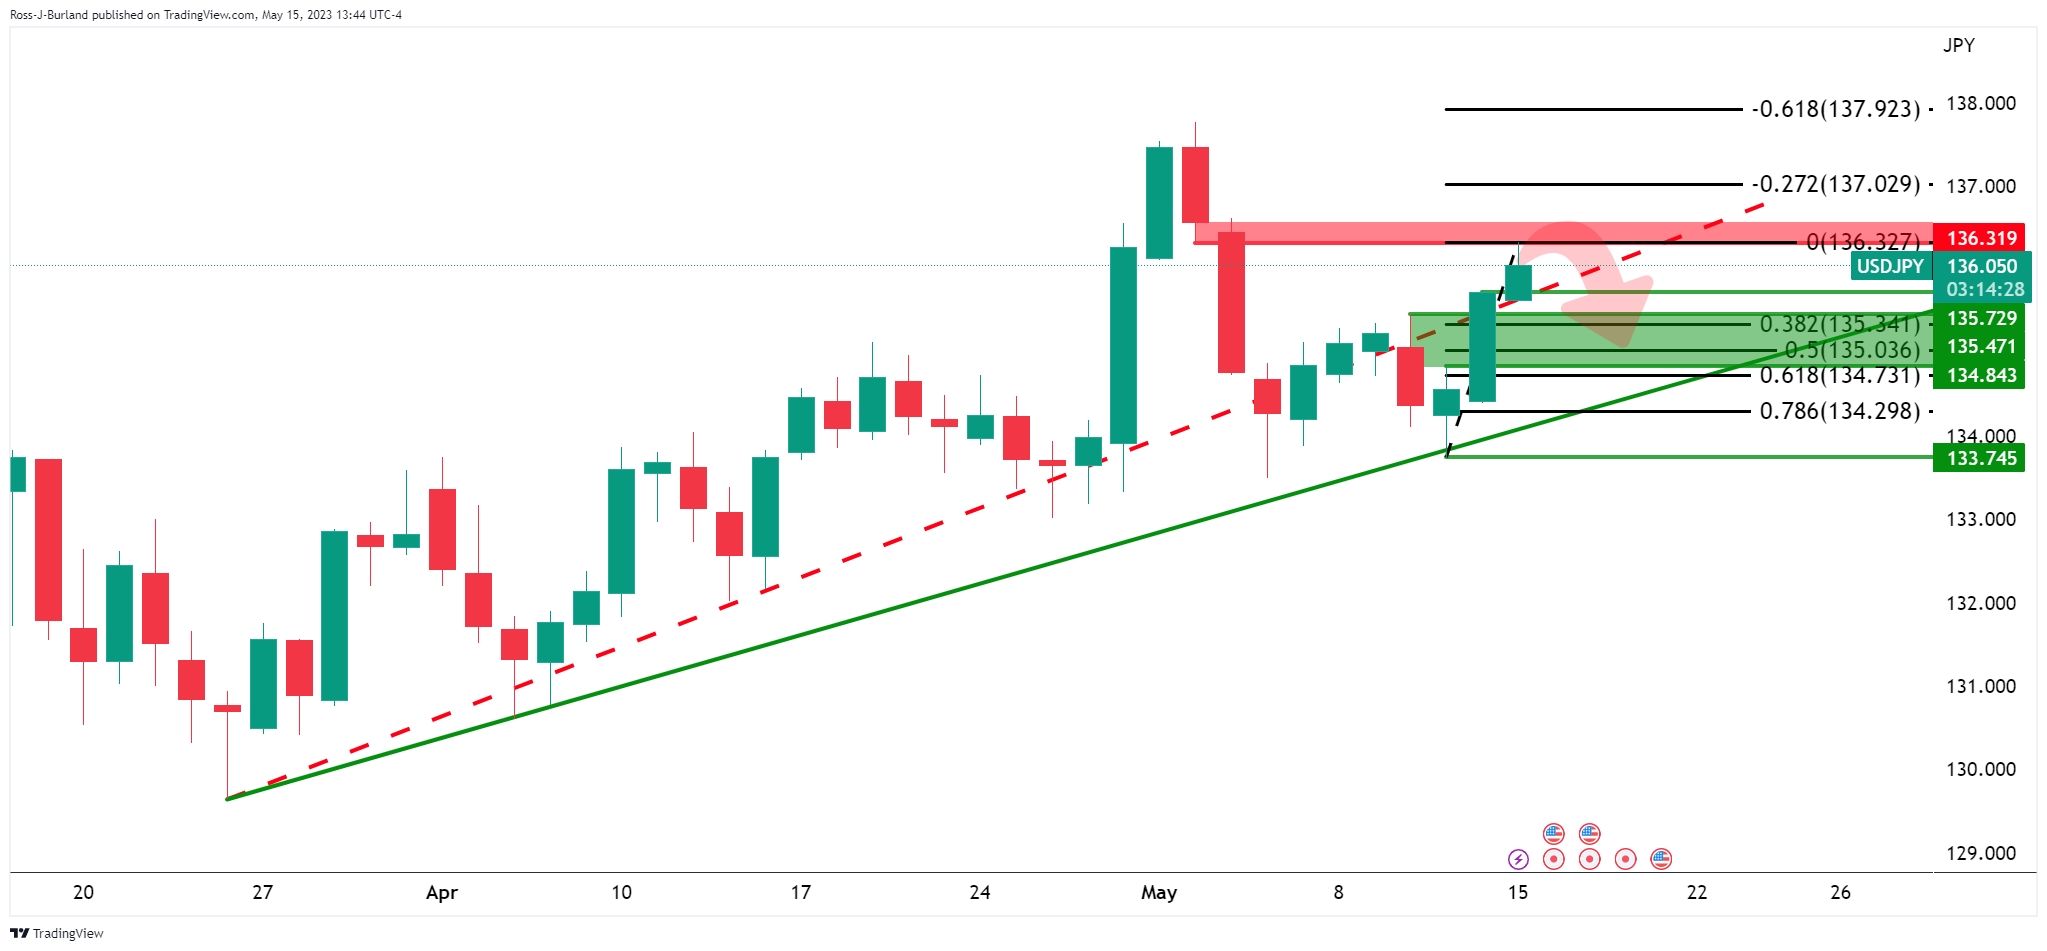
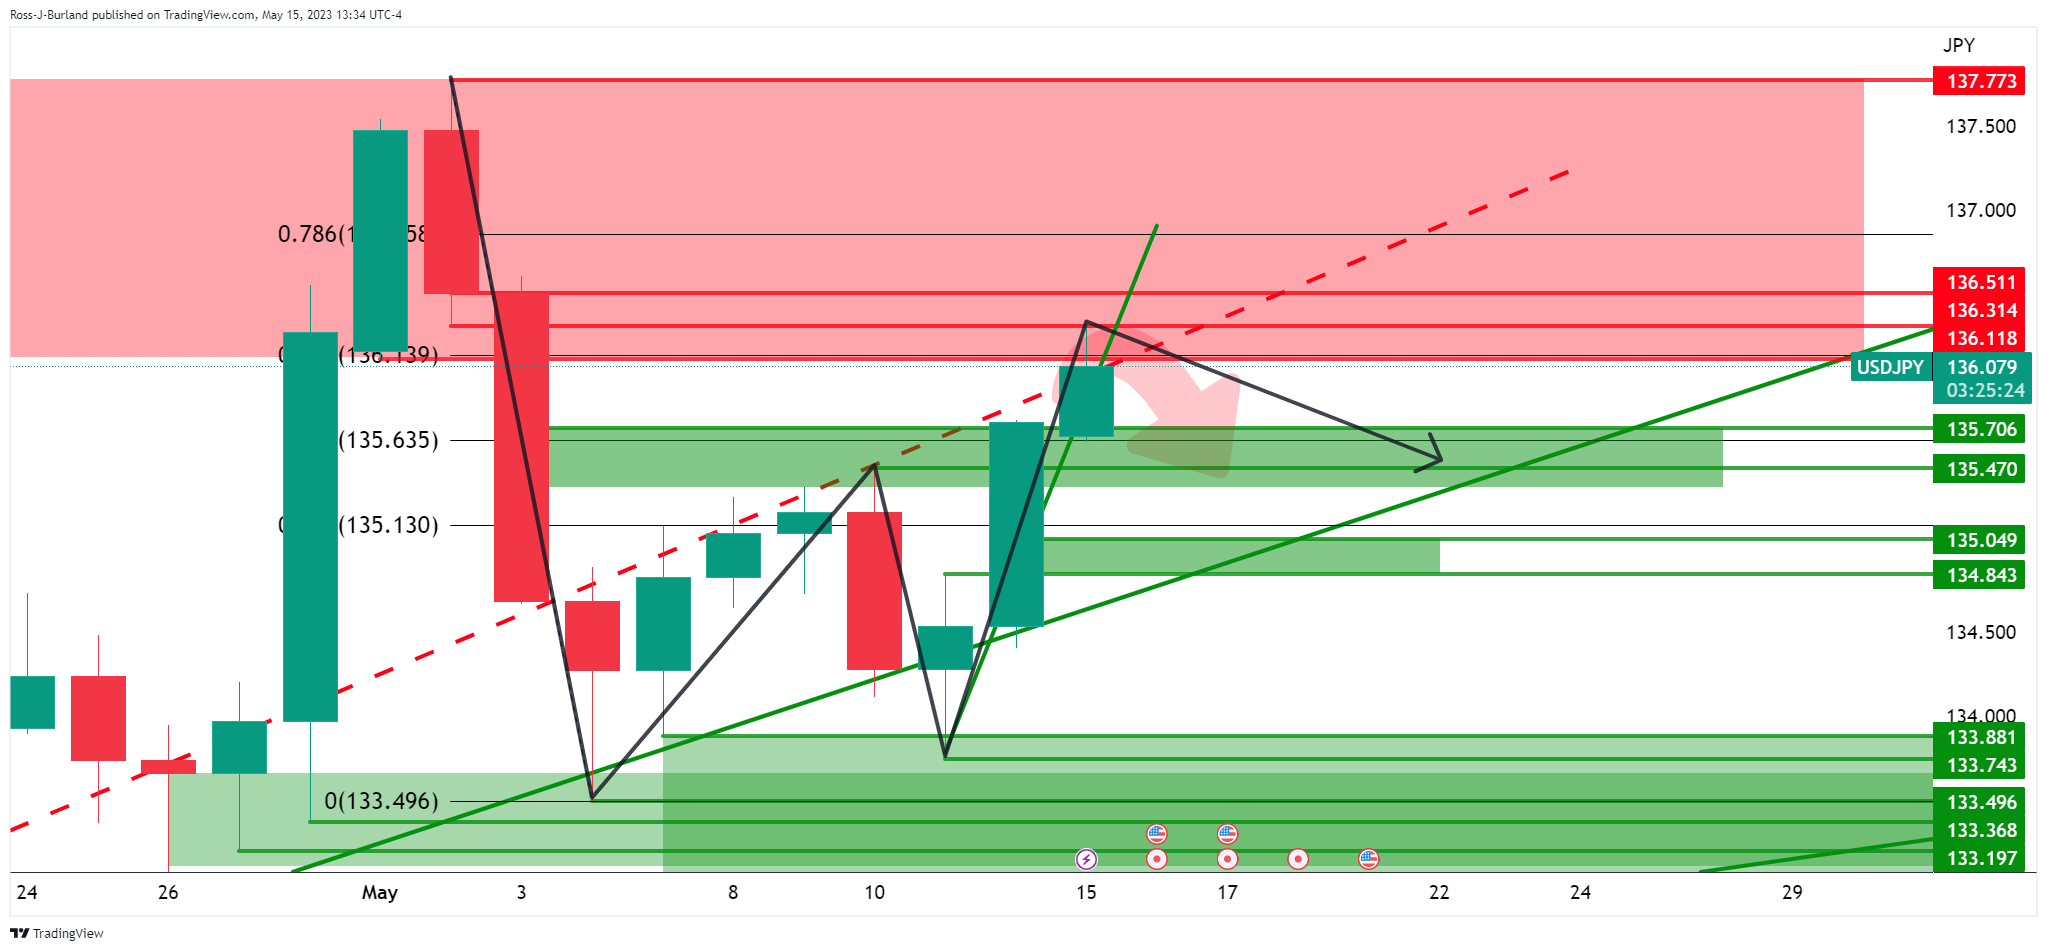
The W-formation is a bearish feature on the daily chart that could equate to a downside correction of the latest bullish impùlse from the resistance area as highlighted in the charts above.
USD/JPY H4 chart
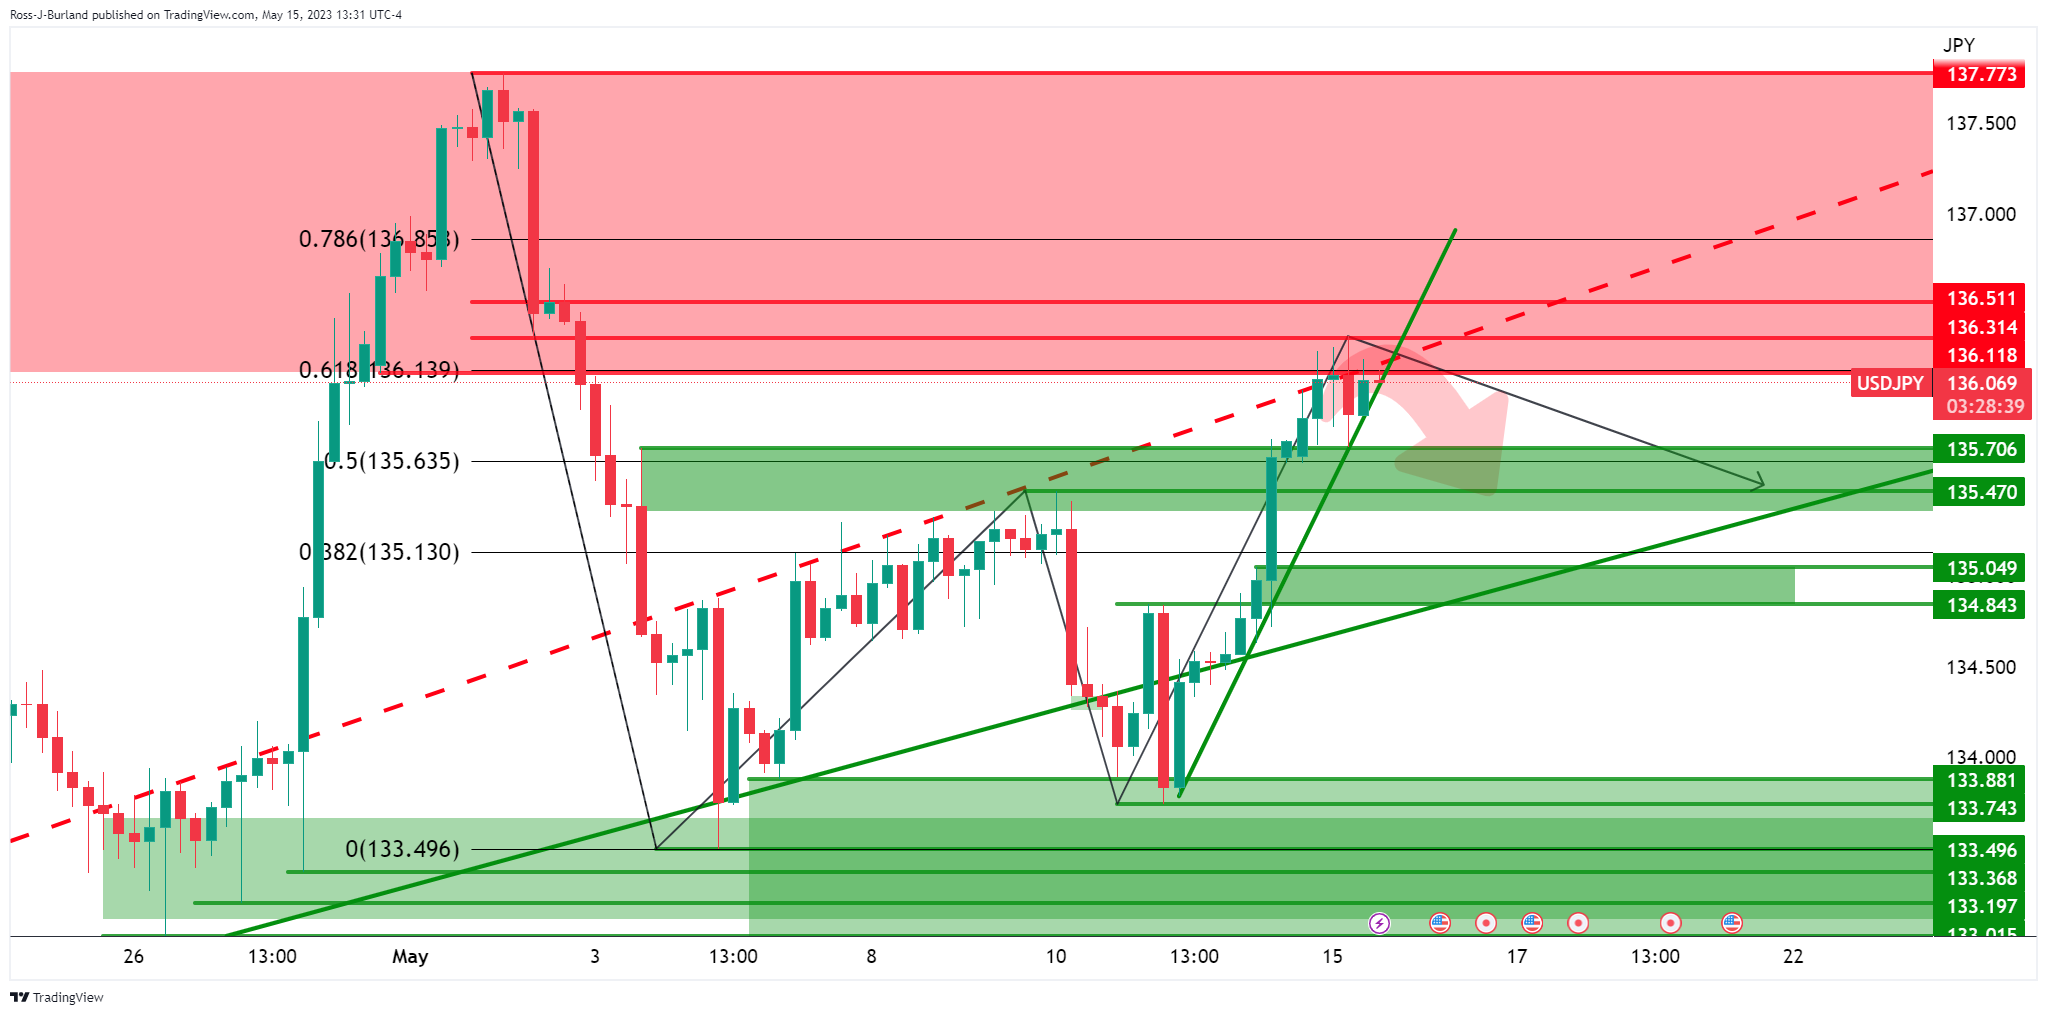
The 4-hour chart sees support coming in near 135.70 and 135.50 ahead of 135.00 and 134.80.
USD/JPY H1 chart
The bears will need to get below the hourly chart´s support structure and 135.80-70.
- USD/CAD made a U-turn after hitting a daily high of 1.3567 due to overall US Dollar weakness.
- The risk-on impulse and higher oil prices underpinned the Canadian Dollar.
- Canadian housing started increasing by 22% in April, with total units rising to 261,600.
USD/CAD makes a U-turn after hitting a daily high of 1.3567 due to overall US Dollar (USD) weakness, spurred by a risk-on impulse and higher oil prices underpinning the Canadian Dollar (CAD). In addition, the release of Canadian inflation looming keeps investors nervous after the Bank of Canada (BoC) left the door open for further rate increases at their minutes release. At the time of writing, the USD/CAD is trading at around 1.3480s, with losses of 0.50%.
Canadian Housing Starts Increase by 22% in April
Data from Canada underpinned the Loonie (CAD), which stages a recovery below the 1.3500 mark. The Canadian Wholesale Trader Sales dropped to -0.1%, above estimates for a -0.4% plunge. In addition, oil prices continued to extend their gains of more than 1.90%, a headwind for the USD/CAD.
Further data showed that Canadian housing starts increased by 22% in April, with total units rising to 261,600 units, from a revised 213,800 in March, as the Canadian Mortgage and Housing Corporation revealed. USD/CAD traders brace for the release of the Consumer Price Index (CPI) on Tuesday, estimated at 0.4% MoM and 4.3% annually based.
On the US front, the docket revealed the New York Empire State Manufacturing Index disappointed investors, plummeting to -31.3 vs. the -3.9 estimated. The data showed that nearly 50% of respondents to the survey said business conditions worsened. The orders index slid, while a gauge of prices showed an increase, and the employment component shrank.
Even though the data was negative and painted a gloomy economic outlook, the labor market shows signs of easing, according to the NY Fed survey. Still, a gauge for price uptick suggests that further Fed action could be needed.
The US debt ceiling continues to grab the headlines. US President Joe Biden commented that talks were “moving along,” while Lael Brainard, the National Economic Director, commented that negotiations were serious and constructive.
In the central bank front, two Fed speakers pushed back against cutting rates in 2024 while emphasizing that inflation is high and that the fast-hiking campaign is still working its way through the economy. In the meantime, on the hawkish spectrum, Minnesota’s Fed President Neil Kashkari emphasized that inflation is much too high, though he commented that it’s slowing down. He added that the US central bank should not be fooled by a few months of data, adding that the Fed has more work to do.
USD/CAD Price Forecast: Technical outlook
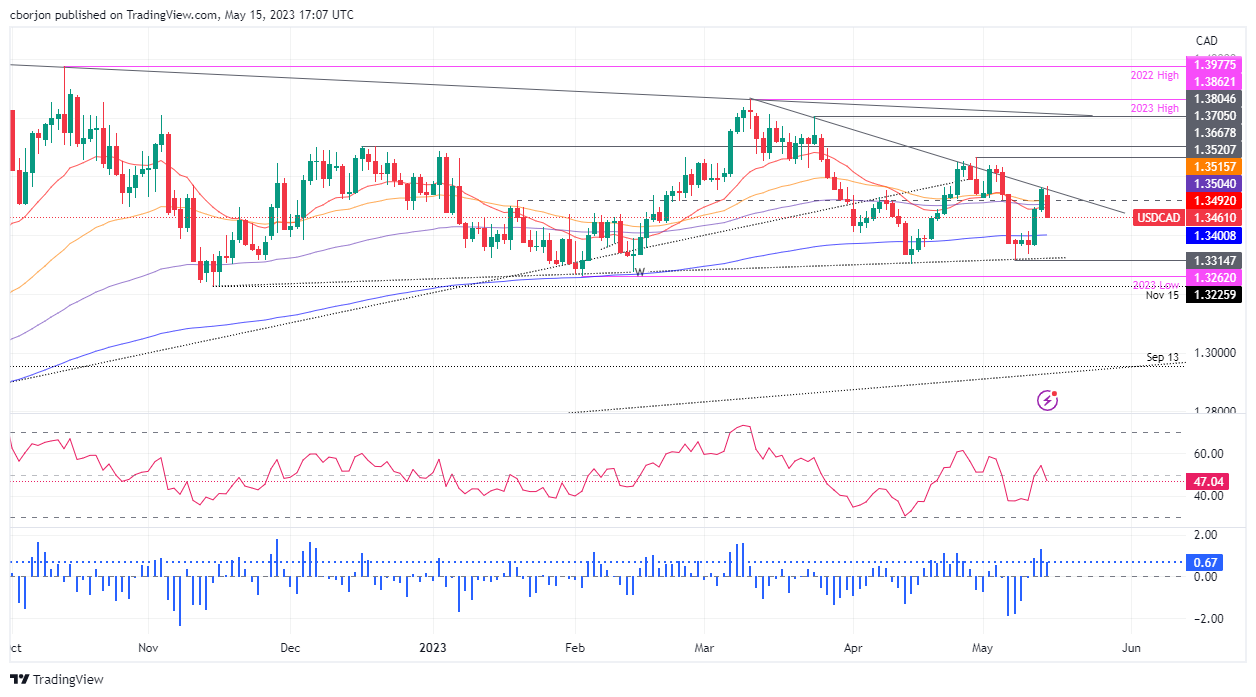
After piercing a downslope resistance trendline at around 1.3550-70, the USD/CAD has retraced and traded below the May 12 daily low of 1.3477, conquering on its way south, the 50, 100, and 20-day Exponential Moving Averages (EMAs). Despite that, the USD/CAD remains neutrally biased as the 200-day EMA continues to act as support at around 1.3400. if USD/CAD extends its losses past the latter, the May 8 daily low of 1.3314 will be exposed. A breach of the latter, the USD/CAD would continue to test the YTD lows of 1.3262.
- Disappointing New York Empire State Manufacturing Index plummets to -31.3, causing concern for the US economy.
- • US debt ceiling negotiations progress with “serious and constructive” talks according to Biden and Brainard.
- • BoE’s recent 25 bps rate hike aims to curb inflation; upcoming labor market data could hint at another hike in June.
GBP/USD bounces off last week’s low of 1.2443 and rises above the 1.2500 figure as a bullish-engulfing technical pattern emerges. Factors like a soft US Dollar (USD) and appetite for riskier assets seem to be behind GBP/USD’s recovery. At the time of writing, the GBP/USD is trading at 1.2515.
Soft USD and risk appetite fuel Sterling's recovery
The US economic agenda reported the New York Empire State Manufacturing Index, which disappointed investors, plunged -31.3 vs. the -3.9 estimated. The report revealed that nearly 50% of respondents to the survey said business conditions worsened. The data revealed the orders index slid, while a gauge of prices showed an increase, and the employment component shrank.
Although the report was negative for the US economy, a deceleration of hiring suggests the labor market is easing. But, a price jump would warrant further action by the US Federal Reserve (Fed), meaning higher rates. The GBP/USD stopped its rally on the release, probably based on the data and also on technical resistance surrounding the day’s high.
Aside from the data, the US debt ceiling continues to grab the headlines. US President Joe Biden commented that talks were “moving along,” while Lael Brainard, the National Economic Director, commented that negotiations were serious and constructive.
In the central bank front, two Fed speakers pushed back against cutting rates in 2024 while emphasizing that inflation is high and that the fast-hiking campaign is still working its way through the economy. In the meantime, on the hawkish spectrum, Minnesota’s Fed President Neil Kashkari emphasized that inflation is much too high, though he commented that it’s slowing down. He added that the US central bank should not be fooled by a few months of data, adding that the Fed has more work to do.
On the UK front, in the last week, the Bank of England raised rates by 25 bps, the 12th hike since the BoE’s commenced its tightening cycle, trying to curb inflation. Given the backdrop, Tuesday’s labor market data to be revealed would shed some light regarding wage pressures, which, if they come above estimates, could pave the way for another rate hike at the upcoming June meeting.
GBP/USD Price Analysis: Technical outlook
From a technical perspective, the GBP/USD is forming a bullish engulfing candle chart pattern but facing solid resistance at the 20-day Exponential Moving Average (EMA) at 1.2507. If GBP/USD struggles to crack the latter, the aforementioned two-candle pattern could be at risk of being invalidated, thus opening the door for losses below the psychological 1.2500 mark. If that scenario plays out, the GBP/USD next support would be May 15 at 1.2443, followed by the 50-day EMA at 1.2398.
Otherwise, if GBP/USD achieves a daily close above the 20-day EMA, the bullish engulfing candle pattern warrants further upside ahead of Tuesday’s jobs report in the United Kingdom. Key resistance levels are to be found at 1.2541, followed by May’s 5 support turned resistance at 1.2557, ahead of 1.2600.
In a report published on Monday, the Federal Reserve Bank of New York said that the total household debt rose by 0.9% in the first quarter to $17.05 trillion.
Key takeaways
"Q1 mortgage originations drop sharply to $324 billion, lowest since Q2 2014."
"Mortgage foreclosure levels were low in first quarter."
"Student loan debt at $1.604 trillion in first quarter amid low delinquency rate."
"Credit card balances flat in first quarter at $986 billion."
"Covid-era mortgage refinancing boom to provide significant support for consumers."
"End of low-rate period creates roadblock for selling homes."
"Credit card, auto loan delinquency rates rose in first."
Market reaction
The US Dollar Index showed no immediate reaction to this report and was last seen losing 0.2% on the day at 102.50.
Macroeconomic developments continue to present a bullish backdrop for the Gold market, strategists at ANZ Bank report.
Gold to ride on safe-haven demand
“US banking sector issues, elevated interest rates and uncertainty around the debt ceiling are dampening the economic outlook and boosting safe-haven demand for Gold.”
“We expect gold to reach $2,100 (previous forecast $2,050) by the end of this year, with price dips presenting buying opportunities.”
See – Gold Price Forecast: XAU/USD to suffer a phase of weakness during the summer months – Commerzbank
The Bank of Canada (BoC) Financial System Survey (FSS), conducted between February 21 and March 10, showed that confidence in the resilience of the Canadian financial system was at its highest since the first FSS in 2018.
The BoC clarified that “given this survey period, survey responses did not reflect concerns about turmoil in the banking sectors in the United States and Switzerland.”
Key takeaways from the report:
“Respondents believe the risk of a shock that could impair the Canadian financial system has decreased since the last survey. Their confidence in the resilience of the Canadian financial system is at its highest since the first FSS in 2018.”
“Cyber incidents remain the top risk that organizations face. Geopolitical risks are the second most important risk.”
“Respondents would meet increases in margin requirements smaller than those anticipated in stress tests primarily by pledging assets and cash on hand. If increases in margin requirements were larger than those produced from stress tests, respondents would rely more on other funding sources to raise cash in addition to pledging assets and cash on hand.”
US House Speaker Kevin McCarthy told reporters on Monday that Congressional and White House negotiators were still far apart in talks to raise the debt ceiling to avoid a default, as reported by Reuters.
Market reaction
Markets remain cautious following these comments. As of writing, the Dow Jones Industrial Average and the S&P 500 indexes were down between 0.15% and 0.1%.
In the meantime, the US Dollar stays on the back foot against its major rivals with the US Dollar Index losing 0.22% on the day, slightly below 102.50.
Statistics Canada will release April Consumer Price Index (CPI) data on Tuesday, May 16 at 12:30 and as we get closer to the release time, here are the forecasts by the economists and researchers of five major banks regarding the upcoming Canadian inflation data.
Headline CPI is seen declining to 4.1% year-on-year vs. the prior release of 4.3%, while core CPI is seen softening to 3.9%.
TDS
“We look for CPI to dip 0.1pp to 4.2% in April as prices rise by 0.5% MoM. Gasoline will provide a key driver for the latter, alongside a broad increase for core goods and steady pressure from services. Core inflation measures should also move 0.2pp lower to 4.3% on average, masking a modest pickup on a MoM (or 3m SAAR) basis which could raise some alarms at the BoC.”
RBC Economics
“Canada’s April inflation reading likely ticked lower again. We expect to a 4.1% YoY rate from 4.3% in March. A 6% increase in gasoline prices from March suggests energy prices fell slightly. But grocery price growth has been slowing and we expect broader gradual softening in underlying inflation pressures to have continued. The BoC is presently expected to sit on the sidelines for the remainder of 2023. Additional evidence of weaker price growth coupled with softening demand will affirm their present policy stance.”
NBF
“A rebound in gasoline prices could have been only partially offset by further moderation in the food segment and resulted in a 0.4% increase of the consumer price index in April (before seasonal adjustment). If we’re right, the 12-month rate of inflation should come down from 4.3% to a two-and-a-half-year low of 4.1%. The core measures preferred by the BoC should decrease as well; we see both the CPI-Trim (4.0% vs. 4.4%) and the CPI-Median (4.2% vs. 4.6%) declining four ticks on an annual basis.”
CIBC
“Core inflation (excluding food and energy) is expected to have advanced at a 0.2% seasonally adjusted pace, as some of the large increases in travel seen during the prior month reverse. While house prices have started to creep up again, the mortgage interest component of CPI is starting to show smaller monthly increases, meaning that the overall pace of shelter inflation is not expected to re-accelerate.”
Citi
“We expect a solid 0.5% MoM increase in headline CPI in April, with the YoY reading moderating to 4.1% from 4.3% in March. Headline CPI should fall further in the near term, likely close to 3% in the next couple of months, due largely to substantial base effects from now-lower energy prices. Details of CPI reports will be most important, particularly the monthly path of core CPI measures and strength of services prices. Core measures remain stable at around 3.5%, a slowing that has occurred alongside easing in shelter prices. However, continued strength in services prices and core inflation still around 3.5% in April may be enough cumulative evidence that underlying inflation is still too strong since the BoC signaled a pause in January. The BoC has consistently communicated that stably above-target inflation would require more hikes. Only a backdrop of much softer services prices and core inflation moderating faster than it has in recent months would suggest that the BoC is less likely to continue to raise rates further.”
Caution in US equity positioning is warranted, economists at UBS report.
Equity backdrop remains challenging
“We see the risk-reward tradeoff for US equities as unattractive.”
“In a soft landing scenario, we think the S&P 500 could rise to 4,400 by year-end (7% upside), but if the economy slips into a recession, we believe the market could fall to 3,300 (20% downside).”
“Given this asymmetric skew, we have a least preferred rating on equities relative to bonds, especially in an environment where high-quality fixed income offers competitive returns.”
- Gold price attracts fresh buying on Monday and snaps a three-day losing streak.
- A modest US Dollar weakness is seen as a key factor that benefits the XAU/USD.
- A combination of factors warrants caution before placing aggressive bullish bets.
Gold price regains some positive traction on the first day of a new week and sticks to its modest intraday gains through the early North American session. The XAU/USD currently trades around the $2,020 region, up nearly 0.30% for the day, and for now, seems to have snapped a three-day losing streak.
Modest US Dollar weakness underpins Gold price
The US Dollar (USD) pulls back from a five-week high touched this Monday as investors remained wary of the US debt ceiling standoff. This, in turn, is seen as a key factor lending support to the US Dollar-denominated Gold price. It is worth mentioning that US President Joe Biden said he expects to meet with congressional leaders on Tuesday for talks on a plan to raise the debt limit and avoid a catastrophic default. This, in turn, prompts the USD bulls to take some profits off the table following the strong move-up witnessed over the past two trading days.
Looming recession risks further benefit the XAU/USD
Apart from this, worries of a global economic slowdown further benefits the safe-haven Gold price and remain supportive of the move up. The fears were fueled by the preliminary reading from the University of Michigan released on Friday, which showed that consumer sentiment in the United States (US) slumped to a six-month low in May. Additional details of the Michigan survey revealed that consumer inflation over the next five years is expected to climb at an annual rate of 3.2% - the highest since 2011. This might force the Federal Reserve (Fed) to keep rates higher for longer.
Hawkish Federal Reserve expectations could cap gains
Fresh speculations that the US central bank will stick to its hawkish stance trigger a fresh leg up in the US Treasury bond yields, which should act as a tailwind for the USD and keep a lid on any further gains for the non-yielding Gold price. The aforementioned mixed fundamental backdrop, however, warrants some caution for aggressive bullish traders and before positioning for any further intraday appreciating move. Investors now look forward to speeches by influential Fed officials, which, along with the broader risk sentiment, should provide some impetus to the XAU/USD.
Gold price technical outlook
From a technical perspective, any subsequent move up is more likely to confront stiff resistance near the $2,035-$2,040 region. Some follow-through should allow Gold to climb back towards the all-time high, around the $2,078-$2,079 region touched earlier this month. The momentum could get extended further and allow bulls to conquer the $2,100 round-figure mark.
On the flip side, the $2,000 psychological mark now seems to have emerged as immediate strong support, which if broken might prompt some technical selling. The Gold price might then turn vulnerable to accelerate the fall towards the $1,980 zone en route to the $1,970 strong horizontal support. Some follow-through selling will negate any near-term positive outlook and shift the bias in favour of bearish traders.
Key levels to watch
Minneapolis Federal Reserve Bank President Neel Kashkari reiterated on Monday that inflation is "much too high" and that they have a long way to go before reaching the inflation goal per Reuters.
Kashkari further noted that the labor market is not as frothy as nine months ago but said that it is still strong overall. "We should not be fooled by a few months of good data," Kashkari added.
Market reaction
The US Dollar stays on the back foot following these comments. As of writing, the US Dollar Index was down 0.25% on a daily basis at 102.45.
- WTI bounces of multi-day lows near $69.50.
- Tight supply concerns bolster the daily gains so far.
- The API and the EIA will report on oil inventories later in the week.
Prices of the WTI starts the week in a positive fashion and looks to surpass the key $70.00 mark per barrel on a sustainable mood.
WTI looks at China, US SPR
After three consecutive daily pullbacks, prices of the barrel of the WTI gather some steam and hover around the key $70.00 region on the back of traders’ concerns over the current tight supply conditions, while ongoing output cuts by the OPEC+ also add to the upbeat mood in the commodity.
Bolstering prices also emerges US plans to start refilling the SPR and the renewed selling bias in the greenback, which somehow offset concerns over uncertainty around the Chinese recovery.
Later in the week, the API and the EIA will report on weekly US crude oil inventories on Tuesday and Wednesday, respectively.
WTI significant levels
At the moment the barrel of WTI is up 0.86% at $70.63 and faces the next resistance at $73.83 (weekly high May 10) seconded by $76.92 (high April 28) and finally $79.14 (weekly high April 24). On the other hand, the breach of $63.97 (monthly low May 3) would open the door to $64.41 (2023 low March 20) and then $61.76 (monthly low August 23 2021).
FX is looking at the debt-ceiling concerns. Negotiations restart on Tuesday, but the US Dollar is set to enjoy further gains in the near term, economists at ING report.
Debt ceiling jitters raise upside potential in near term
“What is really keeping the Dollar afloat at this stage is the debt-ceiling impasse in Washington, in our view. Negotiations between President Biden and congressional leaders should resume on Tuesday, but unless we see truly encouraging progress, investors’ fears may keep growing.”
“Barring positive news on this end, we think the balance of risks remains tilted to the upside for the Dollar for now, which should see safe-haven flows as risk sentiment stays subdued.”
“The rebound in DXY could extend to the 103.50/104.00 area in the coming days.”
Citing Eurosystem sources, MNI reported on Monday that the European Central Bank (ECB) was most likely to raise key rates once or twice more in this tightening cycle.
According to MNI, the majority of the ECB Governing Council still sees it unlikely for the policy rate to reach 4%.
Market reaction
Thie headline doesn't seem to be having a noticeable impact on the Euro's performance against its major rivals. As of writing, the EUR/USD pair was trading at 1.0880, where it was up 0.3% on a daily basis.
Things look to be shaping up for a tumultuous month ahead for the Turkish Lira, economists at Commerzbank report.
Lira in jeopardy as opposition dreams fade
“Erdoğan performed much better in the elections than polls had suggested. He did not receive 50% of the votes which is why there will be a second round on 28th May. He was nonetheless well ahead in the elections compared with his main opponent Kemal Kılıçdaroğlu.”
“Now that the prospect of a possible change in politics is no longer realistic, the depreciation pressure is likely to increase considerably. Whether it will be possible to prevent a significant slide in the Lira? One cannot be certain. That it will happen afterwards is getting increasingly likely. Even more significant control of capital movement would be the alternative. That alternative scenario possible, but would cause even more significant damage.”
“The prospects for the Lira are not rosy under either scenario: under one there will be significant depreciation, under the other no TRY exchange rates at all (at least not in the actual sense of the word).”
- USD/JPY scales higher for the third successive day and climbs to over a one-week high on Monday.
- A modest USD downtick exerts some pressure on the pair, though the downside seems cushioned.
- The divergent Fed-BoJ policy outlook, a positive risk tone underpin the JPY and lend some support.
The USD/JPY pair surrenders a major part of its intraday gains to over a one-week high, around the 136.30-136.35 area touched this Monday and retreats to the 136.00 mark during the early North American session.
The US Dollar (USD) pulls back from its highest level since April and turns out to be a key factor acting as a headwind for the USD/JPY pair. That said, fresh speculations that the Federal Reserve (Fed) will stick to its hawkish stance in the wake of a rise in consumer inflation expectations should help limit the downside for the USD. This, in turn, warrants caution for bears and before positioning for any further downfall for the major.
The preliminary May reading from the University of Michigan released on Friday showed that consumers see prices over the next five years climbing at an annual rate of 3.2% - the highest since 2011. This, in turn, fuels speculations that the Federal Reserve (Fed) will keep interest rates higher for longer, which remains supportive of a further rise in the US Treasury bond yields and should act as a tailwind for the Greenback.
Apart from this, the Bank of Japan's (BoJ) dovish outlook, along with a generally positive risk tone around the equity markets, could undermine the safe-haven Japanese Yen (JPY) and contribute to limiting the downside for the USD/JPY pair. It is worth recalling that BoJ Governor Kazuo Ueda, speaking in parliament last week, said last week that it was too early to discuss specific plans for an exit from the massive stimulus program.
On the economic data front, the Empire State Manufacturing Index plunged to -31.8 in May from 10.8 in the previous month, albeit does little to influence the USD price dynamics or provide any meaningful impetus to the major. Nevertheless, the aforementioned fundamental backdrop suggests that the path of least resistance for the USD/JPY pair is to the upside and the intraday pullback might still be seen as a buying opportunity.
Technical levels to watch
Economists at Rabobank expect the CHF to strengthen vs. the EUR in the second half of the year.
More tightening?
“In the next few weeks, the market will be assessing the risk of another 50 bps move from the SNB next month. Another scenario is that the SNB could opt for a 25 bps move but will leave the door open for another tightening later in the year.”
“A hawkish SNB combined with a stagnationary outlook for the Eurozone in H2 has the potential to drive EUR/CHF lower in the coming months.”
“We have lowered our EUR/CHF forecasts moderately and are now targeting 0.97 on a 1-to-3-month view, and 0.96 at year-end.”
- EUR/USD picks up some traction and revisits 1.0890.
- The multi-week lows near 1.0850 hold the downside so far.
Following a test of the mid-1.0800s – an area coincident with the 55-day SMA – EUR/USD manages to pick up pace and revisit 1.0890.
Immediately to the upside now comes the psychological 1.1000 hurdle. A sustainable breakout of this hurdle exposes a probable test of the 2023 peak at 1.1095 (April 26) just before the round level at 1.1100.
Looking at the longer run, the constructive view remains unchanged while above the 200-day SMA, today at 1.0454.
EUR/USD daily chart
In an interview with CNBC on Monday, Chicago Federal Reserve Bank President Austan Goolsbee said that they need to monitor more than normal data sets and be attuned to credit conditions when deciding on policy, per Reuters.
Key takeaways
"A lot of impact of rate hikes is still in the pipeline."
"It does not feel like a 2008-type of crisis, but it feels like stress in some parts of the financial sector."
"Effect of banking stress is not small, we need to take it into account, sit and watch it."
"We should be extra mindful, want to get inflation back to target path without starting a recession."
"We are trying to figure out where we are in the business cycle, when this cycle looks like no other."
"May rate hike for me was a close call."
Market reaction
The US Dollar Index stays under modest bearish pressure in the early American session and was last seen losing 0.25% on the day at 102.45.
Extra gains to the 14,930 level appear on the cards for USD/IDR in the near term, comments Markets Strategist Quek Ser Leang at UOB Group.
Key Quotes
“After USD/IDR dropped to a low of 14,560 and rebounded, we highlighted last Monday (01 May, spot at 14,695) that ‘the weakness in USD/IDR appears to have stabilized’ and we expected it to ‘consolidate in a range between 14,550 and 14,740’. However, USD/IDR did not exactly consolidate as it rebounded from 14,650 to 14,765.”
“USD/IDR continue to rise today and the improving upward momentum suggests it could advance to 14,930. A break of this level is not ruled out but it is premature to expect USD/IDR to breach the next major resistance at 14,980. This week, any pullback is unlikely to challenge 14,650 (minor support is at 14,710).”
- NZD/USD regains positive traction on Monday, albeit the uptick lacks bullish conviction.
- A positive risk tone undermines the safe-haven USD and benefits the risk-sensitive Kiwi.
- Rising US bond yields underpin the USD amid hawkish Fed expectations and cap gains.
The NZD/USD pair attracts some buyers on the first day of a new week and for now, seems to have stalled last week's sharp retracement slide from the 0.6385 region, or a nearly three-month high. The pair maintains its bid tone heading into the North American session and is currently placed near the top end of its daily range, comfortably above the 0.6200 mark.
A modest recovery in the global risk sentiment - as depicted by a generally positive tone around the equity markets - prompts some selling around the safe-haven US Dollar (USD) and benefits the risk-sensitive Kiwi. That said, the modest USD pullback from its highest level since April is more likely to remain cushioned in the wake of a rise in the long-term US consumer inflation expectations.
In fact, the preliminary May reading from the University of Michigan released on Friday showed that consumers see prices over the next five years climbing at an annual rate of 3.2% - the highest since 2011. This could force the Federal Reserve (Fed) to keep interest rates higher for longer, which remains supportive of a modest rise in the US Treasury bond yields and should lend support to the USD.
Additional details of the Michigan survey revealed that consumer sentiment slumped to a six-month low in May in the wake of a standoff to raise the federal government's borrowing. This further fuels worries about an imminent recession, which should further contribute to limiting losses for the safe-haven Greenback and keeping a lid on any meaningful upside for the NZD/USD pair, at least for now.
Market participants now look to the release of the Empire State Manufacturing Index, which, along with speeches by influential FOMC members and the US bond yields, will drive the USD demand. Apart from this, traders will take cues from the broader risk sentiment to grab short-term opportunities around the NZD/USD pair. Nevertheless, spot prices, for now, seem to have snapped a two-day losing streak.
Technical levels to watch
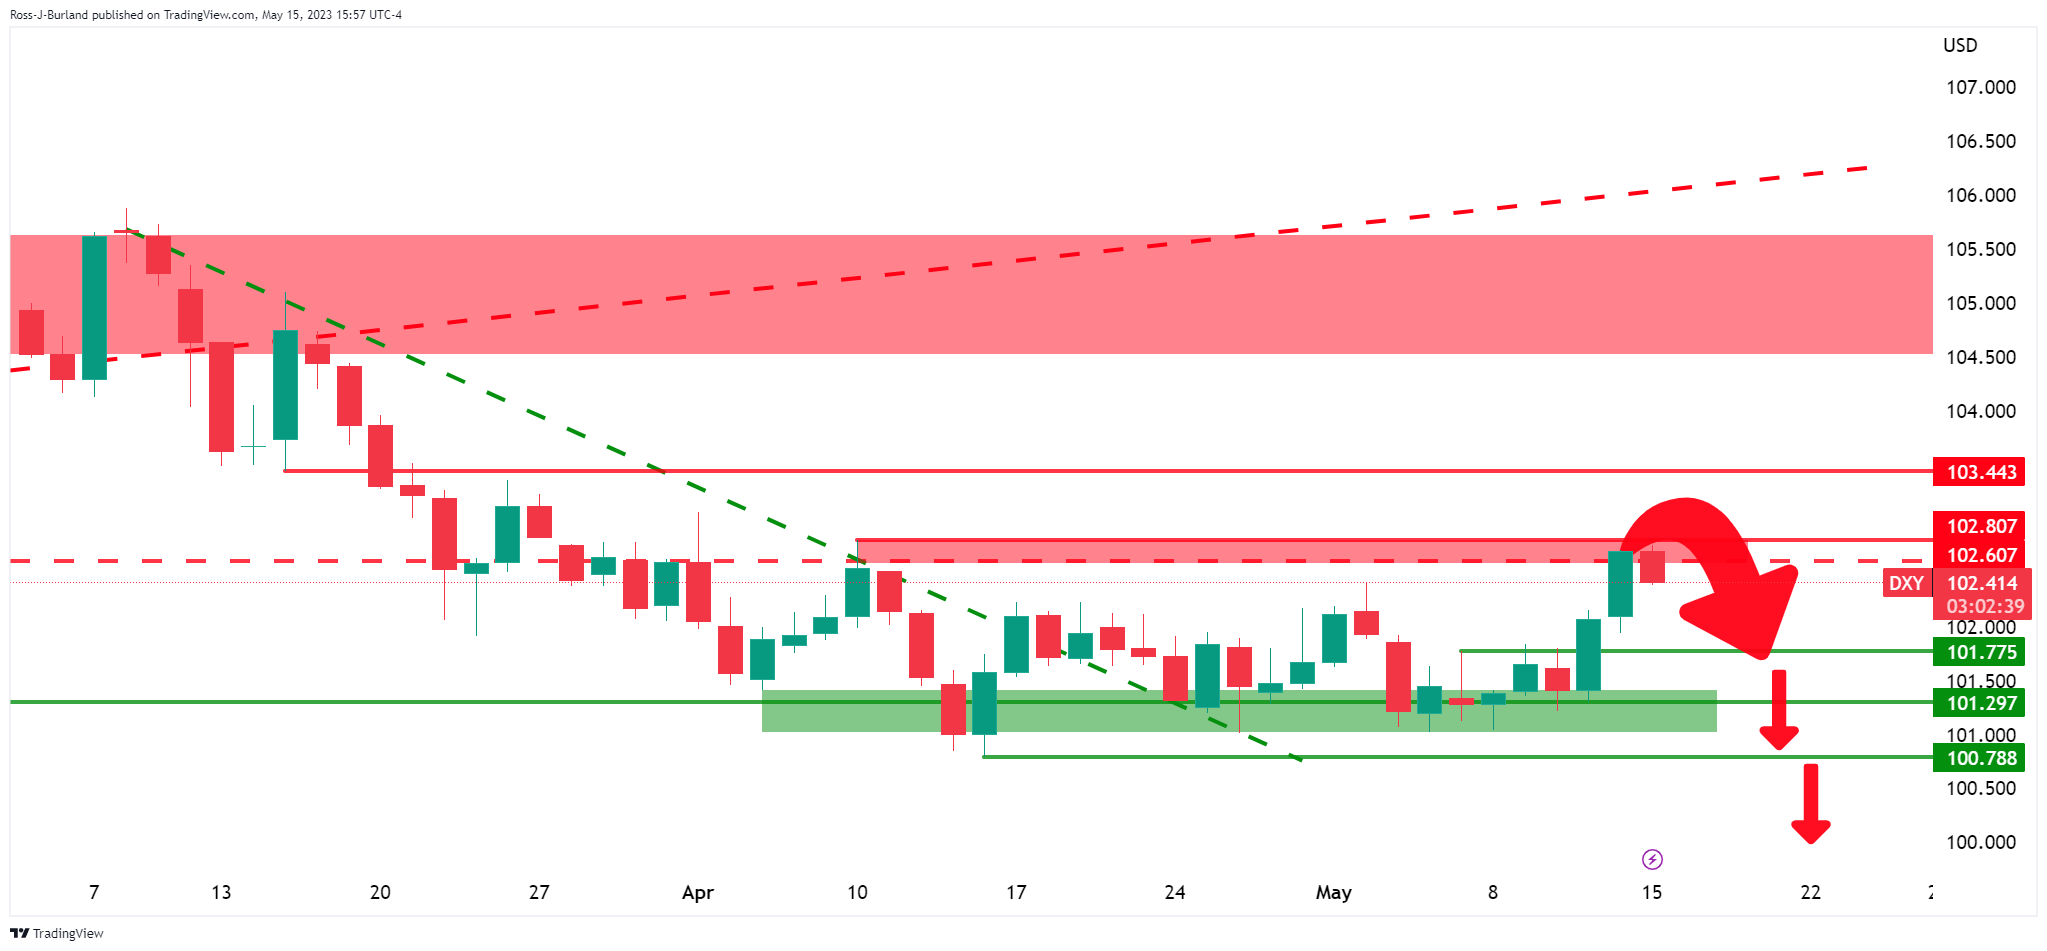
- DXY faces some selling pressure after hitting fresh monthly peaks.
- Above 102.80 comes the April high at 103.50 (April 3).
DXY clinches fresh monthly tops near 102.80 but fades the move soon afterwards on Monday.
The continuation of the bullish move should clear the weekly high at 102.80 (April 10) to open the door to a probable visit to the April high at 103.05 (April 3).
On the downside, there is a formidable contention around the 101.00 neighbourhood for the time being.
Looking at the broader picture, while below the 200-day SMA, today at 105.83, the outlook for the index is expected to remain negative.
DXY daily chart
Rates and yields are in the driving seat – and that is a problem, in the view of Kit Juckes, Chief Global FX Strategist at Société Générale.
Too many Euro longs
“The relationship between relative rates and the Dollar has been repaired in recent years after a complete falling-out at the end of 2016, and if the data continue to push back against expectations of Fed easing this year, the Dollar’s going to continue to find support (even if I think it's fundamentally expensive here).”
“CFTC positioning data don’t tell a new story this week, either. As of last Tuesday, the market remained significantly short of the Dollar, and particularly long EUR/USD.”
The bullish view in USD/MYR remains unchanged for the time being, according to Markets Strategist Quek Ser Leang at UOB Group.
Key Quotes
“Our view for USD/MYR to ‘trade with a downward bias towards 4.4200’ last week was incorrect. From a low of 4.4300, USD/MYR turned around and surged to a high of 4.4780 last Friday. Upward momentum is strong and USD/MYR extended its rally today.”
“Further USD/MYR strength is likely this week, but it might not be able to break above the March high of 4.5290. Support is at 4.4700, followed by 4.4500.”
- EUR/JPY adds to Friday’s recovery and regains 148.00.
- The weekly low near 149.30 emerges as the next hurdle.
EUR/JPY gathers extra pace and reclaims the area just above 148.00 the figure at the beginning of the week.
It seems the cross regains part of the bullish perspective and could now challenge the weekly peak at 149.26 (May 8). The surpass of this level could pave the way for a potential test of the YTD high at 151.61 (May 2).
So far, further upside looks favoured while the cross trades above the 200-day SMA, today at 143.06.
EUR/JPY daily chart
In the view of economists at Crédit Agricole EUR/USD is overbought and vulnerable.
Downside risks for EUR/USD
“The Euro appears overbought, which could leave it susceptible to any downside surprises from upcoming German ZEW and Eurozone consumer confidence data, as well as updated economic forecasts from the European Commission. Additionally, any confirmations from ECB speakers that most of the tightening is already behind us and terminal rates are in sight, might fail to significantly boost the EUR rate advantage.”
“The recent decline in positive Eurozone economic surprises compared to those in the US indicates potential near-term downside risks for EUR/USD. In addition, FX investors have seemingly already built considerable EUR/USD long positions in recent months, potentially limiting further gains.”
Atlanta Fed President Raphael Bostic told CNBC on Monday that there is still a long distance to go on inflation and added that they may have to "go up on rates," as reported by Reuters.
Bostic further noted that he will not be looking at cutting rates until well into 2024 in his baseline scenario.
Additional takeaways
"If there is a bias to action, there is a bit of a bias to go a bit higher, though we are where my dot has been.",
"There has been progress on inflation."
"We have done the easiest part of inflation reduction."
"I think in the next several months the math is going to work in our favor."
"I also think the economy is going to work in our favor on inflation."
"Businesses and households still tell me they expect high inflation to be a short-run episode."
"Appropriate policy is to wait and see the effects of tightening to now."
Market reaction
These comments don't seem to be having a significant impact on the US Dollar's valuation. As of writing, the US Dollar Index was down 0.2% on the day at 102.50.
Markets Strategist Quek Ser Leang at UOB Group sees the likelihood of extra gains in USD/THB in the short-term horizon.
Key Quotes
“We highlighted last Monday (08 May, spot at 33.95) that USD/THB ‘could consolidate first before dropping to 33.54’. We added, ‘in order to keep the current momentum going, USD/THB must stay below 34.23’. While USD/THB fell as expected, it rebounded from a low of 33.50.”
“Downward momentum has faded and this combined with oversold conditions suggests USD/THB could rebound further. However, any advance is unlikely to break the major resistance at 34.20 this week. On the downside, support is at 33.65, followed by 33.50. The latter level is a rather strong support now.”
Economists at MUFG Bank look into potential implications for the USD from the debt ceiling stand-off.
Time to pare back some short USD exposure
“The fast approaching US debt ceiling stand-off has the potential to create choppy price action as well in the coming weeks/month that could temporarily disrupt our outlook for further USD weakness.”
“The more last minute the deal, the more disruptive it could be for financial markets.”
“Once the dust has settled over the US debt ceiling, we expect the USD to resume its decline but are anticipating more volatile FX markets as the ‘x-date’ approaches.”
Sterling will likely be ultra-sensitive to the wage data release, economists at ING report.
EUR/GBP to rebound to above 0.8800 by the end of this month
“The Bank of England made quite clear that its next policy move in June will largely depend on two releases: wages and inflation data.”
“We expect some moderation in the wage growth figure after last month's jump, which may ultimately push the MPC in the direction of a hold at the June meeting.”
“Markets are pricing in 20 bps of tightening, and the downside risks are quite material for Sterling. We expect this to be mirrored in a higher EUR/GBP, which we expect to rebound to above 0.8800 by the end of this month.”
The Euro retreated to the bottom spot in the G10 table after the marked selling on Friday. Economists at Société Générale expect EUR/USD to plummet toward 1.05 on a break under 1.0800/1.0730.
Profit-taking looks tactical
“The realignment of EUR/USD with bond spreads has run its course and hedge funds maintain their long position last week at 22.5% of OI, so the profit-taking looks tactical and does not suggest a more fundamental shift is afoot.”
“We can’t ignore the jeopardy of a deeper pullback of course, especially if US retail sales come in strong tomorrow.”
“Confluence of 100-DMA and the trendline going back to September 2022 near 1.0800/1.0730 is crucial support zone. A break would hasten a retracement towards 1.05.”
- GBP/USD regains positive traction on Monday amid a modest USD downtick.
- A positive risk tone prompts some selling around the safe-haven Greenback.
- The fundamental/technical setup warrants some caution for bullish traders.
The GBP/USD pair stages a goodish intraday bounce from a two-week low touched earlier this Monday and recovers a part of its heavy losses recorded over the past two sessions. Spot prices climb back closer to the 1.2500 psychological mark during the first half of the European session and, for now, seem to have stalled the retracement slide from over a one-year high, around the 1.2680 region set last week.
A generally positive tone around the equity markets undermines the safe-haven US Dollar (USD), which, in turn, is seen as a key factor pushing the GBP/USD pair higher. Meanwhile, the USD pullback from its highest level since early February seems limited amid a further rise in the US Treasury bond yields, bolstered by fresh speculations that the Federal Reserve (Fed) will stick to its hawkish stance. In fact, preliminary May reading from the University of Michigan released on Friday showed that consumers see prices over the next five years climbing at an annual rate of 3.2% - the highest since 2011. This could force the Federal Reserve (Fed) to keep interest rates higher for longer.
Additional details of the Michigan survey revealed that consumer sentiment slumped to a six-month low in May in the wake of a standoff to raise the federal government's borrowing. This further fuels worries about an imminent recession and should lend some support to the safe-haven Greenback. Apart from this, the Bank of England (BoE) Governor Andrew Bailey's less hawkish comments last Thursday, saying that there are good reasons to think that CPI will fall sharply, might continue to undermine the British Pound. The aforementioned factors might hold back bullish traders from placing aggressive bets around the GBP/USD pair and cap the upside for the GBP/USD pair.
Even from a technical perspective, Friday's breakdown through support marked by the lower end of over a one-month-old ascending channel suggests that the path of least resistance for spot prices is to the downside. Hence, any subsequent move up is more likely to attract fresh sellers at higher levels and runs the risk of fizzling out rather quickly. In the absence of any relevant market-moving macro data from the US, traders look to the US economic docket, featuring the Empire State Manufacturing Index. This, along with a scheduled speech by Minneapolis Fed President Neel Kashkari and the broader risk sentiment, will influence the USD and provide some impetus to the GGBP/USD pair.
Technical levels to watch
President Erdogan is on course for a narrow victory in the Presidential election. Economists at MUFG Bank expect the Turkish Lira to weaken.
Turkey elections results favour status quo outcome
“The election results favour a continuation of status quo in Turkey, and is unlikely to trigger the return of foreign investors back to Turkey.”
“We would expect policymakers in Turkey to maintain a relatively stable TRY in the near-term ahead of the likely second-round election. After the elections are over and the dust has settled, a continuation of unconventional policy settings, an elevated current account deficit, elevated inflation and dwindling FX reserves all point towards a weaker Lira.”
“Over the last five calendar years, the TRY has depreciated against the USD on average by -26%. So far this year the pace has slowed down ahead of the elections with the Lira falling more modestly by only -5% year to date. It leaves room for catch up weakness ahead. We see no reason to believe that the accelerating weakening trend in recent years will change if unconventional policies remain in place.”
Extra gains could encourage USD/CNH to challenge the 6.9750 level in the short term, comment Economist Lee Sue Ann and Markets Strategist Quek Ser Leang at UOB Group.
Key Quotes
24-hour view: “Last Friday, we expected USD to strengthen further but we were of the view that ‘the major resistance at 6.9750 is likely out of reach today’. Our view turned out to be correct as USD rose to a high of 6.9735. Conditions are overbought and upward momentum is showing signs of slowing, albeit tentatively. Today, we do not expect USD to advance much further; it is more likely to trade in a range of 6.9570/6.9750.”
Next 1-3 weeks: “Last Friday, we expected USD to strengthen further but we were of the view that ‘the major resistance at 6.9750 is likely out of reach today’. Our view turned out to be correct as USD rose to a high of 6.9735. Conditions are overbought and upward momentum is showing signs of slowing, albeit tentatively. Today, we do not expect USD to advance much further; it is more likely to trade in a range of 6.9570/6.9750.”
Economists at Commerzbank expect the Reserve Bank of India to stand pat for now amid a stable USD/INR.
Lower inflation provides leeway for RBI
“April headline inflation moderated further to the lowest level in 18 months. More importantly, core inflation, which strips out food and energy, also softened to 5.3% from just under 6% previously. This provides RBI leeway on monetary policy. It will reinforce RBI’s bias to leave policy unchanged for now. Further moderation in inflation will also give it scope to consider looser monetary policy conditions if needed.”
“We expect RBI to stay on hold for the foreseeable future.”
“On FX, RBI is content to see a relatively stable USD/INR. It has held mostly within the 81-83 range this year.”
- USD/CAD retreats from over a one-week high and is weighed down by a combination of factors.
- A modest rebound in Oil prices underpins the Loonie and exerts some pressure amid a softer USD.
- The fundamental backdrop, however, supports prospects for the emergence of some dip-buying.
The USD/CAD pair attracts some sellers near the 1.3565-1.3570 region, or over a one-week high touched earlier this Monday and extends its intraday descent through the first half of the European session. The pair is currently placed near the lower end of its daily trading range, just above the 1.3500 psychological mark, flirting with the 100-day Simple Moving Average (SMA) and is pressured by a combination of factors.
The US Dollar (USD) takes a brief pause following the recent move up to its highest level since April and consolidates its strong gains recorded over the past two sessions, which, in turn, acts as a headwind for the USD/CAD pair. Apart from this, a modest bounce in Crude Oil prices from over a one-week low set earlier this Monday underpins the commodity-linked Loonie. This is seen as another factor exerting some downward pressure on the major, though any meaningful fall seems elusive.
In the absence of any relevant fundamental trigger, a positive risk tone around the equity markets is seen weighing on the safe-haven Greenback. That said, a further rise in the US Treasury bond yields, bolstered by speculations that the Federal Reserve (Fed) might stick to its hawkish stance, should act as a tailwind for the USD. The preliminary May reading from the University of Michigan released on Friday showed that consumers see prices over the next five years climbing at an annual rate of 3.2%.
This marks the highest level since 2011 and could force the Fed to keep interest rates higher for longer. Additional details of the Michigan survey revealed that consumer sentiment slumped to a six-month low in May in the wake of a standoff to raise the federal government's borrowing. The data adds to worries about an imminent recession, which further supports prospects for the emergence of some dip-buying around the Greenback and contributes to limiting the downside for the USD/CAD pair.
Furthermore, worries that a deeper global economic downturn will dent the fuel demand should keep a lid on any meaningful recovery for Oil prices. This, in turn, suggests that the path of least resistance for the USD/CAD pair is to the upside and any subsequent downfall is more likely to be bought into. Traders now look to the US economic docket, featuring the Empire State Manufacturing Index. This, along with a scheduled speech by Minneapolis Fed President Neel Kashkari and the broader risk sentiment, will drive the USD demand and provide some impetus to the major.
Technical levels to watch
Economists at ING discuss EUR/USD outlook for the week ahead.
Looking across the Atlantic
“In EUR/USD, the Dollar leg will probably keep driving the majority of the moves.”
“Downside risks persist for the pair on the back of the US debt ceiling impasse, and we could see a break below 1.0800 (a key level, also the 100-Day Moving Average) followed by another leg lower to the 1.0700/1.0750 area should the risk environment deteriorate much further.”
“Still, we don’t expect EUR/USD weakness to last beyond the near term.”
In light of advanced prints from CME Group for natural gas futures markets, open interest extended the uptrend and rose by around 11.2K contracts on Friday. Volume, in the meantime, increased by around 170.4K contracts, resuming the uptrend following the previous daily pullback.
Natural Gas: Immediate up-barrier comes at $2.50
Prices of the natural gas reversed part of the previous weakness on Friday. The recovery came amidst increasing open interest and volume and suggests that further rebound could be in store for the commodity in the very near term. Against that, the next resistance level of note comes at the April top at $2.529 per MMBtu.
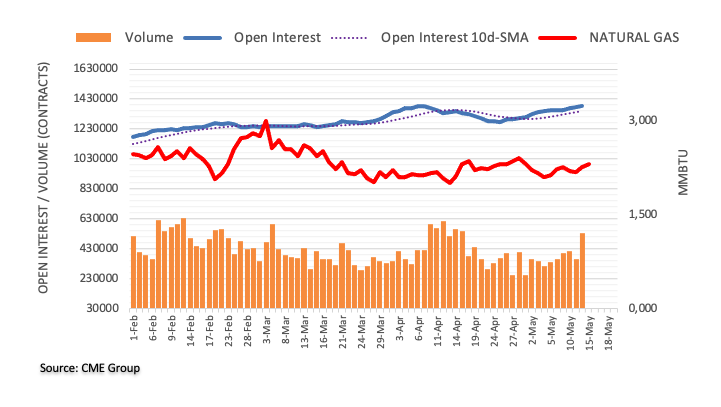
Further upside could motivate USD/JPY to challenge the firm resistance at 136.80 in the near term, according to Economist Lee Sue Ann and Markets Strategist Quek Ser Leang at UOB Group.
Key Quotes
24-hour view: “We did not anticipate the strong surge in USD as it rallied to a high of 135.76 in late NY and then extended its advance in early Asian trade. Not surprisingly, conditions are severely overbought but with no signs of weakness just yet, USD could edge higher today. In view of the overbought conditions, the major resistance at 136.80 is likely out of reach today (there is another resistance at 136.30). Support is at 135.50, a break of 135.20 would indicate that the USD strength has eased.”
Next 1-3 weeks: “Our latest narrative was from last Thursday (11 May, spot at 134.20) wherein ‘while downward momentum is building again, the likelihood of USD dropping to 133.00 has not increased much’. We did not expect the strong surge of 0.87% (NY close of 135.71) on Friday. The breach of our ‘strong resistance’ of 135.50 indicates that the downside risk has faded. While the risk has shifted to the upside, it is worth noting that there is a solid resistance near 136.80 ahead of the early May high near 137.80. Overall, only a breach of 134.80 (‘strong support’ level) would suggest USD is not ready to head higher towards 136.80.”
Debt ceiling debate approaches 11th hour. Economists at ANZ Bank discuss the possible deal.
Financial market volatility and disrupting growth
“We anticipate that a deal will be reached to suspend the debt limit for a few months to provide more time to negotiate a mutually satisfactory outcome. Negotiations over that period are likely to be fractious, causing financial market volatility and disrupting growth.”
“The Democrats and Biden will most likely need to reach a compromise agreement with the Republicans that incorporates long-term budget savings in return for a reasonable increase in the debt limit or a lengthier suspension period.”
The People’s Bank of China (PBOC) issued the first quarter monetary policy implementation report on Monday. Following are the highlights of the report.
Prudent monetary policy will be precise and forceful.
Will keep liquidity reasonably ample.
Will prevent transmission of risks from abroad to China.
Will keep interest rates reasonable and appropriate.
Will keep Yuan exchange rate basically stable.
Will support rigid, improved housing demand.
Will continue stabilise land price, home price, expectations.
Will fend off systemic financial risks.
Will let policy financing tools play their roles, step up the guidance of govt investment and policy incentives, drive up private investment effectively.
China's economic growth will likely see marked growth in Q2 due to low base effect.
Will monitor marginal changes of goods prices, guide and stabilize social expectations and keep prices basically stable.
Related reads
- AUD/USD clings to gains near daily peak, just below 0.6700 amid modest USD downtick
- PBOC keeps one-year MLF rate unchanged at 2.75%
CME Group’s flash data for crude oil futures markets noted traders reduced their open interest positions for the third session in a row on Friday, this time by around 9.5K contracts. In the same line, volume went up for the second straight session, now by around 223.6K contracts.
WTI: Next on the upside comes $74.00
Prices of the barrel of the WTI dropped for the third session in a row at the end of last week. The downtick, however, was on the back of declining open interest and volume and is suggestive that further retracements appear out of table in the very near term. Occasional bullish attempts should face initial hurdle at the weekly high of $73.83 (May 10).
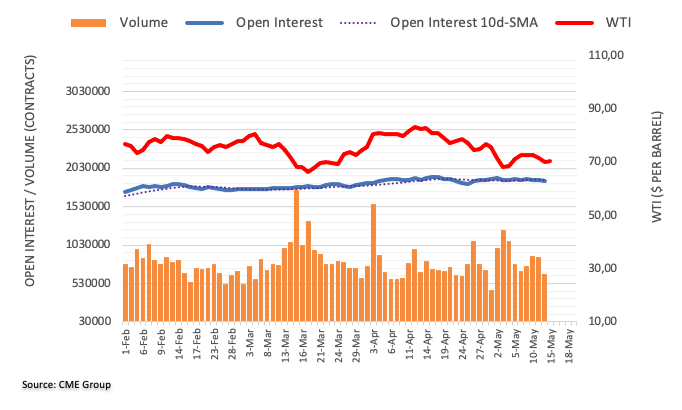
Eurozone Industrial Production snaps its run increases in March, the official data showed on Monday, suggesting that the manufacturing sector recovery has faltered yet again.
Eurozone’s Industrial Output declined 4.1% MoM, the Eurostats said in its latest publication, vs. -2.5% expected and +1.5% previous reading.
On an annualized basis, the bloc’s Industrial Production arrived at -1.4% in March versus a 2.0% figure registered in March and against the expected growth of 0.9%.
FX implications
The shared currency has lost its upside traction on the downbeat German industrial figures. At the time of writing, EUR/USD is trading at around 1.0865, adding 0.16% on the day.
FX option expiries for May 15 NY cut at 10:00 Eastern Time, via DTCC, can be found below.
- EUR/USD: EUR amounts
- 1.0890-05 760m
- 1.1000-10 1.1b
- 1.1200 1.3b
- GBP/USD: GBP amounts
- 1.2400 632m
- AUD/USD: AUD amounts
- 0.6438-50 1.2b
- USD/CAD: USD amounts
- 1.3500 950m
- USD/CNY: USD amounts
- 6.9500 1.6b
Economist Lee Sue Ann and Markets Strategist Quek Ser Leang at UOB Group suggest AUD/USD could revisit the 0.6575 level while below 0.6630.
Key Quotes
24-hour view: “Last Friday, we highlighted that ‘barring a break above 0.6745, AUD could drop further to 0.6670 before stabilization is likely’. We added, ‘the major support at 0.6630 is not expected to come under threat’. AUD fell more than expected as it came close to breaking 0.6630 (low has been 0.6637). Today, AUD could break dip 0.6630 but in view of the severely oversold conditions, it is not expected to challenge the major support at 0.6575. On the upside, a breach of 0.6695 (minor resistance is at 0.6675) indicates AUD is not weakening further.”
Next 1-3 weeks: “We indicated last Friday (15 May, spot at 0.6705) that the recent AUD strength had ended. We highlighted that ‘for the time being, the bias is tilted to the downside but we view any AUD weakness as part of a 0.6630/0.6780 range’ and ‘a sustained drop below 0.6630 is unlikely for now’. We did not quite expect the sharp drop in AUD as it fell close to 0.6630 (low of 0.6637). From here, AUD has to break and stay below 0.6630 before a sustained decline to 0.6575 is likely. The odds of AUD breaking clearly below 0.6630 will remain intact as long as it stays below 0.6725 (the level of ‘strong resistance’ now).”
- AUD/USD gains strong positive traction on Monday and snaps a two-day losing streak.
- A positive risk tone prompts some USD selling and provides a goodish lift to the major.
- The mixed fundamental backdrop warrants some caution for aggressive bullish traders.
The AUD/USD pair regains positive traction on the first day of a new week and recovers a major part of Friday's losses to a one-and-half-week low. Spot prices stick to strong intraday gains just below the 0.6700 mark through the first half of the European session and for now, seem to have stalled last week's retracement slide from the highest level since February 24.
The US Dollar (USD) struggles to capitalize on its strong gains recorded over the past two days and eases from its highest level since early April touched this Monday, which, in turn, prompts some short-covering around the AUD/USD pair. A generally positive tone around the equity markets is seen undermining the safe-haven Greenback and benefitting the risk-sensitive Aussie. That said, any meaningful downside for the USD seems elusive amid reviving bets that the Federal Reserve (Fed) might stick to its hawkish stance in the wake of a rise in the US long-term inflation expectations.
In fact, the preliminary May reading from the University of Michigan released on Friday showed that consumers see prices over the next five years climbing at an annual rate of 3.2% - the highest since 2011. This could force the Federal Reserve (Fed) to keep interest rates higher for longer, which continues to act as a tailwind for the US Treasury bond yields and supports prospects for the emergence of some USD dip-buying. This, along with worries about an imminent recession, could keep a lid on any optimism in the markets and contribute to capping the upside for the AUD/USD pair.
That said, the RBA's hawkish outlook, indicating that some further tightening of monetary policy may be required to ensure that inflation returns to target in a reasonable timeframe, warrants caution for bearish traders. Moving ahead, the US economic docket, featuring the release of the Empire State Manufacturing Index, along with a scheduled speech by Minneapolis Fed President Neel Kashkari, might influence the USD price dynamics. Apart from this, the broader market risk sentiment might further contribute to producing short-term trading opportunities around the AUD/USD pair.
Technical levels to watch
"The underlying economic momentum has recently weakened noticeably," Germany’s Economy Ministry said in its monthly report published on Monday.
Additional takeaways
“Mood indicators point to economic recovery in the further course of the year.”
“Economy was noticeably dampened towards the end of winter half year 2022/23.”
Market reaction
At the time of writing, EUR/USD is trading at 1.0875, adding 0.26% on a daily basis.
The European Central Bank (ECB) published its Economic Bulletin article this Monday, offering details on the economic, financial and monetary developments in the Euro area.
Key highlights
Most of the impact on inflation is expected from 2023 onward.
The impact is expected to peak in 2024.
Policy tightening is estimated to have lowered inflation by around 50 bps last year.
The downward impact on inflation is expected to average around 2% over 2023-25.
Transmission of rate hikes to economic activity is faster.
Impact on GDP growth expected to peak in 2023.
Related reads
- EU Commission bumps up 2023 Eurozone GDP and inflation forecasts
- EUR/USD regains the smile and retests 1.0880
In its quarterly publication released on Monday, the European Commission revised upwards its projections for Eurozone’s economic growth and inflation this year.
Additional takeaways
Forecasts 2023 Eurozone GDP growth at 1.1%, up from 0.9% forecast in Feb, sees growth in 2024 at 1.6%, up from the previous 1.5%.
Forecasts 2023 Eurozone inflation at 5.8%, up from 5.6% forecast in Feb, sees inflation in 2024 at 2.8%, up from the previous 2.5%.
Forecasts 2023 Unemployment steady at 6.8% of the workforce, falling to 6.7% in 2024.
Forecasts 2023 Eurozone aggregated budget deficit to shrink to 3.2%/GDP in 2023, 2.4% GDP in 2024 from 3.6% in 2022.
Forecasts 2023 Eurozone public debt to fall to 90.8% of GDP in 2023 and 89.9% in 2024 from 93.1% in 2022.
Market reaction
The quarterly forecasts add to the ongoing upbeat momentum in the Euro, as EUR/USD continues to challenge intraday highs near 1.0880, up 0.25% on the day.
- EUR/USD partially reverses last week’s sharp pullback.
- EMU Industrial Production comes next in the calendar.
- NY Empire State index, Fedspeak next of note across the pond.
The single currency regains some balance and motivates EUR/USD to rebound from recent multi-week lows near 1.0850.
EUR/USD up on weaker dollar
EUR/USD regains some upside traction and sets aside part of last week’s deep sell-off to the mid-1.0800s, an area last seen back in mid-April, on the back of some corrective decline in the greenback.
Indeed, traders appear to be cashing out part of the recent dollar’s gains on Monday, while the appetite for the risk complex seems to lend much needed oxygen to the pair at the beginning of the week.
Monday’s uptick in spot, in the meantime remains underpinned by the continuation of the recovery in the German 10-year Bund yields, which add to Friday’s gains near the 2.30% area.
In the docket, the European Commission (EC) released its updated forecasts and now sees the unemployment steady at 6.8% this year and retreating to 6.7% in 2024. The EC also revised up its projections for inflation and economic growth and expects consumer prices to rise 5.8% in 2023 and 2.8% during the next year and the economy to expand 1.1% in 2023 and 1.6% in 2024.
In the calendar, Industrial Production in the broader euro area is due later while the NY Empire State Manufacturing Index and TIC Flows are due across the pond along with speeches by Fed’s Bostic, Kashkari, Barkin and Cook.
What to look for around EUR
EUR/USD attempts a mild rebound following the reversal to 5-week lows in the 1.0850 region recorded on Friday.
The movement of the euro's value is expected to closely mirror the behaviour of the US Dollar and will likely be impacted by any differences in approach between the Fed and the ECB with regards to their plans for adjusting interest rates.
Moving forward, hawkish ECB-speak continue to favour further rate hikes, although this view appears in contrast to some loss of momentum in economic fundamentals in the region.
Key events in the euro area this week: Eurogroup Meeting, EMU Industrial Production (Monday) – ECOFIN Meeting, EMU Flash Q1 GDP Growth Rate, ZEW Economic Sentiment, Germany ZEW Economic Sentiment (Tuesday) – EMU Final Inflation Rate (Wednesday).
Eminent issues on the back boiler: Continuation of the ECB hiking cycle in June and July (September?). Impact of the Russia-Ukraine war on the growth prospects and inflation outlook in the region. Risks of inflation becoming entrenched.
EUR/USD levels to watch
So far, the pair is gaining 0.25% at 1.0875 and the surpass of 1.1095 (2023 high April 26) would target 1.1100 (round level) en route to 1.1184 (weekly high March 21 2022). Conversely, the next contention level emerges at 1.0844 (monthly low May 15) seconded by 1.0831 (monthly low April 10) and finally 1.0799 (100-day SMA).
- EUR/GBP reverses an intraday dip to the 0.8700 mark, albeit lacks follow-through buying.
- The BoE’s less hawkish outlook undermines the GBP and acts as a tailwind for the cross.
- The mixed comments by ECB policymakers warrant caution for aggressive bullish traders.
The EUR/GBP cross attracts some buying following a modest gap down opening on Monday, albeit struggles to capitalize on the uptick. Spot prices, meanwhile, remain well within Friday's broader trading range and currently trade just above the 0.8700 mark during the early European session.
The British Pound continues with its relative underperformance in the wake of the Bank of England's (BoE) less hawkish outlook and lends some support to the EUR/GBP cross. It is worth recalling that the BoE Governor Andrew Bailey, speaking at the post-meeting press conference last week, noted that there are good reasons to think that CPI will fall sharply. Even the mostly in-line release of the UK GDP report for the first quarter of 2023 and the upbeat UK Manufacturing/Industrial Production figures for March released on Friday failed to impress the GBP bulls.
EUR/GBP cross, however, struggles to gain any meaningful traction and remains below the technically significant 200-day Simple Moving Average (SMA). The shared currency is undermined by the recent mixed signals from the European Central Bank (ECB) officials over the future rate-hike path. In fact, the ECB Governing Council member Yannis Stournaras told a Greek newspaper on Wednesday that we are close to the end of the tightening cycle and as things stand now, we can say that interest rate hikes will be over in 2023.
This, along with looming recession risks, continues to weigh on the shared currency and contributes to capping the upside for the EUR/GBP cross. In the absence of any relevant market-moving economic data, either from the Eurozone or the UK, the fundamental backdrop warrants some caution for aggressive bullish traders. Hence, it will be prudent to wait for strong follow-through buying before confirming that the cross has formed a bottom and positioning for an extension of last week's bounce from the YTD low, around the 0.8660 region.
Technical levels to watch
Here is what you need to know on Monday, May 15:
The action in financial markets remain subdued at the beginning of the week and the US Dollar Index (DXY) consolidates last week's gains, whilc holding above 102.50. May Industrial Production data from the Eurozone will be featured in the European economic docket. Later in the day, the Federal Reserve Bank of New York will release the Empire State Manufacturing Index. In the early trading hours of the Asian session on Tuesday, Industrial Production and Retail Sales data from China will be looked upon for fresh impetus.
Late Friday, the University of Michigan reported that the Consumer Confidence Index dropped to 57.7 (preliminary) in May from 63.5 in April. Furthermore, the one-year inflation expectation component edged lower to 4.5% from 4.6% but the 5-year inflation expectation rose from 3.0% to 3.2%, the highest reading since 2011. Supported by the risk-averse market environment, the DXY gained nearly 1.5% last week and registered its highest weekly close since late March. Early Monday, US stock index futures are up around 0.3% and the benchmark 10-year US Treasury bond yield hold steady slightly below 3.5%.
Earlier in the day, US President Joe Biden reportedly said that he expects to meet with Congressional leaders for the next round of debt limit negotiations on Tuesday.
EUR/USD broke below 1.0900 on Friday and lost nearly 100 pips on the day. The pair stages a technical correction and clings to small gains above 1.0850 early Monday.
GBP/USD lost nearly 200 pips last week and snapped a three-week winning streak. Although the pair edges higher in the European morning, it continues to trade below 1.2500.
USD/JPY gathered bullish momentum in the Asian session and touched its highest level in over 10 days at 136.26 before retreating toward 136.00 into the European session.
Gold price closed the previous week virtually unchanged as buyers managed to defend the key level on Friday. XAU/USD holds its ground early Monday and trades in positive territory near $2,020.
Ahead of Tuesday's key data releases from China, AUD/USD stays bullish early Monday and continues to stretch higher toward 0.6700. Similarly, NZD/USD was last seen rising 0.5% on the day above 0.6200.
Following a quiet weekend, Bitcoin has gathered recovery momentum and advanced to the $24,500 area early Monday. Ethereum is up nearly 2% in the European morning, trading above $1,800.
- USD/JPY struggles to capitalize on its intraday move up to a one-and-half-week high.
- A modest USD downtick turns out to be a key factor acting as a headwind for the pair.
- The near-term fundamental backdrop seems tilted firmly in favour of bullish traders.
The USD/JPY pair builds on last week's rally from the 133.75 area and gains some follow-through traction for the third straight day on Monday. Spot prices, however, retreat a few pips from a one-and-half-week high touched in the last hour and slide below the 136.00 mark during the early European session.
The US Dollar (USD) pulls back from its highest level since April touched this Monday and turns out to be a key factor acting as a headwind for the USD/JPY pair. The downside for the USD, meanwhile, seems cushioned, at least for the time being, amid reviving bets that the Federal Reserve (Fed) might stick to its hawkish stance in the wake of a rise in the US long-term inflation expectations.
In fact, the preliminary May reading from the University of Michigan released on Friday showed that consumers see prices over the next five years climbing at an annual rate of 3.2% - the highest since 2011. This could force the Federal Reserve (Fed) to keep interest rates higher for longer, which continues to lend support to the US Treasury bond yields and underpin the Greenback.
The Japanese Yen (JPY), on the other hand, might continue to be weighed down by the Bank of Japan's (BoJ) dovish outlook. It is worth recalling that BoJ Governor Kazuo Ueda said last week that it was too early to discuss specific plans for an exit from the massive stimulus program. This, along with a positive tone around the US equity futures, might lend some support to the USD/JPY pair.
Market participants now look to the US economic docket, featuring the release of the Empire State Manufacturing Index. This, along with a scheduled speech by Minneapolis Fed President Neel Kashkari, will drive the USD demand and provide some impetus to the USD/JPY pair. Traders will further take cues from the broader risk sentiment to grab short-term opportunities around the major.
Technical levels to watch
- Gold price clings to mild gains during the first positive day in three.
- Corrective bounce in market sentiment adds strength to recovery from $2,010 support confluence.
- Hopes of US debt ceiling extension, absence of major risk-negative headlines keep XAU/USD on intraday buyers’ radar.
- Gold buyers need to gain validation from US default updates, banking news and US Retail Sales.
Gold price (XAU/USD) licks its wounds after a three-day downtrend, not to forget posting the biggest weekly loss since late September 2022. In doing so, the XAU/USD benefits from the US Dollar’s consolidation amid hopes of no US default, as well as mixed comments from the Federal Reserve (Fed) official. Also weighing on the US Dollar could be the news suggesting downbeat US data surrounding inflation and consumer confidence.
However, the Gold price remains on the bear’s radar amid hopes of witnessing more drama about the US debt ceiling extension, as well as fears of more banking fallouts and drowning of the deposits.
Moving on, short-term Gold price moves should rely on Tuesday’s US policymakers’ negotiations about the US debt ceiling extension. Also important are more clues about the US inflation and US Retail Sales data for April, as well as Fed Chair Jerome Powell’s speech.
Also read: Gold Price Forecast: 21 DMA holds the fort, what’s next for XAU/USD?
Gold Price: Key levels to watch
As per our Technical Confluence Indicator, Gold price remains firmer past the key $2,010 support confluence comprising Fibonacci 61.8% on one-week, 38.2% on one-month and middle band of the Bollonger on hourly chart.
With this, the XAU/USD snaps three-day downtrend while approaching $2,021 immediate upside hurdle encompassing the middle band of the Bollinger on four-hour play.
Following that, the 50-SMA on four-hour, near $2,030, may prod the Gold buyers before directing them to the key $2,050 hurdle comprising multiple tops marked since mid-April.
Meanwhile, a downside break of $2,010 won’t hesitate to direct the Gold price toward the $2,000 psychological magnet, also including the Pivot Point one-day S1 and the previous daily low.
Should the XAU/USD remains below $2,000, the $1,995 may act as an intermediate halt during the likely slump toward the previous monthly low of near $1,969.
Here is how it looks on the tool
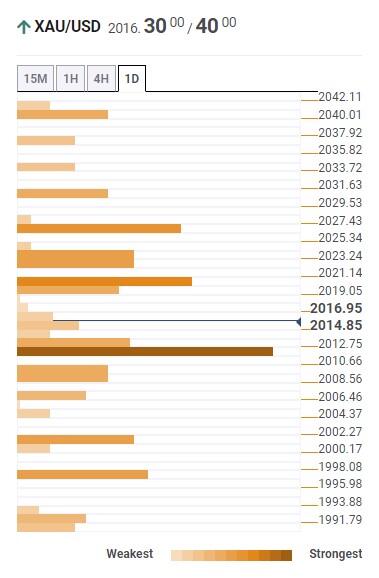
About Technical Confluences Detector
The TCD (Technical Confluences Detector) is a tool to locate and point out those price levels where there is a congestion of indicators, moving averages, Fibonacci levels, Pivot Points, etc. If you are a short-term trader, you will find entry points for counter-trend strategies and hunt a few points at a time. If you are a medium-to-long-term trader, this tool will allow you to know in advance the price levels where a medium-to-long-term trend may stop and rest, where to unwind positions, or where to increase your position size.
Economists at ING expect the Fed to cut rates by 100 bps and US-Eurozone divergence to drive EUR/USD to a 1.20 peak. However, some risks – including the US debt ceiling stalemate – can keep the Dollar afloat in the short term.
Dollar underperformance in the latter part of the year
“The widening of the US-eurozone and Fed-ECB divergence in the latter part of this year and the start of next year led us to revise our EUR/USD forecast higher: we now expect a peak at 1.20 in 4Q23/1Q23, before a descent to 1.15 toward the back-end of 2024 as the ECB starts easing.”
“The short-term outlook is admittedly less of a clear-cut bearish story for the Dollar. If US banking stress can hit the Dollar via the rate cut channel in the longer run, it can also keep it afloat in the short term by hurting risk sentiment and increasing safe-haven demand. Should the US debt ceiling stalemate result in substantial turbulence in money markets, it can also lead to a dramatic increase in demand for Dollars.”
Money managers stayed relatively flat on Gold positioning. Economists at TD Securities expect long positions to grow once data turns convincingly negative.
Ambiguity with respect to the direction Gold prices are expected to take
“There is definite ambiguity with respect to the direction Gold prices are expected to take. Some speculative investors see Gold trending higher amid the implied Fed pause, which explains the long position increases. In sharp contrast, others see prices trending down in response to a firm Dollar, elevated rates and a bond sell off.”
“Before money managers take a more one sided view on where the yellow metal will go, markets will need to see more economic data.”
“For now, it is likely that money managers may want to continue to reduce length. However, once data turns convincingly negative and the Fed is seen to pivot ahead of hitting its inflation target, longs will grow robustly.”
Economists at Natixis seek to determine whether or not the Dollar or Dollar-denominated bonds continue to play a safe haven role in times of crisis and rising risk aversion.
Is the Dollar still a safe haven asset?
“We found a significant effect of a rise in risk aversion (in the sense that higher risk aversion leads to a lower US long-term interest rate and an appreciation of the Dollar) as regards the Dollar long-term interest rate and the Dollar/Euro exchange rate, but, curiously, not as regards non-residents' purchases of US bonds and liquid assets.”
“We also found that in the recent period (since 2012), the effect of risk aversion on the long-term interest rate and on the Dollar/Euro exchange rate has been stronger than in previous periods.”
- NZD/USD recovers from three-week-old horizontal support area to snap two-day downtrend.
- Oversold RSI (14) line favors corrective bounce but convergence of 200-SMA, 50% Fibonacci retracement guards immediate upside.
- Multiple hurdles toward the north, bearish MACD signals prod Kiwi pair buyers.
NZD/USD pares the biggest weekly gain since late January as it picks up bids to refresh its intraday high near 0.6220 heading into Monday’s European session. In doing so, the Kiwi pair takes a U-turn from three-week-long horizontal support, amid an oversold RSI (14) line, to print the first daily run-up in three.
That said, the quote’s latest rebound pushes back the NZD/USD prices above the 61.8% Fibonacci retracement of its March-April upside.
However, a convergence of the 200-SMA and 50% Fibonacci retracement, near 0.6230-35, guards the NZD/USD pair’s immediate upside.
Following that, a quick run-up towards the 38.2% Fibonacci retracement level of near 0.6270 can’t be ruled out. Though, the 0.6300 and mid-April high of around 0.6315 could challenge the Kiwi pair’s further advances before directing the bulls towards the yearly top marked the last month around 0.6385.
On the other hand, a daily closing below the aforementioned horizontal support comprising levels marked since April 25, around 0.6190, could recall the NZD/USD bears targeting the monthly low of 0.6110.
Though, multiple levels marked near the 0.6100 round figure and the yearly low marked in March around 0.6085 could challenge the Kiwi pair sellers afterward.
NZD/USD: Four-hour chart
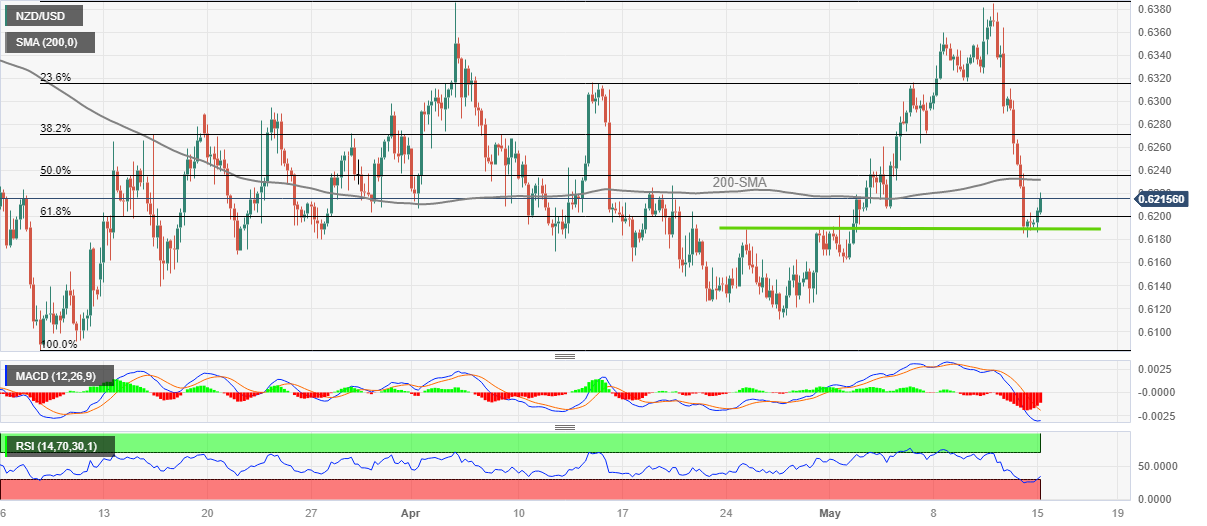
Trend: Limited upside expected
- Asian stocks are showing overall strength as the Fed is expected to pause the rate-hike spell.
- Japanese stocks have hogged the limelight after positive commentary from Japan’s Prime Minister Fumio Kishida.
- Better China's property sector outlook has infused strength in its equity domain.
Markets in the Asian domain are showing all-recovery strength as expectations for a pause in the policy-tightening spell by the Federal Reserve (Fed) are skyrocketing. The street is anticipating that Fed chair Jerome Powell will halt the rate-hike cycle to avoid the United States recession. Also, declining US inflation and Producer Price Index (PPI), and easing labor market conditions are supporting the context.
At the press time, Japan’s Nikkei225 jumps 0.73%, ChinaA50 climbs 0.70%, Hang Seng soared 2.19%, and Nifty50 gained 0.54%.
Japanese stocks have hogged the limelight after positive commentary from Japan’s Prime Minister Fumio Kishida. Japan’s PMI cited “We will endeavor to pull Japan out of deflation and attain private demand-driven economic growth.” Apart from that, Japan’s PM highlighted the need for the government and the Bank of Japan (BoJ) to closely coordinate for increasing economic policy. Also, Goldman Sachs stated solid fundamentals and expectations for structural changes justify a bullish stance on Japan’s equities.
Chinese equities are performing stronger as the economy is battling with the real estate crisis effectively. Meanwhile, Moody’s has changed China's property sector outlook to stable from negative on better sales and funding conditions. This has infused fresh blood into Chinese stocks. Going forward, China’s annual Retail Sales data will remain in the spotlight. April’s Retail Sales data is seen expanding by 20.1% vs. the prior release of 10.6%.
On the oil front, oil prices have recovered strongly to near $70.00 on hopes that a stable interest rate policy by the Fed will trigger the oil demand.
Economists at Commerzbank have adjusted their EUR/NOK forecasts.
Norges Bank keeps all doors open
“Norges Bank raised the key interest rate in May and signaled a further increase in June, but left all doors open for the time thereafter.”
“If the Krone remains weak, Norges Bank will raise the policy rate even further. However, as long as the ECB is perceived as the more restrictive central bank, the NOK should have little upside potential.”

Source: Commerzbank Research
See: A more hawkish Norges Bank could allow for EUR/NOK to push back towards the 11.40 level – Rabobank
- USD/TRY clings to mild gains after retreating from all-time high.
- Turkish elections fail to provide any clear results even if President Erdogan appears slightly ahead.
- Mixed sentiment, cautious mood ahead of May 28 runoff elections prod Turkish Lira bears.
- US debt ceiling updates, US Retail Sales and Fed Chair Powell’s speech eyed ahead of May 28 Presidential Vote.
USD/TRY justifies a hint of political deadlock in Turkiye as Sunday’s general elections failed to provide any clear winners, per the 99% votes counted by early Monday in Europe. In doing so, the Turkish Lira (TRY) pair also bears the burden of a likely Presidential runoff voting, up for May 28. However, the recent retreat of the US Dollar, amid cautious optimism surrounding the US debt ceiling extension, appears to prod the pair buyers as they keep the record high on their radar.
Although the incumbent Tayyip Erdogan got near 49.44% votes in the latest elections, the rival Kemal Kilicdaroglu also got 44.86% ballots per the latest readings, which in turn suggests that neither Erdogan nor his rival cleared the threshold to win outright on Sunday. The same raises the possibility of a Presidential Vote on May 28. It’s worth noting, however, that the ruling alliance has major shares in the latest Parliamentary elections, which were also held on recently, which in turn allows Erdogan to remain hopeful. “The People's Alliance comprising Erdogan's Islamist-rooted AKP and the nationalist MHP and others appeared to have fared better than expected and be headed for a majority,” said Reuters.
On the other hand, the US Dollar Index (DXY) retreats from a five-week high to 102.60 by the press time, after posting the biggest weekly gains since late 2022 in the last. The DXY’s pullback could be linked to the market’s cautious optimism as US President Joe Biden said during the weekend that he expects to meet with Congressional leaders Tuesday for talks on a plan to raise the nation's debt limit and avoid a catastrophic default. Also taming the risk-off mood could be the comments from US Deputy Treasury Secretary Wally Adeyemo while speaking at the CNN interview as he said, “The congressional staff has been "constructive," as the two sides seek a deal to avert a possible first-ever US default on June 1.”
Elsewhere, hawkish Fed talks and mostly upbeat US data also keep the USD/TRY pair directed towards the all-time high marked the previous day near 20.40. That said, Fed Governor Philip Jefferson and St. Louis Fed President James Bullard defend the US central bank’s current monetary policy while citing higher inflation as a major challenge. On the same line, Fed Governor Michelle Bowman said Friday, “Policy rate will need to remain sufficiently restrictive for some time.”
Against this backdrop, S&P500 Futures struggle near 4,138 after a two-day downtrend whereas the US 10-year and two-year Treasury bond yields remain sidelined around 3.46% and 3.98 respectively, after rising the most in three days on Friday.
Moving on, USD/TRY traders should pay attention to US debt ceiling talks, US Retail Sales for April and Friday’s speech from Fed Chair Jerome Powell for clear directions. Above all, May 28 Presidential Vote will be the key for the Turkish Lira pair Erdogan’s re-election means no rate hike and a further run-up by the pair.
Technical analysis
An upward-sloping trend line from late June 2022, around 19.35 by the press time, appears the short-term key support for the USD/TRY sellers to break to retake control. Until then, The Turkish Lira (TRY) bears are on their way to refreshing the record high, marked the previous day near 20.42.
- GBP/USD has attempted a recovery after building a cushion around 1.2450 as the USD Index has turned volatile.
- The release of the US Retail Sales data will prove more clarity on Federal Reserve’s monetary policy action.
- Bank of England policymakers agreed that they underestimated the strength and persistence of the United Kingdom’s inflation.
- GBP/USD is at a make or a break level below the Rising Channel pattern, therefore, sheer volatility is widely anticipated
GBP/USD is gathering strength for a recovery move from near the 1.2450 support as the US Dollar Index (DXY) has demonstrated a loss in the upside momentum after printing a high of 102.75 in the early European session. The Cable is expected to gain strength after surpassing the immediate resistance of 1.2480.
S&P500 futures have added nominal gains in the Asian session after a mild bearish Friday, portraying a recovery in the risk appetite of the market participants. The appeal for risk-perceived assets has improved as investors are shifting their focus towards solidifying expectations of a pause in the policy-tightening regime by the Federal Reserve (Fed).
The Pound Sterling is likely to remain active ahead of the United Kingdom’s Employment data, which is scheduled for Tuesday. Shortage of labor in the UK market has been a major reason behind its tight labor market conditions.
US debt-ceiling talks remain a key event
After the postponement of Friday’s US debt-ceiling negotiations, US President Joe Biden and Republican House of Representatives Joseph McCarthy are set to meet again on Tuesday. The former wants the approval of raising the Federal borrowing cap but not at the cost of the President’s initiatives and the latter is ready to approve an increment in debt-ceiling if US President Joe Biden agrees to cut spending initiatives to reduce the budget deficit.
The Congressional Budget Office warned on Friday that the United States faced a "significant risk" of defaulting on payment obligations within the first two weeks of June without raising the government's $31.4 trillion debt ceiling, adding that payment operations will remain uncertain throughout May.
Also, IMF has warned that a U.S. default would have "serious repercussions" for the U.S. economy.
US Retail Sales in spotlight
Investors’ expectations for a pause in the policy-tightening process by the Federal Reserve are skyrocketing amid support from major United States economic indicators. US inflation and prices offered by producers for goods and services at factory gates also known as Producer Price Index (PPI) have slowed down, and labor market conditions are softening due to tight credit conditions and a bleak economic outlook, which indicates that the Federal Reserve will halt its aggressive policy-tightening spree to safeguard the economy from collateral damage.
For further guidance, investors will keep an eye on the monthly Retail Sales data (April). The economic data is seen expanding by 0.7% vs. a contraction of 0.6%. A recovery in retail demand could ease expectations of a pause in the aggressive rate-hike spell by the Federal Reserve.
Bank of England lays down arms in front of stubborn UK inflation
After hiking interest rates for the 12th consecutive time, Bank of England policymakers agreed that they underestimated the strength and persistence of the United Kingdom’s inflation. Bank of England Governor Andrew Bailey pushed interest rates by 25 basis points (bps) to 4.5%. Regarding inflation guidance, Bank of England policymakers believe that UK’s inflation will come down to 2% by early 2025. The current UK inflation situation might result in the missing of UK Prime Minister Rishi Sunak’s pledge of halving UK inflation by the end of CY2023.
Going forward, UK’s Employment data (April) will be keenly watched. Three-month Unemployment Rate is seen unchanged at 3.8%. Average Earnings excluding bonuses are expected to accelerate to 6.8% from the former release of 6.6%. This could fuel inflationary pressures further. Claimant Count Change is seen declining by 10.8K.
GBP/USD technical outlook
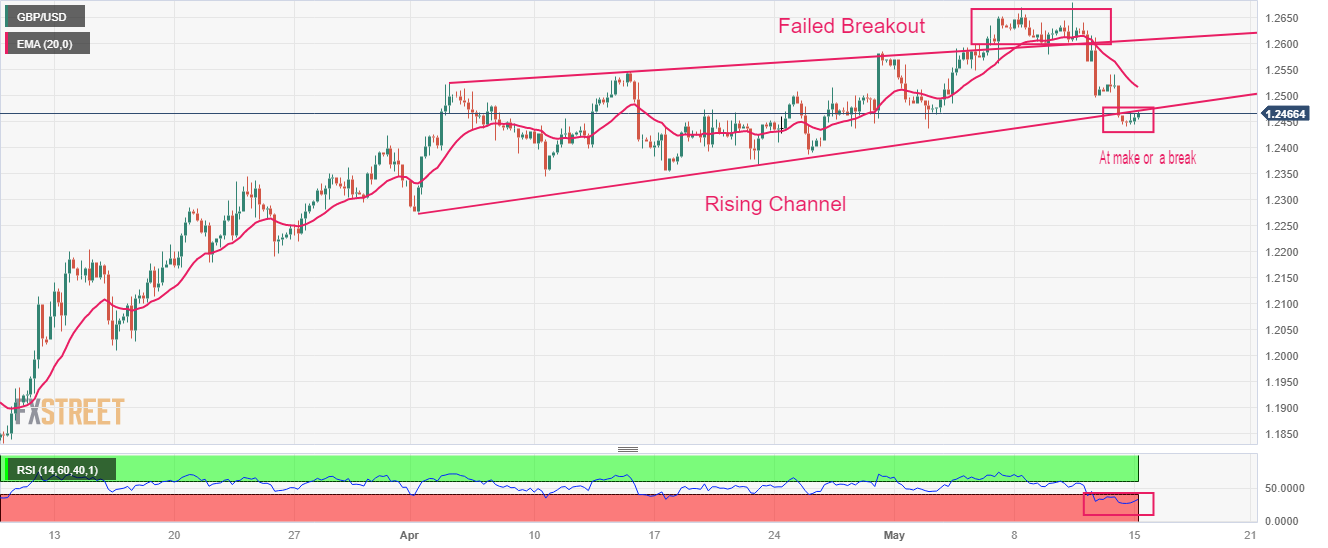
GBP/USD has slipped below the Rising Channel chart pattern formed on a four-hour scale. The Cable is at a make or a break level, therefore, sheer volatility is widely anticipated. The 20-period Exponential Moving Average (EMA) at 1.2516 has acted as a major barricade for the Pound Sterling bulls.
The Relative Strength Index (RSI) (14) is oscillating in the bearish range of 20.00-40.00, advocating more weakness ahead.
- The index gives away gains following new highs near 102.80.
- US yields start the trading week on a positive foot.
- NY Empire State Index, TIC Flows, Fedspeak next on tap.
The USD Index (DXY), which gauges the greenback vs. a basket of its main competitors, trades slightly on the defensive after hitting new 5-week highs around 102.75 on Monday.
USD Index looks at risk trends, Fedspeak
After two consecutive daily upticks, including new multi-week highs near 102.80 recorded during early trade, the index now gives away some gains ahead of the opening bell in Euroland on Monday.
A tepid recovery in the risk complex, in the meantime, appears to put the dollar under some mild pressure at the beginning of the week despite US yields look poised to extend Friday’s bounce.
Meanwhile the probability of a pause at the Fed’s hiking cycle at the June 14 meeting looks the most likely scenario with nearly 85% according to CME Group’s FedWatch Tool.
In the US data space, the NY Empire State manufacturing gauge and TIC Flows will be in the limelight along with speeches by Atlanta Fed R. Bostic (2024 voter, hawk), Minneapolis Fed N. Kashkari (voter, centrist), Richmond Fed T. Barkin (2024 voter, centrist) and FOMC’s L. Cook (permanent voter, hawk).
What to look for around USD
The index keeps the trade in the area of multi-week peaks near the 103.00 barrier at the beginning of a new trading week.
The index seems to be facing downward pressure in light of the recent indication that the Fed will probably pause its normalization process in the near future. That said, the future direction of monetary policy will be determined by the performance of key fundamentals (employment and prices mainly).
Favouring an impasse by the Fed appears the persevering disinflation – despite consumer prices remain well above the target – incipient cracks in the labour market, the loss of momentum in the economy and rising uncertainty surrounding the US banking sector.
Key events in the US this week: NY Empire State Index, TIC Flows (Monday) – Retail Sales, Business Inventories, NAHB Housing Market Index (Tuesday) – MBA Mortgage Applications, Building Permits, Housing Starts (Wednesday) – Philly Fed Index, Initial Jobless Claims, CB Leading Index, Existing Home Sales (Thursday) – Fed J. Powel (Friday).
Eminent issues on the back boiler: Persistent debate over a soft/hard landing of the US economy. Terminal Interest rate near the peak vs. speculation of rate cuts in late 20223. Fed’s pivot. Geopolitical effervescence vs. Russia and China. US-China trade conflict.
USD Index relevant levels
Now, the index is down 0.09% at 102.60 and faces the next support at 101.01 (weekly low April 26) prior to 100.78 (2023 low April 14) and finally 100.00 (psychological level). On the other hand, the break above 102.75 (monthly high May 15) would open the door to 102.80 (weekly high April 10) and then 103.05 (monthly high April 3).
Open interest in gold futures markets shrank by around 2.3K contracts after four consecutive daily builds on Friday, according to preliminary readings from CME Group. Volume followed suit and dropped by around 127.2K contracts following three daily advances in a row.
Gold remains supported by $2000
Friday’s third consecutive daily drop in gold prices was on the back of shrinking open interest and volume, removing strength from further weakness and opening the door to a potential rebound in the short-term horizon. In the meantime, solid support for the commodity remains at the key $2000 mark per ounce troy.
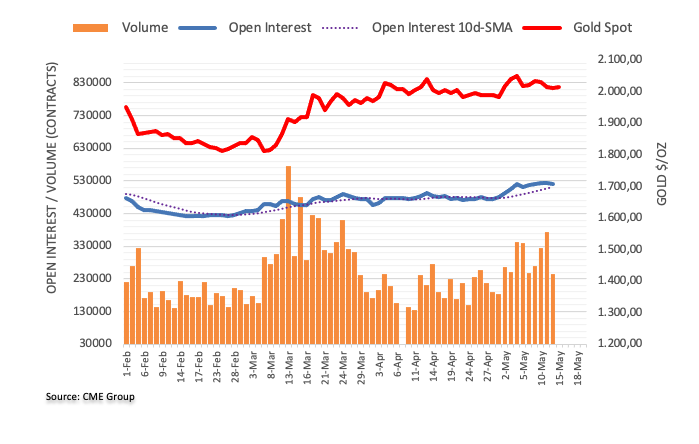
The negative view in EUR/USD remains unchanged for the time being, note Economist Lee Sue Ann and Markets Strategist Quek Ser Leang and UOB Group.
Key Quotes
24-hour view: “We expected EUR to ‘weaken further’ last Friday but we were of the view that ‘it is unlikely to break the major support at 1.0850 today’. Our view of EUR weakness was correct even though it slightly breached 1.0850 (low has been 1.0846). While severely oversold, EUR weakness has yet to stabilize. However, the major support at 1.0800 is likely out of reach today. Resistance is at 1.0870, followed by 1.0895.”
Next 1-3 weeks: “Last Friday (12 May, spot at 1.0915), we turned negative in EUR and highlighted that it ‘is likely to head lower in the coming days’. We added, ‘the level to watch is 1.0850, as a break of this key support could potentially trigger a sharp and rapid drop in EUR’. While our view was not wrong, we did not quite expect EUR to breach 1.0850 so quickly as it plummeted to a low of 1.0846 (-0.60%). There is no change in our negative EUR view and the next level to watch is 1.0800. Looking ahead, if EUR can break and stay below 1.0800, the next level to focus on is 1.0720. We will hold a negative EUR view as long as it does not break above 1.0935 (‘strong resistance’ level was at 1.0990 last Friday).”
- Natural Gas cheers upside break of two-month-old resistance at a fortnight high.
- Convergence of 50-day EMA, 38.2% Fibonacci retracement of March-April downside appears a tough nut to crack for XNG/USD bulls.
- Ascending support line from May 05 adds to the downside filters for the Natural Gas price.
Natural Gas Price (XNG/USD) remains firmer around $2.42, up for the third consecutive day while flirting with the highest levels in two weeks during early Monday in Europe.
In doing so, the energy instrument cheers the previous day’s sustained break of a downward-sloping resistance line from mid-March, now immediate support near $2.38.
Adding strength to the bullish bias is the RSI (14) line that stays firmer around the 50.00 level, suggesting a continuation of the upward grind.
However, the 50-day Exponential Moving Average (EMA) and 38.2% Fibonacci retracement level of the XNG/USD’s downside from early March to mid-April, near $2.48 at the latest, could challenge the Natural Gas bulls.
In a case where the commodity price manages to provide a daily close beyond $2.48, the odds of witnessing a run-up beyond the previous monthly high of nearly $2.58 can’t be ruled out.
On the contrary, the resistance-turned-support line from March, near $2.38, restricts the immediate downside of the Natural Gas price.
Following that, an upward-sloping trend line from May 05, close to $2.30 by the press time, appears crucial to watch for the XNG/USD bears to watch as a break of which could give back control to them.
Natural Gas Price: Daily chart
Trend: Further upside expected
- Gold price is expected to return back to $2,000.00 as the USD Index is holding its support.
- S&P500 futures have recovered their entire losses and have turned positive, portraying solid appeal for US equities.
- Tuesday’s Retail sales data is seen expanding by 0.7% vs. a contraction of 0.6%.
Gold price (XAU/USD) has retreated from $2,019.00 after a less-confident recovery move in the Asian session. The precious metal is expected to return to the psychological support of $2,000.00 as the US Dollar Index (DXY) has rebounded firmly.
It seems that the marginal correction in the USD Index has been bought by investors and the asset is aiming to recapture a five-week high at 102.75.
S&P500 futures have recovered their entire losses and have turned positive, portraying solid appeal for US equities. Investors are pouring funds into equities in hopes that the Federal Reserve (Fed) will pause its aggressive policy-tightening spree to avoid further damage to economic prosperity.
Investors will get more clarity on Fed’s action after the release of the monthly US Retail Sales data (April). Tuesday’s Retail sales data is seen expanding by 0.7% vs. a contraction of 0.6%. A recovery in retail demand would escalate fears of further interest rate hikes from the Fed.
The USD Index is holding strength amid uncertainty over the outcome of US debt ceiling negotiations. US President Joe Biden has announced further negotiations with Republican leaders for raising the US debt ceiling limit to avoid default on obligated payments.
Gold technical analysis
Gold price is auctioning in a Rising Channel chart pattern on a two-hour scale. The upper portion of the aforementioned chart pattern is plotted from March 20 high at $2,009.88 while the lower portion is placed from March 22 low at $1,934.34. The downward-sloping trendline plotted from all-time highs at May 03 high at $2,079.78 is acting as a barricade for the Gold bulls.
Also, the 50-period Exponential Moving Average (EMA) at $2,019.38 has restricted the upside of the Gold bulls.
The Relative Strength Index (RSI) (14) is oscillating in the 40.00-60.00, indicating a lackluster move ahead.
Gold two-hour chart
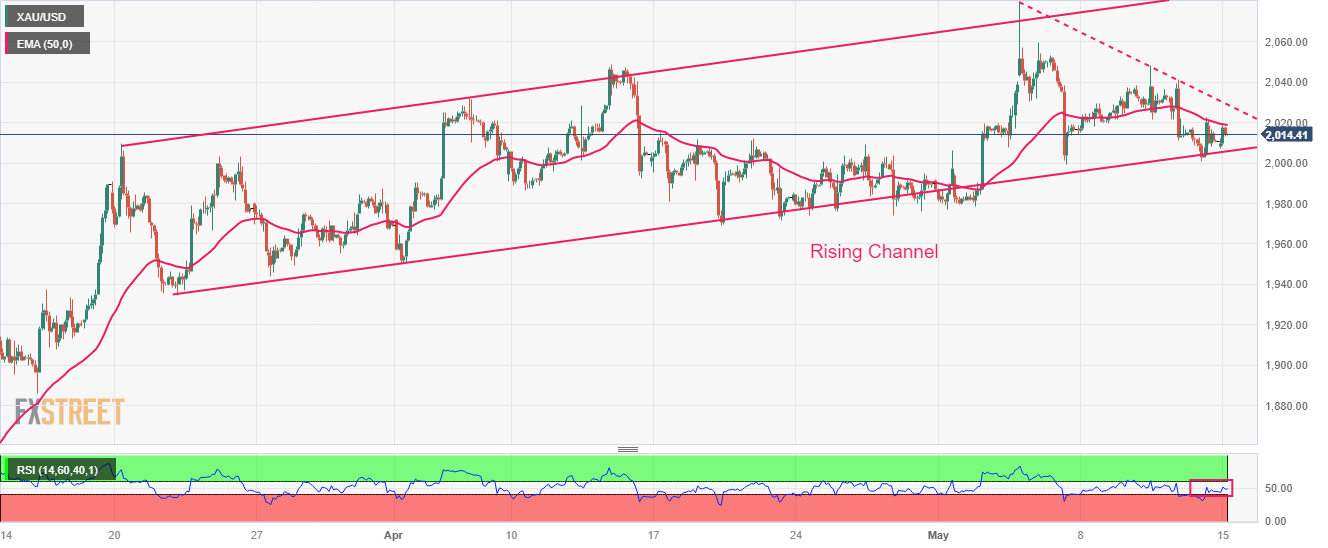
- USD/IDR prints the first daily loss in three, fades bounce off intraday low of late.
- Indonesia Exports, Imports ease in April, Trade Balance improves.
- US Dollar’s retreat amid cautious optimism also weighs on USD/IDR price.
USD/IDR clings to mild losses near 14,815 as it defends the early Asian session’s pullback from a 12-day-high after witnessing mixed Indonesia trade numbers on Monday. In doing so, the Indonesia Rupiah (IDR) pair also cheers the US Dollar’s retreat amid sluggish markets.
That said, Indonesia’s headline Trade Balance improves to 3.94B in April versus 3.38B market forecasts and 2.91B prior. However, the Exports and the Imports for the said month marked downbeat figures of -29.40% and -22.32% in that order, down from -11.33% and-6.26% respectively prior.
On the other hand, the US Dollar Index (DXY) eases from its five-week high to 102.65 amid cautious optimism in the market. The reason could be linked to comments from US President Joe Biden who said during the weekend that he expects to meet with Congressional leaders Tuesday for talks on a plan to raise the nation's debt limit and avoid a catastrophic default. Also taming the risk-off mood could be the comments from US Deputy Treasury Secretary Wally Adeyemo while speaking at the CNN interview as he said, “The congressional staff has been "constructive," as the two sides seek a deal to avert a possible first-ever US default on June 1.”
It should be noted that the US policymakers’ delaying of the debt ceiling talks on Friday and downbeat US consumer sentiment, as well as inflation clues, weighed on the risk appetite previous day and allowed the US Dollar to remain firmer.
Against this backdrop, S&P500 Futures struggle near 4,138 after a two-day downtrend whereas the US 10-year and two-year Treasury bond yields remain sidelined around 3.46% and 3.98 respectively, after rising the most in three days on Friday. It should be noted that Indonesia’s IDX Composite drops half a percent as we write.
Moving on, USD/IDR traders may witness further upside amid looming fears of the US default. However, Tuesday’s US debt ceiling talks will be the key to watching for immediate directions. Following that, US Retail Sales and a speech from Fed Chairman Jerome Powell should be eyed closely for a clear guide.
Technical analysis
Unless dropping back below the previous resistance line from mid-March, now support around 14,705, the USD/IDR buyers remain hopeful.
- USD/INR retreats after refreshing three-week high, prods two-day winning streak.
- Upbeat oscillators, sustained break of 100-DMA favors Indian Rupee bears.
- 61.8% Fibonacci retracement, six-week-old descending resistance line restrict immediate upside.
- USD/INR buyers remain hopeful above 200-DMA; two-month-old previous resistance line adds to the downside filters.
USD/INR remains mildly offered near 82.20 as it retreats from the highest levels in three weeks during early Monday. In doing so, the Indian Rupee pair fails to justify the previous day’s upside break of the 100-DMA as the 61.8% Fibonacci retracement level of its October-November downside.
Even so, the bullish MACD signals and upbeat RSI (14) line, not overbought, keep the USD/INR pair buyers hopeful of witnessing a daily closing beyond the aforementioned key Fibonacci retracement level of 82.25.
However, a downward-sloping resistance line from April 03, close to 82.30 can act as an extra filter towards the north.
In a case where the USD/INR bulls manage to keep the reins past 82.30, the tops marked during April around 82.40 and 82.50 could lure the pair buyers.
Following that, the yearly high marked in March around 83.05 will be in the spotlight.
Alternatively, a daily closing below the 100-DMA level of around 82.15 isn’t an open invitation to the USD/INR bears as the resistance-turned-support line from mid-March, around the 82.00 round figure, could challenge the Indian Rupee buyers.
Though, the pair sellers should remain cautious unless witnessing a daily closing below the 200-DMA support of around 81.70.
USD/INR: Daily chart
-15052023-638197210761666585.png)
Trend: Further upside expected
- USD/CAD is struggling for decisive action as investors are awaiting Canada’s inflation for further guidance.
- Canada’s core and headline inflation are seen softening to 3.9% and 3.7% respectively.
- USD/CAD is marching towards the downward-sloping trendline plotted from 1.3862.
The USD/CAD pair has turned sideways around 1.3553 after a solid opening in the Asian session. The Loonie asset is expected to remain lackluster as investors are awaiting the release of Canada’s Consumer Price Index (CP) and negotiations over US debt-ceiling talks for further guidance.
The US Dollar Index (DXY) has demonstrated a loss in the upside momentum after printing a fresh five-week high of 102.75, which has infused some strength in the risk-sensitive assets, portraying an improvement in market sentiment.
On the economic data front, Canada’s core CPI is seen softening to 3.9% from the former release of 4.3%. Headline CPI is seen declining to 3.7% vs. the prior release of 4.3%. A release of the anticipated Canada inflation report will allow the Bank of Canada (BoC) to continue to its current monetary policy.
USD/CAD is marching towards the downward-sloping trendline plotted from March 10 high at 1.3862 on a four-hour scale. On a broader note, the Loonie asset is forming an Ascending Triangle chart pattern, which demonstrates a contraction in volatility.
Advancing 20-period Exponential Moving Average (EMA) at 1.3486 is continuously providing support to the US Dollar bulls.
The Relative Strength Index (RSI) (14) has shifted into the bullish range of 60.00-80.00, which advocates the continuation of the upside momentum.
The upside bias will get strengthened if the Loonie asset manages to surpass the round-level resistance of 1.3600. This will expose the asset to May 21 low at 1.3644 followed by the round-level resistance at 1.3700.
On the flip side, a break below May 12 low at 1.3480 will fade the upside bias and will drag the asset toward April 04 low at 1.3406 and May 08 low at 1.3315.
USD/CAD four-hour chart
Following a joint meeting between the Japanese Cabinet Office and the Bank of Japan (BoJ) on Monday, the country’s Economy Minister Shigeyuki Goto said that the BoJ Governor Kazuo Ueda explained at the meeting how the central bank will keep the ultra-loose policy to sustainably and stably achieve price target.
Additional takeaways
“Among key points of meeting's discussion was for govt, BoJ to work closely together, share a common goal and strive toward achieving it.”
“Govt believes it's meaningful for BoJ to conduct a review of past monetary policy conduct.“
“BoJ must respond nimbly to any change, downside risks to the economy.”
Related reads
- USD/JPY Price Analysis: Golden cross lures Yen sellers to aim for 136.50
- Japan's government, BoJ debate deflation risk, role in keeping wage hikes
- EUR/USD is needed a decisive break above 1.0860 for a confident recovery as the market mood is turning cheerful.
- US President Joe Biden is set to meet Republican leaders for further negotiations on raising the borrowing cap on Tuesday.
- The pace of Eurozone GDP is seen unchanged on a quarterly and an annual basis at 0.1% and 1.3% respectively.
The EUR/USD pair attempted a rebound move from 1.0850 but has struggled in extending recovery above 1.0863 in the Asian session. The major currency pair is making efforts for extending recovery as the US Dollar Index (DXY) has shown signs of exhaustion in the upside momentum.
Improving market sentiment has fueled some strength in risk-perceived assets. S&P500 futures have recovered the majority of losses reported in early Asia as investors are ignoring risks associated with United States debt-ceiling issues and are capitalizing on rising expectations that the Federal Reserve (Fed) will pause its policy-tightening spell.
The US Dollar Index (DXY) has shown some volatility in the Asian session after refreshing its five-week high at 102.75 as US President Joe Biden is set to meet Republican leaders for further negotiations on raising the borrowing cap of the US Treasury on Tuesday. However, no practical outcome of Tuesday’s meeting would deeper fears of payment default significantly.
Meanwhile, volatility increment in the USD Index has also impacted US yields. The 10-year US Treasury yields have dropped below 3.46%.
Going forward, the USD Index would show some action amid the release of the US Retail Sales data. Monthly Retail Sales data is seen expanding by 0.7% vs. a contraction of 0.6%. A recovery in the retail demand by households might weak expectations for a rate-hike pause by the Fed.
On the Eurozone front, investors are awaiting the release of the preliminary Gross Domestic Product (GDP) data (Q1), which is scheduled for Tuesday. The pace in GDP growth is seen unchanged on a quarterly and an annual basis at 0.1% and 1.3% respectively. It seems that Eurozone would manage to escape recession ahead.
About interest rate guidance, European Central Bank (ECB) policymaker Peter Kazimir said, “ECB may need to raise interest rates longer than previously thought to help tame inflationary pressures.”
- Silver price licks its wounds at the lowest levels in six weeks.
- Downbeat RSI (14) allows 50-DMA to challenge XAG/USD bears.
- Horizontal hurdle from early 2023, 21-DMA guard recovery moves.
Silver price (XAG/USD) struggles to defend the latest corrective from a 1.5-month low near $26.00 amid early Monday morning in Europe.
That said, the bright metal dropped to the lowest levels since early April the previous day but failed to offer a daily close beneath the 50-DMA, around $23.90 by the press time.
In addition to the failure to provide a daily close below the short-term key DMA, the downbeat conditions of the RSI (14) line also favored the Silver price’s corrective bounce on early Monday.
However, the bearish MACD signals and sustained trading below the previous key supports keep the XAG/USD bears hopeful.
That said, the corrective bounce remains elusive unless the quote stays below a horizontal area comprising multiple levels marked since early January 2023, close to $24.60.
Even if the XAG/USD rises past $24.60, the 21-DMA hurdle of around $25.10 can prod the bulls before giving them control.
On the contrary, a daily close below the 50-DMA level of near $23.90 can quickly direct the Silver price toward the 100-DMA support surrounding $23.40.
Following that, the 61.8% Fibonacci retracement level of the precious metal’s March-May upside, near $22.30, can act as the last defense of the Silver buyers.
Silver price: Daily chart
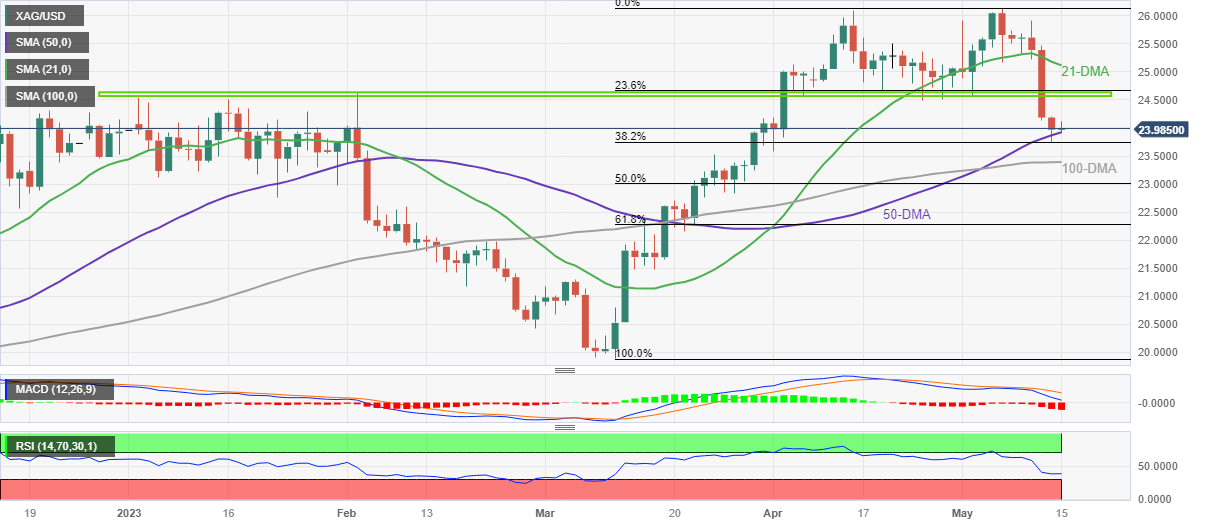
Trend: Further downside expected
- USD/CNH seesaws around the highest levels in nine weeks, prods four-day uptrend.
- US Dollar struggles to defend the biggest weekly gain since September 2022 as US policymakers appear hopeful of avoiding default.
- PBOC keeps one-year MLF rate unchanged at 2.75%.
- US debt ceiling talks, China data dump will be crucial to watch for clear directions.
USD/CNH grinds near the multi-day top as bulls seek fresh clues to extend the latest run-up past 6.9700 during early Monday. In doing so, the offshore Chinese Yuan (CNH) pair justifies the market’s latest consolidation ahead of the key data/events.
People's Bank of China (PBOC) keeps the one-year Medium-term Lending Facility (MLF) rates unchanged at 2.75%, per the latest update. The news joins the PBOC’s highest daily fix since March 10 to propel the USD/CNH price.
However, risk appetite improves a bit during early Monday as US President Joe Biden said during the weekend that he expects to meet with Congressional leaders Tuesday for talks on a plan to raise the nation's debt limit and avoid a catastrophic default. Also taming the risk-off mood could be the comments from US Deputy Treasury Secretary Wally Adeyemo while speaking at the CNN interview as he said, “The congressional staff has been "constructive," as the two sides seek a deal to avert a possible first-ever US default on June 1.”
Elsewhere, fears that the US-China tussles can keep growing amid the Dragon nation’s dislike for Washington’s ties with Taiwan weighs on the mood. Further, a divergence between the hawkish Fed bias and the dovish PBOC moves also underpins the USD/CNH upside. Furthermore, the G7 nations’ readiness to announce more sanctions on Russia keeps the pessimists on the table and propels the offshore Yuan pair’s prices.
While portraying the mood, S&P500 Futures struggled during the third day of losses near 4,135 whereas the US 10-year and two-year Treasury bond yields remain sidelined around 3.46% and 3.98 respectively, after rising the most in three days on Friday.
It’s worth noting, however, that the US Dollar Index (DXY) resists stepping back after rising the most since late 2022 in the last week amid geopolitical and Fed concerns, which in turn keeps the USD/CNH bulls hopeful ahead of Tuesday’s key debt ceiling talks. That said, Fed Governor Philip Jefferson and St. Louis Fed President James Bullard defend the US central bank’s current monetary policy while citing higher inflation as a major challenge. On the same line, Fed Governor Michelle Bowman said Friday, “Policy rate will need to remain sufficiently restrictive for some time.”
Technical analysis
Despite the latest inaction, mainly due to the overbought RSI (14) line, the USD/CNH pair’s daily closing beyond the 200-DMA, around 6.9330 by the press time, keeps buyers hopeful.
- USD/JPY stays firmer at the highest levels in over a week, prints three-day uptrend.
- Clear upside break of key moving averages, fortnight-old horizontal resistance favors Yen pair buyers.
- 50-HMA pierces off 200-HMA from below, suggesting further upside of the USD/JPY pair.
- Overbought RSI (14) line, two-week-long horizontal area prod USD/JPY bulls.
USD/JPY picks up bids to remain firmer around 136.00, printing a three-day uptrend at a one-week high during early Monday.
In doing so, the Yen pair cheers the previous day’s upside break of a horizontal area comprising multiple levels marked since April 28, close to 135.50, as well as a successful upside break of the 200-Hour Moving Average (HMA) level of near 134.90 at the latest.
However, an 11-day-old horizontal resistance zone joins the overbought RSI (14) line and sluggish MACD signals to prod the USD/JPY bulls below the 136.40-45 resistance area.
In a case where the Yen pair buyers ignore the aforementioned negatives to the USD/JPY bulls, the odds of witnessing a rally towards the previous monthly high of around 137.80 and the yearly top marked in March near 137.90, quickly followed by the 138.00 threshold, can’t be ruled out.
Meanwhile, a downside break of the stated HMAs, near 134.90-80, isn’t an open invitation to the USD/JPY bears as an upward-sloping support line from April 26, close to 134.00, may act as the last defense of the buyers.
Overall, USD/JPY may witness further upside but the room towards the north appears limited.
USD/JPY: Hourly chart
-1552023-638197147810019640.png)
Trend: Limited upside expected
| Raw materials | Closed | Change, % |
|---|---|---|
| Silver | 23.974 | -0.86 |
| Gold | 2010.82 | -0.22 |
| Palladium | 1505.34 | -3.01 |
Japan's top Economic Council in Monday meeting debated the role the government and Bank of Japan (BoJ) should play in sustainably raising wages and eliminating the risk of return to deflation, Reuters reports, citing presentation material released after the meeting.
Additional takeaways
“Cabinet Office told meeting must ensure recent positive signs on end to deflation are sustainable.”
“Some participants in economic council session with private experts urged BoJ to end quantitative easing when inflation stabilizes around 2%.”
“Some participants in economic council session with private experts said BoJ should consider modifying extraordinary stimulus if inflation, wages keep rising.”
Market reaction
USD/JPY is paring back gains below 136.00, as the Japanese Yen cheers the above report. The pair is still up 0.13% on the day, at the press time.
- Market sentiment remains mildly positive as US President Biden, Treasury Official Adeyemo push back default fears.
- Hawkish Fed talks, mixed US data and geopolitical fears join US policymakers’ disagreements to keep traders on their toes.
- Second-tier US data, central bankers may entertain traders but US debt ceiling talks are the key.
Risk appetite improves a bit during early Monday as the US policymakers hint at a solution to the looming US debt ceiling expiry. Adding strength to the market’s cautious optimism may be the lack of major data/events, as well as mixed comments from the Group of Seven (G7) nations.
Even so, the large differences among the US diplomats on the steps needed to avoid default and the G7 nations’ readiness to announce more sanctions on Russia keeps the pessimists on the table. On the same line could be the central bankers’ hints for the “higher for longer” rates, ex-Bank of Japan (BoJ).
Amid these plays, S&P 00 Futures struggle during the third day of losses near 4,135 whereas the US 10-year and two-year Treasury bond yields remain sidelined around 3.46% and 3.98 respectively, after rising the most in three days on Friday.
During the weekend, Reuters came out with the news stating that US President Joe Biden said he expects to meet with Congressional leaders Tuesday for talks on a plan to raise the nation's debt limit and avoid a catastrophic default.
Also positive were comments from US Deputy Treasury Secretary Wally Adeyemo while speaking at the CNN interview as he said, “The congressional staff has been "constructive," as the two sides seek a deal to avert a possible first-ever US default on June 1.”
On the different page, various policymakers from the European Central Bank (ECB) and the Federal Reserve (Fed) defended their current hawkish plays during the G7 central bankers’ meeting. Though, BoJ Governor Kazuo Ueda keeps praising the easy-money policy, recently backed by Japan’s softer Producer Price Index (PPI) for April.
Elsewhere, Reuters quotes anonymous officials with direct knowledge of the discussions while saying that the G7 leaders plan to tighten sanctions on Russia at their summit in Japan this week, with steps aimed at energy and exports aiding Moscow's war effort.
Amid these plays, the US Dollar Index (DXY) buyers take a breather while the Gold price pares the recent losses near $2,020. However, WTI crude oil remains pressured near $69.70, the lowest level in nearly two weeks.
Moving on, Tuesday’s US debt ceiling talks will be the key for the DXY traders to watch for immediate directions. Following that, US Retail Sales and a speech from Fed Chairman Jerome Powell should be eyed closely for a clear guide.
Also read: Forex Today: Despite all, Dollar ends week stronger
- GBP/USD has moved confidently above 1.2460 as the risk-off impulse is fading away.
- The USD Index has sensed a loss in the upside momentum as the Fed is expected to pause its rate-hiking spell ahead.
- UK Prime Minister Rishi Sunak might miss his pledge of halving UK inflation by the end of CY2023.
The GBP/USD pair has demonstrated a solid recovery and has scaled above 1.2460 in the Tokyo session. The Cable has recovered sharply amid a decline in the US Dollar Index (DXY) as the market mood is turning cheerful.
S&P500 futures have recovered the majority of losses generated in Asia despite investors keeping caution amid delay in United States debt-ceiling issues. Investors are worried that a default in augmenting obligated payments by the US Treasury will dampen its long-term outlook, millions of jobs, and overall production.
The USD Index has refreshed its five-week high at 102.75 despite the Federal Reserve (Fed) being expected to pause its interest rate-hiking spell ahead. Due to US inflation and Producer Price Index (PPI) softening and easing labor market conditions, Fed chair Jerome Powell has a reason to shift focus to the US economic outlook in order to avoid further calamity as investors are already scared of US banking jitters.
Tight credit conditions by the US regional banks have triggered problems for small firms as they are struggling to raise funds for operational activities. This has critically impacted tight US labor market conditions.
On the United Kingdom front, higher interest rates from the Bank of England (BoE) are failing to soften inflationary pressures. BoE policymakers have admitted that they made the mistake of underestimating the strength of persistence in inflationary pressures. The UK inflation is expected to reach the 2% inflation target not before early 2025. However, UK Prime Minister Rishi Sunak might miss his pledge of halving UK inflation by the end of CY2023.
- AUD/USD picks up bids to recover from fortnight-old horizontal support to snap two-day downtrend.
- Short-term resistance line, 200-HMA prod immediate upside even as RSI rebound, bullish MACD signal favor intraday Aussie buyers.
- One-week-long horizontal region act as the last defense of Aussie pair sellers.
AUD/USD refreshes intraday high near 0.6665 as it bounces off short-term key support to print the first daily gains in three amid early Monday. In doing so, the Aussie pair also justifies the RSI (14) line’s rebound from the oversold territory.
It’s worth noting, that the bullish MACD signals also favor the AUD/USD pair’s U-turn from a two-week-old horizontal support zone surrounding 0.6640.
However, the 61.8% Fibonacci retracement level of the pair’s run-up from April 28 to May 10, close to 0.6670, precedes a downward-sloping resistance line from May 10, near 0.6680 at the latest, to restrict short-term AUD/USD rebound.
Even if the AUD/USD pair rises past 0.6680, the 200-HMA and a horizontal area comprising multiple levels marked since May 05, close to 0.6750, can challenge the buyers before giving them control.
Alternatively, a downside break of the aforementioned horizontal support near 0.6640 won’t hesitate to challenge the late April swing low of around 0.6575.
Following that, the yearly low marked in March around 0.6565 may act as an extra filter towards the south.
Overall, the AUD/USD pair is likely to keep the latest recovery but the upside room appears limited.
AUD/USD: Hourly chart
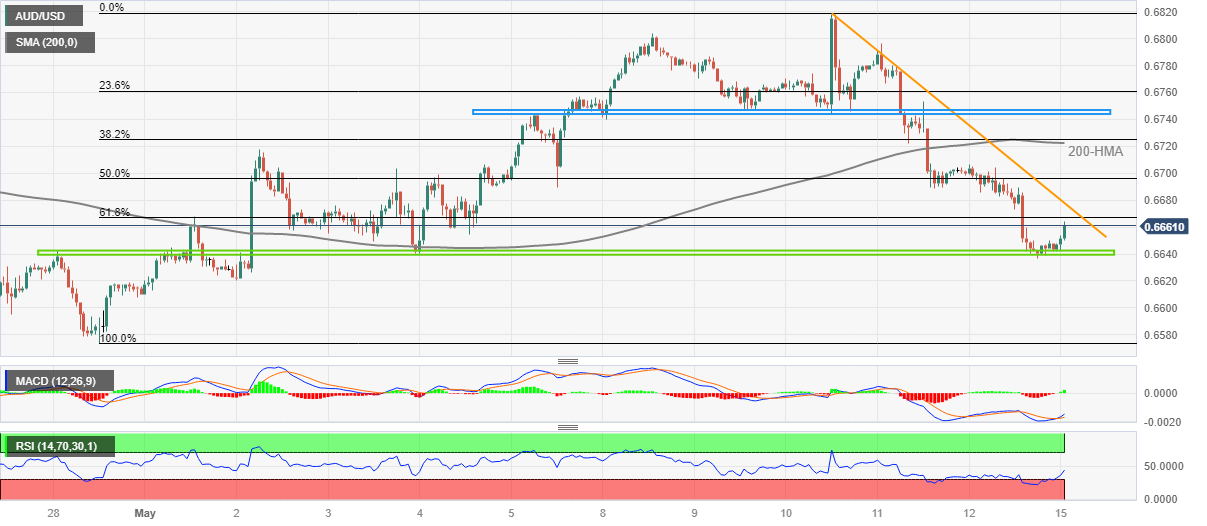
Trend: Limited recovery expected
After announcing the USD/CNY fix, the Chinese central bank, namely the People's Bank of China (PBOC) also performed its monthly duty of announcing the Medium-term Lending Facility (MLF) rates. That said, the PBOC's MLF for one-year left unchanged at 2.75%, per the latest update.
Also read: PBOC sets USD/CNY reference rate at 6.9654 vs. 6.9481 previous
USD/CNY grinds higher
Following the PBOC announcements, USD/CNY renews a two-month high at 6.9583 while extending the six-day uptrend by the press time.
About PBOC MLF rate
The PBOC's Medium-term Lending Facility (MLF) rate is a benchmark interest rate that is typically higher than the benchmark lending rate and one that banks in China can use to borrow funds from the central bank for a period of 6 months to 1 year. Markets often gauge from the MLF decision as to what changes may or may not be made to the monthly Loan Prime Rate (LPR) later in the month.
People’s Bank of China (PBOC) set the USD/CNY central rate at 6.9654 on Monday, versus previous fix of 6.9481 and market expectations of 6.9658. It's worth noting that the USD/CNY closed near 6.9585 the previous day.
With this, the PBOC announced the lowest USD/CNY rates since March 10.
Apart from the daily fix, the PBOC also unveils the numbers for its Open Market Operations (OMO), which in turn suggests that the Chinese central bank injects 2.0 billion Yuan via 7-day reverses repo at 2.0% rate as wel las 125 billion via one-year Medium-term Lending Facility (MLF) rate of 2.75%.
About PBOC fix
China maintains strict control of the yuan’s rate on the mainland.
The onshore yuan (CNY) differs from the offshore one (CNH) in trading restrictions, this last one is not as tightly controlled.
Each morning, the People’s Bank of China (PBOC) sets a so-called daily midpoint fix, based on the yuan’s previous day's closing level and quotations taken from the inter-bank dealer.
“Turkey appeared headed for a runoff presidential election after neither Tayyip Erdogan nor rival Kemal Kilicdaroglu cleared the threshold to win outright on Sunday,” said Reuters after almost all of the Turkish votes counted on early Monday.
The news, however, adds, “Though Erdogan performed better than expected in his battle to extend his 20-year rule.”
“With more than 96% of ballot boxes counted, Erdogan led with 49.44% of votes and Kilicdaroglu had 44.86%, according to state-owned news agency Anadolu,” mentioned Reuters.
The news also mentioned that Turks also voted for a new parliament. The People's Alliance comprising Erdogan's Islamist-rooted AKP and the nationalist MHP and others appeared to have fared better than expected and be headed for a majority.”
That said, a Presidential Vote on May 28 will be crucial to overcoming the latest fears of witnessing a political deadlock.
USD/TRY bulls keep eyes on 20.00
The news keeps USD/TRY on the front foot around 19.55, which in turn challenges the all-time high marked the previous day around 19.65 and suggests a run-up towards the 20.00 round figure.
- Gold price remains pressured towards short-term key support after snapping two-week winning streak.
- Risks emanating from the United States debt ceiling expiry, banking woes underpin US Dollar rebound and weigh on XAU/USD price.
- Gold price fails to cheer softer US inflation clues Federal Reserve bets suggesting policy pivot.
- US Retail Sales, Fed Chair Powell’s speech and debt ceiling drama will be crucial to watch for XAU/USD direction.
Gold price remains depressed around $2,010 as it seeks fresh clues to extend the three-week downtrend, especially after posting the first weekly loss in three. In doing so, the yellow metal portrays the market’s anxiety amid the United States debt ceiling jitters, as well as the banking fears. However, a light calendar and mixed updates from the Federal Reserve (Fed), as well as the US government officials, prod the XAU/USD bears ahead of this week’s key data/events.
Gold price drop on United States debt ceiling drama, banking woes
Gold price bears the burden of concerns that the US may default in early June if the debt ceiling isn’t altered soon. The same seems to weigh on the market sentiment and underpin the US Dollar’s run-up. On the same line were fears emanating from the US banks as some of the mid-tier ones posted heavy drawdowns in share prices and deposits in the last week.
Further, hawkish comments from the Federal Reserve (Fed) officials also weigh on the XAU/USD. That said, Fed Governor Philip Jefferson and St. Louis Fed President James Bullard defend the US central bank’s current monetary policy while citing higher inflation as a major challenge. On the same line, Federal Reserve (Fed) Governor Michelle Bowman said Friday, “policy rate will need to remain sufficiently restrictive for some time.”
Recently, US President Joe Biden signaled that Friday’s delayed talks will be held on Tuesday. The same joins comments from US Treasury Secretary Wally Adeyemo who termed the debt-ceiling negotiations between the White House as "constructive," to challenge the market pessimists and the US Dollar buyers. As a result, the Gold price remains depressed but the bears take a breather of late.
Softer US data fails to impress XAU/USD buyers
While the aforementioned catalysts weigh on the Gold price, the softer US inflation clues and downbeat data from other fronts fail to defend the XAU/USD price. On Friday, preliminary readings of the University of Michigan's (UoM) Consumer Confidence Index for May dropped to 57.7 from 63.5 prior versus 63.0 market forecasts. More interestingly, the one-year inflation expectations dropped from 4.6% to 4.5% for the said month but 5-year counterpart rose to the highest reading since 2011, from 3.0% to 3.2%.
Risk catalysts are the key for clear Gold price directions
Looking ahead, Tuesday’s US debt ceiling talks will be the key for the Gold traders to watch for immediate directions. Following that, US Retail Sales and a speech from Fed Chairman Jerome Powell should be eyed closely.
Should the US policymakers fail to extend the debt ceiling, the Gold price may have a further downside to trace. Further, upbeat US data and hawkish comments from Fed’s Powell can also help the XAU/USD bears.
Gold price technical analysis
Gold price portrays a bearish triangle formation on the Daily chart, currently between $2,050 and $1,990. That said, the bearish signals from the Moving Average Convergence and Divergence (MACD) indicator, as well as the steady Relative Strength Index (RSI) line, placed at 14, also suggest further downside of the XAU/USD.
However, a clear break of the $1,990 support becomes necessary for the Gold price to aim for the theoretical target of around $1,875.
It’s worth noting, that the 21-DMA, near $2,007 by the press time, acts as an immediate support for the Gold price whereas the 50-DMA surrounding $1,972 and the $1,900 round figure may act as an intermediate halt for the XAU/USD between $1,990 and $1,875.
Alternatively, a daily closing beyond the $2,050 will defy the bearish triangle formation on the Gold price, a break of which could quickly propel the XAU/USD towards the previous yearly high of around $2,070 and then to the latest record-high of near $2,080.
Following that, the $2,100 round figure may act as an extra check for the Gold buyers.
Gold price: Daily chart
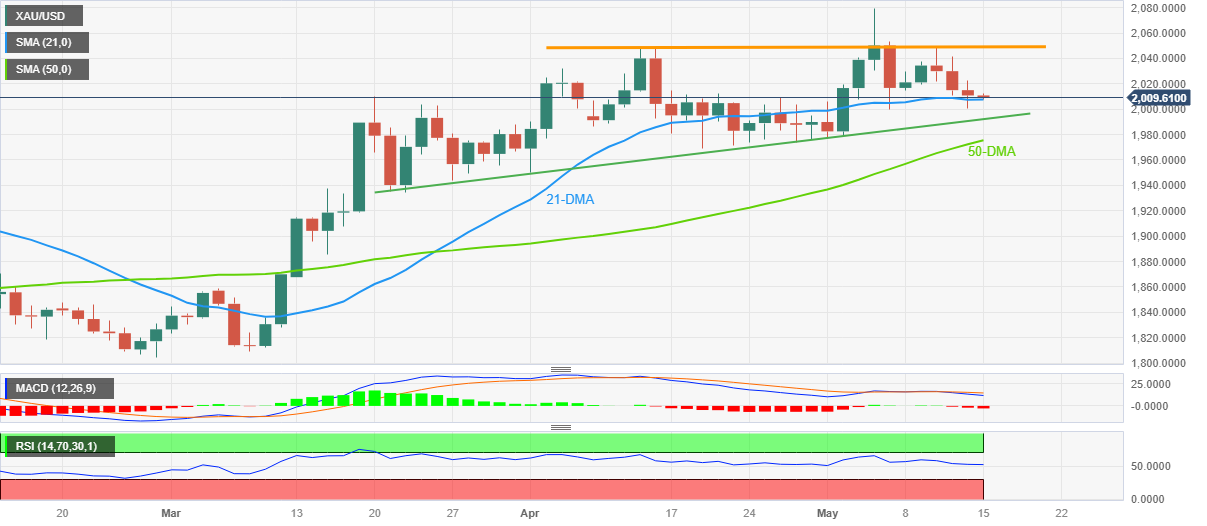
Trend: Further downside expected
- Oil price is expected to find acceptance below $70.00 as US debt-ceiling issues are escalating.
- The US Treasury will be out of funds for making obligated payments on the failure of raising the US debt ceiling.
- A recovery move by the oil price to near $71.75 has retreated as support became resistance for the oil bulls.
West Texas Intermediate (WTI), futures on NYMEX, are showing quite a sideways performance around $70.00 in the Asian session. The oil price is continuously facing selling pressure as a delay in negotiations over the United States borrowing cap limit has deepened fears of a recession in the economy.
The street is worried as if the White House and top Republican leaders fail to reach a decisive action, the US Treasury will be out of funds for making obligated payments on the failure of increasing US debt-ceiling, which will result in a huge loss of production scale and millions of jobs.
Meanwhile, oil prices have failed to capitalize on rising odds of a pause in the policy-tightening spell by the Federal Reserve (Fed). The US Dollar Index (DXY) has refreshed its monthly high above 102.73.
Oil prices witnessed a sell-off after a breakdown of the Ascending Triangle chart pattern formed on an hourly scale. A recovery move by the oil price to near $71.75 has retreated as support became resistance for the oil bulls.
The 50-period Exponential Moving Average (EMA) at $71.13 is acting as a barricade for the oil bulls.
Meanwhile, the Relative Strength Index (RSI) (14) is oscillating in the bearish range of 20.00-40.00, signaling more weakness ahead.
A further breakdown below May 12 low at $69.94 will expose the asset to May 03 low at $97.92. A slippage below the latter will expose the asset to May 04 low at $63.60.
On the flip side, a solid recovery above May 10 high at $73.80 will allow the asset for further upside towards May 02 high at $76.06. A breach of the latter will expose the asset to April 26 high around $78.00.
WTI hourly chart
-638197084253907840.png)
- EUR/USD bears keep the reins at the lowest levels in five weeks.
- Clear downside break of 50-DMA, multi-day-old ascending trend line favors Euro bears.
- Mixed oscillators suggest limited downside room and highlight 100-DMA as the key support.
- Recovery remains elusive below 1.0950, rising trend line from early February appears the key upside hurdle.
EUR/USD holds lower ground near 1.0850 as bears take a breather after refreshing the monthly low during early Monday.
Even so, the Euro pair sellers remain hopeful as the quote keeps Friday’s downside break of an upward-sloping support line from late September 2022, as well as the 50-DMA. Adding strength to the downside bias are the bearish MACD signals.
However, the RSI (14) line trades below the 50 level and hence suggest bottom-picking, which in turn can help the EUR/USD price to rebound from the 100-DMA support of around 1.0800.
Also acting as short-term key support is an area comprising the highs marked during the mid-March around 1.0760-50.
In a case where the EUR/USD price remains bearish past 1.0750, the odds of witnessing a gradual south-run towards the yearly low of near 1.0480 and then to the 200-DMA support of around 1.0455 can’t be ruled out.
On the flip side, the support-turned-resistance line and the 50-DMA, around 1.0865-75 by the press time, guard immediate recovery of the EUR/USD pair.
Following that, the 1.0950 and the 1.1000 round figure can entertain the EUR/USD bulls before directing them to an upward-sloping resistance line from February 2023, close to 1.1110 by the press time.
Overall, EUR/USD remains on the bear’s radar despite the latest inaction.
EUR/USD: Daily chart

Trend: Limited downside expected
| Index | Change, points | Closed | Change, % |
|---|---|---|---|
| NIKKEI 225 | 261.58 | 29388.3 | 0.9 |
| Hang Seng | -116.55 | 19627.24 | -0.59 |
| KOSPI | -15.58 | 2475.42 | -0.63 |
| ASX 200 | 4.8 | 7256.7 | 0.07 |
| FTSE 100 | 24 | 7754.6 | 0.31 |
| DAX | 78.91 | 15913.82 | 0.5 |
| CAC 40 | 33.07 | 7414.85 | 0.45 |
| Dow Jones | -8.89 | 33300.62 | -0.03 |
| S&P 500 | -6.54 | 4124.08 | -0.16 |
| NASDAQ Composite | -43.77 | 12284.74 | -0.36 |
- USD/JPY seesaws near the highest level in a week, prints three-day uptrend.
- Yields grind higher amid US debt ceiling and banking woes, as well as hawkish Fed talks.
- BOJ’s Ueda defends easy money policy, Japan PM Kishida to oder assessment on wage outlook by government and BoJ.
- Softer Japan PPI, unimpressive US inflation signals fail to entertain Yen pair traders.
USD/JPY prints a three-day winning streak near 135.80 despite recently easing from the highest level in eight days as Tokyo opens on Monday. In doing so, the Yen pair takes clues from the broad US Dollar strength amid a risk-off mood, as well as cheers recently softer Japan data and dovish comments from Bank of Japan (BoJ) Governor Kazuo Ueda.
Recently, Japan’s Producer Price Index (PPI) for April dropped to 0.2% MoM and 5.8% YoY versus 0.3% and 6.0% expected respectively. The softer inflation data backs BoJ Governor Ueda’s comments defending the Japanese central bank’s easy money policy. “The central bank will maintain ultra-low interest rates until the recent cost-push inflation shifts into sustained price growth driven by robust domestic demand, and accompanied by higher wages,” said BoJ’s Ueda in his latest comments per Reuters.
On the other hand, Fed Governor Philip Jefferson and St. Louis Fed President James Bullard defend the US central bank’s current monetary policy while citing higher inflation as a major challenge. On the same line, Federal Reserve (Fed) Governor Michelle Bowman said Friday, “policy rate will need to remain sufficiently restrictive for some time.”
Unlike BoJ’s Ueda, The Fed policymakers’ comments fail to gain support from the US data as preliminary readings of the University of Michigan's (UoM) Consumer Confidence Index for May dropped to 57.7 from 63.5 prior versus 63.0 market forecasts. More interestingly, the one-year inflation expectations dropped from 4.6% to 4.5% for the said month but 5-year counterpart rose to the highest reading since 2011, from 3.0% to 3.2%.
Above all, concerns that the US may default in early June if the debt ceiling isn’t altered soon seem to weigh on the market sentiment and underpin the US Dollar’s run-up, fueling the USD/JPY in turn. On the same line were fears emanating from the US banks as some of the mid-tier ones posted heavy drawdowns in share prices and deposits in the last week.
It should be noted that the cautious mood ahead of Japan Prime Minister Fumio Kishida’s assessment of wages seems to prod the USD/JPY bulls. “Japanese Prime Minister Fumio Kishida will issue an order on Monday for the government and the central bank to conduct an assessment on whether recent wage hikes would be sustainable, the Nikkei newspaper reported on Sunday,” per Reuters.
Against this backdrop, Wall Street closed with losses and the US Treasury bond yields remain firmer while the S&P 500 Futures print mild losses by the press time.
Looking forward, the US NY Empire State Manufacturing Index for May and Japan PM Kishida’s orders will be eyed for immediate USD/JPY direction. More important will be the US debt ceiling updates for clear directions. Also important will be the Fed talks ahead of US Retail Sales, a speech from Fed Chairman Jerome Powell and preliminary readings of Japan’s first quarter (Q1) Gross Domestic Product (GDP).
Technical analysis
USD/JPY pair’s successful rebound from 50-DMA support of around 135.75 directs the Yen pair buyers towards the 200-DMA hurdle of near 137.30.
| Pare | Closed | Change, % |
|---|---|---|
| AUDUSD | 0.66417 | -0.88 |
| EURJPY | 147.264 | 0.27 |
| EURUSD | 1.085 | -0.61 |
| GBPJPY | 168.953 | 0.36 |
| GBPUSD | 1.24482 | -0.52 |
| NZDUSD | 0.61912 | -1.69 |
| USDCAD | 1.35559 | 0.49 |
| USDCHF | 0.89823 | 0.47 |
| USDJPY | 135.727 | 0.88 |
- USD/CHF is approaching the psychological resistance of 0.9000 amid deepening concerns over US debt-ceiling issues.
- If situation of default in obligated payments by the US Treasury comes across, its long-term credibility will get impacted dramatically.
- The restrictive monetary policy approach by the SNB is weighing effectively on inflationary pressures.
The USD/CHF pair is marching towards the psychological resistance of 0.9000 in the Asian session. The Swiss franc asset is looking to continue its two-day winning streak if it manages to overstep Friday’s high at 0.8988. The major is eyeing more gains as United States debt-ceiling issues have underpinned the risk-aversion theme.
S&P500 futures have added some losses in the Asian session after a mild bearish Friday, indicating caution among investors ahead of negotiations over US debt-ceiling issues. Investors are worried that if the situation of default in obligated payments by the US Treasury comes across, the long-term credibility of the US economy will get impacted dramatically. Also, the risks of recession will get fueled heavily.
The US Dollar Index (DXY) is showing a sideways performance around 102.70, however, the upside seems favored amid improvement as a safe-haven appeal despite chances of no further rate hikes by the Federal Reserve (Fed
Major US economic indicators are appealing to a pause in the rate-hiking spell by the Federal Reserve. US inflation and prices offered by producers for goods and services at factory gates have slowed down, and labor market conditions are softening due to tight credit conditions and a bleak economic outlook, which indicates that the Fed will halt its aggressive policy-tightening spree to shield the economy from severe damage.
On the Swiss franc front, investors are awaiting the release of the Producer and Import Prices data (April). Monthly economic data is seen contracting by 0.1% vs. expansion of 0.2%. Also, the annual data will soften to 1.1% from the former release of 2.1%. This indicates that the restrictive monetary policy approach by the Swiss National Bank (SNB) is weighing effectively on inflationary pressures.
- US Dollar Index grinds higher after refreshing the multi-day top, marked the biggest weekly gain since September 2022.
- Fears of US default, banking sector fallout weigh on market sentiment and allow DXY bulls to return.
- US Retail Sales, Fed Chair Powell’s speech will be important but debt ceiling talks are the key.
US Dollar Index (DXY) stays on the front foot at the highest level in over a month, close to 102.75 amid a three-day uptrend during Monday’s Asian session.
The greenback’s gauge versus the six major currencies marked the first weekly gain in three while also posting the biggest run-up since late 2022 despite the downbeat US inflation signals. The reason could be linked to the looming concerns that the US may default in early June if the debt ceiling isn’t altered soon. On the same line were fears emanating from the US banks as some of the mid-tier ones posted heavy drawdowns in share prices and deposits in the last week.
It is worth noting that US President Joe Biden’s hint of US debt ceiling talks on Tuesday and a Treasury Official’s optimism seems to prod the DXY bulls of late, especially amid a light calendar and early Asian hours. However, the fact that the policymakers are at loggerheads and the Federal Reserve (Fed) officials remain hawkish seems to defend the US Dollar Index bulls. Alternatively, downbeat US data and the Fed’s latest dovish hike prod the DXY optimists.
The preliminary readings of the University of Michigan's (UoM) Consumer Confidence Index for May dropped to 57.7 from 63.5 prior versus 63.0 market forecasts. More interestingly, the one-year inflation expectations dropped from 4.6% to 4.5% for the said month but 5-year counterpart rose to the highest reading since 2011, from 3.0% to 3.2%. Even so, Fed Governor Philip Jefferson and St. Louis Fed President James Bullard defend the US central bank’s current monetary policy while citing higher inflation as a major challenge. On the same line, Federal Reserve (Fed) Governor Michelle Bowman said Friday, “policy rate will need to remain sufficiently restrictive for some time.”
Amid these plays, Wall Street closed with losses and the US Treasury bond yields managed to remain firmer while the S&P 500 Futures remain pressured.
Moving on, Tuesday’s US debt ceiling talks will be the key for the DXY traders to watch for immediate directions. Following that, US Retail Sales and a speech from Fed Chairman Jerome Powell should be eyed closely.
Technical analysis
A daily closing beyond the five-week-old resistance line, now immediate support near 102.10, allows the US Dollar Index (DXY) to aim for the 100-DMA resistance of around 102.95.


© 2000-2026. All rights reserved.
This site is managed by Teletrade D.J. LLC 2351 LLC 2022 (Euro House, Richmond Hill Road, Kingstown, VC0100, St. Vincent and the Grenadines).
The information on this website is for informational purposes only and does not constitute any investment advice.
The company does not serve or provide services to customers who are residents of the US, Canada, Iran, The Democratic People's Republic of Korea, Yemen and FATF blacklisted countries.
Making transactions on financial markets with marginal financial instruments opens up wide possibilities and allows investors who are willing to take risks to earn high profits, carrying a potentially high risk of losses at the same time. Therefore you should responsibly approach the issue of choosing the appropriate investment strategy, taking the available resources into account, before starting trading.
Use of the information: full or partial use of materials from this website must always be referenced to TeleTrade as the source of information. Use of the materials on the Internet must be accompanied by a hyperlink to teletrade.org. Automatic import of materials and information from this website is prohibited.
Please contact our PR department if you have any questions or need assistance at pr@teletrade.global.
transfers