- Analytics
- News and Tools
- Market News
CFD Markets News and Forecasts — 15-07-2021
| Time | Country | Event | Period | Previous value | Forecast |
|---|---|---|---|---|---|
| 03:00 (GMT) | Japan | BoJ Interest Rate Decision | -0.1% | -0.1% | |
| 03:00 (GMT) | Japan | BOJ Outlook Report | |||
| 09:00 (GMT) | Eurozone | Trade balance unadjusted | May | 10.9 | |
| 09:00 (GMT) | Eurozone | Harmonized CPI ex EFAT, Y/Y | June | 1% | 0.9% |
| 09:00 (GMT) | Eurozone | Harmonized CPI, Y/Y | June | 2% | 1.9% |
| 09:00 (GMT) | Eurozone | Harmonized CPI | June | 0.3% | 0.3% |
| 12:15 (GMT) | Canada | Housing Starts | June | 275.9 | 270 |
| 12:30 (GMT) | Canada | Foreign Securities Purchases | May | 9.95 | |
| 12:30 (GMT) | U.S. | Retail sales | June | -1.3% | -0.4% |
| 12:30 (GMT) | U.S. | Retail Sales YoY | June | 28.1% | |
| 12:30 (GMT) | U.S. | Retail sales excluding auto | June | -0.7% | 0.4% |
| 14:00 (GMT) | U.S. | Business inventories | May | -0.2% | 0.5% |
| 14:00 (GMT) | U.S. | Reuters/Michigan Consumer Sentiment Index | July | 85.5 | 86.5 |
| 17:00 (GMT) | U.S. | Baker Hughes Oil Rig Count | July | 378 | |
| 20:00 (GMT) | U.S. | Net Long-term TIC Flows | May | 100.7 | |
| 20:00 (GMT) | U.S. | Total Net TIC Flows | May | 101.2 |
James Knightley, ING's Chief International Economist, discusses the U.S. production data for June.
"US manufacturing output fell 0.1% in June versus the +0.4% consensus with the bulk of the weakness caused by a 6.6% plunge in auto sector output. It is important to remember that the weakness is a supply-side story and not demand-driven given surging prices for both new and used vehicles in Tuesday’s CPI report."
"The lack of semi-conductor chips, which go in anything from brake sensors to satellite navigations systems, is really hampering output with chip producers warning that supplies could remain constrained well into 2022. Consequently, disappointing output and ongoing price pressures are likely to be a persisting theme."
"Elsewhere in the report, there was a 2.7% month-on-month jump in utilities output as record temperatures in many parts of the US led to increased usage of air conditioning and fans. Mining rose 1.4% as rising commodity prices stimulated activity. Putting it altogether industrial output rose 0.4% versus expectations of 0.6% MoM growth."
"This combination of strong order books and low customer inventories mean that there is a growing sense of rising corporate pricing. With so many companies experiencing supply chain issues and higher costs, be it for components, energy, raw materials or workers, this means companies are increasingly able to pass them onto customers – as highlighted by today’s Philly Fed and NY Empire manufacturing surveys. This is another reason to believe that inflation could remain more elevated for longer than the Federal Reserve believes likely."
- We don't know where labor force participation will settle
- It will take a number of years to figure out labor force participation
- Many people retired during the pandemic
- Would be prepared to deploy counter-cyclical capital buffer if needed
- Financial institutions remain well-capitalized
- Says he doesn't think there is big difference between Treasury and mortgage-backed securities (MBS) purchases
- Housing prices are going up by 15% because of many factors including monetary policy
- Inflation is not tied to usual factors like a tight labor market or tight economy
- This is a shock to the system associated with reopening
- This particular type of inflation is unique in history
- Fed will continue to evaluate the risks that affect inflation
- Policy will be accommodative for quite a while
- We would want broad support in society and congress before creating central bank digital currency (CBDC)
- Our obligation is to explore both the technology and policy issues to make informed recommendation on CBDС
The
report from the New York Federal Reserve showed on Thursday that manufacturing
activity in the New York region grew at a record-setting pace in early July.
According
to the survey, NY Fed Empire State manufacturing index jumped from 17.4 in June
to 43.0 in July, pointing to a continuation of solid business activity growth
in the region. This was the highest reading on record.
Economists
had expected the index to come in at 18.0.
Anything
below zero signals contraction.
According
to the report, the new orders index surged 16.9 points to 33.2, and the
shipments index climbed 29.6 points to 43.8, pointing to a rapid expansion in
orders and shipments. Meanwhile, the delivery times index dropped 9.6 points to
20.2, indicating that significantly longer delivery times are an ongoing issue.
Elsewhere, the employment index went up 8.3 points to 20.6, indicating an ongoing rise
in employment. On the price front, both price indexes were at/near record
highs, indicating that price gains remain significant: the prices paid index slipped
3.0 points to 76.8, while the prices received index advanced 6.1 points to
39.4, its new record.
eFXdata reports that analysts at Citi discuss USD/JPY technical outlook.
"CitiFX Technicals flags that the pair completed a bearish outside day while also closing back below a strong horizontal support at 110.42 and is headed lower to test the 55 day MA at 109.83."
"There is a notable weekly momentum divergence at the highs, so our base case is for USDJPY to see further losses at least towards the June 2021 low at 109.19 or even lower towards a significant support at 108.34."
The
Federal Reserve reported on Thursday the U.S. industrial production rose 0.4
percent m-o-m in June, following a revised 0.7 percent m-o-m advance in May
(originally a 0.8 percent m-o-m increase).
Economists
had forecast industrial production would increase 0.6 percent m-o-m in June.
According
to the report, the manufacturing output edged down 0.1 percent m-o-m, mainly due
to a 6.6 percent m-o-m plunge in the production of motor vehicles and parts amid an ongoing
shortage of semiconductors. Excluding motor vehicles and parts, factory output was
up 0.4 percent m-o-m in June. At the same time, the mining production increased
1.4 percent m-o-m, while the output of utilities surged 2.7 percent m-o-m, reflecting
heightened demand for air conditioning, as much of the country experienced a
heatwave in June.
Capacity
utilization for the industrial sector increased 0.3 percentage point m-o-m to 75.4
percent in June. That was 0.2 percentage points below economists’ forecast and 4.2
percentage points below its long-run (1972-2020) average.
In y-o-y terms, the industrial output surged 9.8
percent in June, following a revised 16.1 percent surge in the prior month
(originally a 16.3 percent climb) but it was 1.2 percent below its pre-pandemic level.
U.S. stock-index futures fell on Thursday, as investors assessed a raft of economic data and earnings reports, awaiting the Federal Reserve Chairman Jerome Powell’s testimony before the Senate Banking Committee (due at 13:30 GMT).
Global Stocks:
Index/commodity | Last | Today's Change, points | Today's Change, % |
Nikkei | 28,279.09 | -329.40 | -1.15% |
Hang Seng | 27,996.27 | +208.81 | +0.75% |
Shanghai | 3,564.59 | +36.09 | +1.02% |
S&P/ASX | 7,335.90 | -18.80 | -0.26% |
FTSE | 7,035.82 | -55.37 | -0.78% |
CAC | 6,498.52 | -59.86 | -0.91% |
DAX | 15,633.48 | -155.50 | -0.98% |
Crude oil | $72.18 | -1.30% | |
Gold | $1,824.10 | -0.05% |
(company / ticker / price / change ($/%) / volume)
3M Co | MMM | 201.77 | -1.06(-0.52%) | 545 |
ALCOA INC. | AA | 35.28 | 0.14(0.40%) | 65937 |
ALTRIA GROUP INC. | MO | 47.43 | -0.13(-0.27%) | 4496 |
Amazon.com Inc., NASDAQ | AMZN | 3,690.28 | 8.60(0.23%) | 24222 |
American Express Co | AXP | 171.75 | -0.77(-0.45%) | 7071 |
AMERICAN INTERNATIONAL GROUP | AIG | 48.9 | 2.49(5.37%) | 120527 |
Apple Inc. | AAPL | 149.38 | 0.23(0.15%) | 1292578 |
AT&T Inc | T | 28.22 | -0.04(-0.14%) | 38190 |
Boeing Co | BA | 223.2 | -1.25(-0.56%) | 86033 |
Caterpillar Inc | CAT | 210.77 | -0.87(-0.41%) | 10292 |
Chevron Corp | CVX | 101.29 | -0.68(-0.67%) | 33230 |
Cisco Systems Inc | CSCO | 53.93 | -0.16(-0.30%) | 10603 |
Citigroup Inc., NYSE | C | 67.67 | -0.50(-0.73%) | 56901 |
Deere & Company, NYSE | DE | 343.09 | -2.48(-0.72%) | 490 |
Exxon Mobil Corp | XOM | 59 | -0.53(-0.89%) | 83780 |
Facebook, Inc. | FB | 348.63 | 1.00(0.29%) | 73039 |
FedEx Corporation, NYSE | FDX | 294 | -1.86(-0.63%) | 1958 |
Ford Motor Co. | F | 14.17 | -0.08(-0.56%) | 387084 |
Freeport-McMoRan Copper & Gold Inc., NYSE | FCX | 34.3 | -0.22(-0.64%) | 185671 |
General Electric Co | GE | 12.69 | -0.12(-0.94%) | 424894 |
General Motors Company, NYSE | GM | 57.43 | -0.57(-0.98%) | 129120 |
Goldman Sachs | GS | 371.63 | -2.77(-0.74%) | 8710 |
Hewlett-Packard Co. | HPQ | 28.42 | -0.17(-0.59%) | 2892 |
Home Depot Inc | HD | 318 | -1.22(-0.38%) | 2183 |
HONEYWELL INTERNATIONAL INC. | HON | 230.27 | 2.50(1.10%) | 14925 |
Intel Corp | INTC | 56.14 | -0.38(-0.67%) | 114230 |
International Business Machines Co... | IBM | 139.75 | -0.07(-0.05%) | 2348 |
Johnson & Johnson | JNJ | 169.4 | -1.02(-0.60%) | 4027 |
JPMorgan Chase and Co | JPM | 153.8 | -1.32(-0.85%) | 19472 |
McDonald's Corp | MCD | 236.53 | -0.60(-0.25%) | 400745 |
Merck & Co Inc | MRK | 77.43 | -0.19(-0.24%) | 3057 |
Microsoft Corp | MSFT | 282.4 | -0.11(-0.04%) | 124089 |
Nike | NKE | 161 | -0.54(-0.33%) | 133089 |
Pfizer Inc | PFE | 39.92 | -0.03(-0.08%) | 42107 |
Procter & Gamble Co | PG | 137.73 | -0.25(-0.18%) | 434249 |
Starbucks Corporation, NASDAQ | SBUX | 119.3 | -0.50(-0.42%) | 4560 |
Tesla Motors, Inc., NASDAQ | TSLA | 657 | 3.62(0.55%) | 223845 |
The Coca-Cola Co | KO | 56.11 | -0.15(-0.27%) | 829365 |
Travelers Companies Inc | TRV | 153.02 | -1.51(-0.98%) | 947 |
Twitter, Inc., NYSE | TWTR | 70.15 | -0.12(-0.17%) | 35377 |
UnitedHealth Group Inc | UNH | 413 | -1.74(-0.42%) | 296941 |
Verizon Communications Inc | VZ | 56.19 | -0.13(-0.23%) | 25739 |
Visa | V | 246.39 | 0.40(0.16%) | 16398 |
Wal-Mart Stores Inc | WMT | 141.31 | -0.24(-0.17%) | 21160 |
Walt Disney Co | DIS | 182.52 | -0.90(-0.49%) | 23256 |
Yandex N.V., NASDAQ | YNDX | 70.12 | 0.32(0.46%) | 3334 |
The Labor Department reported on Thursday the import-price index, measuring the cost of goods ranging from Canadian oil to Chinese electronics, rose 1.0 percent m-o-m in June, following a revised 1.4 percent m-o-m increase in May (originally a 1.1 percent m-o-m gain). Prices for U.S. imports have not recorded a decline since October 2020. Economists had expected prices to grow 1.2 percent m-o-m last month.
According to the report, the June gain was driven by higher prices for both fuel (+4.7 percent m-o-m) and nonfuel (+0.7 percent m-o-m) imports.
Over the 12-month period ended in June, import prices jumped 11.2 percent, with higher fuel (+85.1 percent) and nonfuel (+6.5 percent; the largest 12-month gain since August 2008) prices contributing to the jump.
Meanwhile, the price index for U.S. exports rose 1.2 percent m-o-m in June, following a revised 2.2 percent m-o-m climb in the previous month (originally a 2.2 percent m-o-m surge). U.S. export prices have not recorded a monthly decrease since April 2020. Economists had forecast export prices to rise 1.2 percent m-o-m in May.
The June gain was driven by higher prices for both agricultural exports (+1.5 percent m-o-m) and nonagricultural exports (+1.1 percent m-o-m).
Over the past 12 months, the price index for exports jumped 16.8 percent, reflecting surges in prices of both agricultural exports (+33.5 percent) and nonagricultural exports (+15.0 percent).
The
data from the Labor Department showed on Thursday the number of applications
for unemployment decreased in line with expectations last week, hitting its
fresh pandemic-era low.
According
to the report, the initial claims for unemployment benefits fell by 26,000 to 360,000
for the week ended July 10. This was the lowest reading since March 2020,
when the COVID-19 pandemic struck.
Economists
had expected 360,000 new claims last week.
Claims for the prior week
were revised upwardly to 386,000 from the initial estimate of 373,000.
Meanwhile,
the four-week moving average of jobless claims declined to 382,500 from an
upwardly unrevised 397,000 in the previous week.
As
for continuing claims, they dropped to 3,241,000 from an upwardly revised 3,367,000
in the previous week. This was the lowest level since March 2020.
- There are many parameters around any tapering decision
- We're in a situation where we can taper, should keep options open
- It's time to end these emergency measures
- We've made a lot of progress in the labor market
- It's clear some of the higher inflation is temporary
- Some of the gain in inflation could hang into 2022
FXStreet reports that in the opinion of FX Strategists at UOB Group, USD/JPY could slip back to the mid-109.00s in the next weeks.
24-hour view: “USD subsequently rose to 110.69 before staging a surprisingly sharp drop to 109.92. The rapid decline has room to extend lower but oversold conditions suggest that the major support at 109.50 is out of reach (there is another support at 109.70). Resistance is at 110.10 followed by 110.30.”
Next 1-3 weeks: “Our latest narrative was from yesterday (14 Jul, spot at 110.55) where we indicated that USD ‘is likely to trade between 110.00 and 111.15 for a period of time’. We did not anticipate the volatile price actions as USD dropped quickly below 110.00. Shorter-term downward momentum is beginning to improve and USD is likely to trade with a downward bias towards 109.50. At this stage, the odds for a sustained decline below this level are not high. The current mild downward pressure is deemed intact as long the ‘strong resistance’ at 110.55 is not breached.”
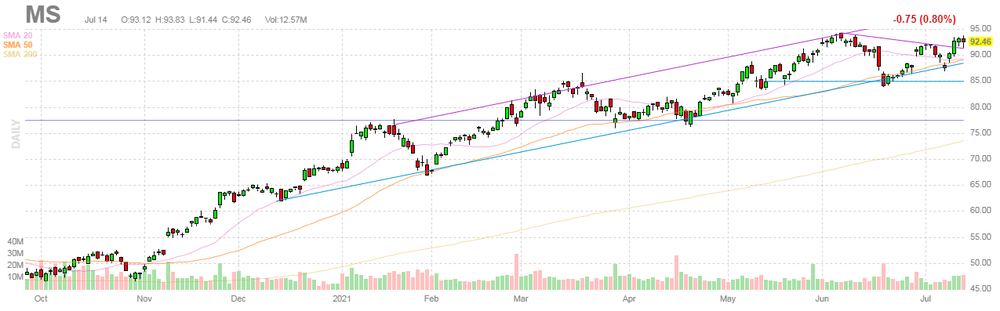
Morgan Stanley (MS) reported Q2 FY 2021 earnings of $1.85 per share (versus $1.96 per share in Q2 FY 2020), beating analysts’ consensus estimate of $1.66 per share.
The company’s quarterly revenues amounted to $14.759 bln (+10.0% y/y), beating analysts’ consensus estimate of $13.994 bln.
MS fell to $91.10 (-1.47%) in pre-market trading.
FXStreet notes that after years of trading in a narrow range around $1,200 an ounce, gold has been trading above $1,700 for the past year. While the yellow metal is not a strategic asset class, there are tactical reasons to consider adding it now. The Morgan Stanley analyst team lays out three ways to go about it.
"Physical gold. Investors may pay a premium over the spot price of gold. The gold is physically held by a third party, not Morgan Stanley. Storage fees usually apply. Investors can also take delivery of physical gold if they want to store it themselves. In such cases, delivery fees would apply.”
"Gold funds that own the metal. Some mutual funds and exchange-traded funds also offer investors exposure to gold. For those that are pure-play, their value tracks the price of gold. The fund shoulders the cost of holding physical supply and passes it along to the investors in the expense ratio. There are some drawbacks: Some gold funds are taxed as collectibles, so they don’t benefit from the lower long-term capital-gains rates for which stocks may qualify.”
"Mining companies. Investors can get exposure through equity in companies that mine for gold, including the purchase of individual stocks or as part of a fund.”
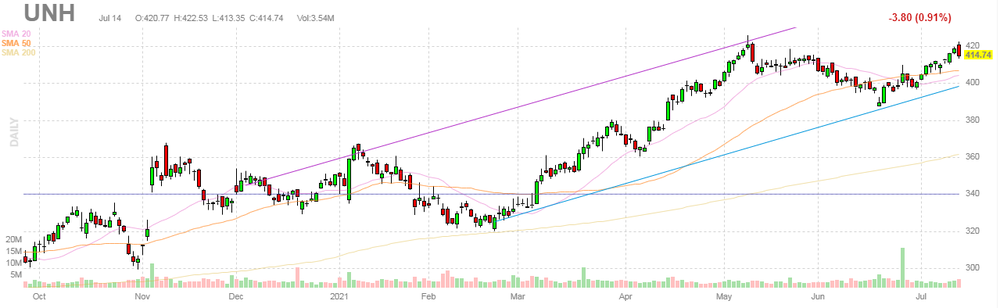
UnitedHealth (UNH) reported Q2 FY 2021 earnings of $4.70 per share (versus $7.12 per share in Q2 FY 2020), beating analysts’ consensus estimate of $4.45 per share.
The company’s quarterly revenues amounted to $71.321 bln (+14.8% y/y), beating analysts’ consensus estimate of $69.513 bln.
UNH fell to $413.50 (-0.30%) in pre-market trading.
FXStreet reports that the Credit Suisse analyst team notes that USD/JPY has completed a bearish “reversal day” from flagged resistance at 110.72/82. A close below the 55-day average at 109.82 would warn of a more protracted corrective phase.
“USDJPY has not only rejected key resistance from the back of the broken uptrend from January as well as price and retracement resistance at 110.72/82 but has completed a bearish “reversal day” in the process. This has seen the risk turn quickly lower again for a retest of key support from the 55-day average at 109.82.”
“A close below the 55-day average at 109.82 can open the door to a more protracted corrective phase lower with support then seen next at the recent low at 109.53.”
“Resistance moves to 110.20 initially, then 110.54.”
| Time | Country | Event | Period | Previous value | Forecast | Actual |
|---|---|---|---|---|---|---|
| 06:00 | United Kingdom | Average earnings ex bonuses, 3 m/y | May | 5.6% | 6.6% | 6.6% |
| 06:00 | United Kingdom | Average Earnings, 3m/y | May | 5.6% | 7.1% | 7.3% |
| 06:00 | United Kingdom | Claimant count | June | -92.6 | -114.8 | |
| 06:00 | United Kingdom | ILO Unemployment Rate | May | 4.7% | 4.7% | 4.8% |
| 10:00 | United Kingdom | MPC Member Saunders Speaks |
GBP traded mixed against its major rivals in the European session on Thursday, as investors digested hawkish comments by the BoE’s MPC member Michael Saunders.
Saunders said that it might become appropriate fairly soon to withdraw some stimulus. He also noted that options to withdraw stimulus include curtailing the BoE’s quantitative easing (QE) program (stopping it in the next month or two) and/or further policy action (rate hike) next year. The official also added that the question of whether to curtail the BoE’s current asset purchase program early would be considered at the central bank’s forthcoming meetings.
Saunders’ hawkish remarks outweighed uncertainty over the impending end to the UK’s remaining COVID-19 restrictions, set to be removed on July 19, as coronavirus infection rates climbed. This uncertainty weighed on GBP earlier today.
The pound also got some help from today’s ONS labour market report, which showed that the number of payroll employees in the UK climbed by 356,000 jobs in June and the average weekly earnings (including bonuses) surged 7.3% y/y in the three months March to May, recording their biggest increase since series began in 2001.
FXStreet reports that offering some consolation to the market’s fears over tighter oil supplies, analysts at Goldman Sachs noted that an oil supply agreement between Saudi Arabia and the United Arab Emirates to be a bullish catalyst for prices over the coming months.
"Such an agreement would help bridge the (modest) divide between both countries and help remove the (low probability) OPEC+ tail risks of a potential price war or insufficient production growth."
"We believe that risks to our bullish oil price forecasts are skewed to the upside, with the catalyst for such a move higher shifting from the demand to the supply side."
"Expect $2 to $4 per barrel upside risk to its $80 per barrel summer forecast and $75 per barrel for its 2022 Brent price forecast."
- Activity seems to have recovered a bit faster than May forecast
- Risks lie on the side that output gap will close earlier than previously expected
- It may become appropriate fairly soon to withdraw some stimulus
- Options to withdraw stimulus include curtailing QE (ending it in the next month or two) and/or further policy action next year
- If bank rate does rise in the next year or so, it is likely that any rise would be relatively limited
FXStreet reports that UOB Group’s FX Strategists noted that USD/CNH could re-visit 6.4300 on a close below 6.4500 in the near term.
Next 1-3 weeks: “We have held the same view since Monday, where USD is likely to trade within a 6.4600/6.5000 range for a period of time. After trading in a quiet manner for a couple of days, USD lurched lower yesterday (14 Jul) and plummeted to 6.4508. Downward momentum is beginning to build and a daily closing below 6.4500 would indicate that USD could head lower towards 6.4300. On the upside, a break of 6.4850 (‘strong resistance’ level) would indicate that the downside risk has dissipated.”
FXStreet reports that economists at Westpac discuss US Dollar Index prospects.
“Chair Powell’s testimony tripped up the DXY with the message that achieving substantial progress and a withdrawal of support are both still a way off. But that doesn’t alter the picture of an economy that is more convincingly finding its feet. With a more secure ‘post-covid’ growth path unfolding, Covid-related job losses should be recouped in a more consistent fashion going forward.”
“The puzzling fall in US yields complicates the constructive USD outlook, but it’s mostly a curve flattening story and a recalibration of inflation expectations following the Fed’s hawkish pivot. In any case, the ECB is reinterpreting its price stability mandate and shifting to a structurally more dovish policy stance.”
“Chair Powell’s more cautious message likely injects some two-way risk into DXY near-term but a test of the March 2021 93.45 highs remains more likely than not as taper talk rises to a crescendo in Q3.”
Reuters reports that according to data published by the Office for National Statistics, consumer spending on credit and debit cards in Britain fell in June from May for the first month-on-month decline since January.
Aggregate credit and debit card spending, based on data from payment processors provided by the Bank of England, fell by 4 percentage points compared with May 2021, dropping to 95% of its February 2020 average level.
FXStreet reports that economists at ING think the BoC will end asset purchases by the end of 2021, allowing markets to speculate on an earlier than projected hike, and providing more support to the loonie.
“Our view remains that considering the resilience of the Canadian economy, high vaccination rates, concerns about a booming housing market and government bonds that have dropped quite sharply since mid-May, the BoC remains well on track to end its QE programme by the end of the year. We are pencilling in the first rate hike in 2H22, but the risks are increasingly skewed towards an earlier move.”
“We think the market will remain attracted by CAD’s set of fundamentals: a) one of the most hawkish central banks in the developed space; b) a strong economic recovery and the highest share (70%) of people with at least one vaccine dose among major economies; and c) resilient oil prices even after the turbulent OPEC+ meeting. We think that if our expectations that the BoC will end its asset-purchase programme by year-end proves correct, markets will be inclined to price in an earlier start of the hiking cycle in Canada. We remain of the view that USD/CAD will trade below 1.20 by the end of 2021.”
According to the report from the Istat, in June 2021 the rate of change of Italian consumer price index for the whole nation (Nic) was +0.1% on monthly basis and +1.3% on annual basis (the same as the previous month), confirming the flash estimate.
The stable growth on annual basis of all-item index was still mainly due to the prices of both regulated energy products (that slightly sped up from +16.8% to +16.9%) and non-regulated ones (from 12.6% to 12.8%). Moreover, prices of processed food, including alcohol, reduced their decrease (from -1.1% to -0.4%) and those of services related to recreation, including repair and personal care went from null to +1.0%: these dynamics were offset by prices of unprocessed food (from -0.4% to -1.1%) and of services related to transport (from -0.2% to -1.4%).
Both core inflation (excluding energy and unprocessed food) and inflation excluding energy were +0.3% (up from +0.2% in the previous month).
In June 2021 the rate of change of the Italian harmonized index of consumer prices (Hicp) was +0.2% on monthly basis and +1.3% on annual basis (from +1.2% in May), confirming the flash estimate.
In the second quarter of 2021, inflation measured by Hicp was equal to +1.5% for the households with less purchasing power and was equal to +0.9% for those with greater spending power. As a consequence, the inflationary gap between the two groups was equal to +0.6 percentage points.
Business Live reports that Bank of England Governor Andrew Bailey says he won’t be rushed into making decisions on raising interest rates despite this week’s news of rising inflation.
Yesterday saw news that the UK’s inflation rate last month soared to its highest for almost three years.
The Office for National Statistics (ONS) said the Consumer Prices Index rose to 2.5% in June from 2.1% the previous month - rising further away from the Bank of England’s 2% target. The ONS said price rises were widespread, including increases in the cost of food, and in the second-hand market where there was rising demand.
Mr Bailey denied the bank was being “casual” about inflation, saying the Bank was watching the economy closely as it starts a tentative post-Covid recovery before making any decisions on interest rates.
Asked about inflation rates and when the bank would look at raising rates to counter their effects, Mr Bailey said the Monetary Policy Committee (MPC) would take its time to understand the UK’s post-Covid recovery.
CNBC reports that according to Barclays, with Covid-19 cases on the rise and a range of macroeconomic shifts occurring, the global market narrative has moved from “goldilocks to growth scare”.
The British lender suggested hedging remains warranted for investors given the swirling crowd of downside risks, but argued that the recent sharp reversal of the reflation trade was “overdone.”
“The combination of data no longer delivering positive surprises, burgeoning evidence that supply and labour shortages could mean stickier inflation, China’s increasingly determined crackdown on various industries, and increasing risk from the COVID delta variant have coincided with enough force to give markets a growth scare,” said Emmanuel Cau, head of European equity strategy at Barclays.
Cau highlighted that the prospect of lower growth and higher inflation is driving large and somewhat erratic moves in asset prices, with the recent dramatic fall in yields being the most obvious indicator.
“Equities so far have held up relatively well, but this belies large risk off rotation underneath the surface, which has largely washed out the positive returns from reflation trades,” he said.
What’s more, poor summer liquidity and mixed messages from central banks is adding to market confusion and likely exacerbating the sharp moves, Cau added.
FXStreet reports that strategists at Morgan Stanley think a major fiscal package isn't in the price and that progress towards a substantial pickup in approved government spending could push yields higher.
“Bond investors should be attuned to the Democrats' deliberations on budget reconciliation. Remember, Democratic leadership in Congress is committed to not moving the smaller $600 billion bipartisan infrastructure bill without the larger reconciliation-driven infrastructure package. And last night, the Democrats announced the size of their reconciliation bill: $3.5 trillion. That means the US is gearing up to approve $4 trillion in new spending over the next 10 years, matching our base case.”
“In our view this would translate to about $250 to $500 billion in federal budget deficit expansion next year. Our estimates based on the assumption that Congress may only be able to agree to about $2 trillion in new revenues to offset the planned spending. That would mean that the US would effectively be embarking on another round of fiscal expansion next year. That should have a positive impact on GDP growth, and a positive impact on Treasury bond supply. In short, it should push bond yields higher”
| Time | Country | Event | Period | Previous value | Forecast | Actual |
|---|---|---|---|---|---|---|
| 01:30 | Australia | Changing the number of employed | June | 115.1 | 30 | 29.1 |
| 01:30 | Australia | Unemployment rate | June | 5.1% | 5% | 4.9% |
| 02:00 | China | Retail Sales y/y | June | 12.4% | 11% | 12.1% |
| 02:00 | China | Industrial Production y/y | June | 8.8% | 7.8% | 8.3% |
| 02:00 | China | Fixed Asset Investment | June | 15.4% | 12.1% | 12.6% |
| 02:00 | China | GDP y/y | Quarter II | 18.3% | 8.1% | 7.9% |
| 04:30 | Japan | Tertiary Industry Index | May | -0.8% | -2.7% | |
| 06:00 | United Kingdom | Average earnings ex bonuses, 3 m/y | May | 5.6% | 6.6% | 6.6% |
| 06:00 | United Kingdom | Average Earnings, 3m/y | May | 5.6% | 7.1% | 7.3% |
| 06:00 | United Kingdom | Claimant count | June | -92.6 | -114.8 | |
| 06:00 | United Kingdom | ILO Unemployment Rate | May | 4.7% | 4.7% | 4.8% |
During today's Asian trading, the US dollar consolidated against the euro and the pound, but declined slightly against the japanese yen.
Investors are waiting for the speech of the chairman of the US Federal Reserve System Jerome Powell at the Senate Banking Committee on Thursday. The day before, Powell presented a semi-annual report on the state of the US economy to the House of Representatives Financial Services Committee.
US inflation has picked up markedly and is likely to remain high in the coming months before easing, according to Powell's semi-annual report. The difficulties associated with the COVID-19 pandemic and the limited supply of a number of goods have led to a rapid increase in prices for some types of products and services, he noted. Also, the reason for strong inflation is the low base for comparison due to the fall in prices last year. The head of the Fed said that the Central Bank is not close to making changes in monetary policy.
The yuan rose against the US dollar on the background of data on China. China's GDP grew by 7.9% in the second quarter compared to the same period last year. The pace of recovery slowed compared to a record jump of 18.3% in the first quarter. However, this is due to the effect of a low comparison base, since in January-March 2020, the economy fell by 6.8% due to the start of the COVID-19 pandemic, and later the situation began to gradually improve. Analysts on average predicted an increase of 8.1% in April-June. In the second quarter, the economy expanded by 1.3% compared to the previous three months. In the first quarter, GDP growth was 0.6%.
The ICE index, which tracks the dynamics of the dollar against six currencies (euro, swiss franc, yen, canadian dollar, pound sterling and swedish krona), fell by 0.03%.
FXStreet reports that according to economists at TD Securities, a more patient Fed approach to a taper timeline should help to keep the USD capped within recent ranges.
“The Fed chair signaled no rush for QE tapering, as ‘substantial further progress is still a ways off,’ but he also made clear that the planning process has begun and that action is likely before too long if, as expected, the recovery remains on track. He also continued to downplay this year's surge in inflation. We continue to forecast a formal announcement on tapering in December, but we expect the advance signaling for tapering to build in the months ahead.”
“The outlook on the curve and yields in the coming weeks should help to cap the USD within recent ranges. We are sympathetic to the notion that the hawkish pivot of central banks has come at a time of what we think is peak global growth and inflation. This backdrop should help to limit USD downside overall”.
Reuters reports that according to the report from National Bureau of Statistics of China, China's economy grew slightly more slowly than expected in the second quarter, weighed down by higher raw material costs and new COVID-19 outbreaks.
Gross domestic product (GDP) expanded 7.9% in the April-June quarter from a year earlier, missing expectations for a rise of 8.1%.
Growth slowed significantly from a record 18.3% expansion in the January-March period, when the year-on-year growth rate was heavily skewed by the COVID-induced slump in the first quarter of 2020.
Retail sales and industrial output grew more slowly in June, the latter dragged by a sharp fall in motor vehicle production, while NBS data also showed a cooling in China's housing market, a key engine of growth.
But June activity data still beat expectations, providing some relief to investors concerned about a slowdown after the central bank announced policy easing last week.
Average second quarter growth in 2020 and 2021 was 5.5%, up slightly from a 5% average for the first quarter, according to the National Bureau of Statistics.
On a quarterly basis, GDP expanded 1.3% in the April-June period, the NBS said, just beating expectations for a 1.2% rise. The NBS revised down growth in the first quarter from the fourth quarter last year to 0.4%.
EUR/USD
Resistance levels (open interest**, contracts)
$1.1939 (1363)
$1.1909 (1826)
$1.1887 (122)
Price at time of writing this review: $1.1839
Support levels (open interest**, contracts):
$1.1785 (2548)
$1.1757 (1999)
$1.1723 (5521)
Comments:
- Overall open interest on the CALL options and PUT options with the expiration date August, 6 is 59866 contracts (according to data from July, 14) with the maximum number of contracts with strike price $1,1700 (10542);
GBP/USD
$1.3963 (1037)
$1.3937 (703)
$1.3915 (313)
Price at time of writing this review: $1.3855
Support levels (open interest**, contracts):
$1.3809 (1618)
$1.3766 (276)
$1.3738 (667)
Comments:
- Overall open interest on the CALL options with the expiration date August, 6 is 10308 contracts, with the maximum number of contracts with strike price $1,4000 (1394);
- Overall open interest on the PUT options with the expiration date August, 6 is 15188 contracts, with the maximum number of contracts with strike price $1,3950 (1618);
- The ratio of PUT/CALL was 1.47 versus 1.45 from the previous trading day according to data from July, 14
* - The Chicago Mercantile Exchange bulletin (CME) is used for the calculation.
** - Open interest takes into account the total number of option contracts that are open at the moment.
According to the report from the Office for National Statistics, the number of payroll employees showed another monthly increase, up 356,000 in June 2021 to 28.9 million. However, it remains 206,000 below pre-coronavirus (COVID-19) pandemic levels. For the first time since the beginning of the pandemic, some regions are now above pre-pandemic (February 2020) levels.
Following a period of employment growth and low unemployment, since the start of the pandemic, the employment rate has generally decreased, and the unemployment rate increased. However, since the end of 2020 both have shown signs of recovery. In the latest period (March to May 2021), there was an increase in the employment rate of 0.1 percentage points, to 74.8%, and a decrease in the unemployment rate of 0.2 percentage points, to 4.8%. The economic inactivity rate is up 0.1 percentage points on the previous quarter, to 21.3%.
There were 862,000 job vacancies in April to June 2021 – 77,500 above its pre-pandemic level in January to March 2020. All but one industry saw quarterly increases in their number of vacancies. In June 2021, the experimental monthly vacancies data, and the experimental Adzuna online vacancies data both continued to surpass pre-pandemic levels.
Growth in average total pay (including bonuses) was 7.3% and regular pay (excluding bonuses) was 6.6% among employees for March to May 2021. However, annual growth in average employee pay is being affected by temporary factors that have inflated the increase in the headline growth rate. These are compositional effects where there has been a fall in the number and proportion of lower-paid employee jobs so increasing average earnings and base effects where the latest months are now compared with the start of the coronavirus pandemic, when earnings were first affected and pushed down.
| Raw materials | Closed | Change, % |
|---|---|---|
| Brent | 74.66 | -2.21 |
| Silver | 26.228 | 1.05 |
| Gold | 1827.847 | 1.11 |
| Palladium | 2823.11 | -0.01 |
| Time | Country | Event | Period | Previous value | Forecast |
|---|---|---|---|---|---|
| 01:30 (GMT) | Australia | Changing the number of employed | June | 115.2 | 30 |
| 01:30 (GMT) | Australia | Unemployment rate | June | 5.1% | 5% |
| 02:00 (GMT) | China | Retail Sales y/y | June | 12.4% | 11% |
| 02:00 (GMT) | China | Industrial Production y/y | June | 8.8% | 7.8% |
| 02:00 (GMT) | China | Fixed Asset Investment | June | 15.4% | 12.1% |
| 02:00 (GMT) | China | GDP y/y | Quarter II | 18.3% | 8.1% |
| 04:30 (GMT) | Japan | Tertiary Industry Index | May | -0.7% | |
| 06:00 (GMT) | United Kingdom | Average earnings ex bonuses, 3 m/y | May | 5.6% | 6.6% |
| 06:00 (GMT) | United Kingdom | Average Earnings, 3m/y | May | 5.6% | 7.1% |
| 06:00 (GMT) | United Kingdom | ILO Unemployment Rate | May | 4.7% | 4.7% |
| 06:00 (GMT) | United Kingdom | Claimant count | June | -92.6 | |
| 10:00 (GMT) | United Kingdom | MPC Member Saunders Speaks | |||
| 12:30 (GMT) | U.S. | Continuing Jobless Claims | July | 3339 | 3313 |
| 12:30 (GMT) | U.S. | NY Fed Empire State manufacturing index | July | 17.4 | 18 |
| 12:30 (GMT) | U.S. | Import Price Index | June | 1.1% | 1.2% |
| 12:30 (GMT) | U.S. | Initial Jobless Claims | July | 373 | 360 |
| 12:30 (GMT) | U.S. | Philadelphia Fed Manufacturing Survey | July | 30.7 | 28 |
| 13:15 (GMT) | U.S. | Capacity Utilization | June | 75.2% | 75.6% |
| 13:15 (GMT) | U.S. | Industrial Production YoY | June | 16.3% | |
| 13:15 (GMT) | U.S. | Industrial Production (MoM) | June | 0.8% | 0.6% |
| 13:30 (GMT) | U.S. | Fed Chair Powell Testimony | |||
| 22:30 (GMT) | New Zealand | Business NZ PMI | June | 58.6 | |
| 22:45 (GMT) | New Zealand | CPI, y/y | Quarter II | 1.5% | 2.8% |
| 22:45 (GMT) | New Zealand | CPI, q/q | Quarter II | 0.8% | 0.8% |
| Pare | Closed | Change, % |
|---|---|---|
| AUDUSD | 0.74791 | 0.47 |
| EURJPY | 130.123 | -0.1 |
| EURUSD | 1.18342 | 0.5 |
| GBPJPY | 152.328 | -0.3 |
| GBPUSD | 1.38529 | 0.29 |
| NZDUSD | 0.70368 | 1.33 |
| USDCAD | 1.25086 | -0.02 |
| USDCHF | 0.91411 | -0.38 |
| USDJPY | 109.944 | -0.59 |


© 2000-2026. All rights reserved.
This site is managed by Teletrade D.J. LLC 2351 LLC 2022 (Euro House, Richmond Hill Road, Kingstown, VC0100, St. Vincent and the Grenadines).
The information on this website is for informational purposes only and does not constitute any investment advice.
The company does not serve or provide services to customers who are residents of the US, Canada, Iran, The Democratic People's Republic of Korea, Yemen and FATF blacklisted countries.
Making transactions on financial markets with marginal financial instruments opens up wide possibilities and allows investors who are willing to take risks to earn high profits, carrying a potentially high risk of losses at the same time. Therefore you should responsibly approach the issue of choosing the appropriate investment strategy, taking the available resources into account, before starting trading.
Use of the information: full or partial use of materials from this website must always be referenced to TeleTrade as the source of information. Use of the materials on the Internet must be accompanied by a hyperlink to teletrade.org. Automatic import of materials and information from this website is prohibited.
Please contact our PR department if you have any questions or need assistance at pr@teletrade.global.
transfers