- Analytics
- News and Tools
- Market News
CFD Markets News and Forecasts — 15-08-2016
(raw materials / closing price /% change)
Oil 45.67 -0.15%
Gold 1,344.70 -0.21%
(index / closing price / change items /% change)
Nikkei 225 16,869.56 -50.36 -0.30%
Shanghai Composite 3,125.40 +74.73 +2.45%
S&P/ASX 200 5,539.96 +9.05 +0.16%
FTSE 100 6,941.19 +25.17 +0.36%
CAC 40 4,497.86 -2.33 -0.05%
Xetra DAX 10,739.21 +25.78 +0.24%
S&P 500 2,190.15 +6.10 +0.28%
Dow Jones Industrial Average 18,636.05 +59.58 +0.32%
S&P/TSX Composite 14,777.02 +29.57 +0.20%
(pare/closed(GMT +3)/change, %)
EUR/USD $1,1183 +0,21%
GBP/USD $1,2880 -0,30%
USD/CHF Chf0,9729 -0,16%
USD/JPY Y101,26 +0,02%
EUR/JPY Y113,24 +0,17%
GBP/JPY Y130,41 -0,33%
AUD/USD $0,7673 +0,31%
NZD/USD $0,7215 +0,28%
USD/CAD C$1,2926 -0,22%
(time / country / index / period / previous value / forecast)
01:30 Australia New Motor Vehicle Sales (MoM) July 3.1%
01:30 Australia New Motor Vehicle Sales (YoY) July 2.1%
01:30 Australia RBA Meeting's Minutes
08:30 United Kingdom Producer Price Index - Output (MoM) July 0.2% 0.2%
08:30 United Kingdom Producer Price Index - Output (YoY) July -0.4% 0%
08:30 United Kingdom Producer Price Index - Input (MoM) July 1.8% 1%
08:30 United Kingdom Producer Price Index - Input (YoY) July -0.5% 2%
08:30 United Kingdom Retail Price Index, m/m July 0.4% -0.1%
08:30 United Kingdom Retail prices, Y/Y July 1.6% 1.7%
08:30 United Kingdom HICP, m/m July 0.2% -0.1%
08:30 United Kingdom HICP, Y/Y July 0.5% 0.5%
08:30 United Kingdom HICP ex EFAT, Y/Y July 1.4% 1.3%
09:00 Eurozone ZEW Economic Sentiment August -14.7
09:00 Eurozone Trade balance unadjusted June 24.6
09:00 Germany ZEW Survey - Economic Sentiment August -6.8 2
12:30 Canada Manufacturing Shipments (MoM) June -1% 0.9%
12:30 U.S. Building Permits July 1153 1160
12:30 U.S. Housing Starts July 1189 1180
12:30 U.S. CPI, m/m July 0.2% 0.1%
12:30 U.S. CPI, Y/Y July 1% 1%
12:30 U.S. CPI excluding food and energy, m/m July 0.2% 0.2%
12:30 U.S. CPI excluding food and energy, Y/Y July 2.3% 2.3%
13:15 U.S. Capacity Utilization July 75.4% 75.6%
13:15 U.S. Industrial Production (MoM) July 0.6% 0.2%
13:15 U.S. Industrial Production YoY July -0.7%
22:45 New Zealand PPI Input (QoQ) Quarter II -1%
22:45 New Zealand PPI Output (QoQ) Quarter II -0.2%
22:45 New Zealand Employment Change, q/q Quarter II 1.2% 0.7%
22:45 New Zealand Unemployment Rate Quarter II 5.2% 5.2%
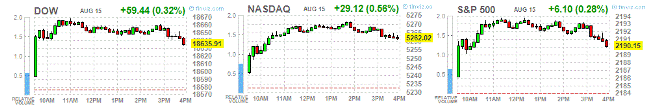
Major US stock indexes finished trading in positive territory on the background of positive dynamics of the oil market and the expectations of the publication of important macroeconomic data on the US
Oil prices rose significantly, reaching a month high, helped by speculation that major oil-producing countries can take measures to stabilize prices. Recall, the Minister of Energy of Saudi Arabia Khalid al-Falih recently signaled his country's readiness to implement measures to stabilize the market. Saudi Arabia, the largest OPEC oil producer, is seen as the undeclared leader of the cartel.
As shown by the results of research, published by the Federal Reserve Bank of New York manufacturing index in the region has dropped significantly in August, confounding forecasts of experts. According to the data, the manufacturing index fell this month to -4.21 from 0.55 in July. Economists had expected the index to rise to 2.0.
At the same time, builders confidence in the market for newly built single-family homes in August increased by two points to 60 from a revised 58 with decreasing values in July, according to the housing market index (HMI) of the National Association of Home Builders / Wells Fargo. Two of the three components shown HMI increase in August. The component that measures current sales conditions rose two points to 65, while the index of sales expectations for plotting in the next six months increased by one point to 67. The component that measures customer traffic fell by one point to 44.
Most components of the DOW index finished trading in positive territory (22 of 30). Most remaining shares grew E. I. du Pont de Nemours and Company (DD, + 1.71%). Outsider were shares of UnitedHealth Group Incorporated (UNH, -0.92%).
Almost all sectors of the S & P showed an increase. The leader turned conglomerates sector (+ 1.9%). Decreased only utilities sector (-1.1%).
At the close:
Dow + 0.32% 18,635.98 +59.51
Nasdaq + 0.56% 5,262.02 +29.12
S & P + 0.28% 2,190.13 +6.08
Major U.S. stock-indexes rose on Monday, building on the record-setting rally of the past few weeks, as oil prices jumped. Oil hit a one-month high of about $48 on rising speculation that major producers may try to work out ways to support prices in an oversupplied market. Strong economic data, upbeat corporate earnings and low interest rates have stoked appetite for U.S. equities, driving all three major indexes to record highs.


Most of all Dow stocks in positive area (23 of 30). Top gainer - Intel Corporation (INTC, +1.55%). Top loser - Wal-Mart Stores Inc. (WMT, -0.72%).
Most of S&P sectors in positive area. Top gainer - Conglomerates (+1.6%). Top loser - Utilities (-0.1%).
At the moment:
Dow 18608.00 +85.00 +0.46%
S&P 500 2189.50 +9.25 +0.42%
Nasdaq 100 4831.00 +26.75 +0.56%
Oil 45.40 +0.91 +2.05%
Gold 1347.60 +4.40 +0.33%
U.S. 10yr 1.53 +0.02
U.S. stock-index futures advanced.
Global Stocks:
Nikkei 16,869.56 -50.36 -0.30%
Hang Seng 22,932.51 +165.60 +0.73%
Shanghai 3,125.40 +74.73 +2.45%
FTSE 6,950.97 +34.95 +0.51%
CAC 4,505.01 +4.82 +0.11%
DAX 10,756.16 +42.73 +0.40%
Crude $44.77 (+0.63%)
Gold $1345.50 (+0.17%)
(company / ticker / price / change ($/%) / volume)
| ALCOA INC. | AA | 10.26 | 0.09(0.885%) | 34753 |
| ALTRIA GROUP INC. | MO | 66.89 | 0.15(0.2248%) | 368 |
| Amazon.com Inc., NASDAQ | AMZN | 772.83 | 0.27(0.035%) | 18343 |
| Apple Inc. | AAPL | 108.47 | 0.29(0.2681%) | 60324 |
| AT&T Inc | T | 43.28 | -0.00(-0.00%) | 3564 |
| Barrick Gold Corporation, NYSE | ABX | 21.75 | 0.00(0.00%) | 25467 |
| Boeing Co | BA | 133.5 | 0.40(0.3005%) | 2100 |
| Chevron Corp | CVX | 102.47 | 0.31(0.3034%) | 504 |
| Cisco Systems Inc | CSCO | 31.05 | 0.18(0.5831%) | 17579 |
| Citigroup Inc., NYSE | C | 45.79 | 0.21(0.4607%) | 1983 |
| Exxon Mobil Corp | XOM | 88.08 | 0.23(0.2618%) | 4303 |
| Facebook, Inc. | FB | 125.1 | 0.22(0.1762%) | 55992 |
| Ford Motor Co. | F | 12.37 | 0.04(0.3244%) | 6360 |
| Freeport-McMoRan Copper & Gold Inc., NYSE | FCX | 11.93 | 0.11(0.9306%) | 66345 |
| General Electric Co | GE | 31.26 | 0.02(0.064%) | 320 |
| General Motors Company, NYSE | GM | 31.72 | 0.15(0.4751%) | 100 |
| Google Inc. | GOOG | 785 | 1.78(0.2273%) | 741 |
| Home Depot Inc | HD | 137.88 | 1.31(0.9592%) | 12487 |
| Intel Corp | INTC | 34.7 | 0.13(0.3761%) | 601 |
| McDonald's Corp | MCD | 119.25 | -0.27(-0.2259%) | 4865 |
| Microsoft Corp | MSFT | 58.06 | 0.12(0.2071%) | 3362 |
| Nike | NKE | 56.67 | 0.22(0.3897%) | 2037 |
| Pfizer Inc | PFE | 35.03 | 0.05(0.1429%) | 3626 |
| Procter & Gamble Co | PG | 87.48 | 0.44(0.5055%) | 924 |
| Starbucks Corporation, NASDAQ | SBUX | 55.55 | 0.08(0.1442%) | 1129 |
| Tesla Motors, Inc., NASDAQ | TSLA | 226.9 | 1.29(0.5718%) | 9204 |
| The Coca-Cola Co | KO | 44.11 | 0.08(0.1817%) | 2178 |
| Twitter, Inc., NYSE | TWTR | 19.92 | 0.38(1.9447%) | 232406 |
| Verizon Communications Inc | VZ | 53.88 | 0.23(0.4287%) | 819 |
| Wal-Mart Stores Inc | WMT | 74.07 | 0.18(0.2436%) | 1730 |
| Walt Disney Co | DIS | 97.15 | 0.31(0.3201%) | 9772 |
| Yahoo! Inc., NASDAQ | YHOO | 43.4 | 0.46(1.0713%) | 316056 |
| Yandex N.V., NASDAQ | YNDX | 23.5 | 0.29(1.2495%) | 2850 |
Upgrades:
Procter & Gamble (PG) upgraded to Buy from Neutral at B. Riley & Co
Downgrades:
McDonald's (MCD) downgraded to Hold from Buy at Argus
Other:
EUR/USD
Offers : 1.1175-80 1.1200 1.1230 1.1250 1.1280 1.1300
Bids : 1.1150 1.1130 1.1115 1.1100 1.1070 1.1050-55 1.1020-25 1.1000-05
GBP/USD
Offers : 1.2980 1.3000 1.3020-25 1.3065 1.3080 1.3095-05 1.3130 1.3150
Bids : 1.2930 1.2900 1.2880 1.2850 1.2830 1.2800 1.2780 1.2750
EUR/GBP
Offers : 0.8655-60 0.8685 0.8700 0.8730 0.8750
Bids : 0.8620 0.8600 0.8585 0.8570 0.8550 0.8535 0.8520 0.8500
EUR/JPY
Offers : 113.25 113.50 113.80 114.00 114.50 114.80 115.00
Bids : 112.80-85 112.50 112.00-10 111.85 111.50
USD/JPY
Offers : 101.30 101.50 101.80 102.00 102.20-25 102.50 102.80-85 103.00
Bids : 101.00 100.70-75 100.50 100.25-30 100.00 99.80 99.50
AUD/USD
Offers : 0.7680 0 .7700 0.7720 0.7750-55 0.7785 0.7800
Bids : 0.7635-40 0.7620 0.7600 0.7585 0.7565 0.7570 0.7550
USD/JPY 101.00 (EUR 603m)
GBP/USD 1.2750 (GBP 785m)
AUD/USD 0.7460 (AUD 1.87bln) 0.7600 (829m)
AUD/JPY 79.60 (AUD 2.48bln)
NZD/USD 0.6930 (NZD 1.17bln)
AUD/NZD 1.0900 (AUD 1.58bln)
European stocks ended a choppy session in the red on Friday after weaker-than-expected U.S. retail sales cast doubt on the health of the world's largest economy.
The Stoxx Europe 600 SXXP, -0.16% dropped 0.2% to close at 346.09, partly erasing a 0.8% gain from Thursday, which was fueled by higher oil prices. For the week, it ended 1.4% higher.
U.S. stocks ended mostly lower Friday, but still eked out small weekly gains, as weakness in shares of mining and chemical companies, along with a rise in active oil rigs, blunted an advance in the energy sector and rising oil prices. Still the Nasdaq closed at an all-time high, one session after all three benchmarks posted record closes on the same day for the first time since 1999. The S&P 500 index SPX, -0.08% ended down 1.8 points, or 0.1%, at 2,183.99, weighed by sharp declines in Alcoa Inc. AA, -2.40% and Nucor Corp. NUE, -3.17% and Dow Chemical Co. DOW, -2.44% followed by a 0.4% loss in the telecom sector. Three of the index's 10 sectors ended in positive territory, with energy leading the gains, up 0.6%. The Dow Jones Industrial Average DJIA, -0.20% lost 37.53 points, or 0.2%, to 18,575.9, pulled down by a 1.9% drop in DuPont DD, -1.93% and a 0.9% drop in IBM Corp. IBM, -0.97% but buoyed by a 1.3% gain in Exxon Mobil Corp. XOM, +1.30% Meanwhile, the Nasdaq Composite Index COMP, +0.09% ended up 4.5 points, or 0.1%, at 5,232.89, an all-time closing high.
Asian shares inched back from one-year peaks on Monday as a rally in Chinese stocks helped offset news of Japan's economic growth slowing to a halt last quarter.
China's blue-chip CSI300 Index .CSI300 rose 1.3 percent to a seven-month high and Shanghai .SSEC added 0.9 percent amid talk more stimulus would be forthcoming from Beijing.
Aug 15 Japan's Nikkei share index slipped on Monday as the yen stayed strong and data showed economic growth stalled in the second quarter, souring investor sentiment.
The Nikkei dropped 0.2 percent to 16,884.76 points by midmorning, after rising 4.1 percent last week.
Japan's economy expanded by a scant 0.2 percent on an annualised basis in the April-June quarter, less than a median market forecast for a 0.7 percent increase and a marked slowdown from a revised 2.0 percent increase in January-March, Cabinet Office data showed.
EUR/USD
Resistance levels (open interest**, contracts)
$1.1302 (4929)
$1.1248 (3344)
$1.1213 (2202)
Price at time of writing this review: $1.1159
Support levels (open interest**, contracts):
$1.1105 (2267)
$1.1049 (3787)
$1.0975 (5814)
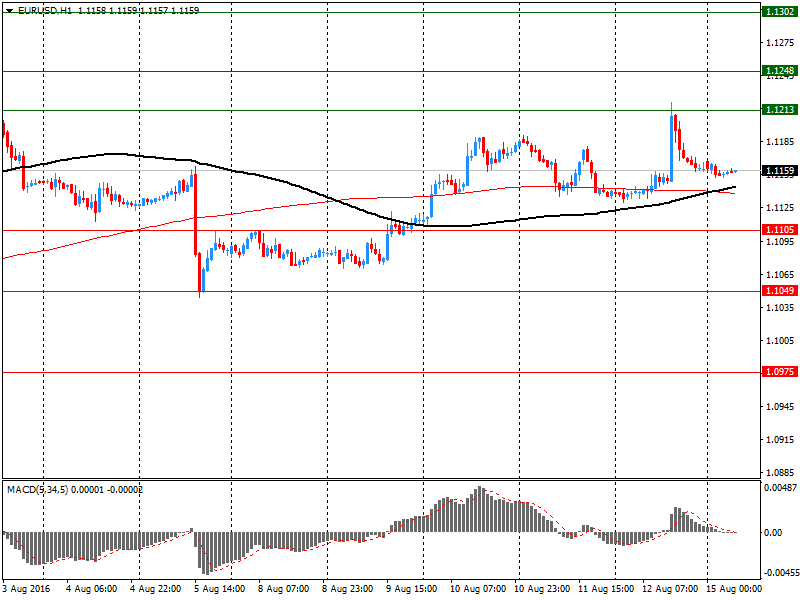
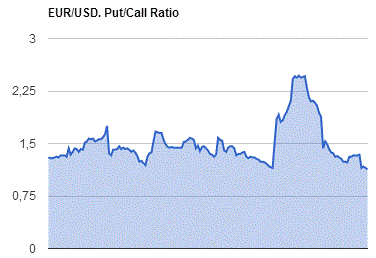
Comments:
- Overall open interest on the CALL options with the expiration date September, 9 is 49594 contracts, with the maximum number of contracts with strike price $1,1250 (4929);
- Overall open interest on the PUT options with the expiration date September, 9 is 55028 contracts, with the maximum number of contracts with strike price $1,1000 (5814);
- The ratio of PUT/CALL was 1.11 versus 1.12 from the previous trading day according to data from August, 12
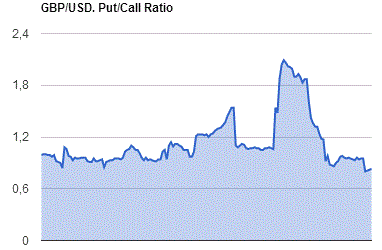
GBP/USD
Resistance levels (open interest**, contracts)
$1.3204 (2168)
$1.3106 (1269)
$1.3010 (946)
Price at time of writing this review: $1.2919
Support levels (open interest**, contracts):
$1.2792 (2312)
$1.2695 (1049)
$1.2597 (728)
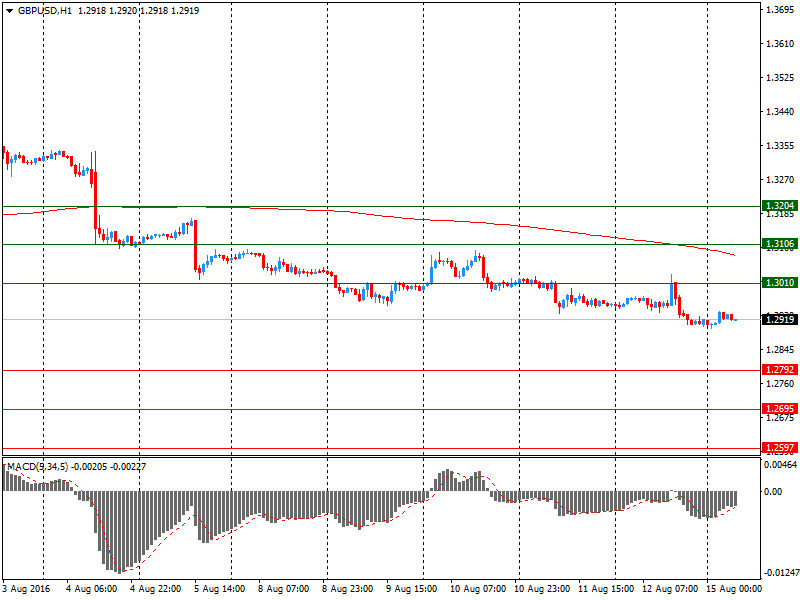
Comments:
- Overall open interest on the CALL options with the expiration date September, 9 is 31321 contracts, with the maximum number of contracts with strike price $1,3300 (2496);
- Overall open interest on the PUT options with the expiration date September, 9 is 25391 contracts, with the maximum number of contracts with strike price $1,2800 (2312);
- The ratio of PUT/CALL was 0.81 versus 0.82 from the previous trading day according to data from August, 12
* - The Chicago Mercantile Exchange bulletin (CME) is used for the calculation.
** - Open interest takes into account the total number of option contracts that are open at the moment.


© 2000-2026. All rights reserved.
This site is managed by Teletrade D.J. LLC 2351 LLC 2022 (Euro House, Richmond Hill Road, Kingstown, VC0100, St. Vincent and the Grenadines).
The information on this website is for informational purposes only and does not constitute any investment advice.
The company does not serve or provide services to customers who are residents of the US, Canada, Iran, The Democratic People's Republic of Korea, Yemen and FATF blacklisted countries.
Making transactions on financial markets with marginal financial instruments opens up wide possibilities and allows investors who are willing to take risks to earn high profits, carrying a potentially high risk of losses at the same time. Therefore you should responsibly approach the issue of choosing the appropriate investment strategy, taking the available resources into account, before starting trading.
Use of the information: full or partial use of materials from this website must always be referenced to TeleTrade as the source of information. Use of the materials on the Internet must be accompanied by a hyperlink to teletrade.org. Automatic import of materials and information from this website is prohibited.
Please contact our PR department if you have any questions or need assistance at pr@teletrade.global.
transfers