- Analytics
- News and Tools
- Market News
CFD Markets News and Forecasts — 15-08-2017
(raw materials / closing price /% change)
Oil 47.71 +0.34%
Gold 1,276.90 -0.22%
(index / closing price / change items /% change)
Nikkei +216.21 19753.31 +1.11%
TOPIX +17.15 1616.21 +1.07%
Hang Seng -75.27 27174.96 -0.28%
CSI 300 +11.38 3706.06 +0.31%
Euro Stoxx 50 +11.25 3461.91 +0.33%%
FTSE 100 +29.96 7383.85 +0.41%
DAX +11.92 12177.04 +0.10%
CAC 40 +18.58 5140.25 +0.36%
DJIA +5.28 21998.99 +0.02%
S&P 500 -1.23 2464.61 -0.05%
NASDAQ -7.22 6333.01 -0.11%
S&P/TSX -22.07 15097.84 -0.15%
(pare/closed(GMT +3)/change, %)
EUR/USD $1,1734 -0,35%
GBP/USD $1,2869 -0,71%
USD/CHF Chf0,97199 -0,01%
USD/JPY Y110,57 +0,87%
EUR/JPY Y129,75 +0,53%
GBP/JPY Y142,296 +0,17%
AUD/USD $0,7821 -0,37%
NZD/USD $0,7238 -0,66%
USD/CAD C$1,27519 +0,23%
00:30 Australia Leading Index July -0.1%
01:30 Australia Wage Price Index, y/y Quarter II 1.9% 1.9%
01:30 Australia Wage Price Index, q/q Quarter II 0.5% 0.5%
08:30 United Kingdom Average earnings ex bonuses, 3 m/y June 2.0% 2%
08:30 United Kingdom Average Earnings, 3m/y June 1.8% 1.8%
08:30 United Kingdom ILO Unemployment Rate June 4.5% 4.5%
08:30 United Kingdom Claimant count July 5.9 3.7
09:00 Eurozone GDP (YoY) (Revised) Quarter II 1.9% 2.1%
09:00 Eurozone GDP (QoQ) (Revised) Quarter II 0.5% 0.6%
12:30 Canada Foreign Securities Purchases June 29.46
12:30 U.S. Building Permits July 1275 1250
12:30 U.S. Housing Starts July 1215 1220
14:30 U.S. Crude Oil Inventories August -6.451 -2.72
18:00 U.S. FOMC meeting minutes
22:45 New Zealand PPI Input (QoQ) Quarter II 0.8%
22:45 New Zealand PPI Output (QoQ) Quarter II 1.4%
23:50 Japan Trade Balance Total, bln July 440 392
Major US stock indexes finished the session near the zero mark amid a decrease in the tension around the possible military conflict between the US and North Korea.
North Korean media reported that the head of the DPRK, Kim Jong-un, decided to postpone consideration of the version of the missile strike at the US base on Guam Island in the Pacific Ocean. According to him, the US "must make the right choice to avoid a dangerous military conflict." At the same time, the leader of North Korea warned that he could change his mind and ordered the military to be ready to strike at any moment.
In addition, the US Department of Commerce reported that retail sales rose in July to the highest level in 2017, driven by strong demand for new cars and special purchases of Amazon's Prime Day. According to the report, sales in retail chains grew by 0.6%. Economists forecast an increase of 0.4%. Retail sales in June rose by 0.3% instead of falling by 0.2%, and sales in May were unchanged. Sales of so-called non-stationary retailers grew by 1.3%, which is the largest increase since December. Sales also grew by 1.2% in auto dealers, by 1.2% in garden centers and by 1% in department stores.
The confidence of builders in the market for newly built single-family homes rose 4 points to 68 in August, according to the housing market index (HMI) from the National Association of House Builders / Wells Fargo. The component measuring current sales conditions grew by 4 points to 74, and the index predicting sales in the next six months jumped 5 points to 78. Meanwhile, the component measuring consumer traffic increased by one point to 49.
At the same time, the Ministry of Commerce reported on Tuesday that inventories increased by 0.5% after an increase of 0.3% in May. In June, retail inventories increased by 0.6%, as announced in the preliminary report for the previous month. In May, retail inventories increased by 0.6%.
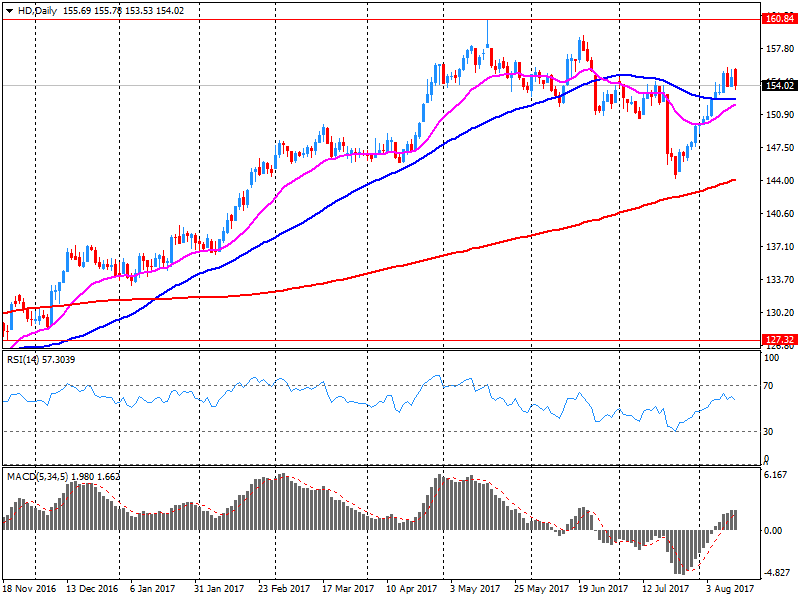
Most components of the DOW index recorded a rise (19 out of 30). The leader of growth was shares of American Express Company (AXP, + 1.67%). Outsider was the shares of The Home Depot, Inc. (HD, -2.76%).
The S & P sector showed mixed dynamics. The greatest decline was shown by the sector of conglomerates (-0.5%). The consumer goods sector grew most (+ 0.4%).
At closing:
DJIA + 0.02% 21.999.09 +5.38
Nasdaq -0.11% 6.333.01 -7.22
S & P -0.05% 2,464.61 -1.23
-
Revises up China's short-term growth outlook, but sees vulnerabilities increasing
Builder confidence in the market for newly-built single-family homes rose four points in August to a level of 68 on the National Association of Home Builders/Wells Fargo Housing Market Index (HMI).
"Our members are encouraged by rising demand in the new-home market," said NAHB Chairman Granger MacDonald, a home builder and developer from Kerrville, Texas. "This is due to ongoing job and economic growth, attractive mortgage rates, and growing consumer confidence."
"The fact that builder confidence has returned to the healthy levels we saw this spring is consistent with our forecast for a gradual strengthening in the housing market," said NAHB Chief Economist Robert Dietz. "GDP growth improved in the second quarter, which helped sustain housing demand. However, builders continue to face supply-side challenges, such as lot and labor shortages and rising building material costs."
The combined value of distributive trade sales and manufacturers' shipments for June, adjusted for seasonal and trading-day differences but not for price changes, was estimated at $1,356.8 billion, up 0.3 percent (±0.2 percent) from May 2017 and was up 4.3 percent (±0.4 percent) from June 2016.
Manufacturers' and trade inventories, adjusted for seasonal variations but not for price changes, were estimated at an end-of-month level of $1,869.3 billion, up 0.5 percent (±0.1 percent) from May 2017 and were up 2.8 percent (±0.2 percent) from June 2016.
The total business inventories/sales ratio based on seasonally adjusted data at the end of June was 1.38. The June 2016 ratio was 1.40.
EURUSD: 1.1550 (EUR 625 млн) 1.1700 (730 млн) 1.1780-85 (1.36 млрд) 1.1800 (930 млн)
USDJPY: 108.00 (USD 345 млн) 109.00 (400 млн) 110.75 (275 млн)
EURGBP: 0.9100 (EUR 510 млн)
AUDUSD: 0.7900 (670m) 0.8060 (375 млн)
U.S. stock-index futures advanced on Tuesday, as tensions over a possible military conflict with North Korea continued to abate, supported by reports that the leader of the DPRK, Kim Jong-un, had delayed a decision on firing missiles towards the U.S. military bases in Guam.
Global Stocks:
Nikkei 19,753.31 +216.21 +1.11%
Hang Seng 27,174.96 -75.27 -0.28%
Shanghai 3,251.64 +14.28 +0.44%
S&P/ASX 5,757.48 +27.08 +0.47%
FTSE 7,391.46 +37.57 +0.51%
CAC 5,150.26 +28.59 +0.56%
DAX 12,217.79 +52.67 +0.43%
Crude $47.23 (-0.76%)
Crude $1,274.00 (-1.27%)
(company / ticker / price / change ($/%) / volume)
| ALCOA INC. | AA | 37.4 | 0.21(0.56%) | 1589 |
| Amazon.com Inc., NASDAQ | AMZN | 987 | 3.70(0.38%) | 22703 |
| American Express Co | AXP | 85 | -0.47(-0.55%) | 1620 |
| Apple Inc. | AAPL | 160.67 | 0.82(0.51%) | 167798 |
| AT&T Inc | T | 38.51 | 0.01(0.03%) | 7270 |
| Barrick Gold Corporation, NYSE | ABX | 16.4 | -0.32(-1.91%) | 139715 |
| Boeing Co | BA | 238.5 | 1.35(0.57%) | 1829 |
| Caterpillar Inc | CAT | 114 | 0.29(0.26%) | 1526 |
| Chevron Corp | CVX | 108.83 | 0.12(0.11%) | 15406 |
| Cisco Systems Inc | CSCO | 31.85 | 0.01(0.03%) | 7859 |
| Citigroup Inc., NYSE | C | 68.5 | 0.61(0.90%) | 28930 |
| Deere & Company, NYSE | DE | 126 | -2.57(-2.00%) | 2555 |
| Facebook, Inc. | FB | 171.4 | 0.65(0.38%) | 90522 |
| FedEx Corporation, NYSE | FDX | 211.72 | 3.86(1.86%) | 200 |
| Ford Motor Co. | F | 10.9 | -0.01(-0.09%) | 6226 |
| Freeport-McMoRan Copper & Gold Inc., NYSE | FCX | 14.26 | 0.11(0.78%) | 8218 |
| General Electric Co | GE | 25.25 | -0.11(-0.43%) | 50825 |
| General Motors Company, NYSE | GM | 35.7 | 0.23(0.65%) | 6621 |
| Goldman Sachs | GS | 228.71 | 1.35(0.59%) | 7317 |
| Home Depot Inc | HD | 153.5 | -0.76(-0.49%) | 354641 |
| Intel Corp | INTC | 36.45 | 0.11(0.30%) | 3506 |
| International Business Machines Co... | IBM | 142.9 | 0.58(0.41%) | 112 |
| JPMorgan Chase and Co | JPM | 93.12 | 0.63(0.68%) | 14437 |
| Microsoft Corp | MSFT | 73.42 | 0.22(0.30%) | 28249 |
| Nike | NKE | 58.75 | -1.03(-1.72%) | 10649 |
| Procter & Gamble Co | PG | 91.97 | 0.32(0.35%) | 380 |
| Starbucks Corporation, NASDAQ | SBUX | 53.38 | 0.16(0.30%) | 1014 |
| Tesla Motors, Inc., NASDAQ | TSLA | 364.82 | 1.02(0.28%) | 42239 |
| The Coca-Cola Co | KO | 45.76 | -0.04(-0.09%) | 1190 |
| Twitter, Inc., NYSE | TWTR | 16.16 | 0.07(0.44%) | 5960 |
| Verizon Communications Inc | VZ | 48.52 | -0.26(-0.53%) | 1202 |
| Visa | V | 102.1 | 0.23(0.23%) | 880 |
| Wal-Mart Stores Inc | WMT | 81 | 0.30(0.37%) | 566 |
| Walt Disney Co | DIS | 101.85 | 0.45(0.44%) | 3260 |
Freeport-McMoRan (FCX) initiated with a Mkt Perform at Raymond James
Prices for U.S. imports edged up 0.1 percent in July, the U.S. Bureau of Labor Statistics reported today, led by higher fuel prices which more than offset lower prices for nonfuel imports. The July increase in import prices followed declines in each of the 2 previous months. U.S. export prices advanced 0.4 percent in July, after decreasing 0.2 percent in June.
The price index for U.S. exports advanced 0.4 percent in July, matching a 0.4-percent rise in December 2016. The increases are the largest monthly advances since a 0.8-percent rise in June 2016. Rising prices for both agricultural and nonagricultural exports contributed to the July increase. Prices for
U.S. exports rose 0.8 percent over the past year, continuing an upward trend; U.S. export prices have not recorded an over-the-year decrease since falling 0.2 percent in November 2016.
Advance estimates of U.S. retail and food services sales for July 2017, adjusted for seasonal variation and holiday and trading-day differences, but not for price changes, were $478.9 billion, an increase of 0.6 percent (± 0.5 percent) from the previous month, and 4.2 percent (± 0.9 percent) above July 2016. Total sales for the May 2017 through July 2017 period were up 3.9 percent (± 0.7 percent) from the same period a year ago. The May 2017 to June 2017 percent change was revised from down 0.2 percent (± 0.5 percent)* to up 0.3 percent (± 0.2 percent). Retail trade sales were up 0.6 percent (± 0.5 percent) from June 2017, and up 4.3 percent (± 0.7 percent) from last year. Nonstore Retailers were up 11.5 percent (± 1.8 percent) from July 2016, while Building Materials and Garden Equipment and Supplies Dealers were up 8.3 percent (± 1.9 percent) from last year.
Home Depot (HD) reported Q2 FY 2017 earnings of $2.25. per share (versus $1.97 in Q2 FY 2016), beating analysts' consensus estimate of $2.22.
The company's quarterly revenues amounted to $28.108 bln (+6.2% y/y), generally in-line with analysts' consensus estimate of $27.836 bln.
HD fell to $153.66 (-0.39%) in pre-market trading.
-
Says is working on position paper on customs issues related to the orderly withdrawal of the UK
-
Agreement on future relationship can only be finalised once UK has become a third country
-
"We will now study the UK position paper on customs carefully"
-
UK's publication of Brexit position papers "positive step towards now really starting phase one of the negotiations"
-
Pre-notification and trusted operator schemes will help keep trade flowing with EU after Brexit
-
Expects to have news customs system in place in the first half of 2019
-
Russian assets attractive as they were undervalued compared with other emerging markets
-
Liquidity surplus in banking sector to remain in place in august
EURUSD: 1.1550 (EUR 625m) 1.1700 (730m) 1.1780-85 (1.36bln) 1.1800 (930m)
USDJPY: 108.00 (USD 345m) 109.00 (400m) 110.75 (275m)
EURGBP: 0.9100 (EUR 510m)
AUDUSD: 0.7900 (670m) 0.8060 (375m)
UK House prices grew by 4.9% in the year to June 2017, 0.1 percentage points lower than in the year to May 2017. While the annual growth rate has slowed since mid-2016 it has remained broadly around 5% during 2017.
In terms of housing demand the Royal Institution of Chartered Surveyors' (RICS) residential market survey for June 2017 reported that price expectations are marginally positive while new buyer enquiries decreased over the month.
The UK Property Transaction statistics showed that in June 2017 the number of seasonally adjusted property transactions completed in the UK with a value of £40,000 or above increased by 1.0% compared to June 2016. Comparing June 2017 to May 2017, property transactions fell by 3.3%.
The annual rate of inflation for goods leaving the factory gate slowed for the third time this year, mainly as a result of 2016 price movements dropping out of the annual comparison.
Factory gate prices (output prices) rose 3.2% on the year to July 2017, from 3.3% in June 2017, which is a 0.5 percentage points decline from their recent peak of 3.7% in February and March 2017.
Prices for materials and fuels (input prices) rose 6.5% on the year to July 2017, from 10% in June 2017; as per factory gate prices, the drop in July's rate is due to 2016 price movements dropping out of the annual comparison.
Food production continued to be the main source of upward contributions to input and output price inflation fuelled by rising prices for home food materials and food products respectively.
The Consumer Prices Index including owner occupiers' housing costs 12-month inflation rate was 2.6% in July 2017, unchanged from June 2017.
CPIH was re-designated as a National Statistic on 31 July 2017.
The price of motor fuel continued to fall and provided the largest downward contribution to change in the rate between June 2017 and July 2017.
This was offset by smaller upward contributions from a range of goods and services, including clothing, household goods, gas and electricity, and food and non-alcoholic beverages.
The Consumer Prices Index (CPI) 12-month rate was 2.6% in July 2017, unchanged from June 2017.
The total index of producer and import prices remained unchanged at 99.7 points in July 2017 (basis December 2015 = 100).
More cheaply were mineral oil products, higher prices showed scrap, computers and metal products. Compared with July 2016, the price level of the total supply of domestic and imported products decreased by 0.1 percent. This is evident from the figures of the Federal Statistical Office (FSO).
Price declines against June 2017 were registered in the producer price index for irradiation, electrotherapy and electromedical devices as well as for electronic components and circuit boards
EUR/USD
Resistance levels (open interest**, contracts)
$1.1883 (1647)
$1.1849 (1692)
$1.1822 (2070)
Price at time of writing this review: $1.1755
Support levels (open interest**, contracts):
$1.1699 (2459)
$1.1672 (3123)
$1.1641 (3395)
Comments:
- Overall open interest on the CALL options and PUT options with the expiration date September, 8 is 125721 contracts (according to data from August, 14) with the maximum number of contracts with strike price $1,2000 (5426);
GBP/USD
Resistance levels (open interest**, contracts)
$1.3116 (1370)
$1.3088 (3117)
$1.3046 (1022)
Price at time of writing this review: $1.2959
Support levels (open interest**, contracts):
$1.2918 (981)
$1.2896 (1256)
$1.2869 (2158)
Comments:
- Overall open interest on the CALL options with the expiration date September, 8 is 30644 contracts, with the maximum number of contracts with strike price $1,3000 (3117);
- Overall open interest on the PUT options with the expiration date September, 8 is 25974 contracts, with the maximum number of contracts with strike price $1,2850 (2657);
- The ratio of PUT/CALL was 0.85 versus 0.85 from the previous trading day according to data from August, 14
* - The Chicago Mercantile Exchange bulletin (CME) is used for the calculation.
** - Open interest takes into account the total number of option contracts that are open at the moment.
-
Needed to balance risks from high household debt in a low-inflation environment
-
Some easing of house prices in Sydney, Melbourne but mortgage credit still outpacing income growth
-
Rba says house prices, household debt warranted "careful monitoring"
-
GDP growth likely picked up in q2, economy seen growing around 3 pct for 2018 and 2019
-
Recent strong employment, hike in minimum wage could support incomes and spending
-
Further rise in AUD could lead to slower growth, lower inflation
-
AUD had risen amid broad-based decline in the U.S. dollar
-
RBA board noted improvement in global economy, particularly in China and euro area
July trend estimates key points:
-
The July 2017 trend estimate (101,083) increased by 0.7% when compared with June 2017.
-
When comparing national trend estimates for July 2017 with June 2017, sales for Passenger, Sports utility vehicles and Other vehicles increased by 0.5%,1.0% and 0.5% respectively.
-
All states and territories reported an increase in vehicle sales on a trend basis.
-
The largest upward movement across all states and territories, on a trend basis, was in the Northern Territory (1.9%), continuing an upward trend that began in January 2017.
The German economy continues to grow. In the second quarter of 2017, the gross domestic product (GDP) rose 0.6% on the previous quarter after adjustment for price, seasonal and calendar variations. Based on most recent calculations, the Federal Statistical Office (Destatis) also reports that GDP growth in the first quarter of 2017 had been slightly larger (0.7%)
The quarter-on-quarter comparison (upon adjustment for price, seasonal and calendar variations) shows that positive contributions came from domestic demand. Final consumption expenditure of both households and general government increased markedly. Capital formation was up, too. There was an increase in fixed capital formation in machinery and equipment, in construction and in other fixed assets compared with the first quarter of 2017. According to provisional calculations, the development of foreign trade, however, had a downward effect on growth because the price-adjusted quarter-on-quarter increase in imports was considerably larger than that of exports.
Year on year the price-adjusted GDP rose 0.8% in the second quarter of 2017 (first quarter of 2017: +3.2%). However, the calendar effect in the first two quarters of 2017 was above average because, in the first quarter, there were 3 working days more and, in the second quarter, there were 3 working days less than a year earlier. When calendar-adjusted, GDP growth in the second quarter of 2017 was 2.1% (following 2.0% in the first quarter of 2017)
Global stocks continued to rebound Tuesday, getting a fresh lift as North Korea pulled back its threat to attack Guam. After days of heated rhetoric between North Korea and President Donald Trump, Pyongyang dialed back the political tensions Tuesday with North Korean state media saying Kim Jong Un had decided not to fire missiles at the U.S. territory.
European stocks on Monday bounced back from last week's sharp losses after senior U.S. officials over the weekend sought to play down the risk of a nuclear conflict with North Korea. The Stoxx Europe 600 index SXXP, +1.08% rallied 1.1% to close at 376.16, winning back parts of the 2.7% loss it suffered last week.
U.S. stocks gained on Monday with the S&P 500 rising 1% for the first time in three months as the verbal standoff between the U.S. and North Korea cooled for now. The S&P 500 SPX, +1.00% added 24.52 points, or 1%, to close at 2,465.84. The best performers were technology shares XLK, +1.59% and real-estate stocks.


© 2000-2026. All rights reserved.
This site is managed by Teletrade D.J. LLC 2351 LLC 2022 (Euro House, Richmond Hill Road, Kingstown, VC0100, St. Vincent and the Grenadines).
The information on this website is for informational purposes only and does not constitute any investment advice.
The company does not serve or provide services to customers who are residents of the US, Canada, Iran, The Democratic People's Republic of Korea, Yemen and FATF blacklisted countries.
Making transactions on financial markets with marginal financial instruments opens up wide possibilities and allows investors who are willing to take risks to earn high profits, carrying a potentially high risk of losses at the same time. Therefore you should responsibly approach the issue of choosing the appropriate investment strategy, taking the available resources into account, before starting trading.
Use of the information: full or partial use of materials from this website must always be referenced to TeleTrade as the source of information. Use of the materials on the Internet must be accompanied by a hyperlink to teletrade.org. Automatic import of materials and information from this website is prohibited.
Please contact our PR department if you have any questions or need assistance at pr@teletrade.global.
transfers