- Analytics
- News and Tools
- Market News
CFD Markets News and Forecasts — 27-02-2018
(raw materials / closing price /% change)
Oil 62.82-1.71%
Gold 1,319.60-0.99%
(index / closing price / change items /% change)
Nikkei +236.23 22389.86 +1.07%
TOPIX +15.53 1790.34 +0.88%
Hang Seng -229.94 31268.66 -0.73%
CSI 300 -59.44 4058.98 -1.44%
KOSPI -1.51 2456.14 -0.06%
Euro Stoxx 50 -5.15 3458.03 -0.15%
FTSE 100 -7.13 7282.45 -0.10%
DAX -36.31 12490.73 -0.29%
CAC 40 -0.33 5343.93 -0.01%
DJIA -299.24 25410.03 -1.16%
S&P 500 -35.32 2744.28 -1.27%
NASDAQ -91.11 7330.36 -1.23%
(pare/closed(GMT +2)/change, %)
EUR/USD $1,2233 -0,69%
GBP/USD $1,3908 -0,41%
USD/CHF Chf0,93891 +0,10%
USD/JPY Y107,32 +0,35%
EUR/JPY Y131,28 -0,34%
GBP/JPY Y149,27 -0,06%
AUD/USD $0,7788 -0,83%
NZD/USD $0,7233 -0,96%
USD/CAD C$1,27738 +0,71%
00:00 New Zealand ANZ Business Confidence January -37.8
00:01 United Kingdom Gfk Consumer Confidence February -9 -10
00:30 Australia Private Sector Credit, m/m January 0.3% 0.4%
00:30 Australia Private Sector Credit, y/y January 4.8%
01:00 China Non-Manufacturing PMI February 55.3 55.0
01:00 China Manufacturing PMI February 51.3 51.2
05:00 Japan Housing Starts, y/y January -2.1% -5%
05:00 Japan Construction Orders, y/y January -8.1%
07:00 United Kingdom Nationwide house price index February 0.6% 0.2%
07:00 United Kingdom Nationwide house price index, y/y February 3.2% 2.6%
07:00 Germany Gfk Consumer Confidence Survey March 11.0 10.9
07:00 Switzerland UBS Consumption Indicator January 1.69
07:45 France Consumer spending January -1.2% 0.4%
07:45 France CPI, y/y (Preliminary) February 1.3%
07:45 France CPI, m/m (Preliminary) February -0.1%
07:45 France GDP, q/q (Revised) Quarter IV 0.5% 0.6%
08:00 Switzerland KOF Leading Indicator February 106.9 106.1
08:55 Germany Unemployment Rate s.a. February 5.4% 5.4%
08:55 Germany Unemployment Change February -25 -15
09:00 Switzerland Credit Suisse ZEW Survey (Expectations) February 34.5
10:00 Eurozone Harmonized CPI, Y/Y (Preliminary) February 1.3% 1.2%
10:00 Eurozone Harmonized CPI ex EFAT, Y/Y (Preliminary) February 1%
13:30 Canada Industrial Product Price Index, m/m January -0.1% 0.5%
13:30 Canada Industrial Product Price Index, y/y January 2.2%
13:30 U.S. PCE price index, q/q (Revised) Quarter IV 1.5% 2.8%
13:30 U.S. PCE price index ex food, energy, q/q (Revised) Quarter IV 1.3% 1.9%
13:30 U.S. GDP, q/q (Revised) Quarter IV 3.2% 2.5%
14:45 U.S. Chicago Purchasing Managers' Index February 65.7 64.2
15:00 U.S. Pending Home Sales (MoM) January 0.5% 0.3%
15:30 U.S. Crude Oil Inventories February -1.616 2.675
22:30 Australia AIG Manufacturing Index February 58.7
23:50 Japan Capital Spending Quarter IV 4.2% 3.1%
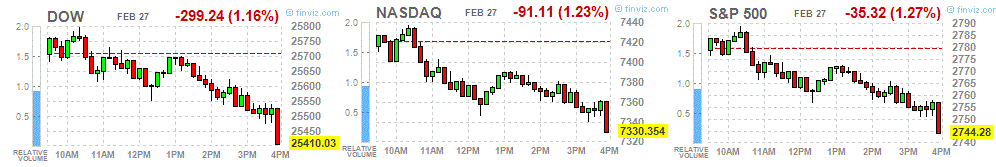
Major US stock indexes fell by more than 1% on Tuesday, as the yield on US bonds rose after new Fed chairman Jerome Powell said the economy is growing and inflation is on the rise.
Powell, in a prepared appeal to Congress, said that the rate hike should continue despite an additional stimulus from tax cuts and government spending. Powell spoke positively about the US economy, pointing out that it is growing at a significant pace.
In addition, demand for durable goods fell in January, with the carefully monitored indicator of investment in US business falling for the second consecutive month, offering one of the first signs of how business owners will respond to the additional cash and incentives offered tax reform of the Trump administration. General orders for durable goods, industrial goods with a life expectancy of at least three years, decreased by 3.7% in January, compared with the previous month, according to seasonal fluctuations, the Ministry of Commerce said. Economists had expected a 2% decline.
However, the national housing price index from S & P / Case-Shiller increased seasonally by 0.7% during the three-month period ending December and rose 6.4% compared to the previous year. The index for 20 cities increased seasonally by 0.6% for the month and 6.3% for the year.
It is also worth noting that the index of consumer confidence from the Conference Board grew in February, after a slight increase in January. The index is now 130.8 compared to 124.3 in January. The index of the current situation increased from 154.7 to 162.4, and the index of expectations improved from 104.0 to 109.7.
Almost all components of the DOW index finished trading in the red (28 of 30). Outsider were shares of The Walt Disney Company (DIS, -4.47%). The leader of growth was shares of Intel Corporation (INTC, + 1.69%).
All S & P sectors recorded a decline. Most of all, the service sector fell (-1.9%).
At closing:
Dow -1.16% 25,410.03 -299.24
Nasdaq -1.23% 7,330.35 -91.11
S & P -1.27% 2,744.28 -35.32
The Conference Board Consumer Confidence Index increased in February, following a modest increase in January. The Index now stands at 130.8 (1985=100), up from 124.3 in January. The Present Situation Index increased from 154.7 to 162.4, while the Expectations Index improved from 104.0 last month to 109.7 this month.
U.S. stock-index futures fell on Tuesday, as the release of Federal Reserve Chairman Jerome Powell's written testimony signaled that the central bank can continue gradually raising interest rates.
Global Stocks:
Nikkei 22,389.86 +236.23 +1.07%
Hang Seng 31,268.66 -229.94 -0.73%
Shanghai 3,291.53 -38.05 -1.14%
S&P/ASX 6,056.90 +14.70 +0.24%
FTSE 7,290.37 +0.79 +0.01%
CAC 5,337.52 -6.74 -0.13%
DAX 12,474.14 -52.90 -0.42%
Crude $63.63 (-0.44%)
Gold $1,330.80 (-0.15%)
U.S. house prices rose 1.6 percent in the fourth quarter of 2017 according to the Federal Housing Finance Agency (FHFA) House Price Index (HPI). House prices rose 6.7 percent from the fourth quarter of 2016 to the fourth quarter of 2017. FHFA's seasonally adjusted monthly index for December was up 0.3 percent from November.
The HPI is calculated using home sales price information from mortgages sold to, or guaranteed by, Fannie Mae and Freddie Mac.
"Home price appreciation in the fourth quarter showed absolutely no letup throughout the U.S.," said Dr. Andrew Leventis, Deputy Chief Economist. "As we begin to evaluate home prices in the first quarter, we will monitor whether new headwinds - higher mortgage rates and changes in tax laws - will lead to any moderation in the rate of house price growth."
(company / ticker / price / change ($/%) / volume)
| 3M Co | MMM | 244.47 | 0.33(0.14%) | 1539 |
| ALCOA INC. | AA | 46.5 | -0.18(-0.39%) | 1887 |
| ALTRIA GROUP INC. | MO | 65.36 | -0.07(-0.11%) | 1176 |
| Amazon.com Inc., NASDAQ | AMZN | 1,524.03 | 2.08(0.14%) | 66904 |
| American Express Co | AXP | 101.75 | 0.11(0.11%) | 1011 |
| Apple Inc. | AAPL | 178.9 | -0.07(-0.04%) | 216668 |
| AT&T Inc | T | 37.35 | -0.11(-0.29%) | 3266 |
| Barrick Gold Corporation, NYSE | ABX | 12.14 | -0.05(-0.41%) | 41575 |
| Boeing Co | BA | 363.75 | 0.27(0.07%) | 6331 |
| Caterpillar Inc | CAT | 163 | -0.69(-0.42%) | 5925 |
| Cisco Systems Inc | CSCO | 45.38 | 0.02(0.04%) | 22600 |
| Citigroup Inc., NYSE | C | 77.55 | -0.10(-0.13%) | 3094 |
| Deere & Company, NYSE | DE | 166.81 | -0.65(-0.39%) | 461 |
| Exxon Mobil Corp | XOM | 78.81 | -0.03(-0.04%) | 3219 |
| Facebook, Inc. | FB | 184.75 | -0.18(-0.10%) | 29159 |
| Ford Motor Co. | F | 10.84 | -0.05(-0.46%) | 8774 |
| Freeport-McMoRan Copper & Gold Inc., NYSE | FCX | 19.31 | -0.22(-1.13%) | 16089 |
| General Electric Co | GE | 14.59 | -0.06(-0.41%) | 183476 |
| Goldman Sachs | GS | 269.69 | -1.57(-0.58%) | 1260 |
| Google Inc. | GOOG | 1,141.01 | -2.74(-0.24%) | 4046 |
| Hewlett-Packard Co. | HPQ | 23.41 | -0.05(-0.21%) | 2244 |
| Home Depot Inc | HD | 188.45 | -0.01(-0.01%) | 3086 |
| Intel Corp | INTC | 49.26 | 0.15(0.31%) | 57367 |
| International Business Machines Co... | IBM | 158.02 | -0.56(-0.35%) | 717 |
| Johnson & Johnson | JNJ | 131.67 | -0.40(-0.30%) | 1065 |
| JPMorgan Chase and Co | JPM | 118.58 | -0.19(-0.16%) | 49701 |
| McDonald's Corp | MCD | 163.9 | 0.32(0.20%) | 2730 |
| Merck & Co Inc | MRK | 56.19 | 0.13(0.23%) | 628 |
| Microsoft Corp | MSFT | 95.48 | 0.06(0.06%) | 15428 |
| Nike | NKE | 69.77 | 0.12(0.17%) | 4331 |
| Procter & Gamble Co | PG | 81.77 | 0.14(0.17%) | 484 |
| Starbucks Corporation, NASDAQ | SBUX | 57.38 | 0.21(0.37%) | 2090 |
| Tesla Motors, Inc., NASDAQ | TSLA | 356 | -1.42(-0.40%) | 21716 |
| Travelers Companies Inc | TRV | 142.96 | 0.38(0.27%) | 712 |
| Twitter, Inc., NYSE | TWTR | 32.05 | -0.11(-0.34%) | 30436 |
| Verizon Communications Inc | VZ | 49.2 | 0.11(0.22%) | 3291 |
| Wal-Mart Stores Inc | WMT | 93.39 | 0.27(0.29%) | 17513 |
| Walt Disney Co | DIS | 108 | -1.81(-1.65%) | 43707 |
| Yandex N.V., NASDAQ | YNDX | 42.15 | 0.15(0.36%) | 3250 |
-
Fed does not see recent tightening of financial conditions as weighing heavily on outlook for economy, jobs and inflation
-
He finds monetary policy rules helpful
-
Fed's balance sheet normalization program has been proceeding smoothly
-
Financial conditions remain accommodative despite recent financial volatility
-
Higher monthly inflation readings toward end of last year were consistent with view that shortfall was transitory
-
Fed still sees some of last year's inflation shortfall as reflecting transitory influences not expected to be repeated
New orders for manufactured durable goods in January decreased $9.2 billion or 3.7 percent to $239.7 billion, the U.S. Census Bureau announced today. This decrease, down following two consecutive monthly increases, followed a 2.6 percent December increase. Excluding transportation, new orders decreased 0.3 percent. Excluding defense, new orders decreased 2.7 percent. Transportation equipment, also down following two consecutive monthly increases, led the decrease, $8.6 billion or 10.0 percent to $77.7 billion.
The inflation rate in Germany as measured by the consumer price index is expected to be 1.4% in February 2018. Based on the results available so far, the Federal Statistical Office (Destatis) also reports that the consumer prices are expected to increase by 0.5% on January 2018.
In February 2018, the harmonised index of consumer prices for Germany, which is calculated for European purposes, is expected to increase by 1.2% year on year and 0.5% on January 2018.
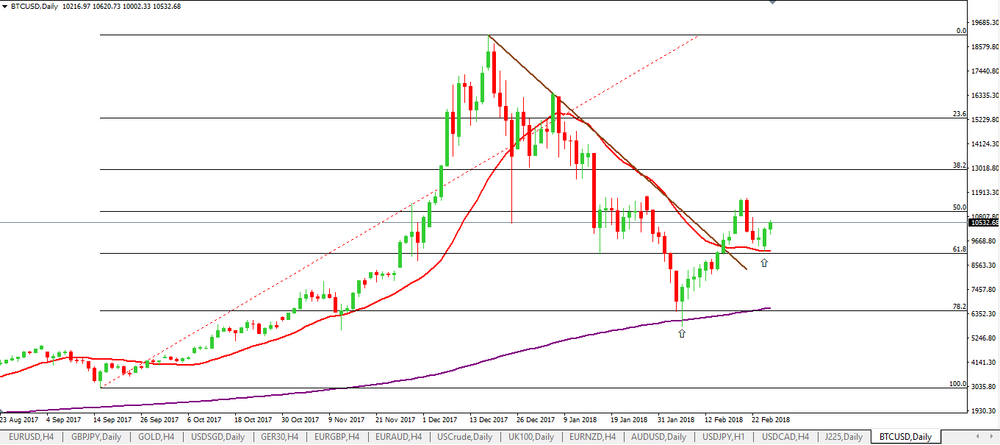
On daily time frame chart, we can see that Bitcoin is giving again signs of a possible new bullish trend after the last bearish month.
We can see on the chart that the price has rejected the fibonacci's levels 78.2% and the Moving Average (SMA 200).
Besides that, we also can see that the price has broken the downside trend line.
Therefore, we can expect a further bullish movement on BTC/USD.
The annual growth rate of the broad monetary aggregate M3 stood at 4.6% in January 2018, unchanged from the previous month.
The annual growth rate of the narrower aggregate M1, which includes currency in circulation and overnight deposits, increased to 8.9% in January, from 8.7% in December.
The annual growth rate of adjusted loans to households stood at 2.9% in January, unchanged from the previous month.
The annual growth rate of adjusted loans to non-financial corporations increased to 3.4% in January, from 3.1% in December.
-
says that level of danish banks' problem loans will fall below 1.8% of gross loans in 2018, compared with a post-crisis peak of 4.3% in 2013
According to the flash estimate issued by the INE, the annual inflation of the CPI in February 2018 was 1.1%. This indicator provides a preview of the CPI that, if confirmed, would imply an increase of five tenths in the annual rate, since in January this change was 0.6%. This behaviour highlights the decrease in the prices of electricity compared to the decrease of prices of 2017.
In turn, the annual variation of the flash estimate of the HICP in February stands at 1.2%. If confirmed, the annual rate of the HICP would increase five tenths as compared to the previous month.
EUR/USD
Resistance levels (open interest**, contracts)
$1.2449 (3862)
$1.2420 (2374)
$1.2379 (2606)
Price at time of writing this review: $1.2343
Support levels (open interest**, contracts):
$1.2279 (6696)
$1.2257 (2159)
$1.2230 (5592)
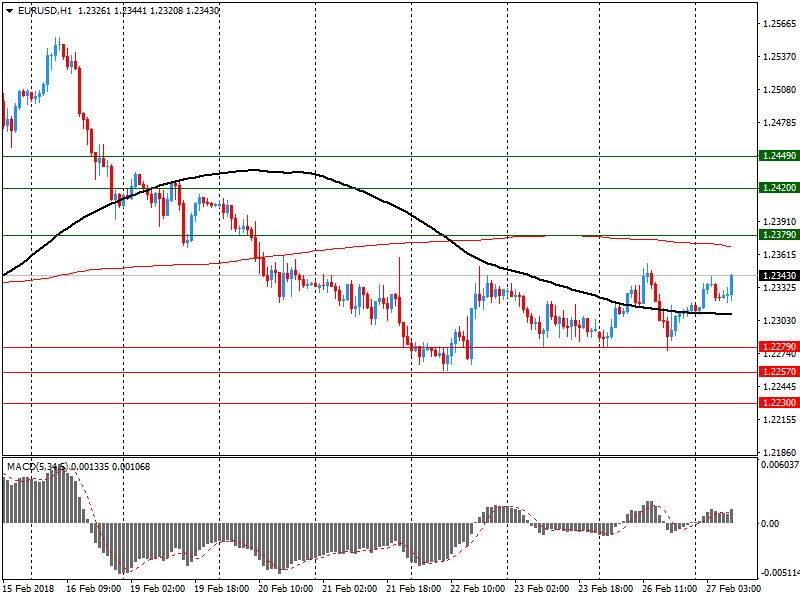
Comments:
- Overall open interest on the CALL options and PUT options with the expiration date March, 9 is 131060 contracts (according to data from February, 26) with the maximum number of contracts with strike price $1,2400 (6696);
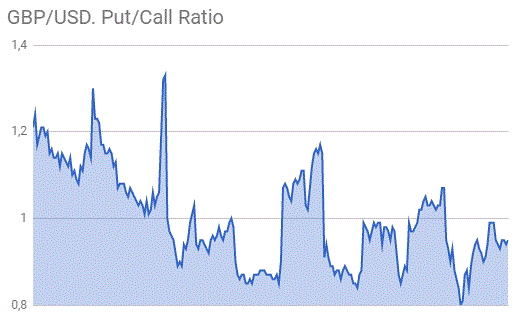
GBP/USD
Resistance levels (open interest**, contracts)
$1.4107 (2290)
$1.4077 (1875)
$1.4032 (3737)
Price at time of writing this review: $1.3987
Support levels (open interest**, contracts):
$1.3933 (1648)
$1.3897 (1800)
$1.3842 (2313)
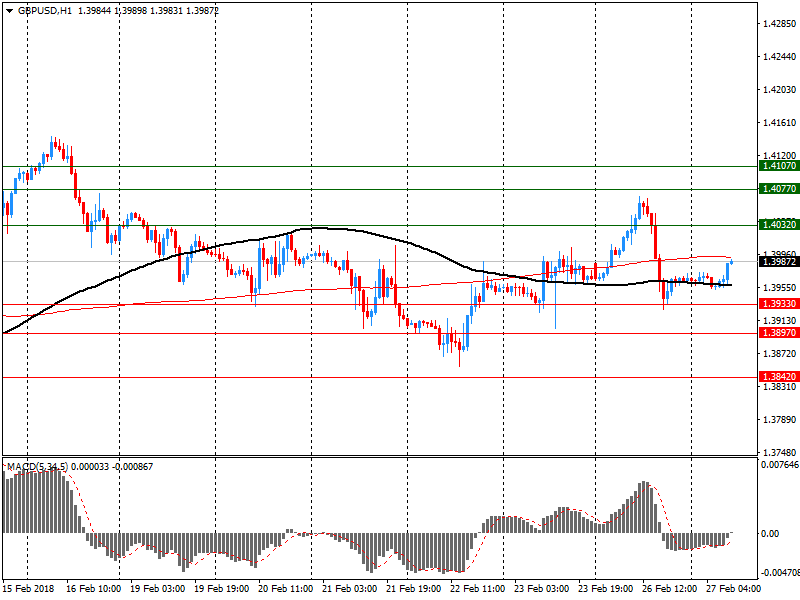
Comments:
- Overall open interest on the CALL options with the expiration date March, 9 is 52364 contracts, with the maximum number of contracts with strike price $1,3900 (3737);
- Overall open interest on the PUT options with the expiration date March, 9 is 48361 contracts, with the maximum number of contracts with strike price $1,3900 (2313);
- The ratio of PUT/CALL was 0.92 versus 0.95 from the previous trading day according to data from February, 26
* - The Chicago Mercantile Exchange bulletin (CME) is used for the calculation.
** - Open interest takes into account the total number of option contracts that are open at the moment.
The monthly trade balance was a deficit of $566 million (13 percent of exports).
The annual trade deficit was $3.2 billion in January 2018, up from $2.9 billion in December 2017, and down from $3.4 billion in January 2017.
Goods exports rose $373 million (9.5 percent) to $4.3 billion in January 2018. This was a new high for a January month, exceeding the previous high of $4.1 billion in January 2014. This record follows on from the all-time high of $5.5 billion for December 2017.
Milk powder, butter, and cheese led the rise, up $101 million (8.0 percent) to $1.4
Goods imports rose $713 million (17 percent) to $4.9 billion in January 2018.
The largest changes in import values were:
Mechanical machinery and equipment, which led the rise - up $133 million (23 percent) to $700 million. The increase was across a range of commodities, including turbo-jets and food processing machinery.
Petroleum and products rose $88 million, led by diesel (up $57 million) and motor spirit (up $24 million). Imports of these products from the Republic of Korea rose $113 million, led by diesel.
Ships, boats, and floating structures rose $78 million.billion.
-
Says global growth risks heightened from trade disputes, technology change, monetary policy normalization


© 2000-2026. All rights reserved.
This site is managed by Teletrade D.J. LLC 2351 LLC 2022 (Euro House, Richmond Hill Road, Kingstown, VC0100, St. Vincent and the Grenadines).
The information on this website is for informational purposes only and does not constitute any investment advice.
The company does not serve or provide services to customers who are residents of the US, Canada, Iran, The Democratic People's Republic of Korea, Yemen and FATF blacklisted countries.
Making transactions on financial markets with marginal financial instruments opens up wide possibilities and allows investors who are willing to take risks to earn high profits, carrying a potentially high risk of losses at the same time. Therefore you should responsibly approach the issue of choosing the appropriate investment strategy, taking the available resources into account, before starting trading.
Use of the information: full or partial use of materials from this website must always be referenced to TeleTrade as the source of information. Use of the materials on the Internet must be accompanied by a hyperlink to teletrade.org. Automatic import of materials and information from this website is prohibited.
Please contact our PR department if you have any questions or need assistance at pr@teletrade.global.
transfers