- Analytics
- News and Tools
- Market News
CFD Markets News and Forecasts — 30-07-2021
On Monday, at 00:30 GMT, Japan will present the manufacturing PMI for July. At 01:00 GMT, in Australia, inflation data from MI for July will be released, and at 01:30 GMT - the index of the number of vacancies from ANZ for July. At 01:45 GMT, China will publish the PMI index for the manufacturing sector from Caixin for July. At 05:00 GMT, Japan will release the consumer confidence indicator for July. At 06:00 GMT, Germany will announce the change in retail trade for June. At 06:30 GMT, Switzerland will report on the change in retail trade for June. Also at 06:30 GMT, Switzerland will publish the consumer price index for July. Then the focus will be on the manufacturing PMI for July: Switzerland will report at 07:30 GMT, France at 07:50 GMT, Germany at 07:55 GMT, the eurozone at 08:00 GMT, Britain at 08:30 GMT, and the United States at 13:45 GMT. At 14:00 GMT, the US will publish the ISM manufacturing index for July. Also at 14:00 GMT, the US will announce a change in construction spending for June. At 23:30 GMT, Japan will release the Tokyo consumer price index for July.
On Tuesday, at 01:30 GMT, Australia will announce a change in construction permits for June. At 04:30 GMT, in Australia, the RBA's interest rate decision will be announced. At 07:00 GMT, Switzerland will release the SECO consumer sentiment index for the 3rd quarter. At 09:00 GMT, the eurozone will publish the producer price index for June. At 14:00 GMT, the US will report a change in the factory orders for June. At 22:30 GMT, Australia will present the AiG construction activity index for July. At 22:45 GMT, New Zealand will announce changes in the unemployment rate and the number of people employed for the 2nd quarter.
On Wednesday, at 00:30 GMT, Japan will release the index of business activity in the services sector for July. At 01:30 GMT, Australia will report on the change in retail trade for June. At 01:45 GMT, China will present the index of business activity in the services sector from Caixin for July. Then the focus will be on the indices of business activity in the services sector for July: France will report at 07:50 GMT, Germany at 07:55 GMT, the eurozone at 08:00 GMT, and the Britain at 08:30 GMT. At 09:00 GMT, the eurozone will announce a change in the volume of retail trade for June. At 12:15 GMT, the US will announce a change in the number of employees from ADP for July. At 12:30 GMT, Canada will report on the change in the volume of construction permits for June. At 13:45 GMT, the US will present the PMI index for the services sector for July, and at 14:00 GMT - the ISM Non-Manufacturing index for July. At 14:30 GMT, the US will announce a change in oil reserves according to the Ministry of Energy.
On Thursday, at 01:30 GMT, Australia will report a change in the trade balance for June. At 06:00 GMT, Germany will announce a change in the factory orders for June. At 06:45 GMT, France will announce a change in industrial production for June. At 08:30 GMT, Britain will release the PMI index for the construction sector for July. At 11:00 GMT, in Britain, the Bank of England's interest rate decision will be announced. At 12:30 GMT, the US and Canada will report a change in the trade balance for June. Also at 12: 30 GMT, the US will announce a change in the number of initial applications for unemployment benefits. At 22:30 GMT, Australia will release the AiG services activity index for July. At 23:00 GMT, in Australia, the head of the RBA Lowe will give a speech. At 23:30 GMT, Japan will report on changes in labor cash earnings and household spending for June.
On Friday, at 01:30 GMT, Australia will release the RBA Monetary Policy Statement. At 06:00 GMT, Germany will announce a change in industrial production for June. Also at 06:00 GMT, in Britain, the Halifax house price index for July will be released. At 06:45 GMT, France will report a change in the non-farm payrolls for the 2nd quarter and the foreign trade balance for June. At 07:00 GMT, Switzerland will announce a change in the SNB's foreign currency reserves for July. At 12:30 GMT, Canada will announce a changes in the unemployment rate and the number of people employed for July. Also at 12:30 GMT, the US will report changes in the unemployment rate and the non-farm payrolls for July. At 14:00 GMT, Canada will present the Ivey Managers ' Business Activity index for July. Also at 14:00 GMT, the United States will announce a change in wholesale inventories for June. At 17:00 GMT, in the United States, the Baker Hughes report on the number of active oil drilling rigs will be released. At 19:00 GMT, the US will report on the change in the volume of consumer lending for June.
MNI
Indicators’ report revealed on Friday that business activity in Chicago expanded
in July at a faster pace than in June.
The
MNI Chicago Business Barometer, also known as Chicago purchasing manager's
index (PMI) came in at 73.4 in July, up from an unrevised 66.1 in June. This represented both a two-month
high and the second highest pandemic-era reading.
Economists
had forecast the index to drop to 64.6.
A
reading above 50 indicates improving conditions, while a reading below this
level shows worsening of the situation.
According
to the report, Production (+8.8 points) recorded the largest gain in July,
followed by New Orders (+5.4 points), while Supplier Deliveries remained
unchanged. Elsewhere, Order Backlogs (+3.4 points) advanced, hitting a two-month
high; Inventories (+5.1 points) also gained but remained in contraction territory.
On the price front, Prices paid at the factory gate (-0.3 points) eased
slightly but held at a historically high level.
eFXdata reports that analysts at MUFG Research see limited scope for USD/JPY to trend higher in the near term.
"The swing in July was certainly extreme and unlikely to be replicated but it does highlight one of the fundamental factors limiting the scope for the yen to depreciate on any kind of a sustained basis at levels over 110.00. At the lower bound with investors holding little confidence in the BoJ’s ability to lift inflation, real yields are likely to remain relatively attractive."
"Add to this a structurally stable current account surplus over 3% of GDP and a currency that on many metrics is about 10% undervalued, the prospect of USD/JPY trending higher from here looks limited. Yes, a rebound in US nominal yields can play a role in lifting USD/JPY as correlations show but the correlations weaken at higher levels over 110.00 and over a medium term timeframe, valuation, external positions and real yields suggest downside risks."
The
final reading for the July Reuters/Michigan index of consumer sentiment came in
at 81.2 compared to a preliminary reading of 80.8 and the June final reading of
85.5.
Economists
had forecast the index to be unrevised at 80.8.
According
to the report, the index of consumer expectations fell 5.4 percent m-o-m to 79.0
from June’s final reading of 83.5, while the index of the current economic
conditions declined 4.6 percent m-o-m to 84.5 from June’s final reading of 88.6.
“Consumer
sentiment edged upward at the end of July, although it still posted a monthly
decline of 5.0%,” noted Richard Curtin, Surveys of Consumers chief economist. “The
largest monthly declines remained concentrated in the outlook for the national
economy and complaints about high prices for homes, vehicles, and household
durables,” he added. "While most consumers still expect inflation to be transitory, there is growing evidence that an inflation storm is likely to develop on the not too distant horizon."
- Says Q2 GDP report was very good on the whole
- Says he still expects 7% growth this year
- Says he expects above-trend growth "for quite some time" in US
- Productivity seems much higher and technology is helping that
- There is 'overwhelming' anecdotal evidence of tight labor markets in US, seeing offers of hiring bonuses and other benefits
- Jobs could be fully recovered by next summer, which would meet Fed's condition for raising rates
- The criteria for labor market recovery will be met sooner than many expect even under benign assumptions about growth
- This year's inflation is enough to make up for some of the past downside misses; Fed should "declare success" on meeting average inflation target
- Fed is coming up a little short in preparing for a possible high inflation shock
- Fed should start taper in autumn and go "fairly rapidly" to end taper by the end of Q1
- Ending the taper in early 2022 would open the way for a rate increase if needed
- Financial markets are well prepared for taper
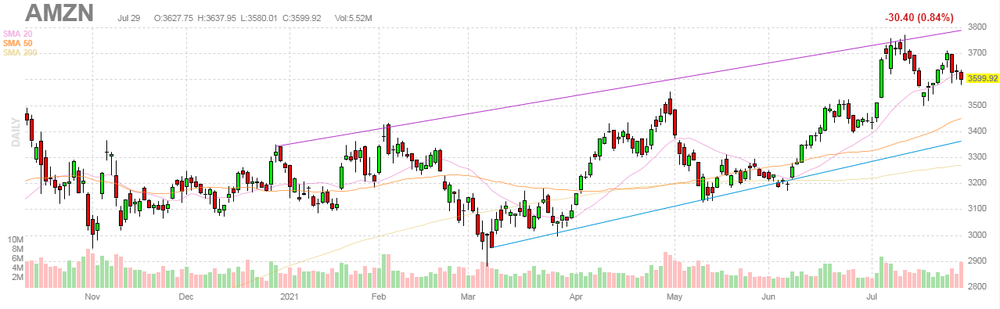
U.S. stock-index futures plunged, as Amazon’s (AMZN) equities came under pressure after the release of the Q2 earnings report, while overall market sentiment worsened after a key inflation indicator revealed accelerating price pressures in June.
Global Stocks:
Index/commodity | Last | Today's Change, points | Today's Change, % |
Nikkei | 27,283.59 | -498.83 | -1.80% |
Hang Seng | 25,961.03 | -354.29 | -1.35% |
Shanghai | 3,397.36 | -14.37 | -0.42% |
S&P/ASX | 7,392.60 | -24.80 | -0.33% |
FTSE | 7,026.32 | -52.10 | -0.74% |
CAC | 6,634.53 | +0.76 | +0.01% |
DAX | 15,539.60 | -100.87 | -0.64% |
Crude oil | $73.53 | -0.12% | |
Gold | $1,826.40 | -0.26% |
(company / ticker / price / change ($/%) / volume)
3M Co | MMM | 197.9 | -0.27(-0.14%) | 1620 |
ALCOA INC. | AA | 39.3 | -0.07(-0.18%) | 122324 |
ALTRIA GROUP INC. | MO | 48.41 | -0.19(-0.39%) | 8056 |
Amazon.com Inc., NASDAQ | AMZN | 3,354.00 | -245.92(-6.83%) | 226231 |
Apple Inc. | AAPL | 144.45 | -1.19(-0.82%) | 696591 |
AT&T Inc | T | 28.18 | -0.11(-0.39%) | 31370 |
Boeing Co | BA | 230.1 | -1.53(-0.66%) | 71256 |
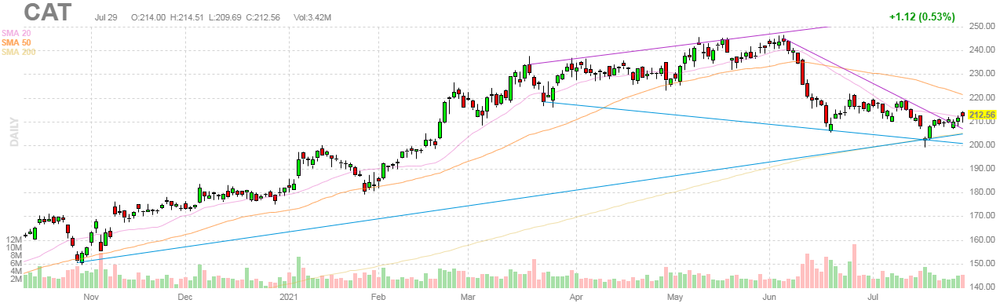
Caterpillar Inc | CAT | 207.6 | -4.96(-2.33%) | 75461 |
Chevron Corp | CVX | 103.85 | 1.28(1.25%) | 184886 |
Cisco Systems Inc | CSCO | 54.93 | -0.14(-0.25%) | 20409 |
Citigroup Inc., NYSE | C | 68.06 | -0.24(-0.35%) | 32838 |
E. I. du Pont de Nemours and Co | DD | 74.75 | -0.34(-0.45%) | 947 |
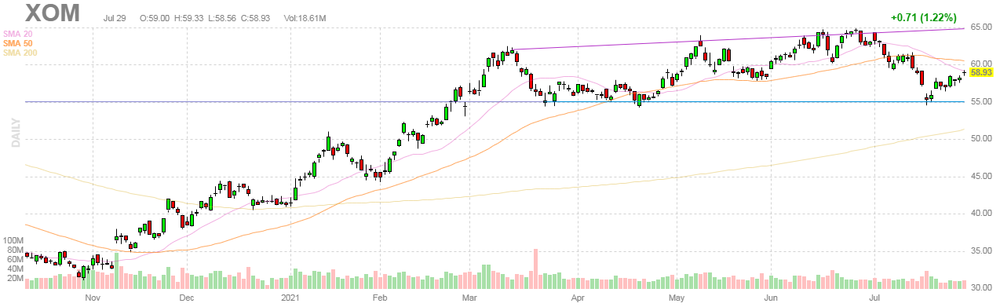
Exxon Mobil Corp | XOM | 59.2 | 0.27(0.46%) | 198156 |
Facebook, Inc. | FB | 354.44 | -3.88(-1.08%) | 127290 |
FedEx Corporation, NYSE | FDX | 280.29 | -1.63(-0.58%) | 3287 |
Ford Motor Co. | F | 14.29 | -0.10(-0.69%) | 372935 |
Freeport-McMoRan Copper & Gold Inc., NYSE | FCX | 38.03 | -0.44(-1.14%) | 74502 |
General Electric Co | GE | 13.19 | -0.10(-0.75%) | 161474 |
General Motors Company, NYSE | GM | 56.93 | -0.35(-0.61%) | 210057 |
Goldman Sachs | GS | 376.07 | -1.48(-0.39%) | 1749 |
Google Inc. | GOOG | 2,718.00 | -12.81(-0.47%) | 5071 |
Home Depot Inc | HD | 325.99 | -1.44(-0.44%) | 2115 |
HONEYWELL INTERNATIONAL INC. | HON | 231.78 | -1.10(-0.47%) | 506 |
Intel Corp | INTC | 53.45 | -0.25(-0.47%) | 61587 |
International Business Machines Co... | IBM | 141.7 | -0.23(-0.16%) | 1651 |
Johnson & Johnson | JNJ | 171.67 | -0.51(-0.30%) | 2508 |
JPMorgan Chase and Co | JPM | 152.5 | -0.50(-0.33%) | 13572 |
McDonald's Corp | MCD | 243 | -1.02(-0.42%) | 2781 |
Merck & Co Inc | MRK | 76.8 | -0.13(-0.17%) | 3924 |
Microsoft Corp | MSFT | 284.57 | -1.93(-0.67%) | 116722 |
Nike | NKE | 166.29 | -0.70(-0.42%) | 6536 |
Pfizer Inc | PFE | 42.78 | -0.01(-0.02%) | 123736 |
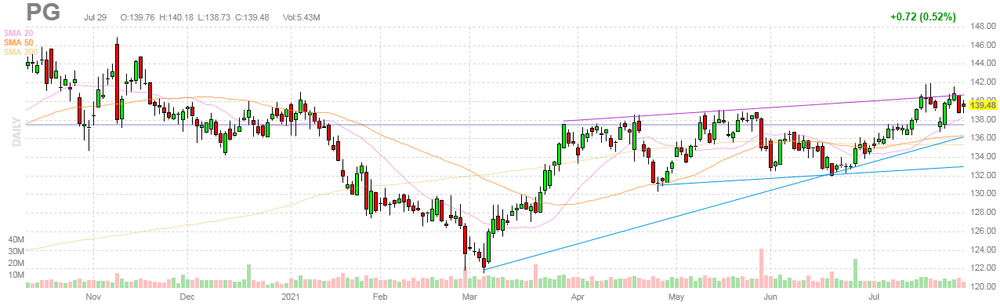
Procter & Gamble Co | PG | 141.24 | 1.76(1.26%) | 78233 |
Starbucks Corporation, NASDAQ | SBUX | 121.9 | -0.48(-0.40%) | 13129 |
Tesla Motors, Inc., NASDAQ | TSLA | 673.83 | -3.52(-0.52%) | 291755 |
The Coca-Cola Co | KO | 56.9 | -0.15(-0.26%) | 10244 |
Travelers Companies Inc | TRV | 148.56 | -0.32(-0.21%) | 158 |
Twitter, Inc., NYSE | TWTR | 69.6 | -0.77(-1.09%) | 26484 |
Verizon Communications Inc | VZ | 55.93 | -0.05(-0.09%) | 54069 |
Visa | V | 246.76 | -1.16(-0.47%) | 7409 |
Wal-Mart Stores Inc | WMT | 141.24 | -1.00(-0.70%) | 37012 |
Walt Disney Co | DIS | 177.63 | -0.72(-0.40%) | 14309 |
Yandex N.V., NASDAQ | YNDX | 67.57 | -1.37(-1.99%) | 3083 |
Statistics
Canada announced on Friday that the country’s gross domestic product (GDP) fell
0.3 percent m-o-m in May, following a revised 0.5 percent m-o-m drop in April (originally
a 0.3 percent m-o-m decrease).
This was
in line with economists’ forecast for a 0.3 percent m-o-m decline. Total
economic activity was approximately 2 percent below its pre-pandemic level.
In
y-o-y terms, the Canadian GDP surged 14.6 percent in May.
According
to the report, both services-producing (-0.2 percent m-o-m) and goods-producing
industries (-0.4 percent m-o-m) posted declines in May. Overall, 12 of the 20
industrial sectors were down.
It
was also reported that preliminary data indicates an approximate 0.7 percent
m-o-m advance in real GDP for June.
The
Commerce Department reported on Friday that consumer spending in the U.S. climbed
1.0 percent m-o-m in June after a revised 0.1 percent m-o-m drop in May
(originally unchanged m-o-m). This marked the biggest monthly rise in consumer
spending since March. Economists had forecast the reading to show a 0.7 percent
m-o-m gain.
Meanwhile,
consumer income edged up 0.1 percent m-o-m in June, following a revised 2.2
percent m-o-m drop in the previous month (originally a 2.0 percent m-o-m decline).
This marked the first monthly increase in consumer income in the last three months. Economists had forecast a 0.3 percent m-o-m decrease.
The June
advance in personal income primarily reflected a gain in compensation of
employees. Meanwhile, government social benefits fell in June.
The
personal consumption expenditures (PCE) price index, excluding the volatile
categories of food and energy, which is the Fed's preferred inflation measure, rose
0.4 percent m-o-m in June, following an unrevised 0.5 percent m-o-m increase in
May.
Economists had projected the index would advance 0.6 percent m-o-m.
In the 12 months through June, the core PCE surged
3.5 percent, accelerating from an unrevised 3.4 percent in the 12 months
through May.
Economists had forecast a jump of 3.7 percent y-o-y.
| Time | Country | Event | Period | Previous value | Forecast | Actual |
|---|---|---|---|---|---|---|
| 05:30 | France | GDP, q/q | Quarter II | 0.0% | 0.8% | 0.9% |
| 06:45 | France | CPI, y/y | July | 1.5% | 1% | 1.2% |
| 06:45 | France | CPI, m/m | July | 0.1% | -0.1% | 0.1% |
| 07:00 | Switzerland | KOF Leading Indicator | July | 133.3 | 130 | 129.8 |
| 08:00 | Germany | GDP (QoQ) | Quarter II | -2.1% | 2% | 1.5% |
| 08:00 | Germany | GDP (YoY) | Quarter II | -3.1% | 9.6% | 9.2% |
| 09:00 | Eurozone | Unemployment Rate | June | 8% | 7.9% | 7.7% |
| 09:00 | Eurozone | Harmonized CPI ex EFAT, Y/Y | July | 0.9% | 0.8% | 0.7% |
| 09:00 | Eurozone | Harmonized CPI, Y/Y | July | 1.9% | 2% | 2.2% |
| 09:00 | Eurozone | Harmonized CPI | July | 0.3% | -0.1% | |
| 09:00 | Eurozone | GDP (YoY) | Quarter II | -1.3% | 13.2% | 13.7% |
| 09:00 | Eurozone | GDP (QoQ) | Quarter II | -0.3% | 1.5% | 2% |
EUR strengthened against most of its major rivals in the European session on Friday, as investors digested a raft of important economic data out of the Eurozone, including Q2 GDP, June jobless rate and July CPI.
Eurostat reported its preliminary estimates showed that the Eurozone’s GDP grew 2% q/q in the second quarter, rebounding from two consecutive periods of contractions (-0.6% q/q in 4Q2020 and -0.3% q/q in 1Q2021). Economists had expected a 1.5% q/q growth. On a y/y basis, the region’s GDP recovered 13.7%, also exceeding economists’ forecast of 13.2% advance.
In a separate report, Eurostat announced that the euro area's annual inflation rate increased to 2.2% in July from 1.9% in the previous month. This was the highest reading since October of 2018 and exceeded economists’ forecast of 2%. Meanwhile, annual core inflation, which excludes energy, food, alcohol and tobacco, dropped to 0.7% this month from 0.9% in June. The rate was expected to ease to 0.8%.
In addition, Eurostat’s estimates revealed that the region’s unemployment rate dropped to 7.7% in June from a revised 8.0% in May (originally 7.9%). This was the lowest reading since May 2020 and below economists’ forecast of 7.9%.
Exxon Mobil (XOM) reported Q2 FY 2021 earnings of $1.10 per share (versus -$0.70 per share in Q2 FY 2020), beating analysts’ consensus estimate of $0.98 per share.
The company’s quarterly revenues amounted to $67.742 bln (+107.8% y/y), beating analysts’ consensus estimate of $63.962 bln.
XOM rose to $59.46 (+0.90%) in pre-market trading.
FXStreet reports that in the opinion of Karen Jones, Team Head FICC Technical Analysis Research at Commerzbank, EUR/USD could now attempt to test the 1.1930/85 band.
“EUR/USD maintained its near term move higher yesterday. The Elliott wave count still has this as being a correction only but are allowing now for a move into the 1.1930/85 band. It will need to regain the 200-day ma and the 50% retracement at 1.2008/15 to reassert upside pressure and attention to the 1.2266 May high.”
Procter & Gamble (PG) reported Q4 FY 2021 earnings of $1.13 per share (versus $1.16 per share in Q4 FY 2020), beating analysts’ consensus estimate of $1.09 per share.
The company’s quarterly revenues amounted to $18.946 bln (+7.1% y/y), beating analysts’ consensus estimate of $18.376 bln.
PG rose to $140.50 (+0.73%) in pre-market trading.
FXStreet reports that FX Strategists at UOB Group suggest that AUD/USD remains side-lined between 0.7320 and 0.7450 for the next weeks.
24-hour view: “We highlighted yesterday that AUD ‘could test 0.7390 but a sustained rise above this level is unlikely’. We added, ‘the next resistance at 0.7420 is not expected to come into the picture’. Our view was not wrong even though the subsequent AUD strength exceeded our expectation as it came within a few pips of 0.7420 (overnight high of 0.7414). While overbought, the advance has room to test 0.7420 first before easing.”
Next 1-3 weeks: “Our view from a week ago (23 Jul, spot at 0.7385) where AUD could trade between 0.7320 and 0.7450 for a period of time still stands. That said, shorter-term upward momentum is beginning to improve and the upside risk has increased. However, AUD has to close above 0.7450 before a sustained advance can be expected. The prospect for AUD to close above 0.7450 is not high for now but would remain intact as long as AUD does not move below 0.7355 within these couple of days.”
Caterpillar (CAT) reported Q2 FY 2021 earnings of $2.60 per share (versus $1.03 per share in Q2 FY 2020), beating analysts’ consensus estimate of $2.41 per share.
The company’s quarterly revenues amounted to $12.889 bln (+28.9% y/y), beating analysts’ consensus estimate of $12.528 bln.
CAT fell to $212.17 (-0.18%) in pre-market trading.
FXStreet reports that Karen Jones, Team Head FICC Technical Analysis Research at Commerzbank, notes that in the light of the recent price action USD/CHF could now move into a consolidative phase.
“USD/CHF has sold off aggressively following its recent failure at the 4-month downtrend at .9213 and has now closed below the .9074 200 day ma but is holding around the 61.8% retracement at .9059. We should see some consolidation here, the Elliott wave count is implying that this is the end of the move lower.”
“Below .9054/46, (the late May and early June highs as well as the early February high) will target the 78.6% retracement at .9000.”
Chevron (CVX) reported Q2 FY 2021 earnings of $1.71 per share (versus -$1.59 per share in Q2 FY 2020), beating analysts’ consensus estimate of $1.60 per share.
The company’s quarterly revenues amounted to $37.597 bln (+169.5% y/y), beating analysts’ consensus estimate of $35.976 bln.
CVX rose to $103.80 (+1.20%) in pre-market trading.

FXStreet reports that UOB Group’s FX Strategists note that USD/JPY is still expected to navigate within the 109.20/110.60 range in the next weeks.
24-hour view: “We expected USD to weaken yesterday but we were of the view that ‘any decline is not expected to break the support at 109.50’. The subsequent weakness exceeded our expectations as USD took out 109.50 and dropped to 109.41. While the decline is oversold, further USD weakness is not ruled out. However, a break of the major support at 109.20 is unlikely.”
Next 1-3 weeks: “...USD could trade within a 109.20/110.60 range for now. While shorter-term downward momentum has improved somewhat, USD has to close below 109.05 before a sustained decline can be expected. The prospect for USD to close below 109.05 is not high but it would remain intact as long as USD does not move above 110.00 within these few days.”
Amazon (AMZN) reported Q2 FY 2021 earnings of $15.12 per share (versus $10.30 per share in Q2 FY 2020), beating analysts’ consensus estimate of $12.24 per share.
The company’s quarterly revenues amounted to $113.080 bln (+27.2% y/y), missing analysts’ consensus estimate of $115.082 bln.
AMZN fell to $3380.00 (-6.11%) in pre-market trading.
Reuters reports that China's banking and insurance watchdog said it would seek to stabilise the expectations of foreign investors by continuing with efforts to implement policies designed to expand their market access.
The China Banking and Insurance Regulatory Commission (CBIRC) said it would fully implement planned measures aimed at ensuring overseas investors are treated no less favourably than their Chinese counterparts and which would cut the number of sectors where foreign investment has been prohibited or restricted.
In the 2020 list released by the National Development and Reform Commission, that number of sectors was cut to 123 from 131 the previous year.
After a market rout this week, China has stepped up attempts to calm frayed investor nerves by telling foreign brokerages not to "overinterpret" its latest regulatory actions.
According to the report from Eurostat, in June 2021, the euro area seasonally-adjusted unemployment rate was 7.7%, down from 8.0% in May 2021 and from 8.0% in June 2020. Economists had expected a decrease to 7.9%. The EU unemployment rate was 7.1% in June 2021, down from 7.3% in May 2021 and down from 7.3% in June 2020.
Eurostat estimates that 14.916 million men and women in the EU, of whom 12.517 million in the euro area, were unemployed in June 2021. Compared with May 2021, the number of persons unemployed decreased by 487 000 in the EU and by 423 000 in the euro area. Compared with June 2020, unemployment decreased by 397 000 in the EU and by 339 000 in the euro area.
In June 2021, 2.967 million young persons (under 25) were unemployed in the EU, of whom 2.431 million were in the euro area. In June 2021, the youth unemployment rate was 17.0% in the EU and 17.3% in the euro area, down from 17.6% and 17.9% respectively in the previous month. Compared with May 2021, youth unemployment decreased by 112 000 in the EU and by 78 000 in the euro area. Compared with June 2020, youth unemployment decreased by 152 000 in the EU and by 110 000 in the euro area.
Separate data showed that euro area annual inflation is expected to be 2.2% in July 2021, up from 1.9% in June. Looking at the main components of euro area inflation, energy is expected to have the highest annual rate in July (14.1%, compared with 12.6% in June), followed by food, alcohol & tobacco (1.6%, compared with 0.5% in June), services (0.9%, compared with 0.7% in June) and non-energy industrial goods (0.7%, compared with 1.2% in June).
According to the report from Eurostat, in the second quarter 2021, seasonally adjusted GDP increased by 2.0% in the euro area and by 1.9% in the EU, compared with the previous quarter. Economists had expected a 1.5% increase in the euro area. In the first quarter of 2021, GDP had declined by 0.3% in the euro area and 0.1% in the EU.
Compared with the same quarter of the previous year, seasonally adjusted GDP increased by 13.7% in the euro area and by 13.2% in the EU in the second quarter of 2021, after -1.3% in both zones in the previous quarter. Economists had expected a 13.2% increase in the euro area.
Among the Member States for which data are available for the second quarter 2021, Portugal (+4.9%) recorded the highest increase compared to the previous quarter, followed by Austria (+4.3%) and Latvia (+3.7%), while Lithuania (+0.4%) and Czechia (+0.6%) recorded the lowest increase. The year on year growth rates were positive for all countries.
FXStreet reports that FX Strategists at UOB Group now see USD/CNH returning to the previous consolidative stance, likely within the 6.4400-6.5000 range.
Next 1-3 weeks: “While we noted yesterday that ‘the prospect for USD to move to 6.5500 has diminished’ we did not anticipate the subsequent sharp sell-off to 6.4563. The break of our ‘strong support’ at 6.4820 indicates that the build-up in momentum (when USD soared to 6.5289 on Wednesday) fizzled out quickly. The sharp but short-lived swings have resulted in a mixed outlook and USD could trade within a 6.4400/6.5000 range for now.”
According to the report from Destatis, the gross domestic product (GDP) rose by 1.5% in the second quarter of 2021 on the first quarter of 2021 after adjustment for price, seasonal and calendar variations. Economists had expected a 2.0% increase. After the coronavirus crisis had caused another decline in economic performance at the beginning of 2021 (-2.1% in the first quarter, according to most recent calculations), the German economy recovered in the second quarter. This was mainly due to higher household and government final consumption expenditure.
GDP in the second quarter of 2021 was up a price-adjusted 9.6% and a price- and calendar-adjusted 9.2% compared with the second quarter of 2020, the quarter which was substantially affected by the first lockdown imposed on account of the coronavirus crisis. GDP was still 3.4% lower in the second quarter of 2021 than in the fourth quarter of 2019, the quarter before the coronavirus crisis began.
According to the report from KOF Economic Research Agency, in July, the Economic Barometer falls further below its May peak. Despite this second decline in a row, the barometer level is clearly above the long-term average. The economy is still on a strong expansion path, although the high pace of recent months may not to be sustained.
The KOF Economic Barometer falls by 3.5 points to 129.8 points in July. In June, the barometer stood at 133.3 (revised from 133.4) and in May at 143.6 (revised from 143.7). Despite this second consecutive decline, the KOF Economic Barometer's above-average reading points to a very favourable economic development in the coming months. The outlook for manufacturing, foreign demand, construction, financial and insurance services as well as private consumption remains favourable but is not quite as positive as in the previous month. In contrast, the outlook for accommodation and food service activities and for other services is improving.
In the goods producing sector (manufacturing and construction), indicators for all aspects of business activity are weakening. The clouding is particularly pronounced for the general business situation, the competitive position as well as export and employment prospects.
| Time | Country | Event | Period | Previous value | Forecast | Actual |
|---|---|---|---|---|---|---|
| 01:30 | Australia | Producer price index, y/y | Quarter II | 0.2% | 2.2% | |
| 01:30 | Australia | Producer price index, q / q | Quarter II | 0.4% | 0.7% | |
| 01:30 | Australia | Private Sector Credit, m/m | June | 0.5% | 0.9% | |
| 01:30 | Australia | Private Sector Credit, y/y | June | 1.9% | 3.1% | |
| 05:00 | Japan | Construction Orders, y/y | June | 7.4% | 32.3% | |
| 05:00 | Japan | Housing Starts, y/y | June | 9.9% | 7.2% | 7.3% |
| 05:30 | France | Consumer spending | June | 10.6% | 1.4% | 0.3% |
| 05:30 | France | GDP, q/q | Quarter II | 0.0% | 0.8% | 0.9% |
| 06:45 | France | CPI, y/y | July | 1.5% | 1% | 1.2% |
| 06:45 | France | CPI, m/m | July | 0.1% | -0.1% | 0.1% |
| 07:00 | Switzerland | KOF Leading Indicator | July | 133.3 | 130 | 129.8 |
During today's Asian trading, the US dollar rose slightly against the major currencies, but will remain near a one-month low. In addition, the US dollar may show the worst weekly dynamics since May due to the "dovish" comments of the Federal Reserve System and disappointing US economic data.
The ICE index, which tracks the dynamics of the dollar against sex currencies (euro, swiss franc, yen, canadian dollar, pound sterling and swedish krona), rose by 0.10%.
Since the beginning of the week, the index has lost 1% - the worst result since the beginning of May. In July, it fell by 0.5% after an increase of 2.8% in June.
Fed Chairman Jerome Powell said on Wednesday that there is still "a long way" to raise interest rates, and the labor market has "some way to go."
The euro is trading unchanged against the dollar after rising to a one-month high earlier in the session. Investors are waiting for preliminary data on GDP and inflation in the eurozone, as well as data on unemployment.
According to the report from Insee, over a year, the Consumer Price Index (CPI) should rise by 1.2% in July 2021, after +1.5% in the previous month. Economists had expected a 1.0% increase. This decrease in inflation should result from the downturn in manufactured good prices, linked to the postponed summer sales, the slowdown in the prices of services, and to a lesser extent tobacco. Conversely, the prices of food should rebound and those of energy should accelerate.
Over one month, consumer prices should rise by 0.1% as in June. Economists had expected a 0.1% decrease. The prices of manufactured goods, particularly those of clothing and footwear, and those of tobacco should fall back. The food prices should be stable after a decrease in the previous month. Linked to the summer period, the prices of services should accelerate, as those of energy.
Year on year, the Harmonised Index of Consumer Prices should rise by 1.6% after +1.9% in June. Over one month, it should increase by 0,1% after +0.2% in the previous month.
EUR/USD
Resistance levels (open interest**, contracts)
$1.1969 (2843)
$1.1939 (2093)
$1.1919 (1711)
Price at time of writing this review: $1.1881
Support levels (open interest**, contracts):
$1.1862 (688)
$1.1832 (2754)
$1.1792 (2312)

Comments:
- Overall open interest on the CALL options and PUT options with the expiration date August, 6 is 67237 contracts (according to data from July, 29) with the maximum number of contracts with strike price $1,1700 (10365);
GBP/USD
$1.4117 (1096)
$1.4047 (1652)
$1.4004 (1193)
Price at time of writing this review: $1.3943
Support levels (open interest**, contracts):
$1.3900 (958)
$1.3831 (293)
$1.3789 (830)

Comments:
- Overall open interest on the CALL options with the expiration date August, 6 is 15585 contracts, with the maximum number of contracts with strike price $1,4000 (1652);
- Overall open interest on the PUT options with the expiration date August, 6 is 18714 contracts, with the maximum number of contracts with strike price $1,3400 (1683);
- The ratio of PUT/CALL was 1.20 versus 1.21 from the previous trading day according to data from July, 29
* - The Chicago Mercantile Exchange bulletin (CME) is used for the calculation.
** - Open interest takes into account the total number of option contracts that are open at the moment.
Reuters reports that the U.S. Senate on Thursday prepared to tackle the details of a $1 trillion bipartisan infrastructure bill, with the possibility of weekend work looming after lawmakers agreed to advance the measure.
Another vote was scheduled for 15:30 GMT on Friday to begin debate on the proposal to rebuild America’s roads, ports and bridges, beginning a process that could last for days and could include amendments that change the bill or cloud its chances of passage.
Both Senate Majority Leader Chuck Schumer, a Democrat, and Minority Leader Mitch McConnell, a Republican, were upbeat about the road ahead on the bill, which was brokered by Senate negotiators and White House officials and cleared an important procedural hurdle by a vote of 67-32 on Wednesday.
McConnell, who was among 17 Republicans who voted to advance the measure, called it a “focused compromise” and an “important, basic duty of government.”
Some amendments are expected to be proposed, including on the bill’s broadband internet provisions, the Senate’s number two Republican, John Thune, said, without giving details.
FXStreet reports that FX Strategists at UOB Group said that cable could move into a consolidative phase ahead of a probable test of the 1.4000 level.
Next 1-3 weeks: “We have expected GBP to strengthen since early this week. Yesterday, we highlighted that there is room for GBP to advance further but overbought shorter-term conditions suggest that 1.3955 may not come into the picture so soon. However, GBP quickly and easily cracked 1.3955 as it rose to 1.3982 during NY session. Shorter-term conditions remain overbought and this could lead to a couple of days of consolidation first. As long as 1.3860 (‘strong support’ level was at 1.3800 yesterday) is not breached, an advance to 1.4000 would not be surprising. Looking ahead, the next resistance above 1.4000 is at 1.4050.”
According to the report from Insee, gross domestic product (GDP) rebounded in Q2 2021 (+0.9%), after being stable (0.0%) in Q1. Economists had expected a 0.8% increase. GDP closed more than one fifth of the gap to its pre-crisis level remaining at the end of 2020: in Q2 2021, GDP stood 3.3% below the level of Q4 2019, as compared to 4.2% in the two previous quarters.
Final internal demand (excluding inventory changes) made a positive contribution to GDP growth this quarter (+0.9 points after +0.1 points in the previous quarter). Gross fixed capital formation (GFCF) accelerated (+1.1% after +0.4%), as households’ consumption expenditure (+0.9% after +0.2%).
In Q2 2021, imports (+1.9%) increased more than exports (+1.5%). Overall, foreign trade made a slightly negative contribution to GDP growth this quarter: –0.1 points, after –0.5 points in the previous quarter. Lastly, the contribution of inventory changes to the growth of the GDP was slightly positive this quarter (+0.2 points after +0.4 points in Q1 2021).
| Raw materials | Closed | Change, % |
|---|---|---|
| Brent | 75.28 | 1.36 |
| Silver | 25.473 | 2.08 |
| Gold | 1827.677 | 1.14 |
| Palladium | 2642.03 | 0.83 |
| Time | Country | Event | Period | Previous value | Forecast |
|---|---|---|---|---|---|
| 01:30 (GMT) | Australia | Producer price index, y/y | Quarter II | 0.2% | |
| 01:30 (GMT) | Australia | Private Sector Credit, m/m | June | 0.4% | |
| 01:30 (GMT) | Australia | Producer price index, q / q | Quarter II | 0.4% | |
| 01:30 (GMT) | Australia | Private Sector Credit, y/y | June | 1.9% | |
| 05:00 (GMT) | Japan | Construction Orders, y/y | June | 7.4% | |
| 05:00 (GMT) | Japan | Housing Starts, y/y | June | 9.9% | 7.2% |
| 05:30 (GMT) | France | Consumer spending | June | 10.4% | 1.4% |
| 05:30 (GMT) | France | GDP, q/q | Quarter II | -0.1% | 0.8% |
| 06:45 (GMT) | France | CPI, y/y | July | 1.5% | 1% |
| 06:45 (GMT) | France | CPI, m/m | July | 0.1% | -0.1% |
| 07:00 (GMT) | Switzerland | KOF Leading Indicator | July | 133.4 | 130 |
| 08:00 (GMT) | Germany | GDP (QoQ) | Quarter II | -1.8% | 2% |
| 08:00 (GMT) | Germany | GDP (YoY) | Quarter II | -3.1% | 9.6% |
| 09:00 (GMT) | Eurozone | Unemployment Rate | June | 7.9% | 7.9% |
| 09:00 (GMT) | Eurozone | Harmonized CPI ex EFAT, Y/Y | July | 0.9% | 0.8% |
| 09:00 (GMT) | Eurozone | Harmonized CPI, Y/Y | July | 1.9% | 2% |
| 09:00 (GMT) | Eurozone | Harmonized CPI | July | 0.3% | |
| 09:00 (GMT) | Eurozone | GDP (YoY) | Quarter II | -1.3% | 13.2% |
| 09:00 (GMT) | Eurozone | GDP (QoQ) | Quarter II | -0.3% | 1.5% |
| 12:30 (GMT) | Canada | Industrial Product Price Index, y/y | June | 16.9% | |
| 12:30 (GMT) | Canada | Industrial Product Price Index, m/m | June | 3.1% | |
| 12:30 (GMT) | U.S. | Personal spending | June | 0.0% | 0.7% |
| 12:30 (GMT) | U.S. | Employment Cost Index | Quarter II | 0.9% | 0.9% |
| 12:30 (GMT) | Canada | GDP (m/m) | May | -0.3% | -0.3% |
| 12:30 (GMT) | U.S. | PCE price index ex food, energy, Y/Y | June | 3.4% | 3.7% |
| 12:30 (GMT) | U.S. | PCE price index ex food, energy, m/m | June | 0.5% | 0.6% |
| 12:30 (GMT) | U.S. | Personal Income, m/m | June | -2% | -0.3% |
| 13:45 (GMT) | U.S. | Chicago Purchasing Managers' Index | July | 66.1 | 64.6 |
| 14:00 (GMT) | U.S. | Reuters/Michigan Consumer Sentiment Index | July | 85.5 | 80.8 |
| 17:00 (GMT) | U.S. | Baker Hughes Oil Rig Count | July | 387 |
| Pare | Closed | Change, % |
|---|---|---|
| AUDUSD | 0.7393 | 0.27 |
| EURJPY | 130.072 | -0.07 |
| EURUSD | 1.18836 | 0.35 |
| GBPJPY | 152.765 | -0.02 |
| GBPUSD | 1.39573 | 0.39 |
| NZDUSD | 0.70037 | 0.68 |
| USDCAD | 1.24425 | -0.63 |
| USDCHF | 0.90521 | -0.51 |
| USDJPY | 109.452 | -0.42 |


© 2000-2026. All rights reserved.
This site is managed by Teletrade D.J. LLC 2351 LLC 2022 (Euro House, Richmond Hill Road, Kingstown, VC0100, St. Vincent and the Grenadines).
The information on this website is for informational purposes only and does not constitute any investment advice.
The company does not serve or provide services to customers who are residents of the US, Canada, Iran, The Democratic People's Republic of Korea, Yemen and FATF blacklisted countries.
Making transactions on financial markets with marginal financial instruments opens up wide possibilities and allows investors who are willing to take risks to earn high profits, carrying a potentially high risk of losses at the same time. Therefore you should responsibly approach the issue of choosing the appropriate investment strategy, taking the available resources into account, before starting trading.
Use of the information: full or partial use of materials from this website must always be referenced to TeleTrade as the source of information. Use of the materials on the Internet must be accompanied by a hyperlink to teletrade.org. Automatic import of materials and information from this website is prohibited.
Please contact our PR department if you have any questions or need assistance at pr@teletrade.global.
transfers