- Analytics
- News and Tools
- Market News
CFD Markets News and Forecasts — 30-08-2018
| Raw materials | Closing price | % change |
| Oil | $70.05 | +0.78% |
| Gold | $1,205.80 | -0.47% |
| Index | Change items | Closing price | % change |
| Nikkei | +21.28 | 22869.50 | +0.09% |
| TOPIX | -0.46 | 1739.14 | -0.03% |
| Hang Seng | -252.39 | 28164.05 | -0.89% |
| KOSPI | -1.68 | 2307.35 | -0.07% |
| FTSE 100 | -47.18 | 7516.03 | -0.62% |
| DAX | -67.44 | 12494.24 | -0.54% |
| CAC 40 | -23.27 | 5478.06 | -0.42% |
| DJIA | -137.65 | 25986.92 | -0.53% |
| S&P 500 | -12.91 | 2901.13 | -0.44% |
| NASDAQ | -21.32 | 8088.36 | -0.26% |
| Pare | Closed | % change |
| EUR/USD | $1,1666 | -0,36% |
| GBP/USD | $1,3011 | -0,13% |
| USD/CHF | Chf0,96846 | -0,21% |
| USD/JPY | Y111,02 | -0,64% |
| EUR/JPY | Y129,52 | -1,00% |
| GBP/JPY | Y144,449 | -0,77% |
| AUD/USD | $0,7264 | -0,63% |
| NZD/USD | $0,6713 | -0,03% |
| USD/CAD | C$1,29765 | +0,53% |
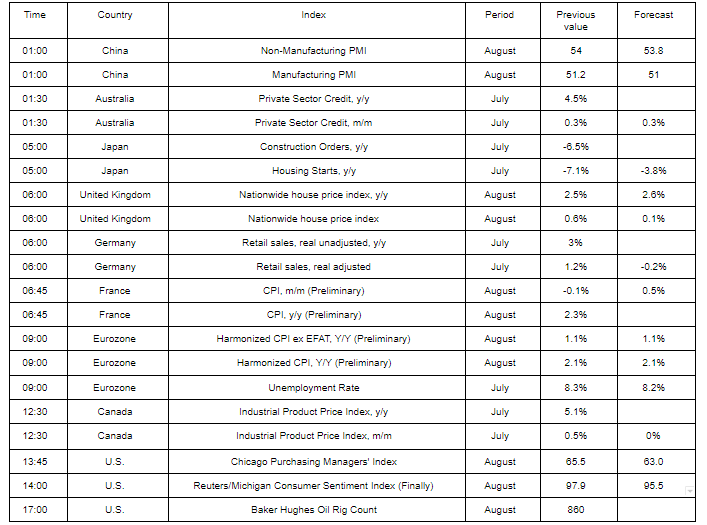
The main US stock indices declined moderately, weighed down by fears of a trade war with the US, although the growth in shares in the technology sector helped limit losses.
The focus was also on the United States. As it became known, in July Americans spent more of their incomes than last month, which indicates that the economy will have a stable dynamics in the second half of the year. Personal spending - or how much Americans spend on goods and services, such as groceries and healthcare - rose 0.4% in seasonally adjusted terms in July, compared with a month earlier, the Commerce Department reported. This reflected a steady increase, although not as strong as in the spring. Personal incomes, reflecting the income of Americans from salaries and investments, increased by 0.3%.
However, the number of workers in the United States who applied for unemployment benefits rose slightly last week after three consecutive weeks of decline, although the more stable level of appeals reached its lowest level in the last five decades. Primary applications for unemployment benefits, the rate of layoffs in all US states, increased by 3,000 to 213,000, seasonally adjusted for the week to August 25, the Ministry of Labor said. Economists predicted 214,000 new applications for unemployment benefits last week.
Most of the components of DOW finished trading in the red (26 of 30). Outsider were shares of Caterpillar Inc. (CAT, -2.11%). The leader of growth was the shares of Apple Inc. (AAPL, + 0.91%).
Almost all S & P sectors recorded a decline. The largest drop was shown by the sector of industrial goods (-0.9%). Only the conglomerate sector grew (+ 0.2%),
At closing:
Dow 25,986.92 -137.65 -0.53%
S & P 500 2,901.13 -12.91 -0.44%
Nasdaq 100 8,088.36 -21.32 -0.26%
U.S. stock-index futures traded flat on Wednesday, as concerns over U.S.-China trade dispute outweighed optimism over U.S.-Canada trade talks.
Global Stocks:
| Index/commodity | Last | Today's Change, points | Today's Change, % |
| Nikkei | 22,869.50 | +21.28 | +0.09% |
| Hang Seng | 28,164.05 | -252.39 | -0.89% |
| Shanghai | 2,737.74 | -31.56 | -1.14% |
| S&P/ASX | 6,351.80 | -0.40 | -0.01% |
| FTSE | 7,518.70 | -44.51 | -0.59% |
| CAC | 5,476.33 | -25.00 | -0.45% |
| DAX | 12,498.80 | -62.88 | -0.50% |
| Crude | $69.91 | | +0.58% |
| Gold | $1,212.40 | | +0.07% |
(company / ticker / price / change ($/%) / volume)
| ALTRIA GROUP INC. | MO | 58.7 | 0.25(0.43%) | 111 |
| Amazon.com Inc., NASDAQ | AMZN | 1,953.27 | 20.45(1.06%) | 78542 |
| Amazon.com Inc., NASDAQ | AMZN | 1,953.27 | 20.45(1.06%) | 78542 |
| AT&T Inc | T | 32.72 | 0.05(0.15%) | 1000 |
| Caterpillar Inc | CAT | 142.91 | 0.91(0.64%) | 3297 |
| Cisco Systems Inc | CSCO | 46.97 | 0.02(0.04%) | 5472 |
| Facebook, Inc. | FB | 176.65 | 0.39(0.22%) | 74904 |
| Ford Motor Co. | F | 10.03 | 0.02(0.20%) | 5302 |
| Freeport-McMoRan Copper & Gold Inc., NYSE | FCX | 14.58 | -0.08(-0.55%) | 41970 |
| General Electric Co | GE | 12.72 | -0.04(-0.31%) | 4666 |
| General Motors Company, NYSE | GM | 37.45 | 0.13(0.35%) | 6718 |
| Johnson & Johnson | JNJ | 134.25 | -0.07(-0.05%) | 453 |
| JPMorgan Chase and Co | JPM | 116.13 | -0.01(-0.01%) | 2303 |
| McDonald's Corp | MCD | 161.89 | 0.25(0.15%) | 1290 |
| Procter & Gamble Co | PG | 83.37 | -0.11(-0.13%) | 1282 |
| Starbucks Corporation, NASDAQ | SBUX | 53.19 | 0.14(0.26%) | 1556 |
| Travelers Companies Inc | TRV | 132.99 | 0.71(0.54%) | 300 |
| Verizon Communications Inc | VZ | 54.5 | -0.15(-0.27%) | 1750 |
| Visa | V | 145.4 | 0.20(0.14%) | 1845 |
| Yandex N.V., NASDAQ | YNDX | 31.77 | 0.09(0.28%) | 1266 |
In the week ending August 25, the advance figure for seasonally adjusted initial claims was 213,000, an increase of 3,000 from the previous week's unrevised level of 210,000. The 4-week moving average was 212,250, a decrease of 1,500 from the previous week's unrevised average of 213,750. This is the lowest level for this average since December 13, 1969 when it was 210,750.
Real gross domestic product (GDP) growth accelerated to 0.7% in the second quarter, following a 0.4% gain in the first quarter. Meanwhile, final domestic demand rose 0.5%.
Growth was mainly driven by a 2.9% increase in export volumes-the largest gain since the second quarter of 2014. Exports of goods, led by energy products, rose 3.6% after increasing 0.3% in the first quarter. Exports of services edged down 0.2%, the first decline since the fourth quarter of 2015.
Household spending rose 0.6%, after increasing 0.3% in the first quarter. Outlays on services (+0.8%) was the largest contributor to the increase. Rebounds in semi-durable (+1.2%) and non-durable (+0.2%) goods and continued growth in durable goods (+0.5%) also contributed to the gain.
Businesses continued to accumulate inventories, adding $13.4 billion to their stock, following a $16.0 billion increase in the previous quarter. Both non-farm and farm inventories rose in the second quarter.
Business investment in non-residential structures (+0.5%), machinery and equipment (+0.3%) and intellectual property products (+0.2%) all decelerated in the second quarter. Housing investment grew 0.3%, following a 2.7% decline in the previous quarter.
Expressed at an annualized rate, real GDP was up 2.9% in the second quarter. In comparison, real GDP in the United States grew 4.2%
The inflation rate in Germany as measured by the consumer price index is expected to be 2.0% in August 2018. Based on the results available so far, the Federal Statistical Office (Destatis) also reports that the consumer prices are expected to increase by 0.1% on July 2018.
In August 2018, the harmonised index of consumer prices for Germany, which is calculated for European purposes, is expected to increase by 1.9% year on year and remain unchanged on July 2018.
-
Baden-Wuerttemberg Aug CPI 0.0% MM; +2.1% YY
-
Saxony Aug CPI 0.0% On Mo, +2.0% On Year
Households borrowed an additional £3.2 billion secured against their homes in July. Net lending has been relatively stable over the past year but this was the lowest amount of monthly secured lending since April 2017.
Net lending to businesses increased to £2.7 billion in July, but this was primarily driven by the public administration and defence industry.
The annual growth rate of consumer credit lending shows the trend in net lending over the past twelve months. In July, the annual growth rate of consumer credit slowed a little to 8.5%. Within this, the annual growth rate of credit card lending was 8.9%, whilst the growth rate of other loans and advances was 8.2% - the lowest since March 2015. Although the annual growth rate of consumer credit remains high, particularly compared to 2009-12, the gradual slowing continues the trend since late 2016.
In August 2018, the KOF Economic Barometer fell from 101.7 in the previous month (revised up from 101.1) by 1.4 points to a level of 100.3. This confirms the impression that the height phase of 2017, in which the barometer was continuously significantly above average, is for the time being not returning.
The strongest contributions to this negative result come from manufacturing, followed by the indicators from the exporting sector. On the other hand, the indicators related to private consumption give a positive signal. The indicators from the financial and the construction sectors have remained practically unchanged.
According to the flash estimate issued by the INE, the annual inflation of the CPI in August 2018 was 2.2%. This indicator provides a preview of the CPI that, if confirmed, would imply a maintenance in the annual rate, since in July this change was 2.2%. This behavior highlights the increase in the prices of electricity. Also influences that the prices of fuels (diesel and gasoline/petrol) have increased less this month than in August 2017.
In turn, the annual variation of the flash estimate of the HICP in August stands at 2.2%. If confirmed, the annual rate of the HICP would decrease one tenth with respect to the previous month.
According to the flash estimate of the CPI, consumer prices registered a variation of 0.2% in August as compared with July.
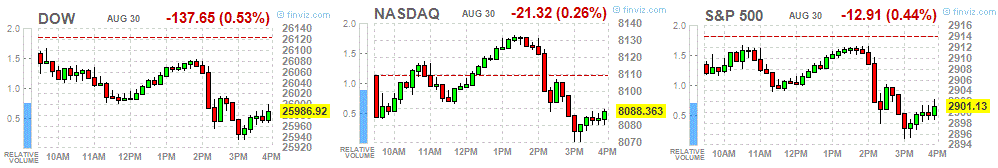
EUR/USD
Resistance levels (open interest**, contracts)
$1.1784 (1971)
$1.1758 (3027)
$1.1730 (3001)
Price at time of writing this review: $1.1697
Support levels (open interest**, contracts):
$1.1656 (3152)
$1.1624 (2891)
$1.1585 (4706)
Comments:
- Overall open interest on the CALL options and PUT options with the expiration date September, 7 is 134382 contracts (according to data from August, 29) with the maximum number of contracts with strike price $1,1500 (10381);
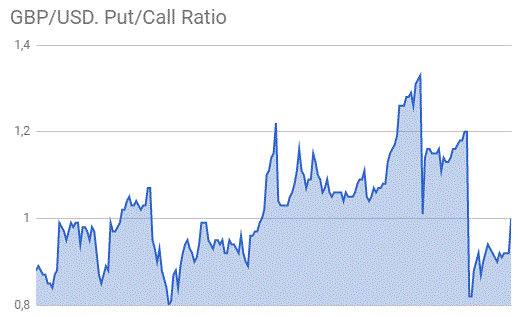
GBP/USD
Resistance levels (open interest**, contracts)
$1.3139 (2593)
$1.3083 (1281)
$1.3052 (1215)
Price at time of writing this review: $1.3028
Support levels (open interest**, contracts):
$1.2991 (1118)
$1.2972 (1299)
$1.2947 (2813)
Comments:
- Overall open interest on the CALL options with the expiration date September, 7 is 35248 contracts, with the maximum number of contracts with strike price $1,3450 (3338);
- Overall open interest on the PUT options with the expiration date September, 7 is 35247 contracts, with the maximum number of contracts with strike price $1,2900 (3156);
- The ratio of PUT/CALL was 1.00 versus 0.92 from the previous trading day according to data from August, 29.
* - The Chicago Mercantile Exchange bulletin (CME) is used for the calculation.
** - Open interest takes into account the total number of option contracts that are open at the moment.
Retail sales in Japan were up a seasonally adjusted 0.1 percent on month in July, according to rttnews.
That missed expectations for an increase of 0.2 percent following the 1.5 percent spike in June.
On a yearly basis, retail sales climbed 1.5 percent - exceeding expectations for 1.2 percent and down from 1.8 percent in the previous month.
Sales from large retailers tumbled 1.6 percent on year, missing forecasts for a decline of 0.7 percent following the 1.5 percent jump a month earlier.
In July 2018, the seasonally adjusted number of new dwellings consented fell 10 percent, following an 8.2 percent fall in June, and a 6.7 percent rise in May.
In the year ended July 2018, the actual number of new dwellings consented was 32,850, up 8.0 percent from the July 2017 year.
The annual value of non-residential building work consented was $6.8 billion, up 10 percent from the July 2017 year.
In July 2018, 2,752 new dwellings were consented:
The seasonally adjusted number of new dwellings consented fell 10 percent, following an 8.2 percent fall in June, and a 6.7 percent rise in May.
For stand-alone houses only, the seasonally adjusted number fell 6.0 percent, after a 3.9 percent fall in June, and 6.8 percent rise in May.
-
Issues Order On Adjusting Imports Of Aluminium In The US
Total dwelling units:
-
The trend estimate for total dwellings approved fell 1.3% in july.
-
The seasonally adjusted estimate for total dwellings approved fell 5.2% in july.
Private sector houses:
-
The trend estimate for private sector houses approved fell 0.9% in july.
-
The seasonally adjusted estimate for private sector houses fell 3.0% in july.
Private sector dwellings excluding houses:
-
The trend estimate for private sector dwellings excluding houses fell 1.8% in july.
-
The seasonally adjusted estimate for private sector dwellings excluding houses fell 6.6% in july.
Value of building approved:
-
The trend estimate of the value of total building approved fell 1.2% in july and has fallen for eight months. The value of residential building fell 1.8% and has fallen for six months. The value of non-residential building was flat.
-
The seasonally adjusted estimate of the value of total building approved rose 7.1% in july. The value of residential building fell 4.9%, while the value of non-residential building rose 31.5%.
Actual expenditure (volume terms):
-
The trend volume estimate for total new capital expenditure fell by 0.6% in the june quarter 2018 while the seasonally adjusted estimate fell by 2.5%.
-
The trend volume estimate for buildings and structures fell by 2.1% in the june quarter 2018 while the seasonally adjusted estimate fell by 3.9%.
-
The trend volume estimate for equipment, plant and machinery rose by 1.3% in the june quarter 2018 while the seasonally adjusted estimate fell by 0.9%.
Expected expenditure (current price terms):
-
This issue includes the seventh estimate (estimate 7) for 2017-18 and the third estimate (estimate 3) for 2018-19.
-
Estimate 7 for 2017-18 is $118,927m. This is 4.0% higher than estimate 7 for 2016-17. Estimate 7 is 1.0% higher than estimate 6 for 2017-18.
-
Estimate 3 for 2018-19 is $101,997m. This is 1.1% lower than estimate 3 for 2017-18. Estimate 3 is 16.1% higher than estimate 2 for 2018-19.
As reported by the Federal Statistical Office (Destatis), the index of import prices increased by 5.0% in July 2018 compared with the corresponding month of the preceding year. In June and in May 2018 the annual rates of change were +4.8% and +3.2%, respectively. From June 2018 to July 2018 the index decreased by 0.2%.
The index of import prices, excluding crude oil and mineral oil products, increased by 2.1% compared with the level of a year earlier.
The index of export prices increased by 1.9% in July 2018 compared with the corresponding month of the preceding year. In June and in May 2018 the annual rates of change were +1.8% and +1.3%, respectively. From June 2018 to July 2018 the export price index remained unchanged.


© 2000-2026. All rights reserved.
This site is managed by Teletrade D.J. LLC 2351 LLC 2022 (Euro House, Richmond Hill Road, Kingstown, VC0100, St. Vincent and the Grenadines).
The information on this website is for informational purposes only and does not constitute any investment advice.
The company does not serve or provide services to customers who are residents of the US, Canada, Iran, The Democratic People's Republic of Korea, Yemen and FATF blacklisted countries.
Making transactions on financial markets with marginal financial instruments opens up wide possibilities and allows investors who are willing to take risks to earn high profits, carrying a potentially high risk of losses at the same time. Therefore you should responsibly approach the issue of choosing the appropriate investment strategy, taking the available resources into account, before starting trading.
Use of the information: full or partial use of materials from this website must always be referenced to TeleTrade as the source of information. Use of the materials on the Internet must be accompanied by a hyperlink to teletrade.org. Automatic import of materials and information from this website is prohibited.
Please contact our PR department if you have any questions or need assistance at pr@teletrade.global.
transfers