- Analytics
- News and Tools
- Market News
CFD Markets News and Forecasts — 31-01-2019
| Time | Country | Event | Period | Previous value | Forecast |
|---|---|---|---|---|---|
| 00:30 | Australia | Producer price index, y/y | Quarter IV | 2.1% | |
| 00:30 | Australia | Producer price index, q / q | Quarter IV | 0.8% | |
| 00:30 | Japan | Manufacturing PMI | January | 52.6 | 50.0 |
| 01:45 | China | Markit/Caixin Manufacturing PMI | January | 49.7 | 49.5 |
| 06:45 | Switzerland | SECO Consumer Climate | Quarter I | -6 | -5 |
| 07:30 | Switzerland | Retail Sales (MoM) | December | 0.2% | |
| 07:30 | Switzerland | Retail Sales Y/Y | December | -0.5% | 0.4% |
| 08:30 | Switzerland | Manufacturing PMI | January | 57.8 | 55.8 |
| 08:50 | France | Manufacturing PMI | January | 49.7 | 51.2 |
| 08:55 | Germany | Manufacturing PMI | January | 51.5 | 49.9 |
| 09:00 | Eurozone | Manufacturing PMI | January | 51.4 | 50.5 |
| 09:30 | United Kingdom | Purchasing Manager Index Manufacturing | January | 54.2 | 53.5 |
| 10:00 | Eurozone | Harmonized CPI ex EFAT, Y/Y | January | 1% | 1% |
| 10:00 | Eurozone | Harmonized CPI, Y/Y | January | 1.6% | 1.4% |
| 13:30 | U.S. | Average workweek | January | 34.5 | 34.5 |
| 13:30 | U.S. | Manufacturing Payrolls | January | 32 | 17 |
| 13:30 | U.S. | Government Payrolls | January | 11 | |
| 13:30 | U.S. | Private Nonfarm Payrolls | January | 301 | 170 |
| 13:30 | U.S. | Labor Force Participation Rate | January | 63.1% | |
| 13:30 | U.S. | Average hourly earnings | January | 0.4% | 0.3% |
| 13:30 | U.S. | Unemployment Rate | January | 3.9% | 3.9% |
| 13:30 | U.S. | Nonfarm Payrolls | January | 312 | 165 |
| 14:45 | U.S. | Manufacturing PMI | January | 53.8 | 54.9 |
| 15:00 | U.S. | Construction Spending, m/m | November | -0.1% | 0.2% |
| 15:00 | U.S. | Wholesale Inventories | November | 0.8% | 0.5% |
| 15:00 | U.S. | ISM Manufacturing | January | 54.3 | 54.2 |
| 15:00 | U.S. | Reuters/Michigan Consumer Sentiment Index | January | 98.3 | 90.8 |
| 18:00 | U.S. | Baker Hughes Oil Rig Count | February | 862 | |
| 20:00 | U.S. | Total Vehicle Sales, mln | January | 17.55 | 17.2 |
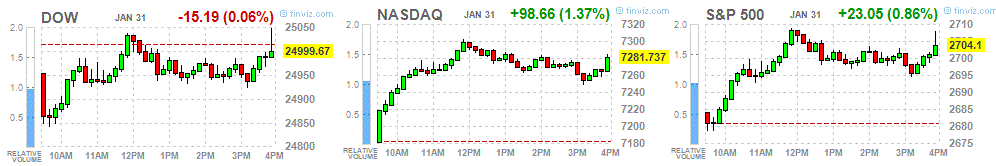
Major US stock indices predominantly rose on Thursday, as strong revenues from Facebook Inc (FB) added optimism after the meager remarks of the Federal Reserve System. The focus of investors' attention was also on trade negotiations between the United States and China and data on the United States.
President Trump said that it may be necessary to extend trade talks with China after March 1 to work out the details. “The agreement with China will not be small. The agreement with China should be comprehensive, or I will postpone its adoption for some time, ”said Trump. In addition, he made it clear that he was ready to meet again the chairman of the PRC. In his Twitter account, the president wrote that reaching a final agreement would not work until he meets with the PRC Chairman and discusses the most difficult issues in bilateral relations with him.
As for the data, sales of new homes in the US in November jumped to the highest rates in eight months, as lower prices helped attract more buyers. Sales of single-family homes increased by 16.9% compared with the previous month, to 657,000 year-on-year, according to government data, which were postponed due to the closure of the government. This exceeded the estimates of economists (569,000). Meanwhile, the October reading was revised to 562,000 from 544,000.
Most of the components of DOW recorded an increase (19 of 30). The top gainers were Johnson & Johnson (JNJ, + 2.51%). The outsider was DowDuPont Inc. (DWDP, -9.23%).
All sectors of the S & P completed the auction plus. The largest growth was shown by the utility sector (+ 2.0%),
At the time of closing:
Dow 24,999.67 -15.19 -0.06%
S & P 500 2,704.10 +23.05 +0.86%
Nasdaq 100 7,281.74 +98.66 +1.37%
| Time | Country | Event | Period | Previous value | Forecast |
|---|---|---|---|---|---|
| 00:30 | Australia | Producer price index, y/y | Quarter IV | 2.1% | |
| 00:30 | Australia | Producer price index, q / q | Quarter IV | 0.8% | |
| 00:30 | Japan | Manufacturing PMI | January | 52.6 | 50.0 |
| 01:45 | China | Markit/Caixin Manufacturing PMI | January | 49.7 | 49.5 |
| 06:45 | Switzerland | SECO Consumer Climate | Quarter I | -6 | -5 |
| 07:30 | Switzerland | Retail Sales (MoM) | December | 0.2% | |
| 07:30 | Switzerland | Retail Sales Y/Y | December | -0.5% | 0.4% |
| 08:30 | Switzerland | Manufacturing PMI | January | 57.8 | 55.8 |
| 08:50 | France | Manufacturing PMI | January | 49.7 | 51.2 |
| 08:55 | Germany | Manufacturing PMI | January | 51.5 | 49.9 |
| 09:00 | Eurozone | Manufacturing PMI | January | 51.4 | 50.5 |
| 09:30 | United Kingdom | Purchasing Manager Index Manufacturing | January | 54.2 | 53.5 |
| 10:00 | Eurozone | Harmonized CPI ex EFAT, Y/Y | January | 1% | 1% |
| 10:00 | Eurozone | Harmonized CPI, Y/Y | January | 1.6% | 1.4% |
| 13:30 | U.S. | Average workweek | January | 34.5 | 34.5 |
| 13:30 | U.S. | Manufacturing Payrolls | January | 32 | 17 |
| 13:30 | U.S. | Government Payrolls | January | 11 | |
| 13:30 | U.S. | Private Nonfarm Payrolls | January | 301 | 170 |
| 13:30 | U.S. | Labor Force Participation Rate | January | 63.1% | |
| 13:30 | U.S. | Average hourly earnings | January | 0.4% | 0.3% |
| 13:30 | U.S. | Unemployment Rate | January | 3.9% | 3.9% |
| 13:30 | U.S. | Nonfarm Payrolls | January | 312 | 165 |
| 14:45 | U.S. | Manufacturing PMI | January | 53.8 | 54.9 |
| 15:00 | U.S. | Construction Spending, m/m | November | -0.1% | 0.2% |
| 15:00 | U.S. | Wholesale Inventories | November | 0.8% | 0.5% |
| 15:00 | U.S. | ISM Manufacturing | January | 54.3 | 54.2 |
| 15:00 | U.S. | Reuters/Michigan Consumer Sentiment Index | January | 98.3 | 90.8 |
| 18:00 | U.S. | Baker Hughes Oil Rig Count | February | 862 | |
| 20:00 | U.S. | Total Vehicle Sales, mln | January | 17.55 | 17.2 |
U.S. stock-index were flat on Thursday, as investors digested the latest policy statement by the Federal Reserve, as well as a raft of earnings reports.
Global Stocks:
Index/commodity | Last | Today's Change, points | Today's Change, % |
Nikkei | 20,556.54 | -108.10 | -0.52% |
Hang Seng | 27,642.85 | +111.17 | +0.40% |
Shanghai | 2,575.58 | -18.68 | -0.72% |
S&P/ASX | 5,886.70 | +12.50 | +0.21% |
FTSE | 6,961.41 | +127.48 | +1.87% |
CAC | 4,961.10 | +32.92 | +0.67% |
DAX | 11,175.41 | -43.42 | -0.39% |
Crude | $53.79 | +0.90% | |
Gold | $1,314.90 | -0.02% |
(company / ticker / price / change ($/%) / volume)
3M Co | MMM | 199.3 | 0.03(0.02%) | 223 |
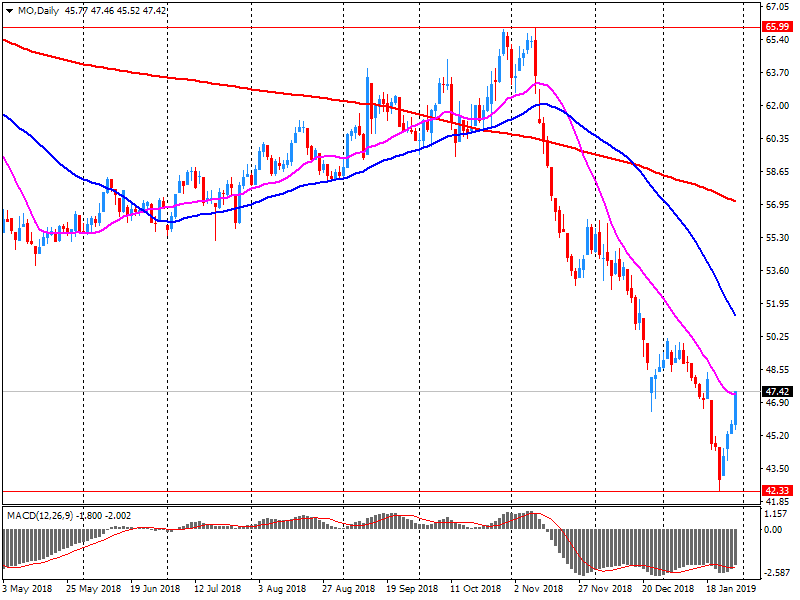
ALTRIA GROUP INC. | MO | 49.1 | 1.30(2.72%) | 152657 |
Amazon.com Inc., NASDAQ | AMZN | 1,703.10 | 32.67(1.96%) | 97894 |
AMERICAN INTERNATIONAL GROUP | AIG | 42.88 | 0.07(0.16%) | 200 |
Apple Inc. | AAPL | 166.31 | 1.06(0.64%) | 235009 |
AT&T Inc | T | 29.42 | 0.05(0.17%) | 104819 |
Boeing Co | BA | 388.8 | 1.08(0.28%) | 10297 |
Caterpillar Inc | CAT | 129.57 | -0.54(-0.42%) | 13620 |
Chevron Corp | CVX | 113.5 | 0.49(0.43%) | 2062 |
Cisco Systems Inc | CSCO | 46.95 | 0.24(0.51%) | 7606 |
Citigroup Inc., NYSE | C | 63.94 | -0.28(-0.44%) | 6497 |
Deere & Company, NYSE | DE | 163.2 | 0.29(0.18%) | 192 |
Exxon Mobil Corp | XOM | 72.54 | 0.25(0.35%) | 5484 |
Facebook, Inc. | FB | 167 | 16.58(11.02%) | 1413941 |
FedEx Corporation, NYSE | FDX | 179.35 | 1.88(1.06%) | 3154 |
Ford Motor Co. | F | 8.62 | -0.09(-1.03%) | 32043 |
Freeport-McMoRan Copper & Gold Inc., NYSE | FCX | 11.43 | 0.16(1.42%) | 18095 |
General Electric Co | GE | 9.97 | 0.87(9.56%) | 14826837 |
General Motors Company, NYSE | GM | 39 | -0.09(-0.23%) | 461 |
Goldman Sachs | GS | 201.5 | -0.98(-0.48%) | 1395 |
Google Inc. | GOOG | 1,105.00 | 15.94(1.46%) | 3264 |
Home Depot Inc | HD | 182 | -0.18(-0.10%) | 261 |
HONEYWELL INTERNATIONAL INC. | HON | 143.51 | 0.23(0.16%) | 6667 |
Intel Corp | INTC | 47.4 | -0.14(-0.29%) | 25582 |
International Business Machines Co... | IBM | 134.82 | 0.44(0.33%) | 517 |
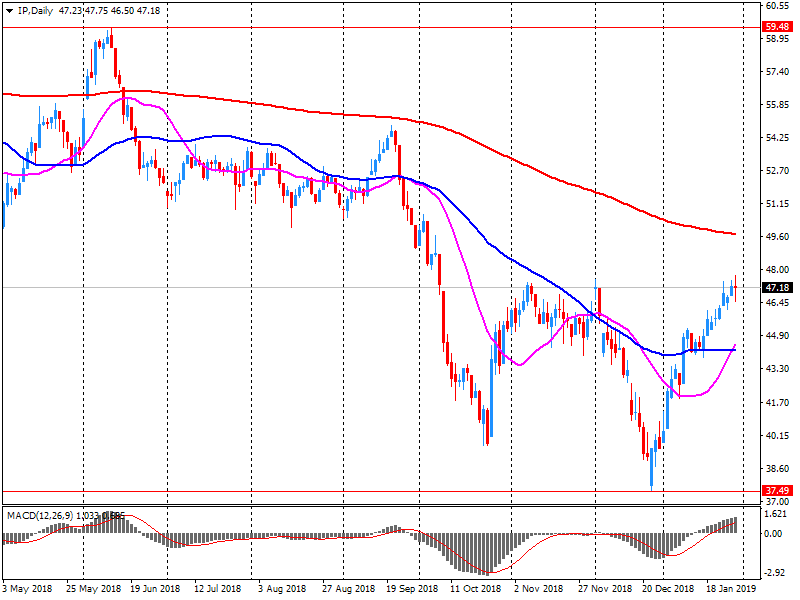
International Paper Company | IP | 48.55 | 1.24(2.62%) | 1727 |
Johnson & Johnson | JNJ | 132 | 0.36(0.27%) | 936 |
JPMorgan Chase and Co | JPM | 103.85 | -0.56(-0.54%) | 7580 |
McDonald's Corp | MCD | 181.2 | -0.57(-0.31%) | 2394 |
Microsoft Corp | MSFT | 103.58 | -2.80(-2.63%) | 413826 |
Nike | NKE | 81.11 | -0.17(-0.21%) | 2947 |
Pfizer Inc | PFE | 41.67 | 0.45(1.09%) | 46806 |
Procter & Gamble Co | PG | 94.48 | -0.04(-0.04%) | 181 |
Starbucks Corporation, NASDAQ | SBUX | 68.37 | 0.22(0.32%) | 760 |
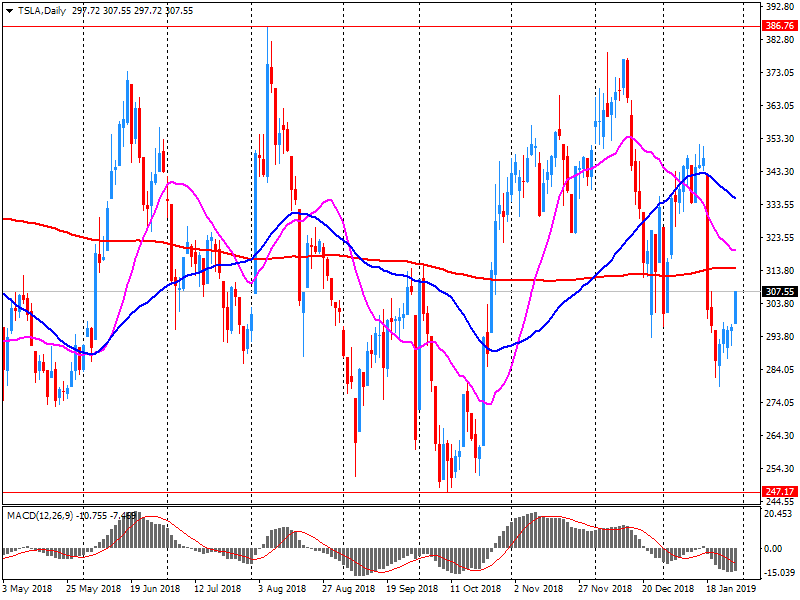
Tesla Motors, Inc., NASDAQ | TSLA | 298.49 | -10.28(-3.33%) | 235536 |
The Coca-Cola Co | KO | 47.93 | 0.07(0.15%) | 675 |
Twitter, Inc., NYSE | TWTR | 33.36 | 1.10(3.41%) | 127766 |
Verizon Communications Inc | VZ | 54.04 | 0.04(0.07%) | 4959 |
Visa | V | 134.9 | -2.70(-1.96%) | 166082 |
Wal-Mart Stores Inc | WMT | 94.6 | -0.20(-0.21%) | 2409 |
Walt Disney Co | DIS | 110.22 | 0.09(0.08%) | 3756 |
Yandex N.V., NASDAQ | YNDX | 33.45 | -0.34(-1.01%) | 17850 |
In the week ending January 26, the advance figure for seasonally adjusted initial claims was 253,000, an increase of 53,000 from the previous week's revised level. This is the highest level for initial claims since September 30, 2017 when it was 254,000. The previous week's level was revised up by 1,000 from 199,000 to 200,000. The 4-week moving average was 220,250, an increase of 5,000 from the previous week's revised average. The previous week's average was revised up by 250 from 215,000 to 215,250.
Real gross domestic product edged down 0.1% in November, partly offsetting an increase of 0.3% in October. Decreases in wholesale trade, finance and insurance, manufacturing and construction more than offset gains in 13 of 20 industrial sectors. Goods-producing industries were down 0.3%, the third decline in four months, while services-producing industries were essentially unchanged.
The wholesale trade sector decreased 1.1% in November, more than offsetting October's growth, as six of the nine subsectors declined.
Pfizer (PFE) upgraded to Buy from Hold at Argus
Pfizer (PFE) upgraded to Outperform from Neutral at Credit Suisse
Altria (MO) reported Q4 FY 2018 earnings of $0.95 per share (versus $0.91 in Q4 FY 2017), in line with analysts’ consensus estimate.
The company’s quarterly revenues amounted to 4.786 bln (+1.5% y/y), generally in line with analysts’ consensus estimate of $4.819 bln.
MO rose to $48.99 (+2.49%) in pre-market trading.
Int'l Paper (IP) reported Q4 FY 2018 earnings of $1.65 per share (versus $1.27 in Q4 FY 2017), beating analysts’ consensus estimate of $1.59.
The company’s quarterly revenues amounted to $5.951 bln (+4.2% y/y), generally in line with analysts’ consensus estimate of $5.950 bln.
IP rose to $47.68 (+0.78%) in pre-market trading.
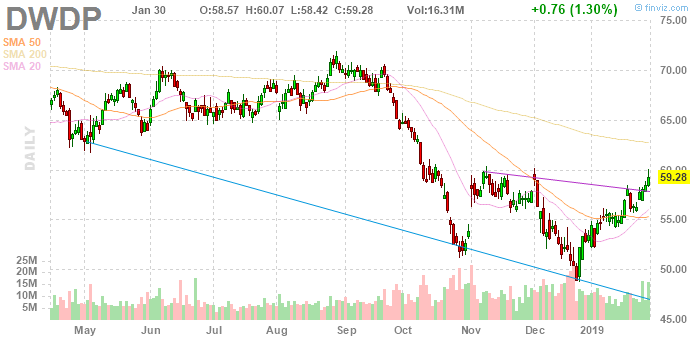
DowDuPont (DWDP) reported Q4 FY 2018 earnings of $0.88 per share (versus $0.83 in Q4 FY 2017), beating analysts’ consensus estimate of $0.87.
The company’s quarterly revenues amounted to $20.099 bln (+0.2% y/y), missing analysts’ consensus estimate of $20.926 bln.
DWDP fell to $55.00 (-7.22%) in pre-market trading.
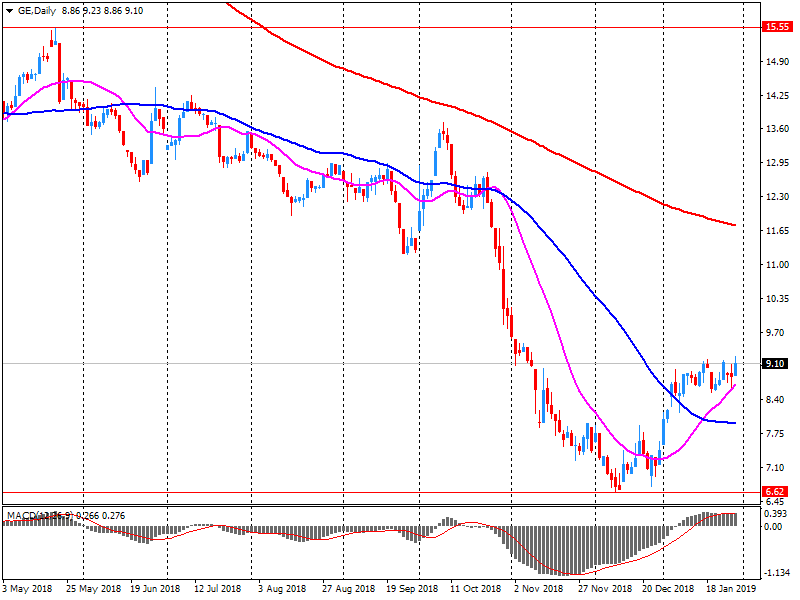
General Electric (GE) reported Q4 FY 2018 earnings of $0.17 per share (versus $0.27 in Q4 FY 2017), missing analysts’ consensus estimate of $0.22.
The company’s quarterly revenues amounted to $33.278 bln (+5.3% y/y), beating analysts’ consensus estimate of $32.160 bln.
GE rose to $9.86 (+8.35%) in pre-market trading.
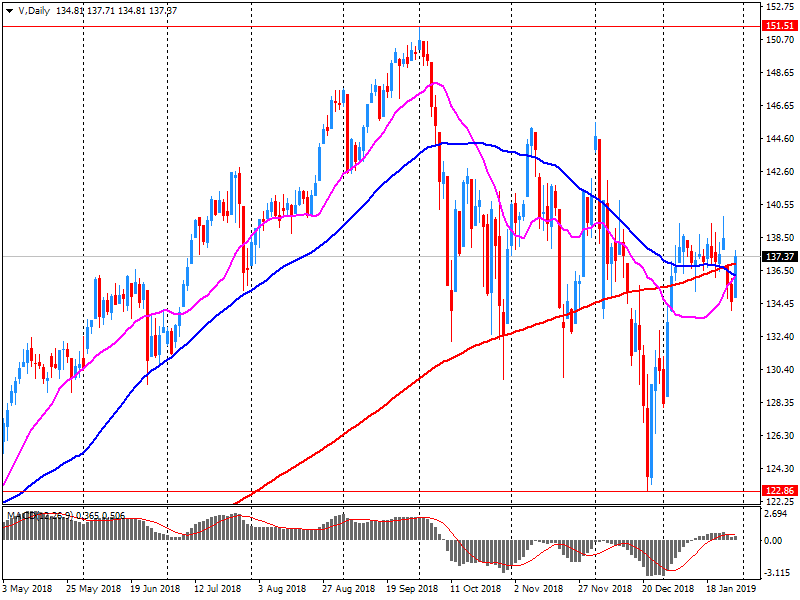
Visa (V) reported Q4 FY 2018 earnings of $1.30 per share (versus $1.08 in Q4 FY 2017), beating analysts’ consensus estimate of $1.25.
The company’s quarterly revenues amounted to $5.506 bln (+13.2% y/y), beating analysts’ consensus estimate of $5.412 bln.
V fell to $135.00 (-1.89%) in pre-market trading.
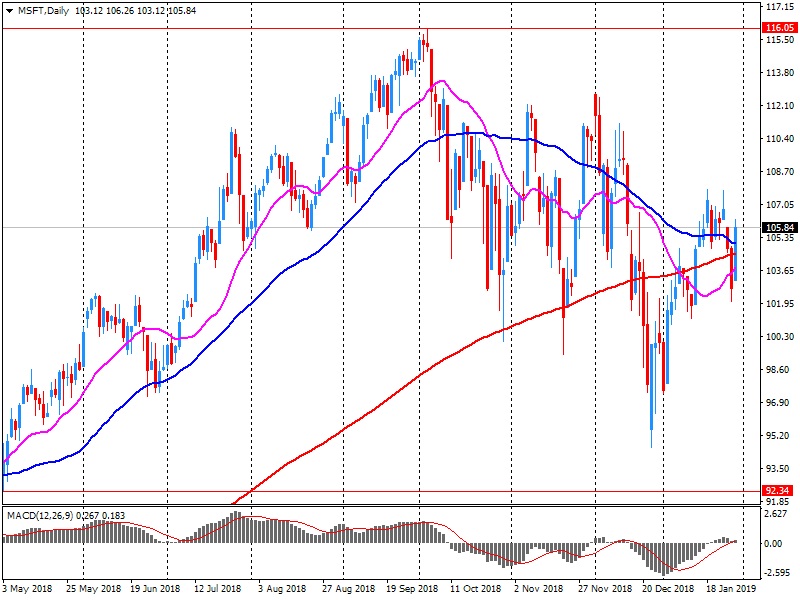
Microsoft (MSFT) reported Q4 FY 2018 earnings of $1.10 per share (versus $0.96 in Q4 FY 2017), beating analysts’ consensus estimate of $1.09.
The company’s quarterly revenues amounted to $32.471 bln (+12.3% y/y), generally in line with analysts’ consensus estimate of $32.530 bln.
MSFT fell to $104.00 (-2.24%) in pre-market trading.
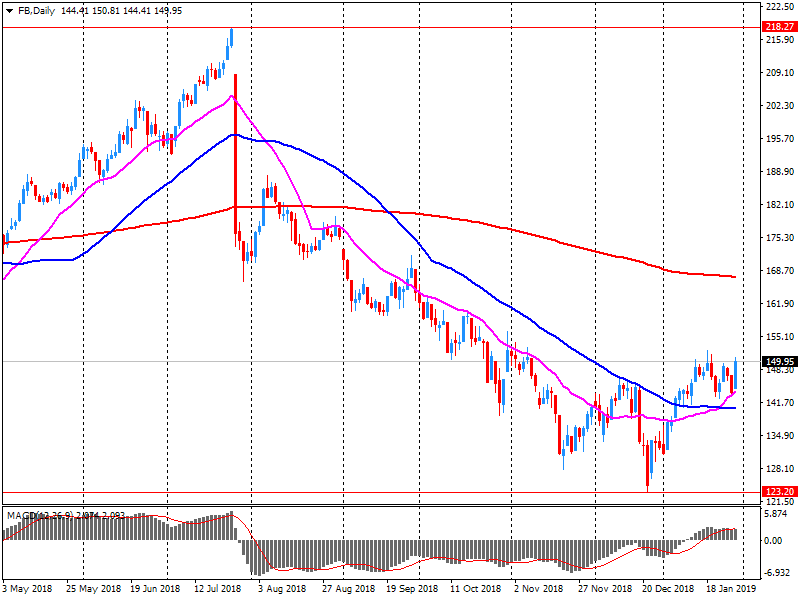
Facebook (FB) reported Q4 FY 2018 earnings of $2.38 per share (versus $2.21 in Q4 FY 2017), beating analysts’ consensus estimate of $2.18.
The company’s quarterly revenues amounted to $16.914 bln (+30.4% y/y), beating analysts’ consensus estimate of $16.396 bln.
FB rose to $168.07 (+11.73%) in pre-market trading.
Tesla (TSLA) reported Q4 FY 2018 earnings of $1.93 per share (versus -$3.04 in Q4 FY 2017), missing analysts’ consensus estimate of $2.02.
The company’s quarterly revenues amounted to $7.226 bln (+119.8% y/y), beating analysts’ consensus estimate of $7.087 bln.
TSLA fell to $296.00 (-4.14 %) in pre-market trading.
The euro area (EA19) seasonally-adjusted unemployment rate was 7.9% in December 2018, stable compared with November 2018 and down from 8.6% in December 2017. This remains the lowest rate recorded in the euro area since October 2008. The EU28 unemployment rate was 6.6% in December 2018, stable compared with November 2018 and down from 7.2% in December 2017. This remains the lowest rate recorded in the EU28 since the start of the EU monthly unemployment series in January 2000.
Seasonally adjusted GDP rose by 0.2% in the euro area (EA19) and by 0.3% in the EU28 during the fourth quarter of 2018, compared with the previous quarter, according to a preliminary flash estimate published by Eurostat. In the third quarter of 2018, GDP had also grown by 0.2% in the euro area and by 0.3% in the EU28.
Compared with the same quarter of the previous year, seasonally adjusted GDP rose by 1.2% in the euro area and by 1.5% in the EU28 in the fourth quarter of 2018, after +1.6% and +1.8% respectively in the previous quarter. According to a first estimation of annual growth for 2018, GDP grew by 1.8% in the euro area and 1.9% in the EU28.
In December 2018, the number of employed people moderately grew compared with November (+0.1%, +23 thousand); the employment rate rose at 58.8% (+0.1 percentage points in a month). The female employment increased while the male decreased.
In December, the number of unemployed people continued to go down (-1.6%, -44 thousand); the decline involved mainly men and persons aged over 35. The unemployment rate dropped to 10.3% (-0.2 percentage points in a month) while the youth rate slight increased to 31.9% (+0.1 percentage points).
In December, inactive people aged 15-64 moderately declined (-0.1%, -16 thousand); the decrease involved women and all age groups, except persons aged 25-34 which rose by +28 thousands. The inactivity rate was stable to 34.3%.
In the fourth quarter 2018 employment slightly rose compared with the previous quarter (+0.1%, +12 thousand). The increase involved men and people in the extreme age groups (15-24 and over 50).
Over a year, the Consumer Price Index (CPI) should slow down for the third consecutive month: +1.2% in January 2019 after +1.6% in December 2018, according to the provisional estimate made at the end of January 2019. The fall in inflation should result from a pronounced deceleration in the prices of energy. Services prices should rise at the same pace as in December and those in manufactured products should drop barely less than in the previous month. Contrariwise, food and tobacco prices should gather pace.
Over one month, consumer prices should fall back by 0.5% after a stability in December. The prices of manufactured products should drop sharply because of the beginning of winter sales. Those of energy should fall again, but less than in December, in the wake of petroleum product prices. Services prices should slow down due to a seasonal downturn in airfares. Food prices should also be a little less dynamic than in the previous month. At least, those of tobacco should increase after a stability in December.
Year on year, the Harmonised Index of Consumer Prices should slow down sharply to +1.4% after +1.9% in December. Over one month, it should fall back by 0.6%, after +0.1% in the previous month.
According to provisional data, turnover in retail trade in December 2018 decreased by 2.1% in real terms and 1.2% in nominal terms from December 2017. The number of days open for sale was 24 both in December 2018 and December 2017.
When adjusted for calendar and seasonal variations, the December 2018 turnover was in real terms 4.3% and in nominal terms 4.8% smaller than in November 2018.
The manufacturing sector in China continued to contract in January, albeit at a slower pace, with a manufacturing PMI score of 49.5, according to rttnews
That beat expectations for a score of 49.3 and is up from 49.4 in December, although it remains beneath the boom-or-bust line of 50 that separates expansion from contraction.
The bureau also said its non-manufacturing index came in at 54.7, topping forecasts for 53.9 and up from 53.8 in the previous month.
The composite index had a score of 53.2, up from 52.6 a month earlier.
Annual house price growth slows to 0.1%
Modest 0.3% increase month-on-month after taking account of seasonal factors
Commenting on the figures, Robert Gardner, Nationwide's Chief Economist, said: “Annual house price growth almost ground to a complete halt in January, with prices just 0.1% higher than the same time last year. This follows a subdued December when price growth slowed to 0.5%. “Indicators of housing market activity, such as the number of property transactions and the number of mortgages approved for house purchase, have remained broadly stable in recent months, but forward-looking indicators had suggested some softening was likely”.
Lost GDP Will Be Regained Even With Fairly Long Shutdown
So Far No Material Effects from Tariffs on GDP
Ultimately a Strong Global Economy Is Good for U.S.
Policy Stance Today Appropriate for State of Economy
Want to Operate in Abundant Reserves Regime
Case for Raising Rates Has Weakened Somewhat
Some Surveys of Business and Consumer Sentiment Have Moved Lower
Fed Facing Contradictory Picture of Strong U.S. With Cross Currents
Committee Now Evaluating Appropriate Timing for End of Balance Sheet Runoff
Fed Thinks Current Policy Stance Appropriate
Some of the Cross Currents May Be With Us for Awhile
Composition of Balance Sheet in Longer Run Very Important
Narrative of Slowing Global Growth Continues
Length of Patient Period Depends on Incoming Data and Implications for Outlook
'Continues to View Sustained Expansion' As Most Likely Outcome
Revises Earlier Guidance on Balance Sheet Normalization
Fed Prepared to Adjust Balance Sheet Runoff 'In Light of Economic and Financial Developments'
Intends to Maintain Monetary Policy Regime With 'Ample Supply of Reserves'
Voted 10-0 For Fed Funds Rate Action
'Will Be Patient' In Deciding on Future Interest-Rate Changes
Attributes Patience to Global Economic and Financial Developments, Muted Inflation Pressures
Downgrades Assesment of Economic Growth to 'Solid' From 'Strong'
EUR/USD
Resistance levels (open interest**, contracts)
$1.1591 (3192)
$1.1569 (3253)
$1.1546 (627)
Price at time of writing this review: $1.1498
Support levels (open interest**, contracts):
$1.1469 (4243)
$1.1433 (3278)
$1.1391 (4296)
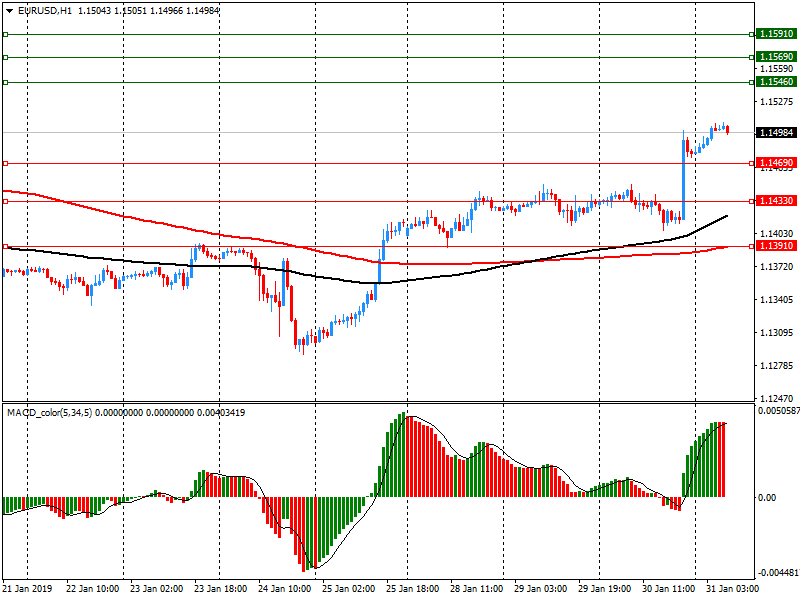
Comments:
- Overall open interest on the CALL options and PUT options with the expiration date February, 8 is 70466 contracts (according to data from January, 30) with the maximum number of contracts with strike price $1,1700 (4502);
GBP/USD
Resistance levels (open interest**, contracts)
$1.3208 (1570)
$1.3179 (1929)
$1.3156 (1206)
Price at time of writing this review: $1.3126
Support levels (open interest**, contracts):
$1.3068 (400)
$1.3040 (329)
$1.3007 (340)
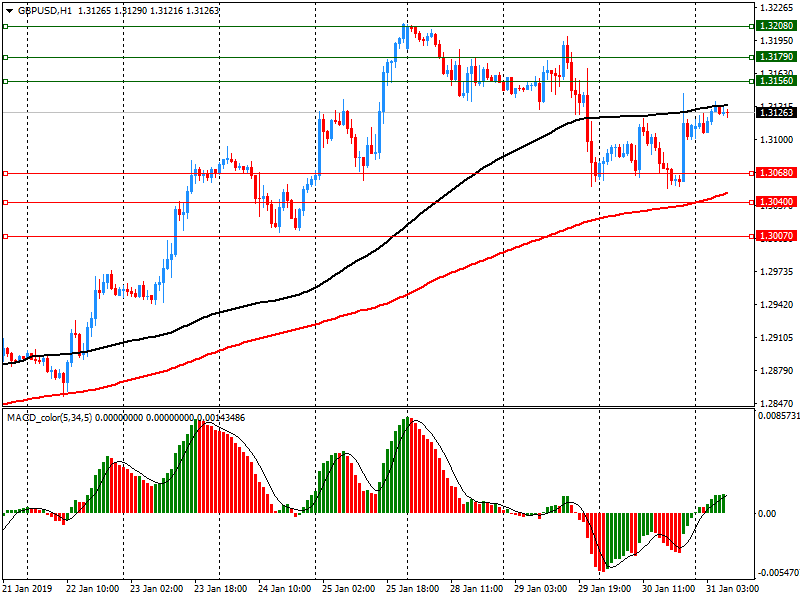
Comments:
- Overall open interest on the CALL options with the expiration date February, 8 is 23868 contracts, with the maximum number of contracts with strike price $1,3000 (1929);
- Overall open interest on the PUT options with the expiration date February, 8 is 28546 contracts, with the maximum number of contracts with strike price $1,2600 (1930);
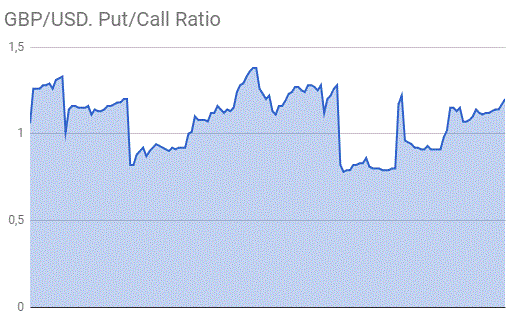
- The ratio of PUT/CALL was 1.20 versus 1.20 from the previous trading day according to data from January, 30
* - The Chicago Mercantile Exchange bulletin (CME) is used for the calculation.
** - Open interest takes into account the total number of option contracts that are open at the moment.
| Raw materials | Closed | Change, % |
|---|---|---|
| Brent | 61.52 | 0.69 |
| WTI | 54.24 | 1.78 |
| Silver | 16.04 | 1.45 |
| Gold | 1319.573 | 0.61 |
| Palladium | 1358.08 | 1.31 |
| Index | Change, points | Closed | Change, % |
|---|---|---|---|
| NIKKEI 225 | -108.1 | 20556.54 | -0.52 |
| Hang Seng | 111.17 | 27642.85 | 0.4 |
| KOSPI | 22.84 | 2206.2 | 1.05 |
| ASX 200 | 12.5 | 5886.7 | 0.21 |
| FTSE 100 | 107.7 | 6941.63 | 1.58 |
| DAX | -37.17 | 11181.66 | -0.33 |
| Dow Jones | 434.9 | 25014.86 | 1.77 |
| S&P 500 | 41.05 | 2681.05 | 1.55 |
| NASDAQ Composite | 154.79 | 7183.08 | 2.2 |
| Pare | Closed | Change, % |
|---|---|---|
| AUDUSD | 0.72473 | 1.3 |
| EURJPY | 125.169 | 0.13 |
| EURUSD | 1.14786 | 0.42 |
| GBPJPY | 142.992 | 0.09 |
| GBPUSD | 1.31134 | 0.37 |
| NZDUSD | 0.68953 | 0.92 |
| USDCAD | 1.31527 | -0.87 |
| USDCHF | 0.99412 | -0.05 |
| USDJPY | 109.038 | -0.28 |


© 2000-2026. All rights reserved.
This site is managed by Teletrade D.J. LLC 2351 LLC 2022 (Euro House, Richmond Hill Road, Kingstown, VC0100, St. Vincent and the Grenadines).
The information on this website is for informational purposes only and does not constitute any investment advice.
The company does not serve or provide services to customers who are residents of the US, Canada, Iran, The Democratic People's Republic of Korea, Yemen and FATF blacklisted countries.
Making transactions on financial markets with marginal financial instruments opens up wide possibilities and allows investors who are willing to take risks to earn high profits, carrying a potentially high risk of losses at the same time. Therefore you should responsibly approach the issue of choosing the appropriate investment strategy, taking the available resources into account, before starting trading.
Use of the information: full or partial use of materials from this website must always be referenced to TeleTrade as the source of information. Use of the materials on the Internet must be accompanied by a hyperlink to teletrade.org. Automatic import of materials and information from this website is prohibited.
Please contact our PR department if you have any questions or need assistance at pr@teletrade.global.
transfers