- Analytics
- News and Tools
- Market News
Analytics, News, and Forecasts for CFD Markets: stock news — 22-10-2020.
U.S. stock-index futures fell on Thursday, as weekly jobless claims data pointed to a slowing recovery in the U.S. labor market, while stimulus talks dragged on.
Global Stocks:
Index/commodity | Last | Today's Change, points | Today's Change, % |
Nikkei | 23,474.27 | -165.19 | -0.70% |
Hang Seng | 24,786.13 | +31.71 | +0.13% |
Shanghai | 3,312.50 | -12.52 | -0.38% |
S&P/ASX | 6,173.80 | -18.00 | -0.29% |
FTSE | 5,762.68 | -13.82 | -0.24% |
CAC | 4,845.45 | -8.50 | -0.18% |
DAX | 12,513.56 | -44.08 | -0.35% |
Crude oil | $40.08 | +0.12% | |
Gold | $1,907.00 | -1.17% |
FXStreet reports that analysts at Credit Suisse note that S&P 500 posted another potentially bullish “inverted hammer” candlestick reversal on Wednesday, which reinforces the conviction that the “neckline” to its “head & shoulders” base and the 38.2% retracement of the recent recovery at 3428/18 will hold for a turn back higher.
“The S&P 500 completed another potentially bullish ‘inverted hammer’ candlestick reversal on Wednesday above the ‘neckline’ to its recently completed base at 3428/27 and the 38.2% retracement of the recent recovery at 3420/18. Yet another potential reversal pattern reinforces our view that 3428/18 will provide a solid floor for the uptrend to resume.”
“Resistance stays at 3477, above which would bullishly confirm yesterday’s session for strength back to 3516/18, then 3550, above which would trigger a move back to the 3588/95 high, which is also the upper end of its ‘typical’ extreme (15% above the 200-day average). Whilst this should clearly be respected, we look for a break in due course, with our ‘measured base objective’ at 3653.”
(company / ticker / price / change ($/%) / volume)
ALCOA INC. | AA | 13.51 | 0.19(1.43%) | 3429 |
ALTRIA GROUP INC. | MO | 38.49 | -0.02(-0.05%) | 7701 |
Amazon.com Inc., NASDAQ | AMZN | 3,191.25 | 6.31(0.20%) | 40191 |
American Express Co | AXP | 101.5 | 0.07(0.07%) | 2727 |
AMERICAN INTERNATIONAL GROUP | AIG | 31.7 | 0.03(0.09%) | 451 |
Apple Inc. | AAPL | 117.45 | 0.58(0.50%) | 1301677 |
AT&T Inc | T | 28.06 | 1.34(5.02%) | 2802208 |
Boeing Co | BA | 164.63 | 0.77(0.47%) | 55794 |
Caterpillar Inc | CAT | 167.5 | 0.10(0.06%) | 4095 |
Chevron Corp | CVX | 70.96 | 0.09(0.13%) | 11813 |
Cisco Systems Inc | CSCO | 38.86 | -0.20(-0.51%) | 69407 |
Citigroup Inc., NYSE | C | 43.04 | 0.03(0.07%) | 47741 |
E. I. du Pont de Nemours and Co | DD | 59 | 0.34(0.58%) | 400 |
Exxon Mobil Corp | XOM | 33.27 | 0.11(0.33%) | 58775 |
Facebook, Inc. | FB | 278 | -0.73(-0.26%) | 101281 |
FedEx Corporation, NYSE | FDX | 283.6 | 1.32(0.47%) | 20703 |
Ford Motor Co. | F | 7.92 | 0.07(0.89%) | 277686 |
Freeport-McMoRan Copper & Gold Inc., NYSE | FCX | 17.8 | 0.08(0.45%) | 148272 |
General Electric Co | GE | 7.34 | 0.02(0.27%) | 400369 |
General Motors Company, NYSE | GM | 35.88 | 0.11(0.31%) | 51870 |
Goldman Sachs | GS | 203.1 | 0.19(0.09%) | 4865 |
Google Inc. | GOOG | 1,593.69 | 0.38(0.02%) | 6790 |
Home Depot Inc | HD | 283.43 | -1.08(-0.38%) | 5524 |
HONEYWELL INTERNATIONAL INC. | HON | 172.78 | -0.09(-0.05%) | 575 |
Intel Corp | INTC | 53.56 | 0.06(0.11%) | 101521 |
International Business Machines Co... | IBM | 115.15 | 0.09(0.08%) | 13776 |
International Paper Company | IP | 46.5 | 0.02(0.04%) | 130 |
Johnson & Johnson | JNJ | 144.25 | 0.32(0.22%) | 1883 |
JPMorgan Chase and Co | JPM | 99.43 | 0.06(0.06%) | 19468 |
McDonald's Corp | MCD | 228.62 | 0.43(0.19%) | 2250 |
Microsoft Corp | MSFT | 214.15 | -0.65(-0.30%) | 144177 |
Nike | NKE | 129.89 | 0.46(0.36%) | 3133 |
Pfizer Inc | PFE | 37.13 | 0.05(0.13%) | 58868 |
Procter & Gamble Co | PG | 142.19 | -0.27(-0.19%) | 2907 |
Starbucks Corporation, NASDAQ | SBUX | 88.2 | -0.07(-0.08%) | 89611 |
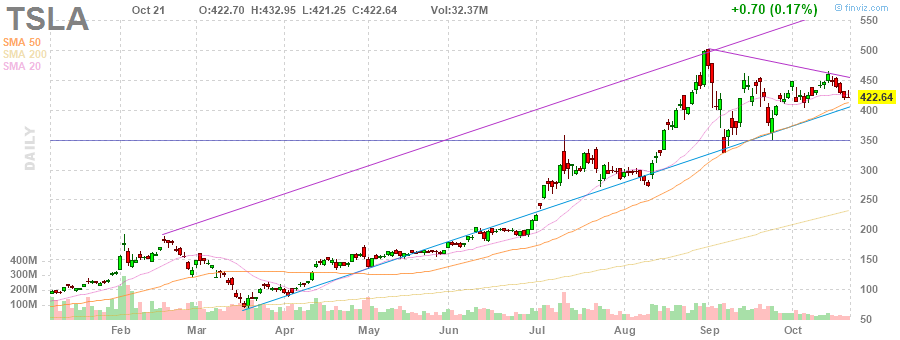
Tesla Motors, Inc., NASDAQ | TSLA | 441.36 | 18.72(4.43%) | 1219691 |
The Coca-Cola Co | KO | 51.19 | 1.20(2.40%) | 390769 |
Travelers Companies Inc | TRV | 124 | -1.00(-0.80%) | 1787 |
Twitter, Inc., NYSE | TWTR | 50.2 | -0.04(-0.08%) | 53456 |
UnitedHealth Group Inc | UNH | 322.98 | 0.19(0.06%) | 46314 |
Verizon Communications Inc | VZ | 56.93 | 0.18(0.32%) | 57503 |
Visa | V | 199 | 0.57(0.29%) | 3289 |
Wal-Mart Stores Inc | WMT | 144.8 | 0.40(0.28%) | 4029 |
Walt Disney Co | DIS | 126.5 | -0.13(-0.10%) | 7643 |
Yandex N.V., NASDAQ | YNDX | 58.44 | 1.22(2.13%) | 15632 |
Tesla (TSLA) upgraded to Outperform from Neutral at Robert W. Baird; target raised to $488
Tesla (TSLA) upgraded to Mkt Outperform from Mkt Perform at JMP Securities; target $516
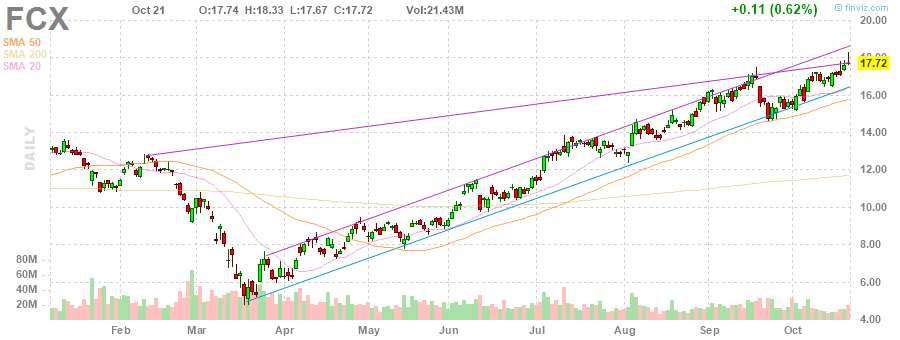
Freeport-McMoRan (FCX) reported Q3 FY 2020 earnings of $0.29 per share (versus $0.01 per share in Q3 FY 2019), beating analysts’ consensus estimate of $0.21 per share.
The company’s quarterly revenues amounted to $3.851 bln (+16.4% y/y), beating analysts’ consensus estimate of $3.676 bln.
FCX rose to $17.80 (+0.45%) in pre-market trading.
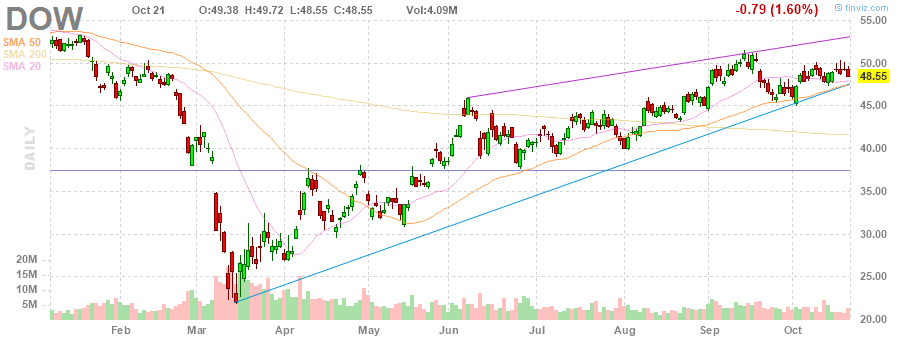
Dow (DOW) reported Q3 FY 2020 earnings of $0.50 per share (versus $0.91 per share in Q3 FY 2019), beating analysts’ consensus estimate of $0.29 per share.
The company’s quarterly revenues amounted to $9.712 bln (-9.8% y/y), beating analysts’ consensus estimate of $9.509 bln.
DOW rose to $49.16 (+1.26%) in pre-market trading.
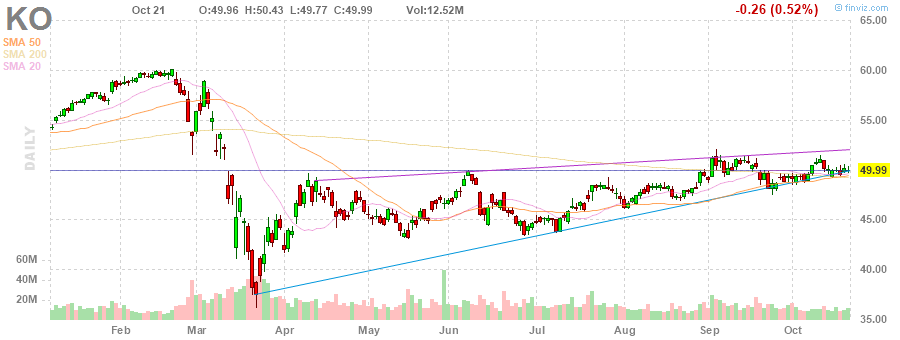
Coca-Cola (KO) reported Q3 FY 2020 earnings of $0.55 per share (versus $0.56 per share in Q3 FY 2019), beating analysts’ consensus estimate of $0.46 per share.
The company’s quarterly revenues amounted to $8.652 bln (-9.0% y/y), beating analysts’ consensus estimate of $8.366 bln.
KO rose to $50.72 (+1.46%) in pre-market trading.
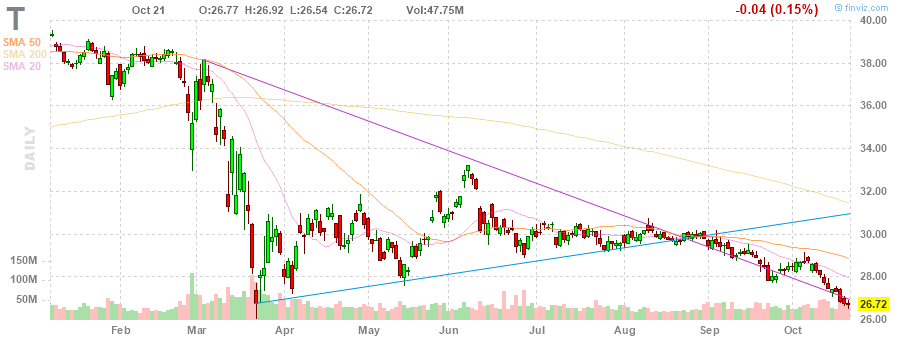
AT&T (T) reported Q3 FY 2020 earnings of $0.76 per share (versus $0.94 per share in Q3 FY 2019), missing analysts’ consensus estimate of $0.77 per share.
The company’s quarterly revenues amounted to $42.430 bln (-4.8% y/y), beating analysts’ consensus estimate of $41.659 bln.
T rose to $27.16 (+1.65%) in pre-market trading.
Tesla (TSLA) reported Q3 FY 2020 earnings of $0.76 per share (versus $1.91 per share in Q3 FY 2019), beating analysts’ consensus estimate of $0.60 per share.
The company’s quarterly revenues amounted to $8.771 bln (+39.2% y/y), beating analysts’ consensus estimate of $8.292 bln.
TSLA rose to $443.01 (+4.82%) in pre-market trading.
| Index | Change, points | Closed | Change, % |
|---|---|---|---|
| NIKKEI 225 | 72.42 | 23639.46 | 0.31 |
| Hang Seng | 184.88 | 24754.42 | 0.75 |
| KOSPI | 12.45 | 2370.86 | 0.53 |
| ASX 200 | 7.2 | 6191.8 | 0.12 |
| FTSE 100 | -112.72 | 5776.5 | -1.91 |
| DAX | -179.31 | 12557.64 | -1.41 |
| CAC 40 | -75.33 | 4853.95 | -1.53 |
| Dow Jones | -97.97 | 28210.82 | -0.35 |
| S&P 500 | -7.56 | 3435.56 | -0.22 |
| NASDAQ Composite | -31.8 | 11484.69 | -0.28 |


© 2000-2026. All rights reserved.
This site is managed by Teletrade D.J. LLC 2351 LLC 2022 (Euro House, Richmond Hill Road, Kingstown, VC0100, St. Vincent and the Grenadines).
The information on this website is for informational purposes only and does not constitute any investment advice.
The company does not serve or provide services to customers who are residents of the US, Canada, Iran, The Democratic People's Republic of Korea, Yemen and FATF blacklisted countries.
Making transactions on financial markets with marginal financial instruments opens up wide possibilities and allows investors who are willing to take risks to earn high profits, carrying a potentially high risk of losses at the same time. Therefore you should responsibly approach the issue of choosing the appropriate investment strategy, taking the available resources into account, before starting trading.
Use of the information: full or partial use of materials from this website must always be referenced to TeleTrade as the source of information. Use of the materials on the Internet must be accompanied by a hyperlink to teletrade.org. Automatic import of materials and information from this website is prohibited.
Please contact our PR department if you have any questions or need assistance at pr@teletrade.global.
transfers