- Analytics
- News and Tools
- Market News
Analytics, News, and Forecasts for CFD Markets: stock news — 27-10-2020.
FXStreet notes that S&P 500 has seen a sharp sell-off and a close below the 63-day average at 3391 would see the ‘head & shoulders’ base negated to reassert a sideways and likely choppy range into the US election. Meanwhile, the VIX has completed a base to warn of a more concerted move higher and likely lower for the market itself, with next resistance seen at 36.20, per Credit Suisse.
“A poor start to the week has seen a sharp sell-off for a conclusive break of the 38.2% retracement of the September/October rally at 3420, but with the index for now managing to hold on a closing basis its rising 63-day average, now seen at 3391. Despite this though support from the ‘neckline’ to the ‘head & shoulders’ base has been removed and whilst resistance at 3466 caps, the immediate risk is seen lower.”
“A close below 3391 is needed to confirm the base has indeed been neutralized to reassert the sideways range from the early September peak. We would then see support next at 3365 ahead of the late September price gap, starting at 3324 and stretching down to 3298/93.”
“Near-term resistance is seen at 3415, then 3440/41. Above 3466 is needed to reassert a positive tone again, with resistance then at 3516/18.”
“The VIX has completed a base to warn of a more concerted move higher, with resistance then seen next at 36.20.”
U.S. stock-index futures rose on Tuesday, as stocks attempted to rebound from a drastic sell-off a day earlier, supported by upbeat quarterly earnings reports from several big companies, which offset worries about growing coronavirus cases in the United States and some European countries and a stalled U.S. fiscal stimulus talks.
Global Stocks:
Index/commodity | Last | Today's Change, points | Today's Change, % |
Nikkei | 23,485.80 | -8.54 | -0.04% |
Hang Seng | 24,787.19 | -131.59 | -0.53% |
Shanghai | 3,254.32 | +3.20 | +0.10% |
S&P/ASX | 6,051.00 | -104.60 | -1.70% |
FTSE | 5,785.46 | -6.55 | -0.11% |
CAC | 4,776.73 | -39.39 | -0.82% |
DAX | 12,145.79 | -31.39 | -0.26% |
Crude oil | $38.67 | +0.29% | |
Gold | $1,905.40 | -0.02 |
(company / ticker / price / change ($/%) / volume)
3M Co | MMM | 165.04 | -1.12(-0.67%) | 17654 |
ALCOA INC. | AA | 13.05 | 0.05(0.38%) | 1172 |
Amazon.com Inc., NASDAQ | AMZN | 3,225.05 | 18.01(0.56%) | 35833 |
American Express Co | AXP | 97.33 | 0.45(0.46%) | 6711 |
AMERICAN INTERNATIONAL GROUP | AIG | 33.4 | 2.14(6.85%) | 36575 |
Apple Inc. | AAPL | 115.39 | 0.34(0.30%) | 701189 |
AT&T Inc | T | 27.33 | -0.05(-0.18%) | 52318 |
Boeing Co | BA | 160.5 | -0.33(-0.21%) | 73715 |
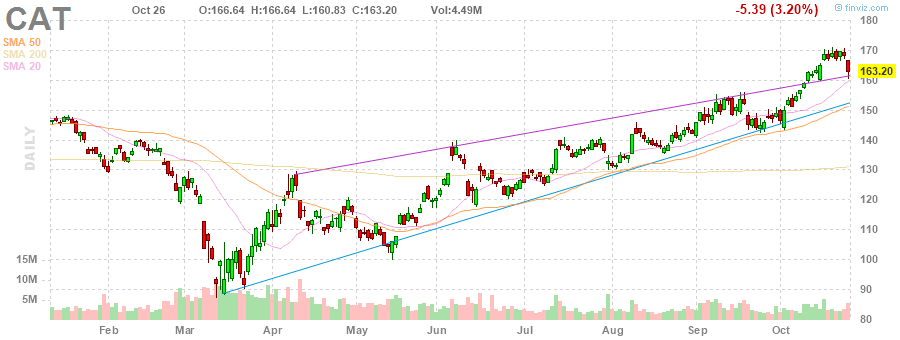
Caterpillar Inc | CAT | 159.31 | -3.89(-2.38%) | 43940 |
Chevron Corp | CVX | 71.06 | 0.12(0.17%) | 10851 |
Cisco Systems Inc | CSCO | 37.8 | 0.13(0.35%) | 26238 |
Deere & Company, NYSE | DE | 235 | 0.75(0.32%) | 1273 |
Exxon Mobil Corp | XOM | 33.36 | 0.01(0.03%) | 99585 |
Facebook, Inc. | FB | 278.26 | 1.15(0.42%) | 107366 |
FedEx Corporation, NYSE | FDX | 278.5 | 0.88(0.32%) | 5571 |
Ford Motor Co. | F | 8.07 | 0.04(0.50%) | 322452 |
Freeport-McMoRan Copper & Gold Inc., NYSE | FCX | 17.35 | -0.01(-0.06%) | 23139 |
General Electric Co | GE | 7.41 | 0.03(0.41%) | 505401 |
General Motors Company, NYSE | GM | 35.8 | -0.02(-0.06%) | 16626 |
Goldman Sachs | GS | 201.15 | 0.01(0.01%) | 2358 |
Google Inc. | GOOG | 1,598.00 | 7.55(0.47%) | 3161 |
Hewlett-Packard Co. | HPQ | 18.4 | 0.15(0.82%) | 541 |
Home Depot Inc | HD | 277 | 0.96(0.35%) | 2220 |
Intel Corp | INTC | 45.98 | -0.74(-1.58%) | 505048 |
International Business Machines Co... | IBM | 112.35 | 0.13(0.12%) | 9201 |
International Paper Company | IP | 45.3 | 0.01(0.02%) | 226 |
Johnson & Johnson | JNJ | 144.25 | 0.28(0.19%) | 5094 |
JPMorgan Chase and Co | JPM | 101.21 | -0.03(-0.03%) | 20353 |
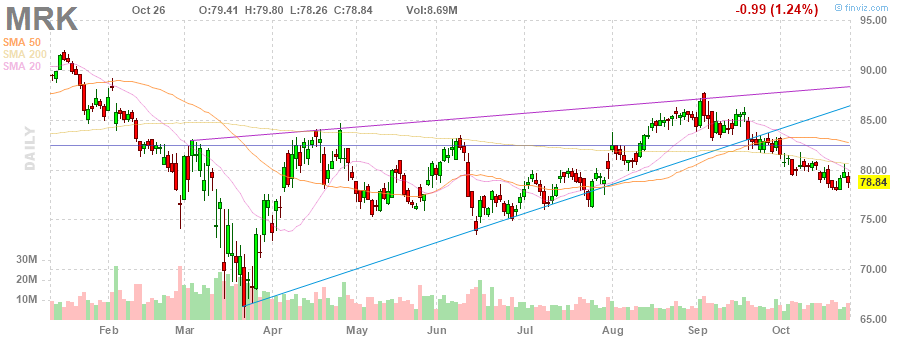
Merck & Co Inc | MRK | 79.98 | 1.14(1.45%) | 34697 |
Microsoft Corp | MSFT | 211.39 | 1.31(0.62%) | 246719 |
Nike | NKE | 128.43 | 0.06(0.05%) | 7948 |
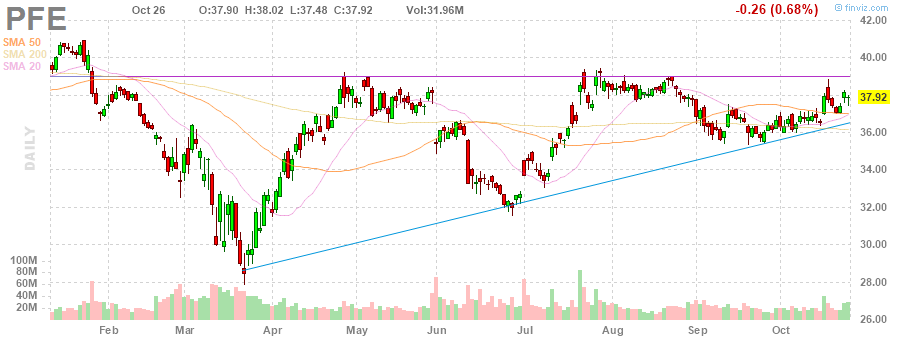
Pfizer Inc | PFE | 37.83 | -0.09(-0.24%) | 324432 |
Procter & Gamble Co | PG | 141.7 | 0.40(0.28%) | 498 |
Starbucks Corporation, NASDAQ | SBUX | 89.9 | 0.24(0.27%) | 56410 |
Tesla Motors, Inc., NASDAQ | TSLA | 419.75 | -0.53(-0.13%) | 194671 |
The Coca-Cola Co | KO | 49.9 | 0.10(0.20%) | 11381 |
Twitter, Inc., NYSE | TWTR | 49.41 | 0.41(0.84%) | 48257 |
UnitedHealth Group Inc | UNH | 324.12 | 1.06(0.33%) | 1059 |
Verizon Communications Inc | VZ | 57.75 | -0.06(-0.10%) | 4403 |
Visa | V | 193.6 | 0.53(0.27%) | 5217 |
Wal-Mart Stores Inc | WMT | 142.15 | -0.01(-0.01%) | 8028 |
Walt Disney Co | DIS | 124.38 | 0.32(0.26%) | 4330 |
Yandex N.V., NASDAQ | YNDX | 58.97 | -0.16(-0.27%) | 9687 |
FXStreet reports that based on experience working with diverse asset owners, the Morgan Stanley Institute for Sustainable Investing and Morgan Stanley Investment Management have developed a four-part framework tailored to help asset owners develop, implement and maintain a dynamic sustainable investing strategy.
“Organizations should first define the reasons why they want to integrate sustainability factors into their investment processes. All key internal stakeholders, including senior leadership and investment teams, should be engaged in defining the investment philosophy.”
“Investors can choose the approaches that best reflect their investment philosophy. Restriction screening: Avoiding investments in certain sectors or specific issuers, based on values or risk-based criteria. ESG integration: Considering ESG criteria alongside financial analysis to identify risks and opportunities throughout the investment process. Thematic investments: Investing focused on certain themes and sectors positioned to solve global sustainability-related challenges. Impact investing: Allocating to funds or enterprises structured to deliver a specific and measurable set of positive social and/or environmental impacts alongside market-rate financial returns. Company/issuer engagement: Aiming to drive improvement in ESG activities or outcomes through proxy voting or active dialogue with invested companies/issuers.”
“Institutions may opt to first introduce sustainability considerations when existing investment mandates roll over or there’s new cash to invest. They might also consider a dedicated strategy consisting of one or multiple asset classes that mirror the overall asset allocation, which can help build proof-of-concept internally.”
“Appropriate governance forms the operational backbone for supporting implementation and for defining, communicating and meeting sustainable investing goals. A set of formalized and documented sustainable investing goals – including the use of an annual sustainability report or website – can also help align key stakeholders. Beyond governance and communication, asset owners must identify the needed resources – employees, skill-sets, data and tools – to support a dynamic sustainable investing strategy for the long term.”
Merck (MRK) reported Q3 FY 2020 earnings of $1.74 per share (versus $1.51 per share in Q3 FY 2019), beating analysts’ consensus estimate of $1.43 per share.
The company’s quarterly revenues amounted to $12.551 bln (+1.2% y/y), beating analysts’ consensus estimate of $12.213 bln.
MRK rose to $79.80 (+1.22%) in pre-market trading.
Pfizer (PFE) reported Q3 FY 2020 earnings of $0.72 per share (versus $0.75 per share in Q3 FY 2019), beating analysts’ consensus estimate of $0.71 per share.
The company’s quarterly revenues amounted to $12.131 bln (-4.3% y/y), missing analysts’ consensus estimate of $12.298 bln.
PFE fell to $37.86 (-0.16%) in pre-market trading.
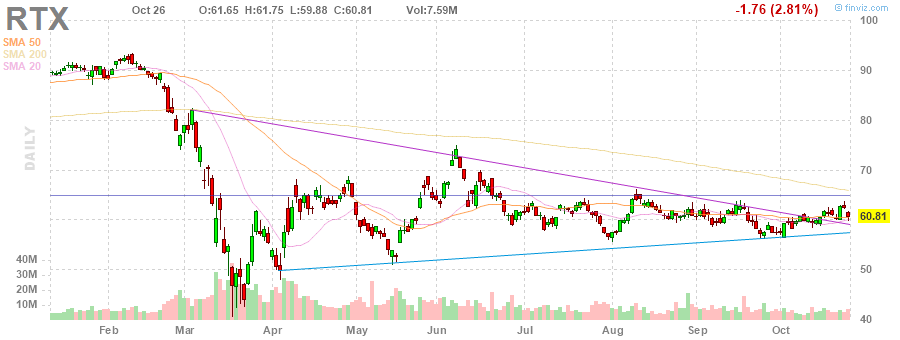
Raytheon Technologies (RTX) reported Q3 FY 2020 earnings of $0.58 per share (versus $1.27 per share in Q3 FY 2019), beating analysts’ consensus estimate of $0.50 per share.
The company’s quarterly revenues amounted to $15.047 bln (+32.3% y/y), roughly in line with analysts’ consensus estimate of $15.157 bln.
RTX rose to $61.00 (0.31%) in pre-market trading.
Caterpillar (CAT) reported Q3 FY 2020 earnings of $1.34 per share (versus $2.66 per share in Q3 FY 2019), beating analysts’ consensus estimate of $1.17 per share.
The company’s quarterly revenues amounted to $9.881 bln (-22.6% y/y), beating analysts’ consensus estimate of $9.780 bln.
CAT fell to $160.99 (-1.35%) in pre-market trading.
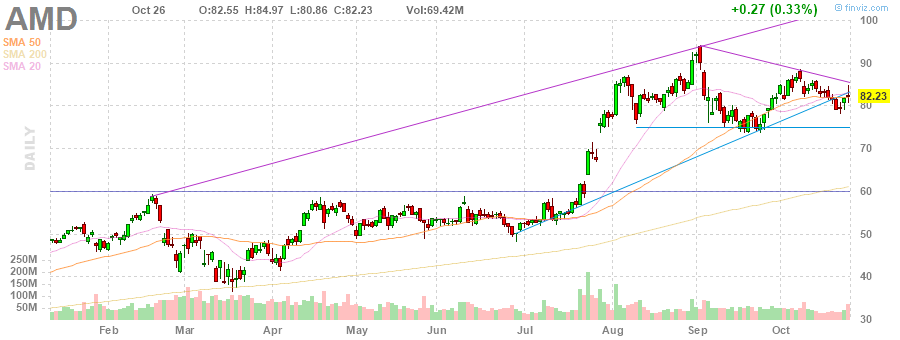
Advanced Micro (AMD) reported Q3 FY 2020 earnings of $0.41 per share (versus $0.18 per share in Q3 FY 2019), beating analysts’ consensus estimate of $0.31 per share.
The company’s quarterly revenues amounted to $2.801 bln (+55.5% y/y), beating analysts’ consensus estimate of $2.563 bln.
The company also issued upside guidance for Q4 FY 2020, projecting revenues of $2.90-3.10 bln versus analysts’ consensus estimate of $2.62 bln.
AMD fell to $79.78 (-2.98%) in pre-market trading.
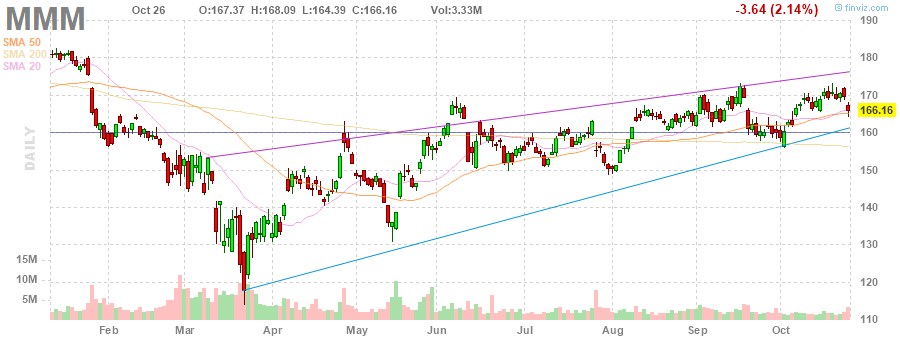
3M (MMM) reported Q3 FY 2020 earnings of $2.43 per share (versus $2.72 per share in Q3 FY 2019), beating analysts’ consensus estimate of $2.27 per share.
The company’s quarterly revenues amounted to $8.350 bln (+4.5% y/y), roughly in line with analysts’ consensus estimate of $8.380 bln.
MMM rose to $166.83 (+0.40%) in pre-market trading.
| Index | Change, points | Closed | Change, % |
|---|---|---|---|
| NIKKEI 225 | -22.25 | 23494.34 | -0.09 |
| KOSPI | -16.9 | 2343.91 | -0.72 |
| ASX 200 | -11.4 | 6155.6 | -0.18 |
| FTSE 100 | -68.27 | 5792.01 | -1.16 |
| DAX | -468.57 | 12177.18 | -3.71 |
| CAC 40 | -93.52 | 4816.12 | -1.9 |
| Dow Jones | -650.19 | 27685.38 | -2.29 |
| S&P 500 | -64.42 | 3400.97 | -1.86 |
| NASDAQ Composite | -189.34 | 11358.94 | -1.64 |


© 2000-2026. All rights reserved.
This site is managed by Teletrade D.J. LLC 2351 LLC 2022 (Euro House, Richmond Hill Road, Kingstown, VC0100, St. Vincent and the Grenadines).
The information on this website is for informational purposes only and does not constitute any investment advice.
The company does not serve or provide services to customers who are residents of the US, Canada, Iran, The Democratic People's Republic of Korea, Yemen and FATF blacklisted countries.
Making transactions on financial markets with marginal financial instruments opens up wide possibilities and allows investors who are willing to take risks to earn high profits, carrying a potentially high risk of losses at the same time. Therefore you should responsibly approach the issue of choosing the appropriate investment strategy, taking the available resources into account, before starting trading.
Use of the information: full or partial use of materials from this website must always be referenced to TeleTrade as the source of information. Use of the materials on the Internet must be accompanied by a hyperlink to teletrade.org. Automatic import of materials and information from this website is prohibited.
Please contact our PR department if you have any questions or need assistance at pr@teletrade.global.
transfers