- Analytics
- News and Tools
- Market News
- Gold Price Forecast: XAU/USD faces a wall of resistance near $1791 – Confluence Detector
Gold Price Forecast: XAU/USD faces a wall of resistance near $1791 – Confluence Detector
- Gold price stalls its three-day uptrend, as USD recovers ground broadly.
- Gold’s retreat remains capped by easing Treasury yields amid risk-off mood.
- Gold: Sellers defend $1,800, all eyes on US T-bond yields.
Gold price is consolidating the three-day winning streak, although the bulls appear to lack follow-through upside amid a rebound in the US dollar across the board. Mixing European earnings reports and China’s property sector woes are weighing on the investors’ sentiment, boding well for the safe-haven dollar while capping the upside in gold price. Going forward, the broader risk sentiment will continue to remain the market driver, impacting the USD valuations, in turn, gold’s.
Read: Gold Price Forecast: Will XAU/USD find acceptance above channel hurdle at $1791?
Gold Price: Key levels to watch
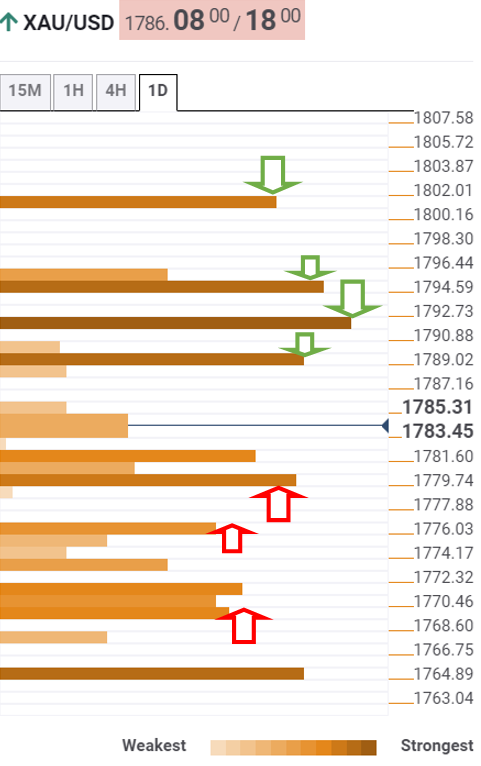
The Technical Confluences Detector shows that gold is heading back towards the daily highs of $1789, where the Fibonacci 23.6% one-week aligns.
If that barrier is crossed on a sustained basis, then gold bulls will target the next crucial resistance at $1791, the confluence of the Fibonacci 61.8% one-month and pivot point one-day R1.
Further up, gold will face another critical resistance at $1795, the convergence of the pivot point one-week R1, SMA100 and 200 one-day.
The last line of defense for gold sellers is the intersection of the previous week’s high and pivot point one-day R2 at $1801.
On the flip side, a dense cluster of support levels awaits around $1780, where the Fibonacci 38.2% one-week meets with the Fibonacci 38.2% one-day.
The next cushion is placed at $1776, the confluence of the Fibonacci 61.8% one-day and SMA5 one-day.
$1769 will challenge the bullish commitment, as the SMA10 one-day, pivot point one-day S1 SMA200 four-hour and Fibonacci 61.8% one-week coincide at that level.
Here is how it looks on the tool
About Technical Confluences Detector
The TCD (Technical Confluences Detector) is a tool to locate and point out those price levels where there is a congestion of indicators, moving averages, Fibonacci levels, Pivot Points, etc. If you are a short-term trader, you will find entry points for counter-trend strategies and hunt a few points at a time. If you are a medium-to-long-term trader, this tool will allow you to know in advance the price levels where a medium-to-long-term trend may stop and rest, where to unwind positions, or where to increase your position size.


© 2000-2026. All rights reserved.
This site is managed by Teletrade D.J. LLC 2351 LLC 2022 (Euro House, Richmond Hill Road, Kingstown, VC0100, St. Vincent and the Grenadines).
The information on this website is for informational purposes only and does not constitute any investment advice.
The company does not serve or provide services to customers who are residents of the US, Canada, Iran, The Democratic People's Republic of Korea, Yemen and FATF blacklisted countries.
Making transactions on financial markets with marginal financial instruments opens up wide possibilities and allows investors who are willing to take risks to earn high profits, carrying a potentially high risk of losses at the same time. Therefore you should responsibly approach the issue of choosing the appropriate investment strategy, taking the available resources into account, before starting trading.
Use of the information: full or partial use of materials from this website must always be referenced to TeleTrade as the source of information. Use of the materials on the Internet must be accompanied by a hyperlink to teletrade.org. Automatic import of materials and information from this website is prohibited.
Please contact our PR department if you have any questions or need assistance at pr@teletrade.global.
transfers