- Analytics
- News and Tools
- Market News
- Gold Price Forecast: XAU/USD still targets $1,884 amid looming inflation fears – Confluence Detector
Gold Price Forecast: XAU/USD still targets $1,884 amid looming inflation fears – Confluence Detector
- Gold price eases before resuming the next leg higher towards $1,884
- Gold remains undeterred by the global tightening calls after hot US inflation.
- Gold capitalizes on inflation fears, buyers look to retain control.
Gold price is snapping its week-long winning streak, as bulls take a breather ahead of Tuesday’s critical US Retail Sales release. Underlying surging inflationary risks and a dip in the US consumer confidence have added to the Fed’s dilemma on the timing of a potential rate hike, which renders positive for gold buyers. Meanwhile, upbeat Chinese economic data have lifted the overall market mood at the start of a fresh week, warranting caution for the gold price rally.
Read: Gold Price Forecast: XAU/USD down but not out, a test of $1,900 remains on the cards
Gold Price: Key levels to watch
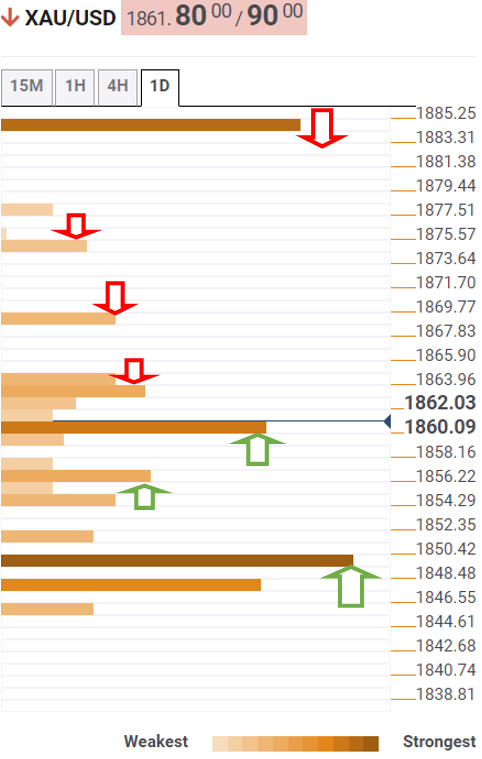
The Technical Confluences Detector shows that gold price has recaptured a powerful support-turned-resistance at $1,860, which is the convergence of the Fibonacci 38.2% one-day and SMA10 four-hour.
The Fibonacci 23.6% one-day at $1,864 will likely challenge the rebound, with the next upside target envisioned at $1,869, the previous day’s high.
Further up, the pivot point one-day R1 at $1,874 will be on the buyers’ radars. Acceptance above the latter will trigger a fresh advance towards $1,884, the confluence of the pivot point one-month R3 and pivot point one-day R2.
Alternatively, if the sellers find control below daily lows of $1,756, then the Fibonacci 61.8% one-day at $1,853 will be put at risk.
The level to beat for gold bears is at around $1,850, which is the intersection of the pivot point one-month R2, Fibonacci 38.2% one-week and SMA5 one-day.
Here is how it looks on the tool
About Technical Confluences Detector
The TCD (Technical Confluences Detector) is a tool to locate and point out those price levels where there is a congestion of indicators, moving averages, Fibonacci levels, Pivot Points, etc. If you are a short-term trader, you will find entry points for counter-trend strategies and hunt a few points at a time. If you are a medium-to-long-term trader, this tool will allow you to know in advance the price levels where a medium-to-long-term trend may stop and rest, where to unwind positions, or where to increase your position size.


© 2000-2026. All rights reserved.
This site is managed by Teletrade D.J. LLC 2351 LLC 2022 (Euro House, Richmond Hill Road, Kingstown, VC0100, St. Vincent and the Grenadines).
The information on this website is for informational purposes only and does not constitute any investment advice.
The company does not serve or provide services to customers who are residents of the US, Canada, Iran, The Democratic People's Republic of Korea, Yemen and FATF blacklisted countries.
Making transactions on financial markets with marginal financial instruments opens up wide possibilities and allows investors who are willing to take risks to earn high profits, carrying a potentially high risk of losses at the same time. Therefore you should responsibly approach the issue of choosing the appropriate investment strategy, taking the available resources into account, before starting trading.
Use of the information: full or partial use of materials from this website must always be referenced to TeleTrade as the source of information. Use of the materials on the Internet must be accompanied by a hyperlink to teletrade.org. Automatic import of materials and information from this website is prohibited.
Please contact our PR department if you have any questions or need assistance at pr@teletrade.global.
transfers