- Analytics
- News and Tools
- Market News
- Gold Price Forecast: Acceptance above $1,870 is critical for XAU/USD bulls – Confluence Detector
Gold Price Forecast: Acceptance above $1,870 is critical for XAU/USD bulls – Confluence Detector
- Gold price consolidates the upside, with stiff resistance seen at $1,870.
- Weaker Treasury yields underpin but global tightening bets limit gold bulls.
- Gold capitalizes on inflation fears, buyers look to retain control.
Gold price is struggling to extend the upside beyond the critical $1,870 supply zone, despite the extended weakness in the US Treasury yields and the dollar. Increased calls for the global central banks to act to tackle inflation are limiting gold’s bullish momentum. Although, gold bulls continue to benefit from the persistent worries and the recent retreat in the US rates from three-week highs. Fed speculation and inflation concerns will continue to drive the sentiment around the yields and gold price.
Read: Gold Price Forecast: Falling yields could fuel a sustained break above $1,878 in XAU/USD
Gold Price: Key levels to watch
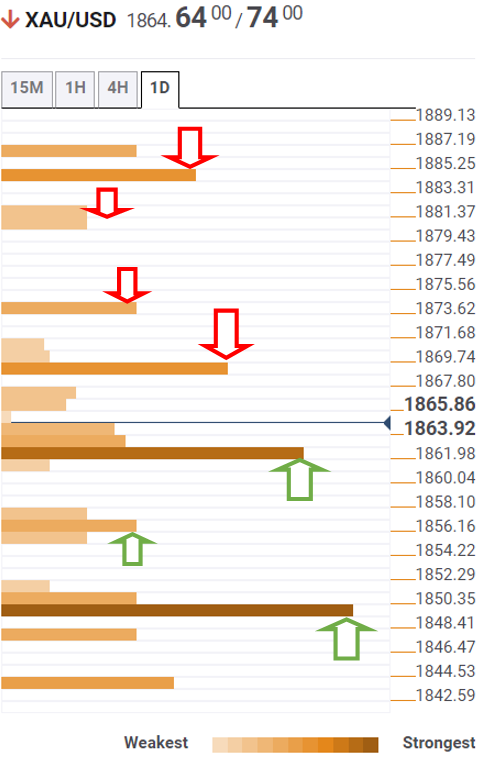
The Technical Confluences Detector shows that gold price is wavering below the critical topside hurdle of $1,870, which is the meeting point of the previous week’s high and the previous day’s high.
Acceptance above the latter will kick start a fresh advance towards $1,880, where the pivot point one-day R2 lies.
Ahead of that the confluence of the pivot point one-day R1 and Bollinger Band four-hour Upper at $1,873 will guard the upside.
If the bulls flex their muscles, then the pivot point one-month R3 at $1,884 will get tested.
Alternatively, sellers need a strong foothold below $1,862, the convergence of the Fibonacci 38.2% one-day and SMA5 one-day, to take over complete control.
The next critical cushion is seen at $1,857, the intersection of the Fibonacci 61.8% one-day and Fibonacci 23.6% one-week.
The pivot point one-month R2 at $1,850 is the last line of defense for gold optimists.
Here is how it looks on the tool
About Technical Confluences Detector
The TCD (Technical Confluences Detector) is a tool to locate and point out those price levels where there is a congestion of indicators, moving averages, Fibonacci levels, Pivot Points, etc. If you are a short-term trader, you will find entry points for counter-trend strategies and hunt a few points at a time. If you are a medium-to-long-term trader, this tool will allow you to know in advance the price levels where a medium-to-long-term trend may stop and rest, where to unwind positions, or where to increase your position size.


© 2000-2026. All rights reserved.
This site is managed by Teletrade D.J. LLC 2351 LLC 2022 (Euro House, Richmond Hill Road, Kingstown, VC0100, St. Vincent and the Grenadines).
The information on this website is for informational purposes only and does not constitute any investment advice.
The company does not serve or provide services to customers who are residents of the US, Canada, Iran, The Democratic People's Republic of Korea, Yemen and FATF blacklisted countries.
Making transactions on financial markets with marginal financial instruments opens up wide possibilities and allows investors who are willing to take risks to earn high profits, carrying a potentially high risk of losses at the same time. Therefore you should responsibly approach the issue of choosing the appropriate investment strategy, taking the available resources into account, before starting trading.
Use of the information: full or partial use of materials from this website must always be referenced to TeleTrade as the source of information. Use of the materials on the Internet must be accompanied by a hyperlink to teletrade.org. Automatic import of materials and information from this website is prohibited.
Please contact our PR department if you have any questions or need assistance at pr@teletrade.global.
transfers