- Analytics
- News and Tools
- Market News
- AUD/JPY Price Analysis: Struggles at 100.00, retreats but uptrend stays intact
AUD/JPY Price Analysis: Struggles at 100.00, retreats but uptrend stays intact
- AUD/JPY nears 100.00 after strong Australian job data.
- Above Ichimoku Cloud, moving averages hint bullish trend.
- Resistance at 100.17, 101.00, with 102.84, 2014’s swing high as next target.
- Correction might pull to 99.05 and retreat deeper to 98.53, but bullish sentiment prevails.
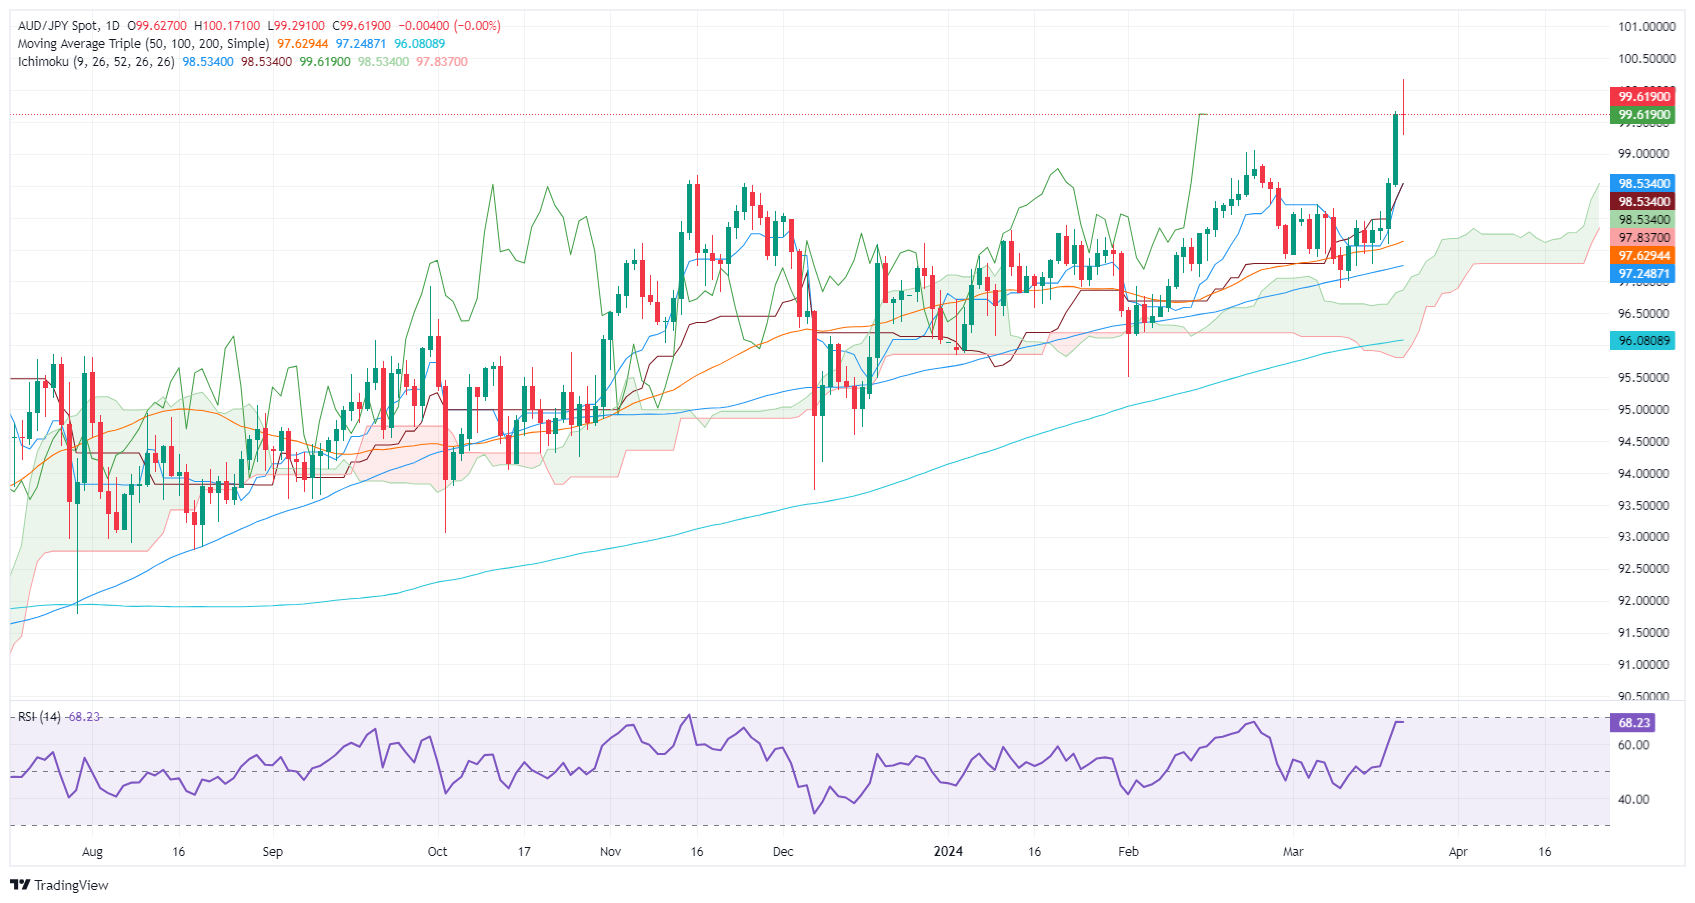
The AUD/JPY is virtually unchanged on Thursday in late trading during the North American session. At the time of writing, the pair is 99.62 shy of the 100.00 figure after hitting a ten-year high of 100.17 on positive Aussie jobs data.
AUD/JPY Price Analysis: Technical outlook.
The AUD/JPY daily chart suggests the cross is upward biased, though today’s price action indicates neither buyers nor sellers are gaining the battle. The pair surged past the Ichimoku Cloud (Kumo), signaling a strong uptrend, reinforced by the price exchanging hands above both the Tenkan and Kijun-Sen levels.
The slope of the Senkou Span A aims higher, indicating that further upside is seen. The 100.00 figure is the key resistance level. Once cleared, the next stop would be 100.17 and the 101.00 figure. Up next would be the 2014 high at 102.84.
Nevertheless, due to an overextended market move, the potential for a mean reversion move increases. Even though a pullback to the February 23 swing high at 99.05 isn’t out of cards, the pullback could be capitalized by bulls, as the rally is set to continue. However, a deeper pullback below that level could expose the Tenkan and Kijun-sen levels at 98.53.
AUD/JPY Price Action – Daily Chart


© 2000-2026. All rights reserved.
This site is managed by Teletrade D.J. LLC 2351 LLC 2022 (Euro House, Richmond Hill Road, Kingstown, VC0100, St. Vincent and the Grenadines).
The information on this website is for informational purposes only and does not constitute any investment advice.
The company does not serve or provide services to customers who are residents of the US, Canada, Iran, The Democratic People's Republic of Korea, Yemen and FATF blacklisted countries.
Making transactions on financial markets with marginal financial instruments opens up wide possibilities and allows investors who are willing to take risks to earn high profits, carrying a potentially high risk of losses at the same time. Therefore you should responsibly approach the issue of choosing the appropriate investment strategy, taking the available resources into account, before starting trading.
Use of the information: full or partial use of materials from this website must always be referenced to TeleTrade as the source of information. Use of the materials on the Internet must be accompanied by a hyperlink to teletrade.org. Automatic import of materials and information from this website is prohibited.
Please contact our PR department if you have any questions or need assistance at pr@teletrade.global.
transfers