- Analytics
- News and Tools
- Market News
- EUR/JPY Price Analysis: Bearish sentiment gains sway, 20-day SMA lost
EUR/JPY Price Analysis: Bearish sentiment gains sway, 20-day SMA lost
- Increasing bearish pressure is shown by the RSI and MACD of both hourly and daily charts.
- Sellers appear to have control, after gaining the 20-day SMA.
- Buyers need to maintain control over the 100 and 200-day SMAs to prevent further bearish inclination.
The EUR/JPY pair is settling at the 163.00 level, displaying a noteworthy shift favoring the sellers. Although the pair is securely situated above key long-term Simple Moving Averages (SMAs), implying a possible enduring bullish bias, recent indicators suggest a change in the narrative for the short term.
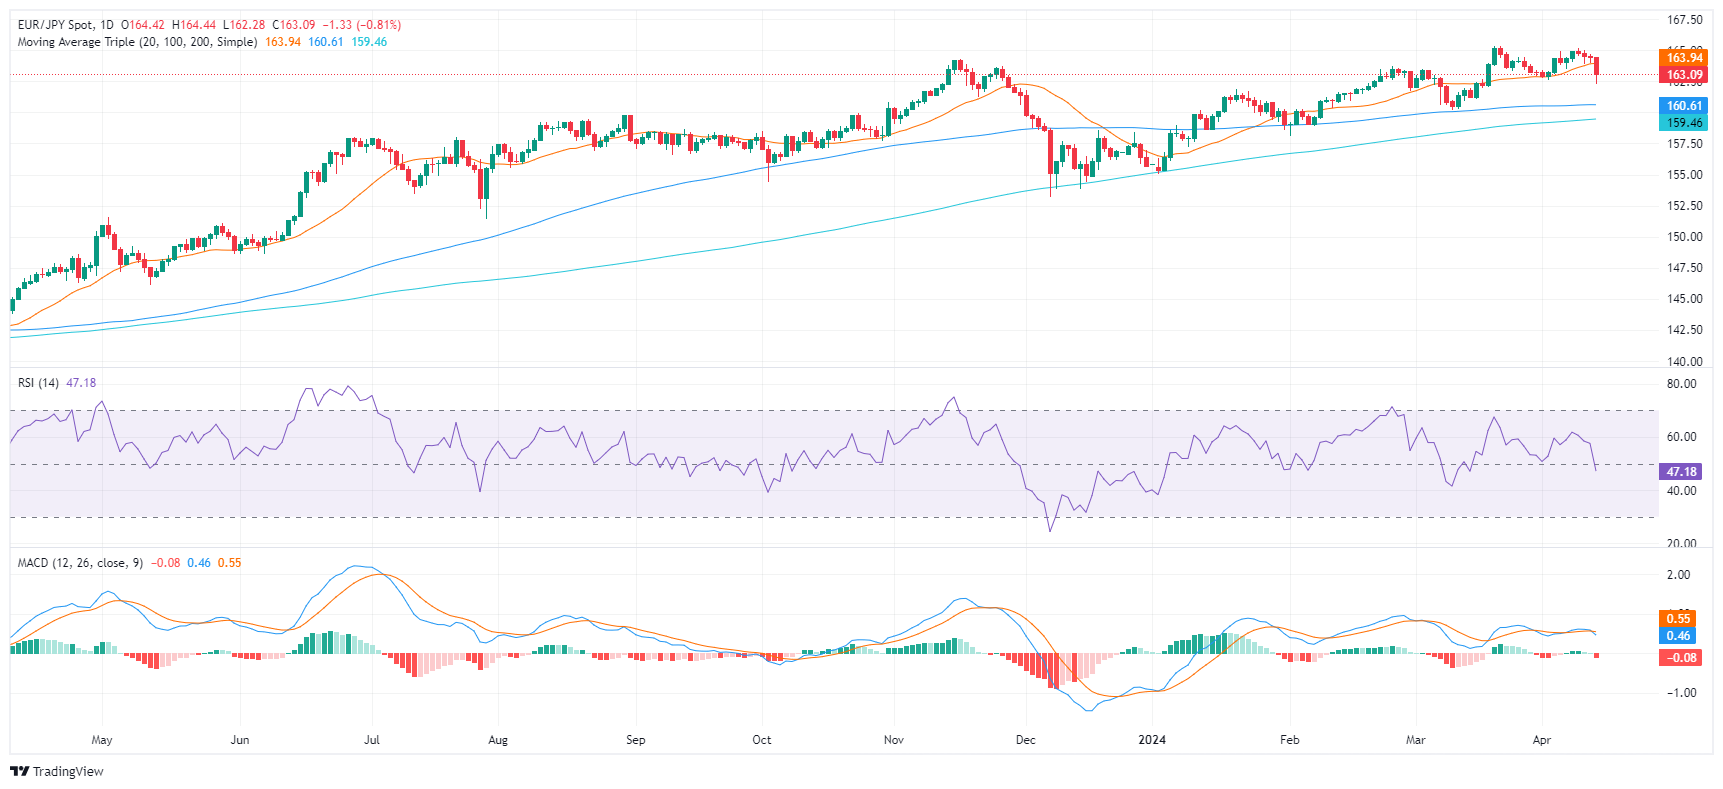
On the daily chart the Relative Strength Index (RSI) indicates a negative trend, having dropped from positive territory to 46. Illustrating this downward trajectory, the Moving Average Convergence Divergence (MACD) also prints red bars, indicating a negative momentum underway.
EUR/JPY daily chart
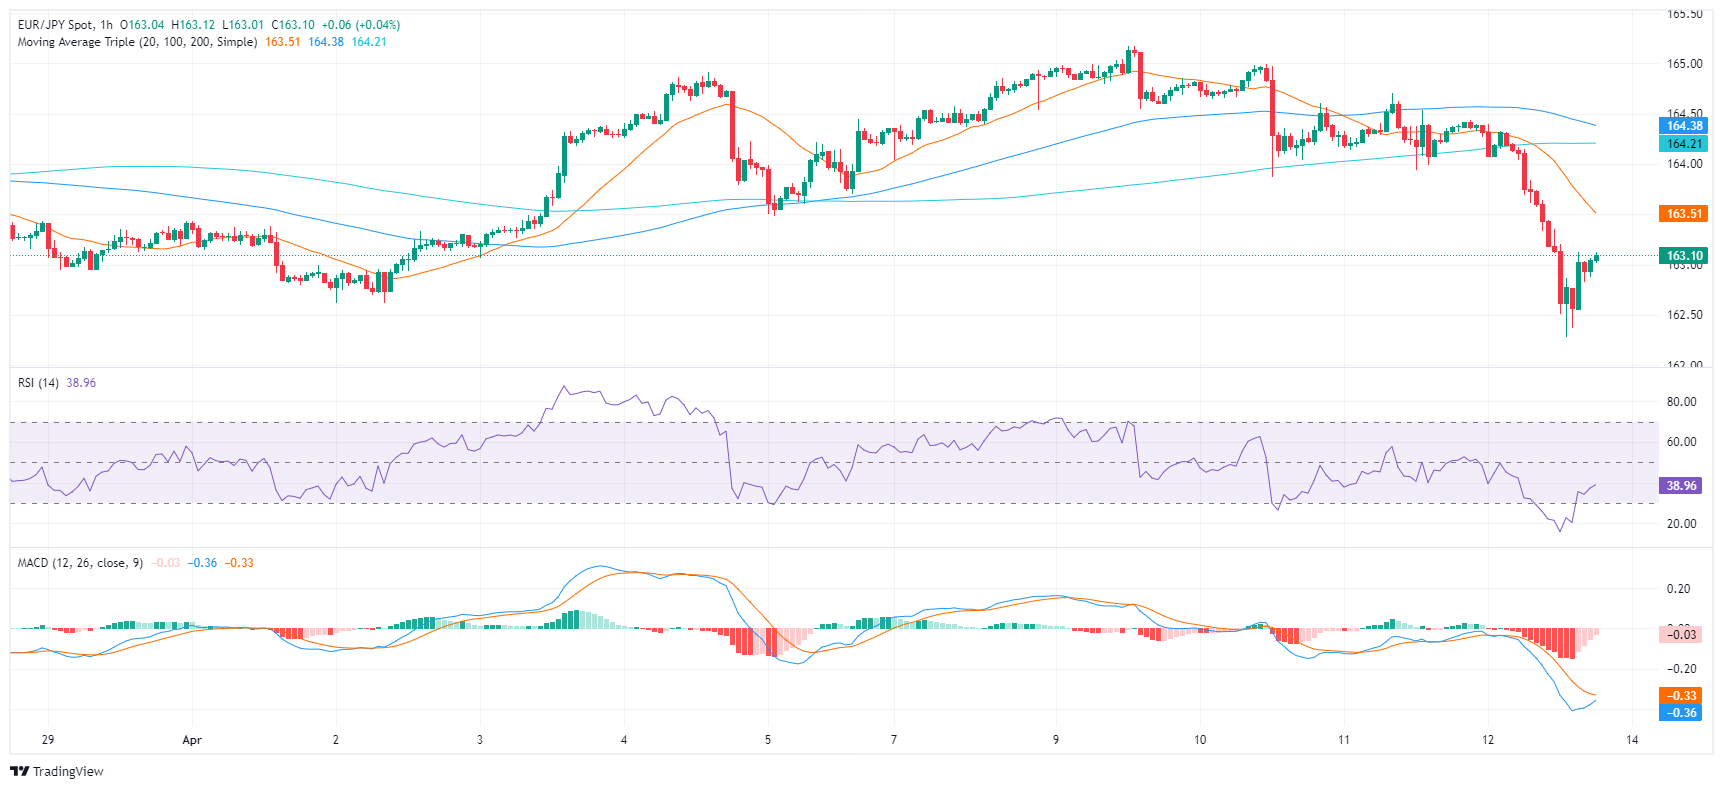
Switching to the hourly chart, the RSI reveals a similar picture, with the latest reading sitting at 39, reflecting a continuous negative trend. The MACD also prints red bars, carrying the negative momentum from the daily chart to the hourly chart. These indicators, together, could suggest an ongoing bearish pressure for the EUR/JPY throughout the session.
EUR/JPY hourly chart
On the broader outlook, the EUR/JPY gives mixed signals from a technical analysis standpoint. On Friday, it fell below the 20-day Simple Moving Average (SMA), hinting at a possible bearish shift in the short-term trend. This could trigger increased selling pressure on the pair with the potential of further losses. Yet, from a broader perspective, the cross stands above both the 100 and 200-day SMA, which leaves a long-term bullish outlook intact.


© 2000-2026. All rights reserved.
This site is managed by Teletrade D.J. LLC 2351 LLC 2022 (Euro House, Richmond Hill Road, Kingstown, VC0100, St. Vincent and the Grenadines).
The information on this website is for informational purposes only and does not constitute any investment advice.
The company does not serve or provide services to customers who are residents of the US, Canada, Iran, The Democratic People's Republic of Korea, Yemen and FATF blacklisted countries.
Making transactions on financial markets with marginal financial instruments opens up wide possibilities and allows investors who are willing to take risks to earn high profits, carrying a potentially high risk of losses at the same time. Therefore you should responsibly approach the issue of choosing the appropriate investment strategy, taking the available resources into account, before starting trading.
Use of the information: full or partial use of materials from this website must always be referenced to TeleTrade as the source of information. Use of the materials on the Internet must be accompanied by a hyperlink to teletrade.org. Automatic import of materials and information from this website is prohibited.
Please contact our PR department if you have any questions or need assistance at pr@teletrade.global.
transfers