- Analytics
- News and Tools
- Market News
- EUR/JPY Price Analysis: Bulls Maintain Control, consolidation phase likely
EUR/JPY Price Analysis: Bulls Maintain Control, consolidation phase likely
- The RSI on the daily chart of EUR/JPY indicates sustained bullish momentum.
- Hourly chart shows an RSI below its mid-zone and MACD with rising red bars, pointing towards possible consolidation.
- The EUR/JPY's position above main SMAs underscores a strong bullish bias.
The EUR/JPY slightly declined to 164.70 in Thursday’s session. That being said, the overall trend still favors the bulls but a consolidation phase, suggested by bears dominating the hourly chart, may create a balanced playing field for both buyers and sellers ahead of the Asian session.
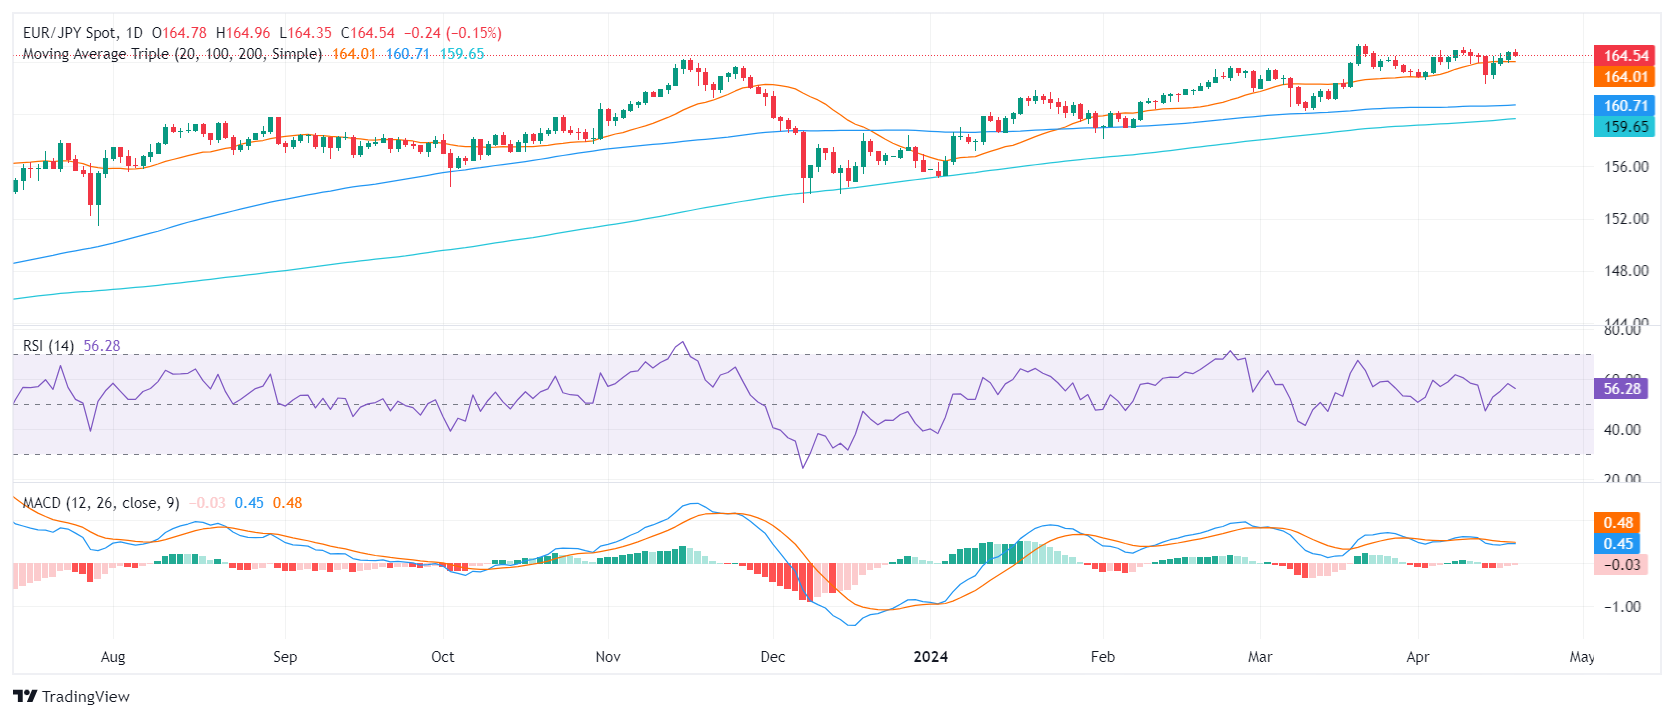
On the daily chart, the Relative Strength Index (RSI) for the EUR/JPY pair is in positive territory, with a most recent reading of 58. This suggests that the pair's upsurge might remain intact as long as the RSI stays above the 50 mark, indicating that buyers are in control at this moment.
EUR/JPY daily chart
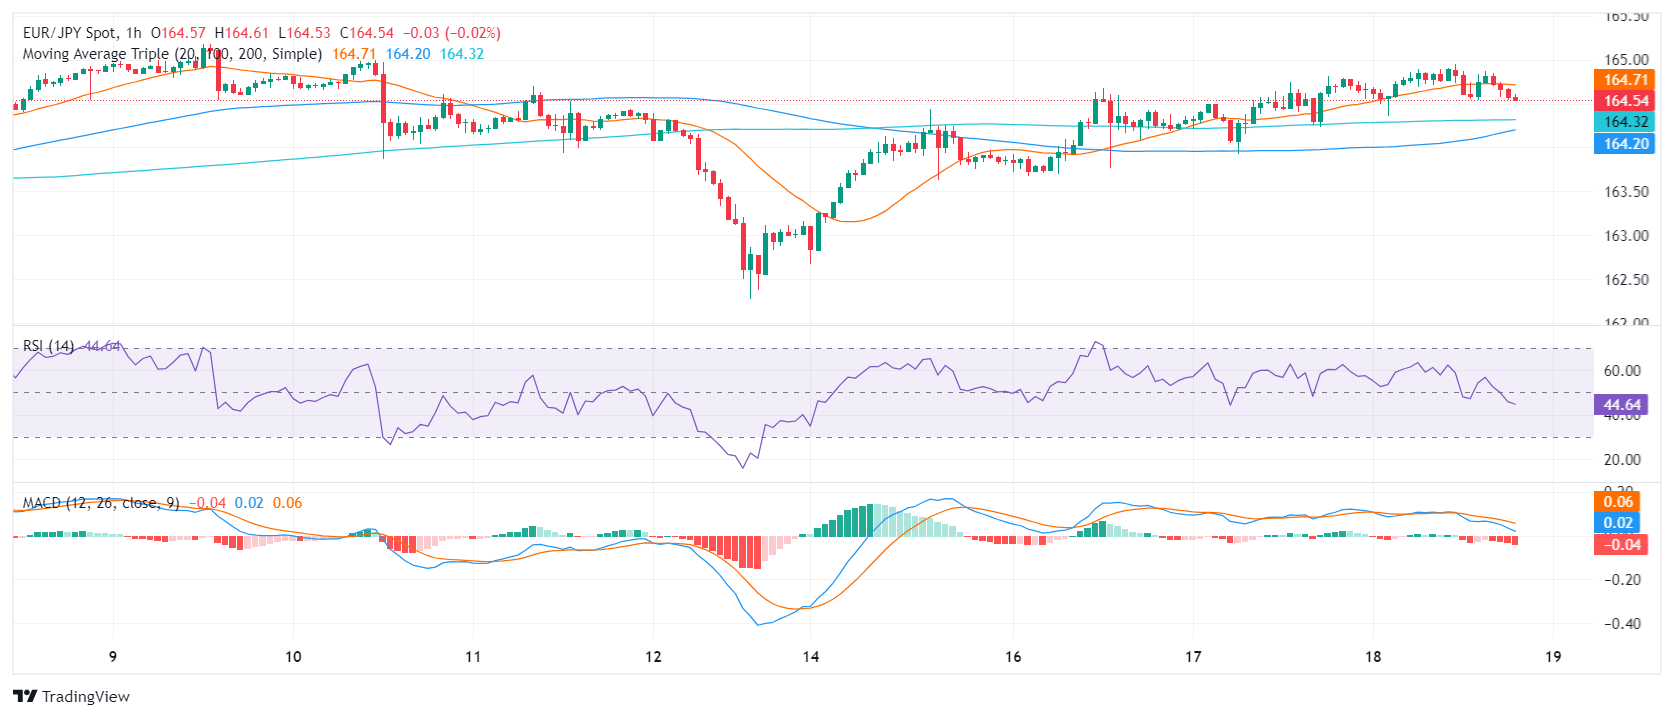
Meanwhile, on the hourly chart, the EUR/JPY's RSI declined below its middle zone, with the latest reading of 44 as of the last hour. This could point towards a pending period of consolidation. The Moving Average Convergence Divergence (MACD) displays rising red bars, also hinting at a temporary slowdown in the bullish momentum.
EUR/JPY hourly chart
Regarding the Simple Moving Average (SMA), the cross EUR/JPY holds strong above its 20, 100, and 200-day SMAs, indicating a bullish stance. That being said the pair must defend the 20-day SMA at 164.00 which is a strong support to maintain the positive short-term outlook.


© 2000-2026. All rights reserved.
This site is managed by Teletrade D.J. LLC 2351 LLC 2022 (Euro House, Richmond Hill Road, Kingstown, VC0100, St. Vincent and the Grenadines).
The information on this website is for informational purposes only and does not constitute any investment advice.
The company does not serve or provide services to customers who are residents of the US, Canada, Iran, The Democratic People's Republic of Korea, Yemen and FATF blacklisted countries.
Making transactions on financial markets with marginal financial instruments opens up wide possibilities and allows investors who are willing to take risks to earn high profits, carrying a potentially high risk of losses at the same time. Therefore you should responsibly approach the issue of choosing the appropriate investment strategy, taking the available resources into account, before starting trading.
Use of the information: full or partial use of materials from this website must always be referenced to TeleTrade as the source of information. Use of the materials on the Internet must be accompanied by a hyperlink to teletrade.org. Automatic import of materials and information from this website is prohibited.
Please contact our PR department if you have any questions or need assistance at pr@teletrade.global.
transfers