- Analytics
- News and Tools
- Market News
- NZD/JPY Price Analysis: Buyers dominance diminishes, market could favor sellers soon
NZD/JPY Price Analysis: Buyers dominance diminishes, market could favor sellers soon
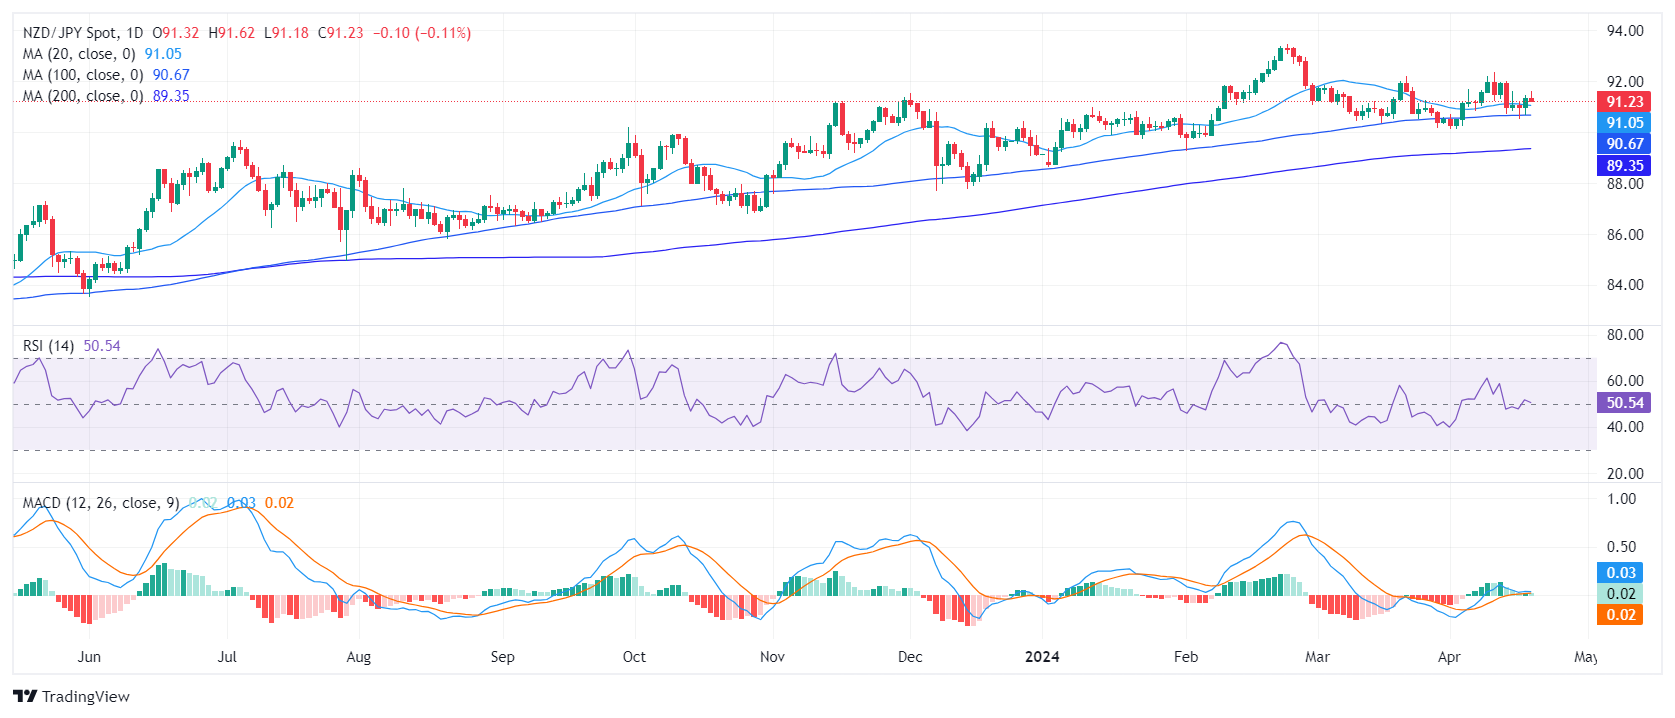
- The daily RSI shows that buyers' hold over the market is likely fading, signaling the growing presence of sellers.
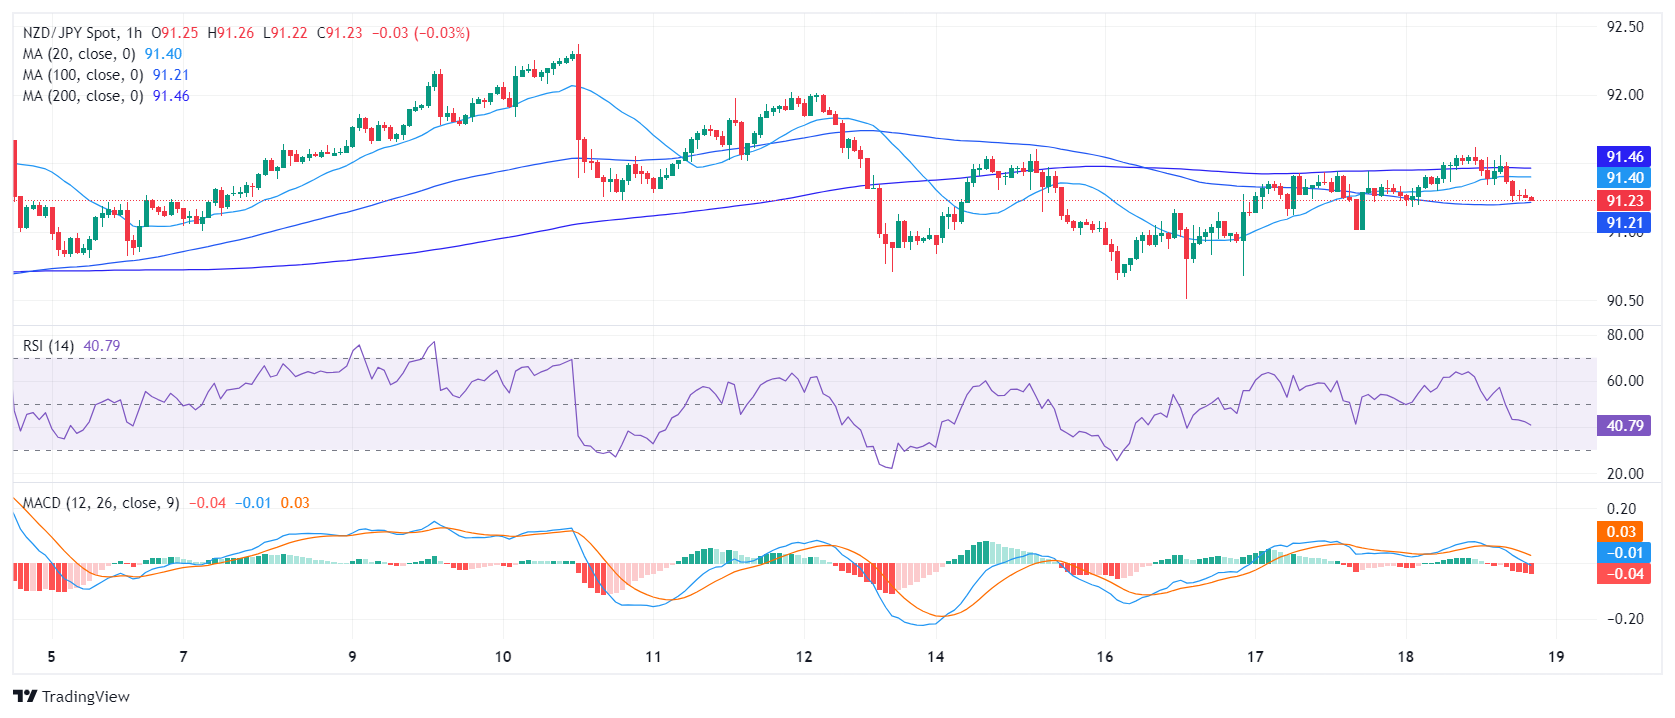
- On the hourly chart, indicators underline a prominent seller command in the past sessions.
The NZD/JPY is trading slightly lower at around 91.23. It seems the firm grip buyers had over the market is dwindling, yet the pair doggedly persists above crucial Simple Moving Averages (SMAs). Market watchers should eye the short-term trajectory of the NZD/JPY for any potential shifts that could give sellers the upper hand. Specifically, if bears breach the 20-day Simple Moving Average (SMA) at 91.00.
On the daily RSI fluctuates around the positive region but is currently pointing down. This, combined with the rising red bars trend in the MACD (Moving Average Converge Divergence) histogram, indicates that buyer dominance is fading and the market could begin favoring sellers soon.
NZD/JPY daily chart
In addition, the hourly Relative Strength Index (RSI) hovers below the neutral 50 line, reflecting a dominant presence of sellers in the recent sessions. The negative thrust is confirmed by the MACD, which reveals decreasing green bars, indicating diminishing positive momentum.
NZD/JPY hourly chart
Upon evaluating the broader landscape, the NZD/JPY is currently hovering above its key Simple Moving Averages (SMAs), reflecting continued buying pressure thereby sustaining the long-term uptrend. However, the pair closely challenges the 20-day SMA, suggesting potential for further downward movements if this level doesn’t hold. Moreover, the pair maintaining a stance above the 100 and 200-day SMAs reinforces a long-term bullish view.


© 2000-2026. All rights reserved.
This site is managed by Teletrade D.J. LLC 2351 LLC 2022 (Euro House, Richmond Hill Road, Kingstown, VC0100, St. Vincent and the Grenadines).
The information on this website is for informational purposes only and does not constitute any investment advice.
The company does not serve or provide services to customers who are residents of the US, Canada, Iran, The Democratic People's Republic of Korea, Yemen and FATF blacklisted countries.
Making transactions on financial markets with marginal financial instruments opens up wide possibilities and allows investors who are willing to take risks to earn high profits, carrying a potentially high risk of losses at the same time. Therefore you should responsibly approach the issue of choosing the appropriate investment strategy, taking the available resources into account, before starting trading.
Use of the information: full or partial use of materials from this website must always be referenced to TeleTrade as the source of information. Use of the materials on the Internet must be accompanied by a hyperlink to teletrade.org. Automatic import of materials and information from this website is prohibited.
Please contact our PR department if you have any questions or need assistance at pr@teletrade.global.
transfers