- Analytics
- News and Tools
- Market News
- GBP/USD Price Analysis: Shooting star emerges as sellers eye 1.2600
GBP/USD Price Analysis: Shooting star emerges as sellers eye 1.2600
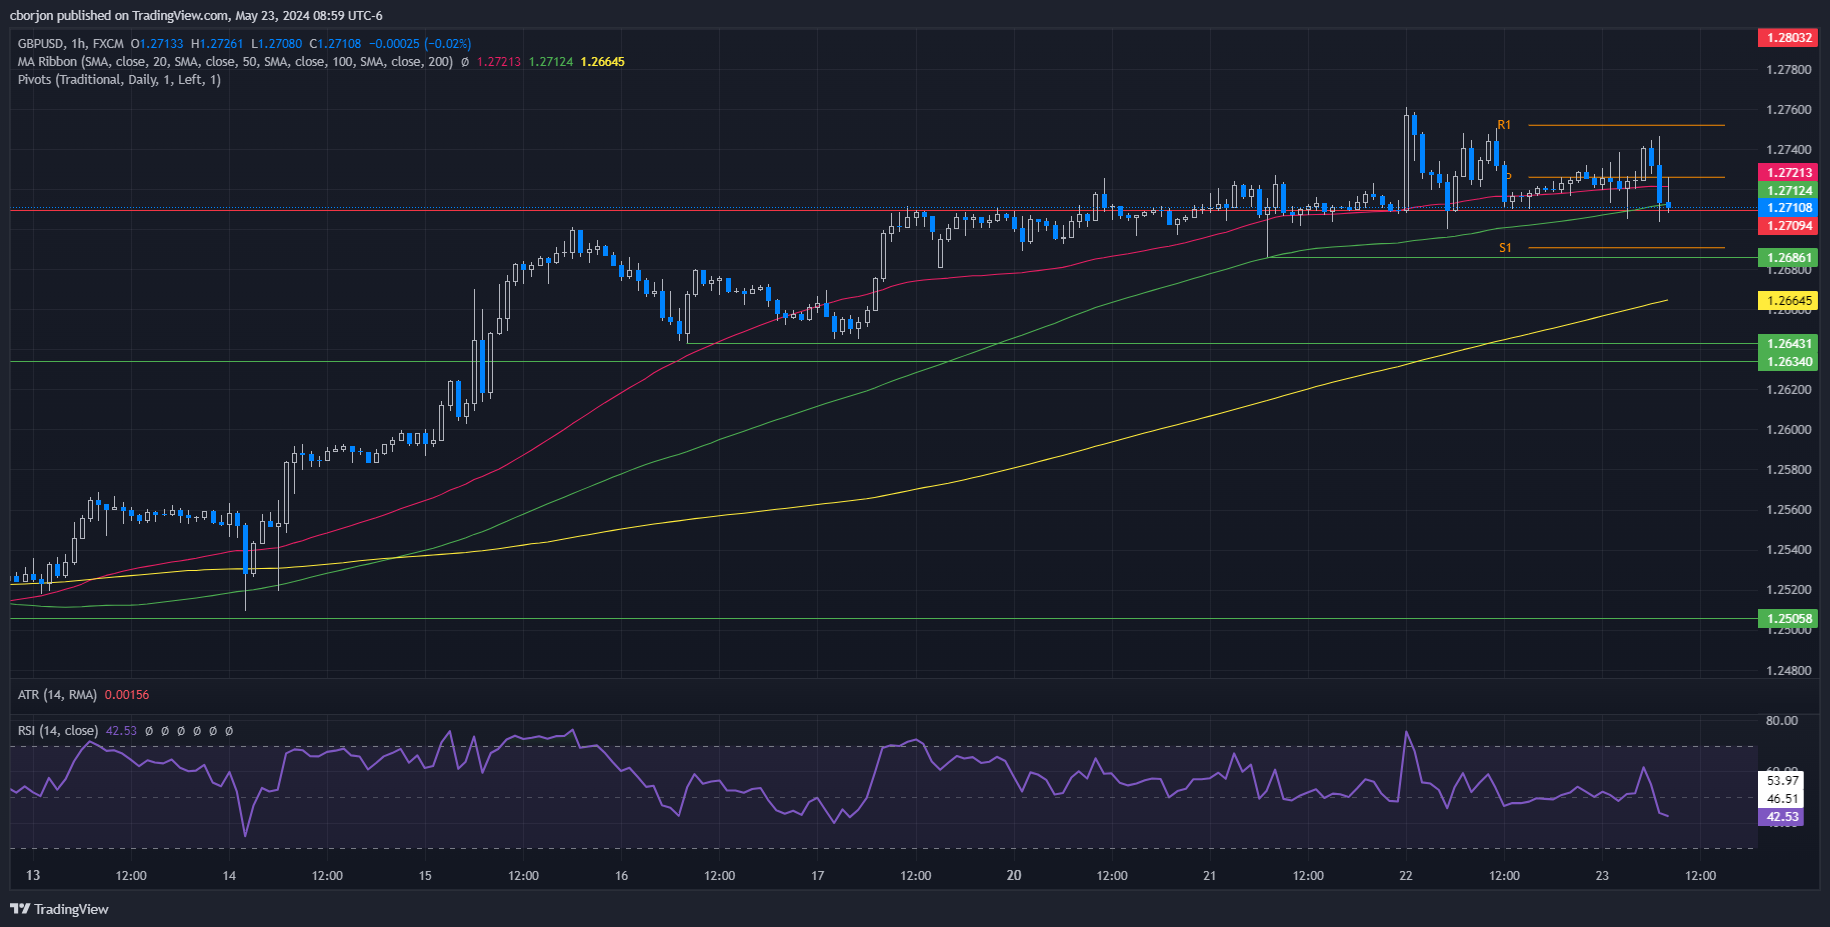
- GBP/USD slides 0.04%, peaking at 1.2746 in early North American trading.
- Technicals show a bearish trend with a 'shooting star' pattern and momentum with sellers.
- Support on May 21 low of 1.2686, May 16 low of 1.2643, and 1.2600 psychological level.
- Resistance at 50-hour SMA (1.2721), 100-hour SMA (1.2712), weekly high of 1.2761; potential target at 1.2800.
Early during the North American session, the British Pound dropped against the Greenback after data from the United States showed that business activity was picking up. Alongside that, inflationary pressures rose, sparking investors' fears that the Fed would delay cutting rates later during the year. The GBP/USD trades at 1.2711 after hitting a high of 1.2746, down 0.04%
GBP/USD Price Analysis: Technical outlook
The GBP/USD edges are lower after printing a ‘shooting star’ on Wednesday, a prelude to lower prices. Today’s price action witnessed a jump toward a high of 1.2750, but it still failed to crack the current week’s high of 1.2761, which opened the door for further losses.
In the short term, the GBP/USD one-hour chart suggests the pair is range-bound, capped on the upside by the 50-hour SMA at 1.2721 and the 100-hour SMA at 1.2712. However, momentum supports sellers, as shown by the Relative Strength Index (RSI), which remains bearish and hovers at its lowest level since May 17.
Therefore, if the major drops beneath 1.2700, the next support would be the May 21 low of 1.2686, followed by the May 16 low of 1.2643 and the psychological 1.2600 mark.
Conversely, if buyers lift the exchange rate above 1.2746, that will sponsor a test of the weekly high of 1.2761. Further strength and the pair could aim for 1.2800.
GBP/USD Price Action – Hourly Chart


© 2000-2026. All rights reserved.
This site is managed by Teletrade D.J. LLC 2351 LLC 2022 (Euro House, Richmond Hill Road, Kingstown, VC0100, St. Vincent and the Grenadines).
The information on this website is for informational purposes only and does not constitute any investment advice.
The company does not serve or provide services to customers who are residents of the US, Canada, Iran, The Democratic People's Republic of Korea, Yemen and FATF blacklisted countries.
Making transactions on financial markets with marginal financial instruments opens up wide possibilities and allows investors who are willing to take risks to earn high profits, carrying a potentially high risk of losses at the same time. Therefore you should responsibly approach the issue of choosing the appropriate investment strategy, taking the available resources into account, before starting trading.
Use of the information: full or partial use of materials from this website must always be referenced to TeleTrade as the source of information. Use of the materials on the Internet must be accompanied by a hyperlink to teletrade.org. Automatic import of materials and information from this website is prohibited.
Please contact our PR department if you have any questions or need assistance at pr@teletrade.global.
transfers