- Analytics
- News and Tools
- Market News
Analytics, News, and Forecasts for CFD Markets: currency news — 07-02-2018.
(pare/closed(GMT +2)/change, %)
EUR/USD $1,2264 -0,91%
GBP/USD $1,3880 -0,50%
USD/CHF Chf0,9431 +0,75%
USD/JPY Y109,33 -0,21%
EUR/JPY Y134,08 -1,13%
GBP/JPY Y151,754 -0,71%
AUD/USD $0,7820 -1,08%
NZD/USD $0,7234 -1,47%
USD/CAD C$1,2565 +0,57%
03:00 China Trade Balance, bln January 54.69 54.1
05:00 Japan Eco Watchers Survey: Current January 53.9 55.2
05:00 Japan Eco Watchers Survey: Outlook January 52.7 53.5
07:00 Germany Current Account December 25.4
07:00 Germany Trade Balance (non s.a.), bln December 23.7
08:45 Germany German Buba President Weidmann Speaks
09:00 Australia RBA's Governor Philip Lowe Speaks
09:50 U.S. FOMC Member Kaplan Speak
12:00 United Kingdom BoE Interest Rate Decision 0.5% 0.5%
12:00 United Kingdom Asset Purchase Facility 435 435
12:00 United Kingdom BOE Inflation Letter
12:00 United Kingdom Bank of England Minutes
13:00 U.S. FOMC Member Harker Speaks
13:15 Canada Housing Starts January 217 210
13:30 Canada New Housing Price Index, YoY December 3.4%
13:30 Canada New Housing Price Index, MoM December 0.1% 0.1%
13:30 U.S. Continuing Jobless Claims January 1953 1945
13:30 U.S. Initial Jobless Claims February 230 232
14:00 U.S. FOMC Member Kashkari Speaks
17:45 Canada Gov Council Member Wilkins Speaks
U.S. commercial crude oil inventories (excluding those in the Strategic Petroleum Reserve) increased by 1.9 million barrels from the previous week. At 420.3 million barrels, U.S. crude oil inventories are in the middle of the average range for this time of year.
Total motor gasoline inventories increased by 3.4 million barrels last week, and are in the middle of the average range. Both finished gasoline inventories and blending components inventories increased last week. Distillate fuel inventories increased by 3.9 million barrels last week and are in the middle of the average range for this time of year. Propane/propylene inventories decreased by 4.1 million barrels last week, but are in the middle of the average range. Total commercial petroleum inventories increased by 4.4 million barrels last week
Canadian municipalities issued $8.1 billion in building permits in December, up 4.8% following a 7.3% decline in November. The December increase stemmed from higher construction intentions in the residential sector. Across Canada, all components climbed in 2017, up 10.4% from the previous year, led by the multi-family dwelling component.
Construction intentions for single-family homes led the rise in December. Canadian municipalities issued $2.8 billion in permits for single-family dwellings, rising 8.9% from the previous month and the largest month-over-month increase in 2017. Ontario reported the largest gain, up 15.7% from the previous month. Permits issued for new single-family housing developments in the census metropolitan areas (CMAs) of Kitchener-Cambridge-Waterloo and Barrie helped offset the 12.1% decline in the CMA of Toronto.
-
Market valuations high relative to history
-
No implication yet for underlying economy
-
We have to look into reasons before we say anything about stock market move
Year-on-year estimates of retail trade index showed falls in December 2017, decreasing by 0.1% in terms of value and 0.9% in terms of volume. For the whole of 2017, value of sales grew by 0.2% while volume contracted by 0.6%.
Looking at the quarterly movement (Quarter 4), the 3 months to December 2017 pattern stays relatively flat (+0.1%). In the same period the volume of retail trade decreased by 0.2%, due to a decline in food sales.
The month-on-month picture reported falls in December 2017 as both value index and volume index decreased by 0.3%.
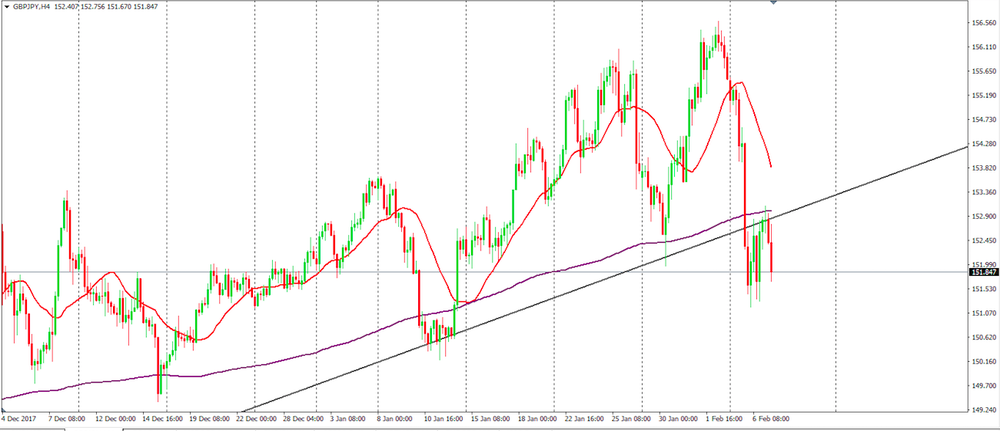
On 4-hour time frame chart we can see that the price has broken the upside trend line which the price has been following for several days.
Also, we can see that the price has tested once again the trend line below and therefore we could see a new bearish movement soon.
So, we can expect a further bearish movement on GBP/JPY close to 150.000
Prices in the last three months to January were 2.2% higher than in the same three months a year earlier, although the annual change in January was lower than in December (2.7%).
House prices remained unchanged in the recent quarter (November-January) from the previous quarter (August-October); on this measure prices are down from the 1.3% quarterly rise recorded in December.
On a monthly basis, prices fell for the second consecutive month in January (by 0.6% following a 0.8% decrease in December).
The average price of £223,285 at the beginning of the year is 1.9% higher than in January 2017 (£219,217), however, the current price has edged down after recording £226,408 - highest on record - in November.
EUR/USD
Resistance levels (open interest**, contracts)
$1.2489 (1543)
$1.2464 (2812)
$1.2438 (3519)
Price at time of writing this review: $1.2390
Support levels (open interest**, contracts):
$1.2326 (2980)
$1.2286 (5193)
$1.2242 (5230)
Comments:
- Overall open interest on the CALL options and PUT options with the expiration date February, 9 is 137521 contracts (according to data from February, 6) with the maximum number of contracts with strike price $1,2200 (7546);
GBP/USD
Resistance levels (open interest**, contracts)
$1.4095 (580)
$1.4066 (1710)
$1.4023 (2377)
Price at time of writing this review: $1.3966
Support levels (open interest**, contracts):
$1.3914 (766)
$1.3887 (749)
$1.3856 (1323)
Comments:
- Overall open interest on the CALL options with the expiration date February, 9 is 42924 contracts, with the maximum number of contracts with strike price $1,3600 (3471);
- Overall open interest on the PUT options with the expiration date February, 9 is 38751 contracts, with the maximum number of contracts with strike price $1,3400 (3038);
- The ratio of PUT/CALL was 0.90 versus 0.92 from the previous trading day according to data from February, 6
* - The Chicago Mercantile Exchange bulletin (CME) is used for the calculation.
** - Open interest takes into account the total number of option contracts that are open at the moment.
In December 2017, production in industry was down by 0.6% from the previous month on a price, seasonally and working day adjusted basis according to provisional data of the Federal Statistical Office (Destatis). In November 2017, the corrected figure shows an increase of 3.1% (primary +3.4%) from October 2017.
In December 2017, production in industry excluding energy and construction was down by 0.7%. Within industry, the production of capital goods decreased by 2.6% and the production of consumer goods by 0.5%. The production of intermediate goods showed an increase by 1.5%. Energy production was up by 1.4% in December 2017 and the production in construction decreased by 1.7%.
-
Says republicans promise immigration debate on senate floor next week
The seasonally adjusted Australian Performance of Construction Index increased by 1.5 points to 54.3 points in January (readings above 50 points indicate expansion). This signalled industry-wide growth for a 12th consecutive month and at a slightly higher pace than in December 2017.
Data for January revealed an improvement in demand, with the new orders sub-index returning to growth after drifting into mildly negative territory in December.
The activity sub-index remained in expansion in January, at a broadly unchanged rate from December. This was associated with further growth in deliveries from suppliers.


© 2000-2026. All rights reserved.
This site is managed by Teletrade D.J. LLC 2351 LLC 2022 (Euro House, Richmond Hill Road, Kingstown, VC0100, St. Vincent and the Grenadines).
The information on this website is for informational purposes only and does not constitute any investment advice.
The company does not serve or provide services to customers who are residents of the US, Canada, Iran, The Democratic People's Republic of Korea, Yemen and FATF blacklisted countries.
Making transactions on financial markets with marginal financial instruments opens up wide possibilities and allows investors who are willing to take risks to earn high profits, carrying a potentially high risk of losses at the same time. Therefore you should responsibly approach the issue of choosing the appropriate investment strategy, taking the available resources into account, before starting trading.
Use of the information: full or partial use of materials from this website must always be referenced to TeleTrade as the source of information. Use of the materials on the Internet must be accompanied by a hyperlink to teletrade.org. Automatic import of materials and information from this website is prohibited.
Please contact our PR department if you have any questions or need assistance at pr@teletrade.global.
transfers