- Analytics
- News and Tools
- Market News
Analytics, News, and Forecasts for CFD Markets: currency news — 22-04-2024.
- AUD/USD climbs over 0.54%, reaching 0.6449, buoyed by gains in Wall Street and a flat US Dollar.
- Australian manufacturing activity nears expansion with April's Judo Bank Manufacturing PMI rising to 49.9.
- Busy week ahead for US economic data, including PMIs and GDP, expected to influence AUD/USD direction.
The Aussie Dollar began the week on the front foot and registered gains against the US Dollar on Monday, gaining more than 0.54% as risk appetite improved. As the Asian session begins, the AUD/USD trades at 0.6449, up 0.01%.
AUD/USD nears 0.6450 boosted by positive Australian data and lower US Treasury yields
Wall Street finished the session with gains, while US Treasury yields edged lower. The Greenback finished the session flat, though the AUD/USD bounced off yearly lows, shy of the 0.6450 area.
Data from Australia revealed that manufacturing activity in April improved. The Judo Bank Manufacturing PMI came at 49.9, up from 47.3, at a tick of expansion. The Services PMI cooled from 54.4 to 54.2, though it expanded at the fastest rate in two years.
In the meantime, data from the United States featured the Chicago Fed National Activity Index (CFNAI), which rose by 0.15 in March from 0.09 in February. The index’s three-month moving average increased from -0.28 in February to -0.19 in March.
What’s ahead for AUD/USD traders?
This week, the economic docket in the United States (US) will be busy. It will feature S&P Global PMIs, housing data, Durable Goods Orders, and the GDP for the first quarter of 2024. That, along with the release of the Fed’s preferred gauge for inflation, the March Personal Consumption Expenditure (PCE) Price Index, will dictate the direction of the AUD/USD.
- PMI activity data due on both sides of the Atlantic.
- EUR/USD finds middle ground just below 1.0700.
- Markets looking for moderate recovery across the PMI board.
The EUR/USD is testing the waters near 1.0650 after a quiet Monday saw the major pair flatline ahead of a densely-packed economic data docket. Both the US and the wider Eurozone area will see updates to Purchasing Managers Index (PMI) figures on Tuesday, with high-tier US data due in the back half of the trading week as rate-hungry markets continue to froth for rate cuts from the US Federal Reserve (Fed).
Tuesday brings pan-Eurozone HCOB PMIs for April, with the Composite PMI expected to recover to 50.8 in April compared to the previous month’s 50.3. Germany’s Composite PMI is also expected to climb further to 48.6 from the previous 47.7. The broader European Manufacturing PMI is expected to remain in contraction territory but recover ground to 46.5 from the previous 46.1.
On the US side, the S&P Global PMI for April is expected to print at 52.0 for both the Manufacturing and Services components. Manufacturing was last seen at 51.9, while Services last printed at 51.7 in March.
Later this week, US annualized quarterly Gross Domestic Product (GDP) is expected to ease back to 2.5% from the previous print of 3.4%, while March’s Core Personal Consumption Expenditure (PCE) Price Index is expected to hold steady at 0.3% MoM in April.
EUR/USD technical outlook
The EUR/USD pair is holding steady near 1.0650 after a recent tumble from the 1.0880 level, with the Fiber sliding 2.62% peak-to-trough in April. A limited recover from near-term lows just above the 1.0600 handle leaves the pair struggling on the low side of the 200-hour Exponential Moving Average (EMA) as price action looks for a floor.
Daily candlesticks see the way open for an extended decline into the last major swing low near 1.0500, but recent price action could drag the EUR/USD back into the 200-day EMA at 1.0807.
EUR/USD hourly chart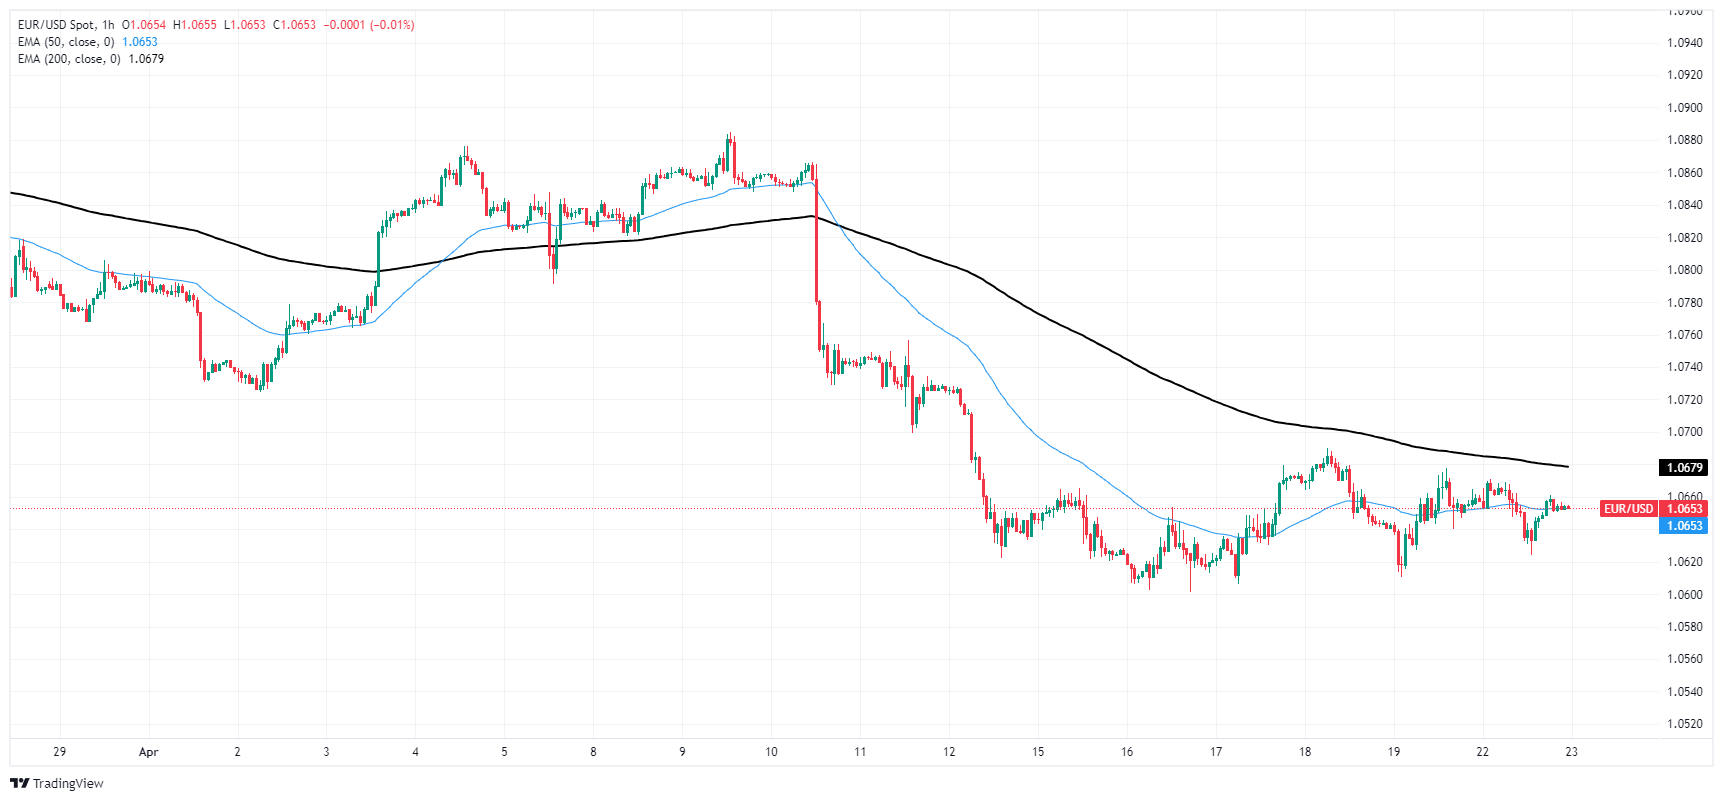
EUR/USD daily chart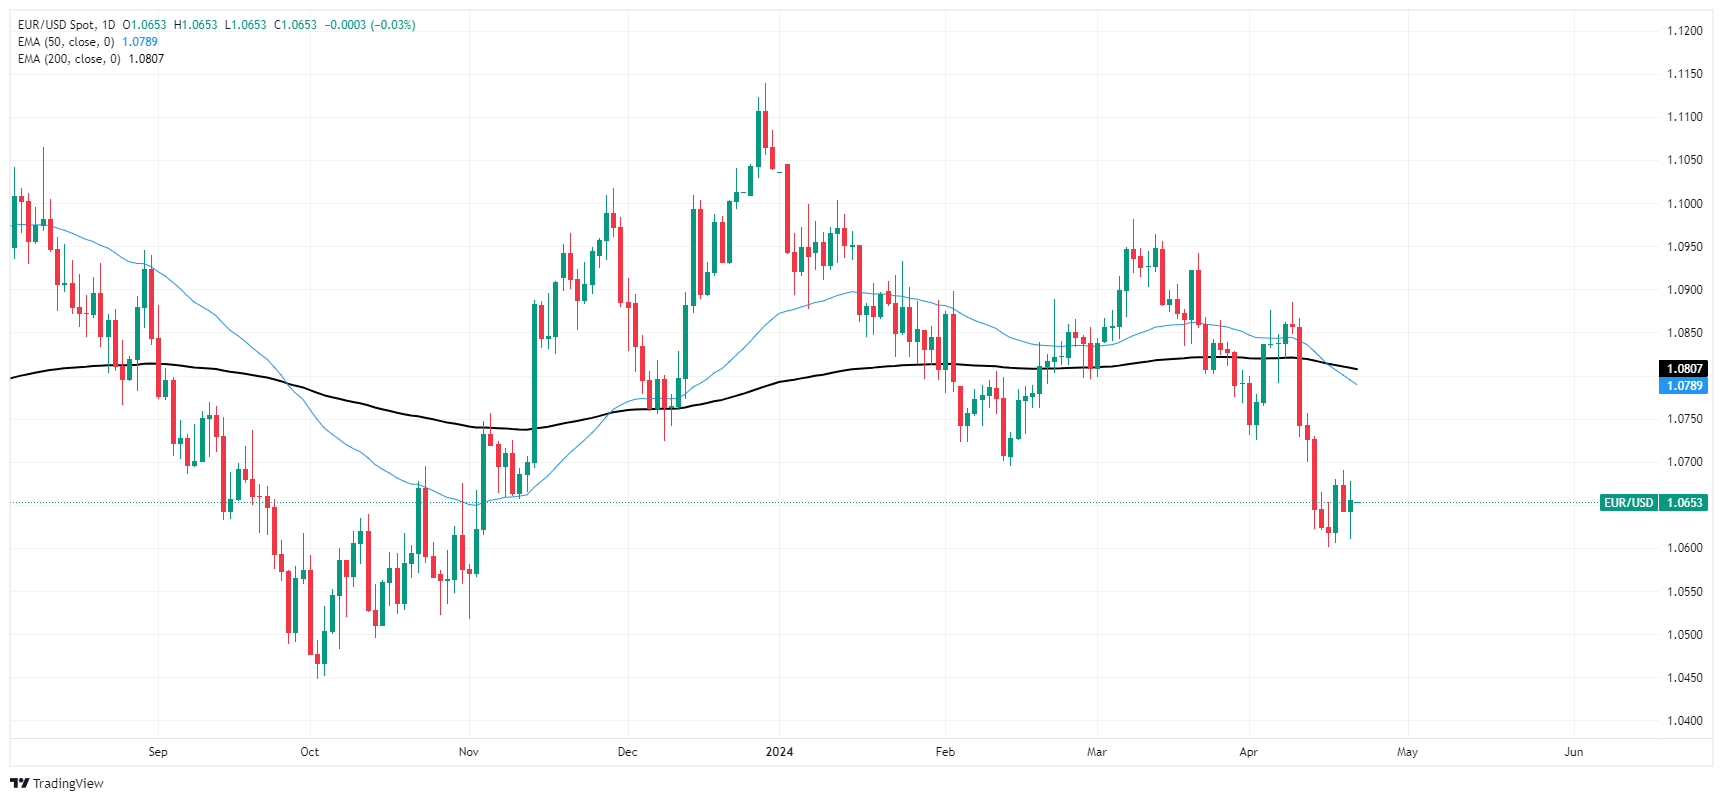
- GBP/USD extends its downside around 1.2350 in Tuesday’s early Asian session.
- Several Fed officials emphasized the US central bank is not in a hurry on interest rate cuts.
- Investors continue to price in the BoE will cut the interest rate earlier than the US Fed.
The GBP/USD pair remains on the defensive near 1.2350, the lowest since mid-November on Tuesday during the early Asian session. The USD Index (DXY) consolidates its gains above 106.10 as traders await the preliminary S&P Global Purchasing Managers Index (PMI) data from the US and UK for April.
The Federal Reserve (Fed) policymakers agreed that inflation in the US is coming down slowly, but remains high. Therefore, the US central bank is not in a hurry on interest rate cuts. Atlanta Fed President Raphael Bostic noted that interest rates will have to be kept at a "restrictive level" and might only ease "at the end of 2024”. Meanwhile, Chicago Fed President Austan Goolsbee signaled a longer timeline for rate cuts as progress on inflation had "stalled.”. The hawkish stance of the Fed on interest rates so far this year has boosted the US Dollar (USD) and created a headwind for the GBP/USD pair.
On Monday, the Chicago Fed National Activity Index improved to 0.15 in March from 0.09 in the previous reading, according to the Fed Bank of Chicago. The attention will shift to the April PMI reports, due later on Tuesday. Both manufacturing and Services PMI figures are projected to improve in April. If the reports show a stronger-than-expected outcome, this could provide some support to the Greenback and cap the major pair’s upside.
On the other hand, interest rate futures are fully priced in a first quarter-point interest rate cut by the Bank of England for August and see two rate cuts before the end of the year. The growing speculation that the UK central bank will cut the interest rate earlier than the US Fed exerts some selling pressure on the Pound Sterling (GBP). Last week, BoE Deputy Governor Dave Ramsden said the progress on UK inflation and the downbeat economic outlook will allow the BoE to begin the rate cut cycle earlier than previously expected. Investors have priced in a 60% odds of a June rate cut near 60%, per Reuters.
Australia's Judo Bank Purchasing Managers Index (PMI) Composite rose to a 24-month high of 53.6 in April compared to the previous month's 53.3. The Australian private sector ticked up into an accelerated pace of growth in the second quarter bolstered primarily by Services sector growth.
Key highlights
Australia's Manufacturing PMI Output rose to an eight-month high of 49.1 compared to March's 45.7, brushing off a 2-month low of 54.2 in the Services Business Activity compared to March's 54.4.
According to Judo Bank's Chief Economic Advisor Warren Hogan, "Over the last three months, the PMI results have pointed to a cyclical recovery in the Australian economy in 2024 following a consumer-led slowdown in 2023. While this is great news for the Australian economy, these results are stronger than what the RBA is expecting, suggesting that the economy is beginning to wander off their ‘narrow path’."
Hogan continued, "These results are inconsistent with interest rate reductions at any stage in the foreseeable future and raise the risk that the RBA may have to start hiking again at some stage over the back half of 2024.”
Market reaction
The AUD/USD is trading steadily in the early Tuesday market session, testing the waters near 0.6450.
About Australia's Composite Judo Bank PMI
The Composite Purchasing Managers Index (PMI), released on a monthly basis by Judo Bank and S&P Global, is a leading indicator gauging private-business activity in Australia for both the manufacturing and services sectors. The data is derived from surveys to senior executives. Each response is weighted according to the size of the company and its contribution to total manufacturing or services output accounted for by the sub-sector to which that company belongs. Survey responses reflect the change, if any, in the current month compared to the previous month and can anticipate changing trends in official data series such as Gross Domestic Product (GDP), industrial production, employment and inflation. The index varies between 0 and 100, with levels of 50.0 signaling no change over the previous month. A reading above 50 indicates that the Australian private economy is generally expanding, a bullish sign for the Australian Dollar (AUD). Meanwhile, a reading below 50 signals that activity is generally declining, which is seen as bearish for AUD.
- Diminishing red bars of the daily MACD imply a potential easing of bearish momentum, signaling an early indication of a bullish turnaround.
- The hourly chart reveals an RSI oscillating in the positive zone, and MACD with green bars, signaling potential short-term positive momentum.
The NZD/USD pair advanced to 0.5920 on Monday, reflecting a gain of 0.47%. Overall, the bearish force remains strong, while the bulls begin to give signs of potential recovery, highlighting the start of a possible bullish reversal.
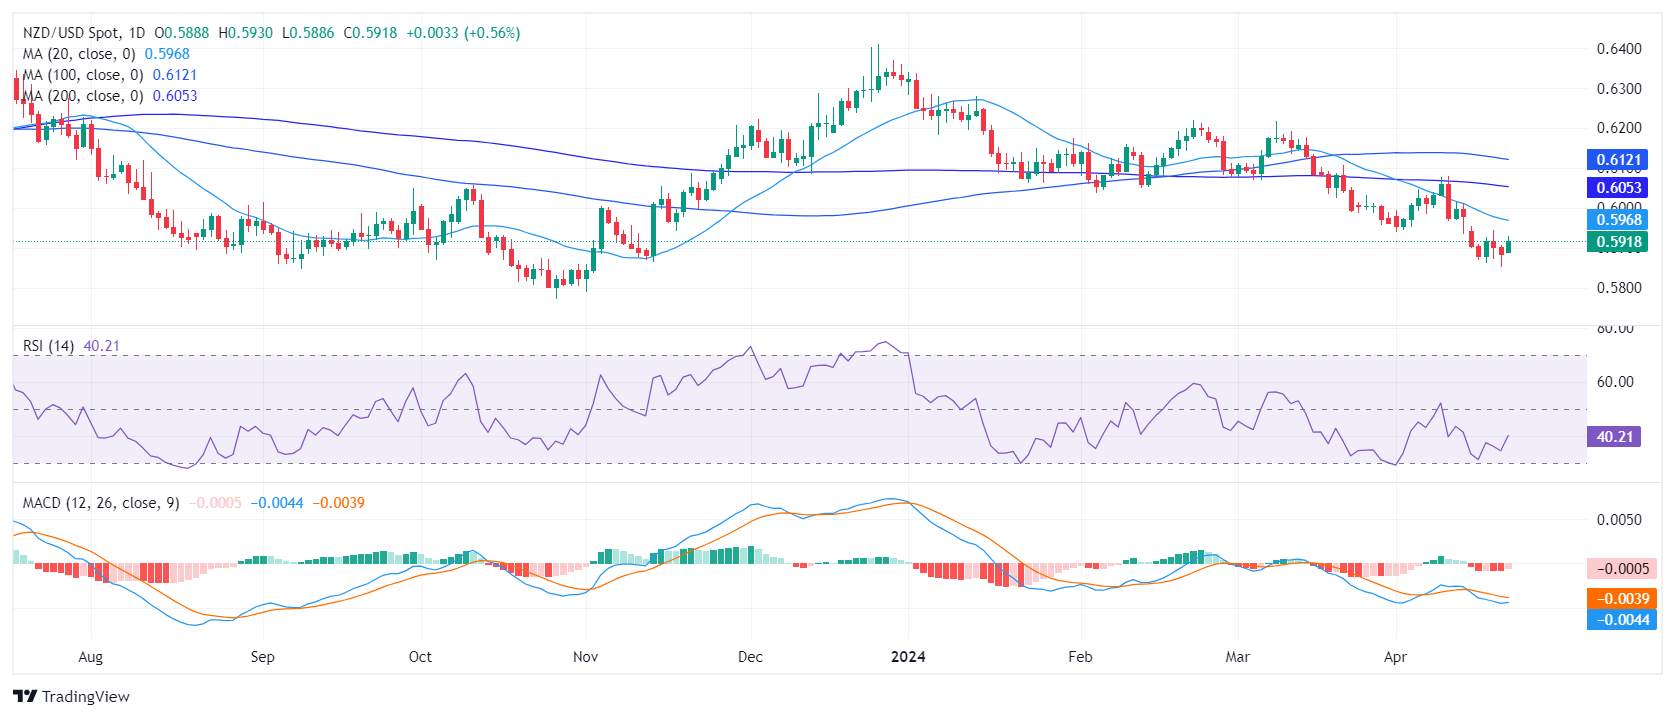
On the daily chart, the Relative Strength Index (RSI) remains in negative territory, indicating an ongoing bearish momentum. Although there is a minor upward trend, it remains short of breaking into the positive zone. The decreasing red bars of the Moving Average Convergence Divergence (MACD) suggest a slide in negative momentum, indicating possible signs of a potential bullish reversal.
NZD/USD daily chart
On the hourly chart, a similar condition prevails. The RSI has been oscillating in the positive territory for most of the session, but recently recorded a slight downward inclination, signaling a potential pullback. The MACD histogram also shows rising green bars, indicating a surge in positive momentum.
NZD/USD hourly chart
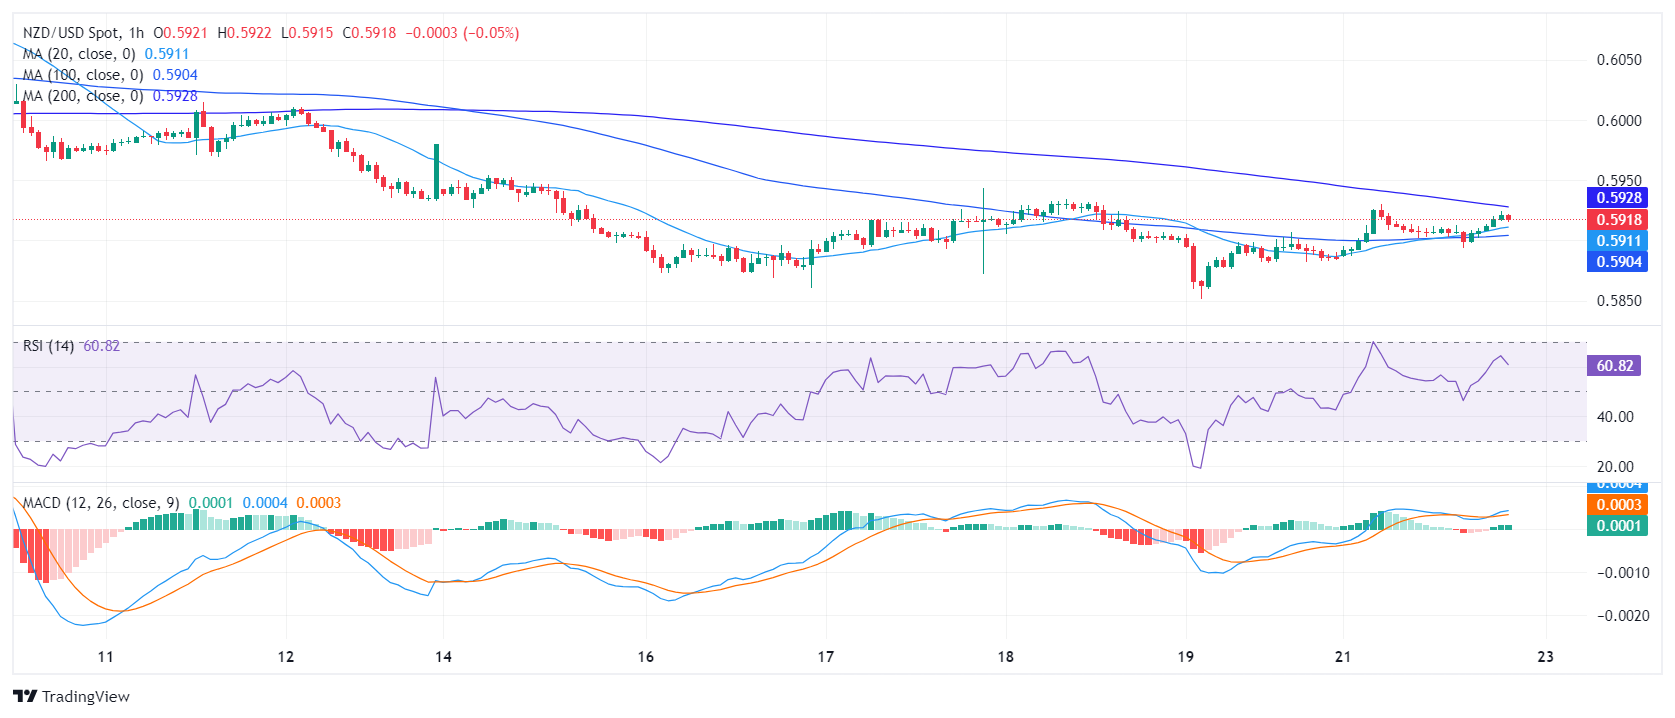
The broader market perspective reveals much regarding the NZD/USD's performance versus its Simple Moving Average (SMA). With the pair being below the 20,100 and 200-day SMA, a long and short-term downward pressure on the currency is evident.
In summary, there is a bearish dominance in the market, reinforced by both the RSI and MACD trends on the daily and hourly charts, as well as the SMA positioning. However, the slight increase in the daily RSI and the diminishing bearish momentum in the MACD could signify the early stages of a market reversal.
- Gold retracts sharply from recent highs, influenced by reduced geopolitical risks and a strengthening US Dollar.
- Fed officials, including Chairman Powell, maintain a hawkish stance on interest rates, pressuring Gold prices.
- Market sentiment shifts as expectations for Federal Reserve rate cuts are adjusted to a later timeline.
Gold prices plummet sharply and retrace last week's gains, down more than 2.50% as the Middle East's woes abate. The pullback in the price of gold metal could be attributed to profit-taking, as mentioned by Jim Wyckoff of Kitco News, alongside some modest strength in the US Dollar.
XAU/USD trades at $2,329 after hitting a daily high of $2,392, sponsored by last Friday’s increasing tensions between Israel and Iran. Also, market participants are beginning to price out that the Federal Reserve (Fed) would cut rates later than expected, further weighing on Gold prices.
Tehran downplayed Israel’s retaliation drone strike on April 19 in what was perceived as an escalation of the conflict.
Elsewhere, Federal Reserve officials struck hawkish remarks led by Chairman Jerome Powell, who commented that the lack of progress on the disinflation process warrants keeping interest rates higher for longer. Echoing his comments was Chicago Fed, Austan Goolsbee, one of the most dovish members of the FOMC, who said that progress on inflation has “stalled.”
Daily Digest Market Movers: Gold retreats as US manufacturing activity accelerates
- Chicago Fed National Activity Index increased to 0.15 in March from 0.09 in February. The index’s three-month moving average increased from -0.28 in February to -0.19 in March.
- The US 10-year Treasury benchmark rate is down one basis point in the week at 4.611%.
- US Dollar Index (DXY), which tracks the buck’s performance against a basket of six other currencies, is up 0.01% to 106.13.
- Further, Fed speakers crossed the wires. Atlanta Fed’s Raphael Bostic noted that inflation is too high, adding that the Fed won’t be able to reduce rates. New York Fed President John Williams stated that the Fed is data-dependent and emphasized that monetary policy is in a good place, so he wasn’t in a rush to cut rates
- This week, the economic docket in the United States (US) will feature the release of the Fed’s preferred gauge for inflation, the March Personal Consumption Expenditure (PCE) Price Index. A softer reading than expected could prompt Gold traders to buy the yellow metal and aim to refresh all-time highs. Otherwise, a rise in prices could underpin US Treasury yields and the Greenback, a headwind for the non-yielding metal.
- The PCE is expected to edge higher, while the Core PCE is expected to decrease from 2.8% to 2.6% YoY.
- Data from the Chicago Board of Trade (CBOT) suggests that traders expect the fed funds rate to finish 2024 at 4.99%.
Technical Analysis: Gold plunges as sellers eye $2,300
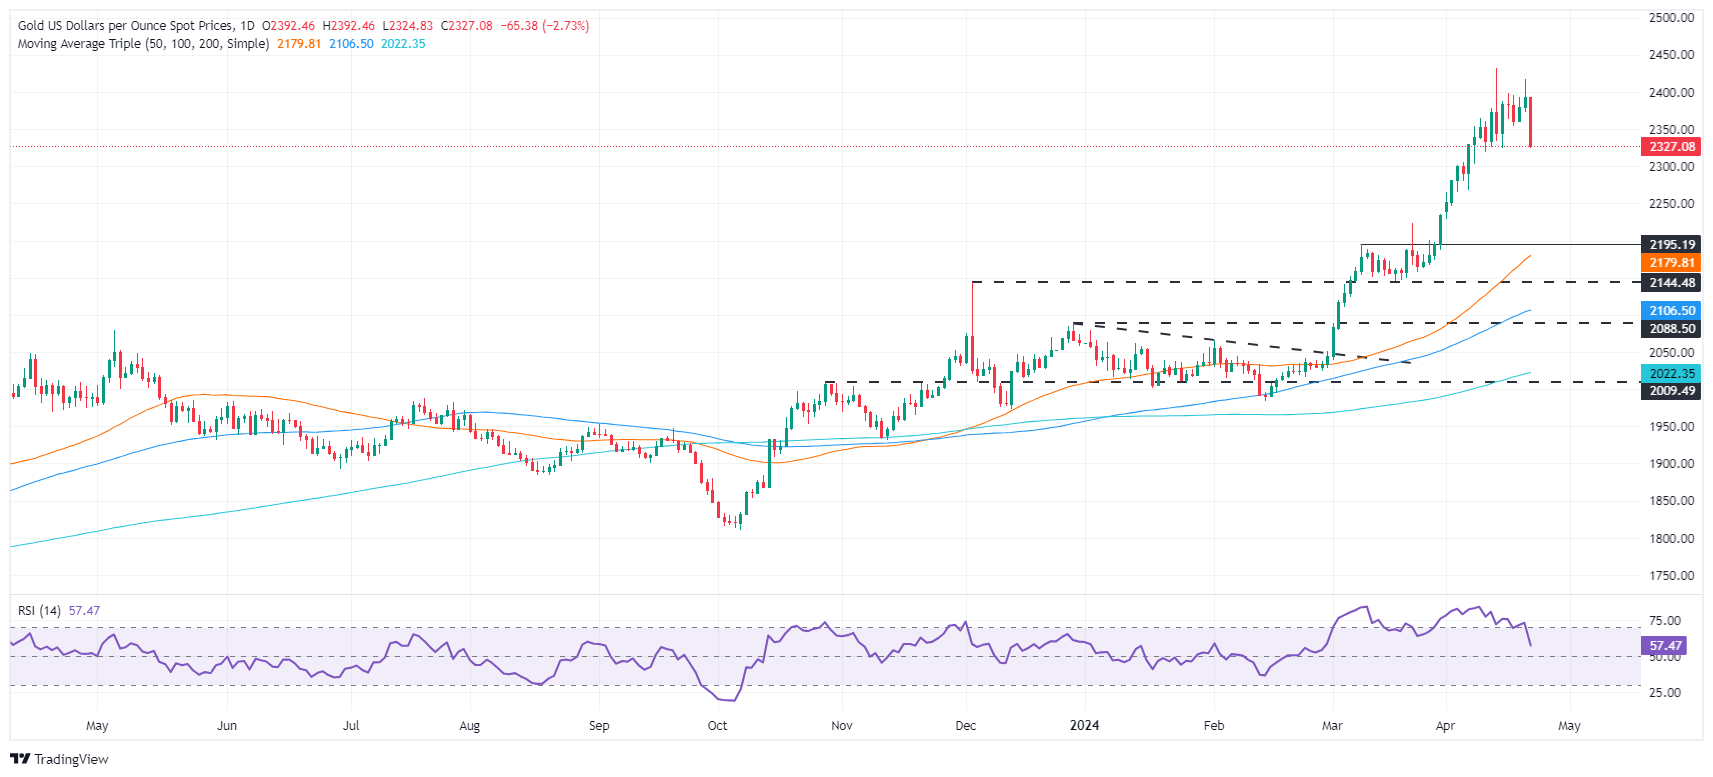
Gold price nosedived and formed a ‘bearish engulfing’ chart pattern, which opened the door for a retracement. If XAU/USD prices dip below the April 15 daily low of $2,324, that would pave the way to test $2,300. A breach of the latter will expose the March 21 high at $2,222.
On the other hand, XAU/USD's first resistance would be $2,400, followed by Friday’s high of $2,417. A breach of the latter will expose the all-time high of $2,431.
Gold FAQs
Gold has played a key role in human’s history as it has been widely used as a store of value and medium of exchange. Currently, apart from its shine and usage for jewelry, the precious metal is widely seen as a safe-haven asset, meaning that it is considered a good investment during turbulent times. Gold is also widely seen as a hedge against inflation and against depreciating currencies as it doesn’t rely on any specific issuer or government.
Central banks are the biggest Gold holders. In their aim to support their currencies in turbulent times, central banks tend to diversify their reserves and buy Gold to improve the perceived strength of the economy and the currency. High Gold reserves can be a source of trust for a country’s solvency. Central banks added 1,136 tonnes of Gold worth around $70 billion to their reserves in 2022, according to data from the World Gold Council. This is the highest yearly purchase since records began. Central banks from emerging economies such as China, India and Turkey are quickly increasing their Gold reserves.
Gold has an inverse correlation with the US Dollar and US Treasuries, which are both major reserve and safe-haven assets. When the Dollar depreciates, Gold tends to rise, enabling investors and central banks to diversify their assets in turbulent times. Gold is also inversely correlated with risk assets. A rally in the stock market tends to weaken Gold price, while sell-offs in riskier markets tend to favor the precious metal.
The price can move due to a wide range of factors. Geopolitical instability or fears of a deep recession can quickly make Gold price escalate due to its safe-haven status. As a yield-less asset, Gold tends to rise with lower interest rates, while higher cost of money usually weighs down on the yellow metal. Still, most moves depend on how the US Dollar (USD) behaves as the asset is priced in dollars (XAU/USD). A strong Dollar tends to keep the price of Gold controlled, whereas a weaker Dollar is likely to push Gold prices up.
- Investors pile back into US equity indexes to kick off the new week.
- Market sentiment is recovering as key US data looms ahead.
- DJIA surges above 38,400.00 before returning to 38,200 heading into the closing bell.
The Dow Jones Industrial Average (DJIA) is on the run into the top side to open the new trading week, with the index climbing into a five-day peak above 38,400.00. Overextended bidding came quickly under heel, keeping the index pinned near 38,200.00, but US indexes are kicking off the new trading week firmly into the bullish side.
Broad-market investor sentiment is improving after last week’s heightened concerns over a growing altercation in the Middle East. Cooler heads have prevailed, allowing investor confidence to seep back into the boards.
Tuesday kicks off the US’ economic data docket with the S&P Global Purchasing Managers Index. The Manufacturing component is forecast to tick up slightly to 52.0 in April from March’s 51.9, while the Services component is expected to climb to 52.0 from the previous 51.7.
US Gross Domestic Product (GDP) for the annualized first quarter prints on Wednesday and is expected to ease back to 2.5% from the previous print of 3.4%, while Thursday sees a fresh round of US COre Personal Consumption Expenditures (PCE). US PCE inflation is expected to hold steady at 0.3% for the month of March, while the YoY figure is forecast to tick down slightly to 2.6% from 2.8%.
Dow Jones news
Of the thirty securities that make up the Dow Jones Industrial Average, only five were in the red on Monday, with Verizon Communications Inc. (VZ) leading the charge into bear country. VZ fell nearly 5% on the day, declining -1.89 to trade at $38.60 per share.
The Dow’s top gainer to start the week was Goldman Sachs Group Inc. (GS), which climbed 3.3% on Monday to trade into $417.35. GS was followed by JPMorgan Chase & Co. (JPM) which gained nearly 2% and ended Monday near $189.41 per share.
Dow Jones technical outlook
The Dow Jones climbed to a five-day high on Monday near 38,400.00 before settling close to 38,230.00 at the closing bell. The major equity index is still down over 4% from late March’s record peaks just shy of the 40,000.00 mega handle. Despite downside momentum, the Dow Jones continues to pump the brakes on any meaningful declines, with the index trading well above the 200-day Exponential Moving Average (EMA) at 36,683.77.
Dow Jones daily chart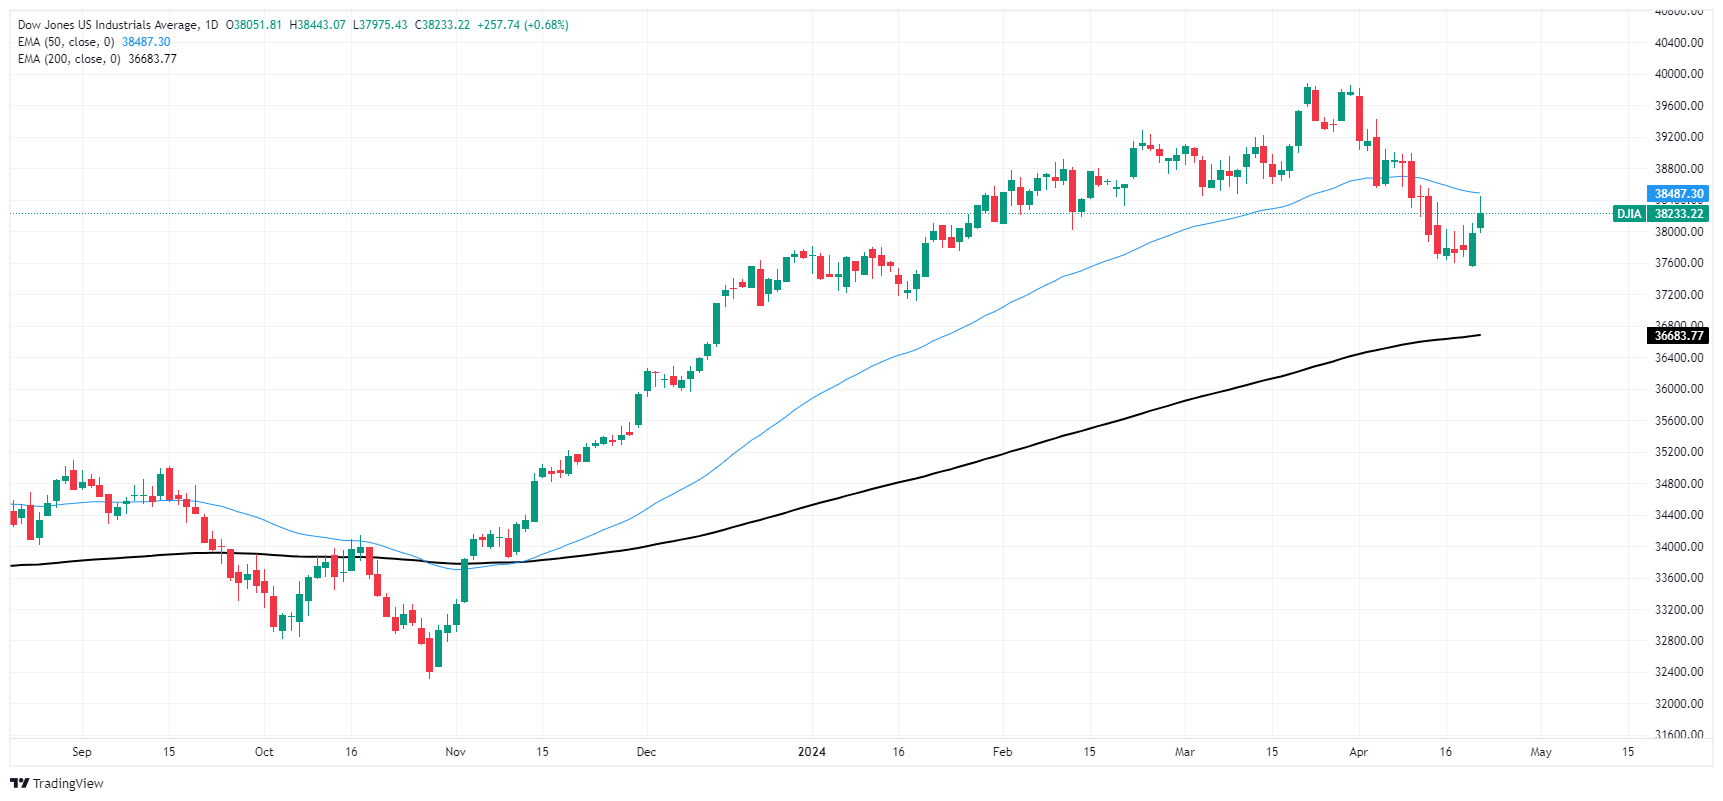
Dow Jones FAQs
The Dow Jones Industrial Average, one of the oldest stock market indices in the world, is compiled of the 30 most traded stocks in the US. The index is price-weighted rather than weighted by capitalization. It is calculated by summing the prices of the constituent stocks and dividing them by a factor, currently 0.152. The index was founded by Charles Dow, who also founded the Wall Street Journal. In later years it has been criticized for not being broadly representative enough because it only tracks 30 conglomerates, unlike broader indices such as the S&P 500.
Many different factors drive the Dow Jones Industrial Average (DJIA). The aggregate performance of the component companies revealed in quarterly company earnings reports is the main one. US and global macroeconomic data also contributes as it impacts on investor sentiment. The level of interest rates, set by the Federal Reserve (Fed), also influences the DJIA as it affects the cost of credit, on which many corporations are heavily reliant. Therefore, inflation can be a major driver as well as other metrics which impact the Fed decisions.
Dow Theory is a method for identifying the primary trend of the stock market developed by Charles Dow. A key step is to compare the direction of the Dow Jones Industrial Average (DJIA) and the Dow Jones Transportation Average (DJTA) and only follow trends where both are moving in the same direction. Volume is a confirmatory criteria. The theory uses elements of peak and trough analysis. Dow’s theory posits three trend phases: accumulation, when smart money starts buying or selling; public participation, when the wider public joins in; and distribution, when the smart money exits.
There are a number of ways to trade the DJIA. One is to use ETFs which allow investors to trade the DJIA as a single security, rather than having to buy shares in all 30 constituent companies. A leading example is the SPDR Dow Jones Industrial Average ETF (DIA). DJIA futures contracts enable traders to speculate on the future value of the index and Options provide the right, but not the obligation, to buy or sell the index at a predetermined price in the future. Mutual funds enable investors to buy a share of a diversified portfolio of DJIA stocks thus providing exposure to the overall index.
- The NZD/JPY's daily RSI reveals a transition towards positive territory, indicating a growing buying momentum.
- Both daily and hourly MACD portray a neutral scenario with their flat green bars, neither favoring buyers nor sellers significantly.
- Buyer's decisive support at the 20-day SMA in recent sessions indicates heightened bullish sentiment within the market.
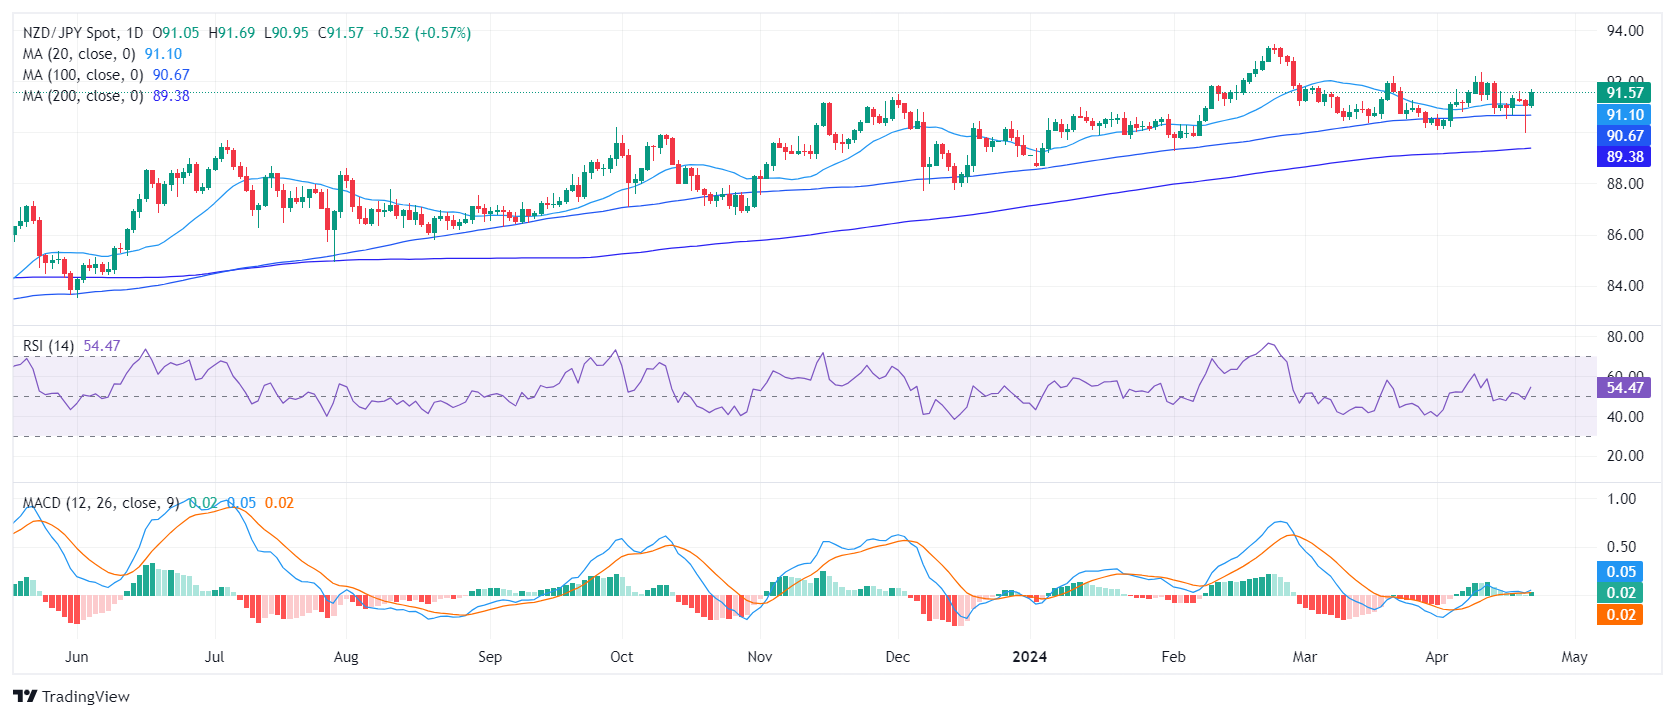
The NZD/JPY rose to 91.59 on Monday and maintains a steady uptrend. Indicators on the daily and hourly charts are favoring the buyers and as the bears failed to breach the 20-day Simple Moving Average (SMA), the outlook remains positive for the short term.
On the daily chart, the Relative Strength Index (RSI) reveals a transition from negative to positive territory, currently at 55. This shift shows a slight bullish momentum, indicating that traders are favoring more buying activities. The Moving Average Convergence Divergence (MACD) histogram exhibits flat green bars, suggesting a neutral momentum, neither favoring buyers nor sellers significantly.
NZD/JPY daily chart
On the hourly chart, the RSI advances further into positive territory, peaking at 64 before slightly receding to 59. This movement signifies that buying activities have intensified during the American session. The MACD continues to exhibit flat green bars, mirroring the neutral momentum indicated on the daily chart.
NZD/JPY hourly chart
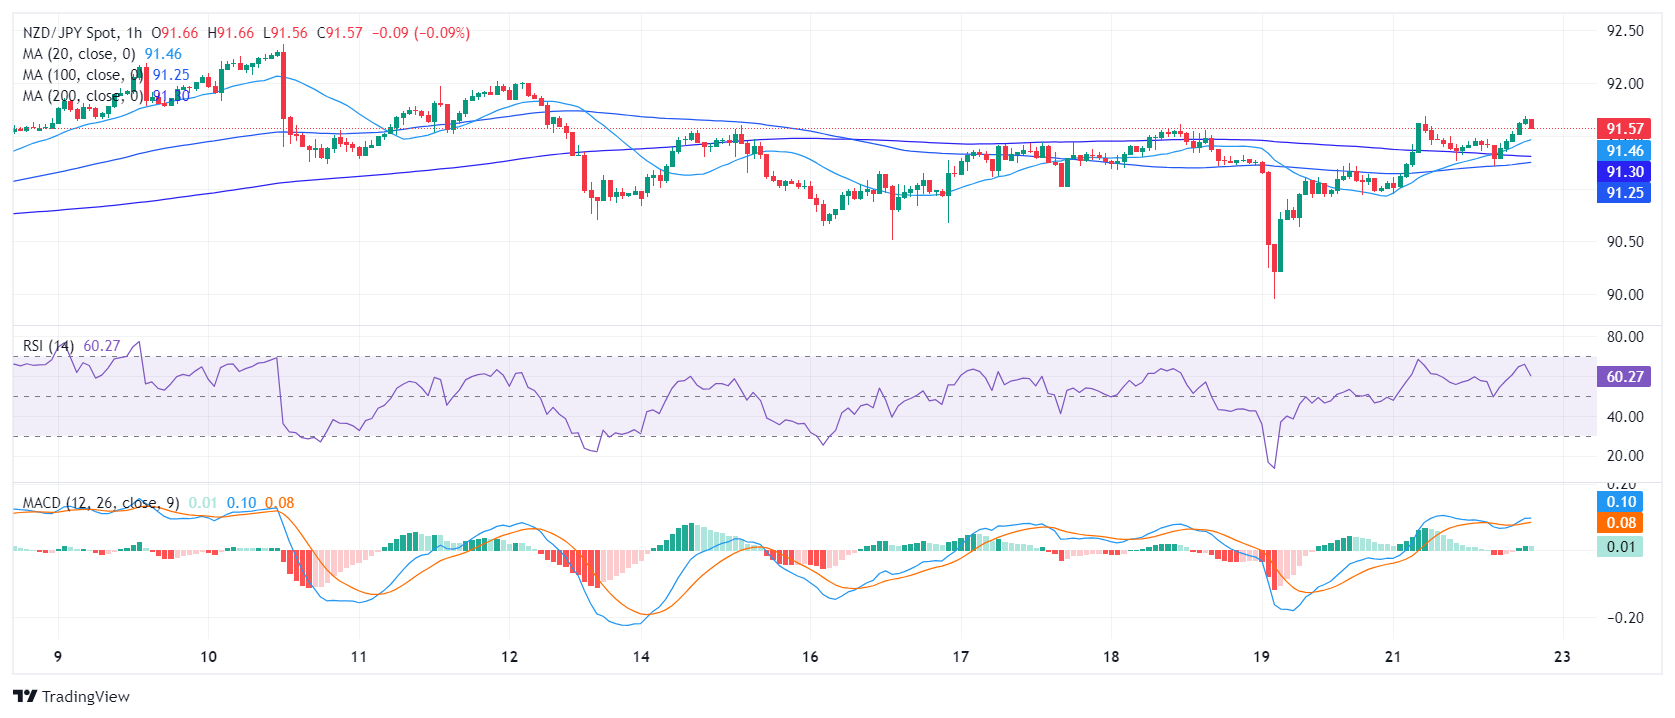
From a broader perspective, the NZD/JPY demonstrates a robust performance by situating above its key Simple Moving Averages (SMA), a technical indicator that averages the currency pair's closing prices over specific periods. Its stance above the 20, 100, and 200-day SMA suggests a consistent uptrend, representing both short-term and long-term strength. In the last sessions, the buyers defended the 20-day SMA at 91.10. This type of decisive support provides further evidence of a bullish sentiment among traders, which could stimulate more upside potential for the NZD/JPY.
- Energy market tensions are receding after Iran, Israel trade blows.
- Fears of an escalating Middle East war are slipping back after Iran blinks.
- US supplies continue to outpace demand, limiting topside supply crunch.
Iran eased off the gas pedal on Monday, stating that it will not retaliate further against Israel following a back-and-forth scuffle between the two countries that sent global energy markets spiraling in recent weeks as fears of a widening Middle East conflict widened. Iran’s current de-escalation has given barrel markets a breather, and prices have slid back as market tensions ease.
West Texas Intermediate (WTI) US Crude Oil is exploring the low side of the $82.00 handle after declining from a near-term peak near $87.00. US Crude Oil barrels have slipped 6%, but still remain up nearly 15% in 2024.
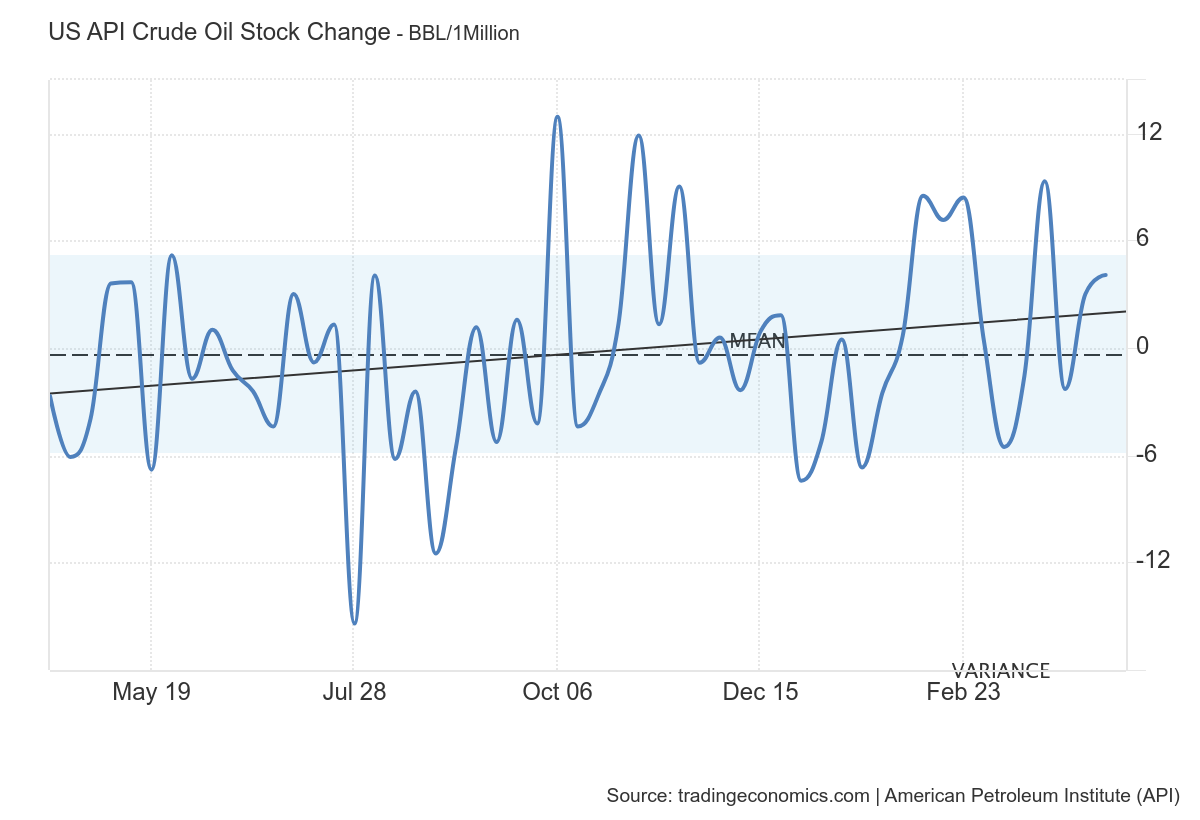
The American Petroleum Institute (API) will deliver its latest weekly Crude Oil Stocks barrel counts late Tuesday. US Crude reserves continue to defy gravity despite broad expectations of steep supply constraints in energy markets. US API barrel counts have been trending higher overall for some time.
WTI Crude Oil technical outlook
Geopolitical tensions continue to expose Crude Oil prices to upside volatility, but prices have continued to drift into the low end in the near term. Intraday action is on the bearish side of the 200-hour Exponential Moving Average (EMA) near $83.30. The $81.00 handle continues to act as an interim floor for price action, with bidders unable to reclaim territory above $82.00.
Despite declining for all but three of the last 12 consecutive trading days, US Crude Oil continues to trade above the 200-day EMA near $79.00. An extended backslide will see WTI challenging the first quarter’s congestion zone around the $78.00 handle.
WTI hourly chart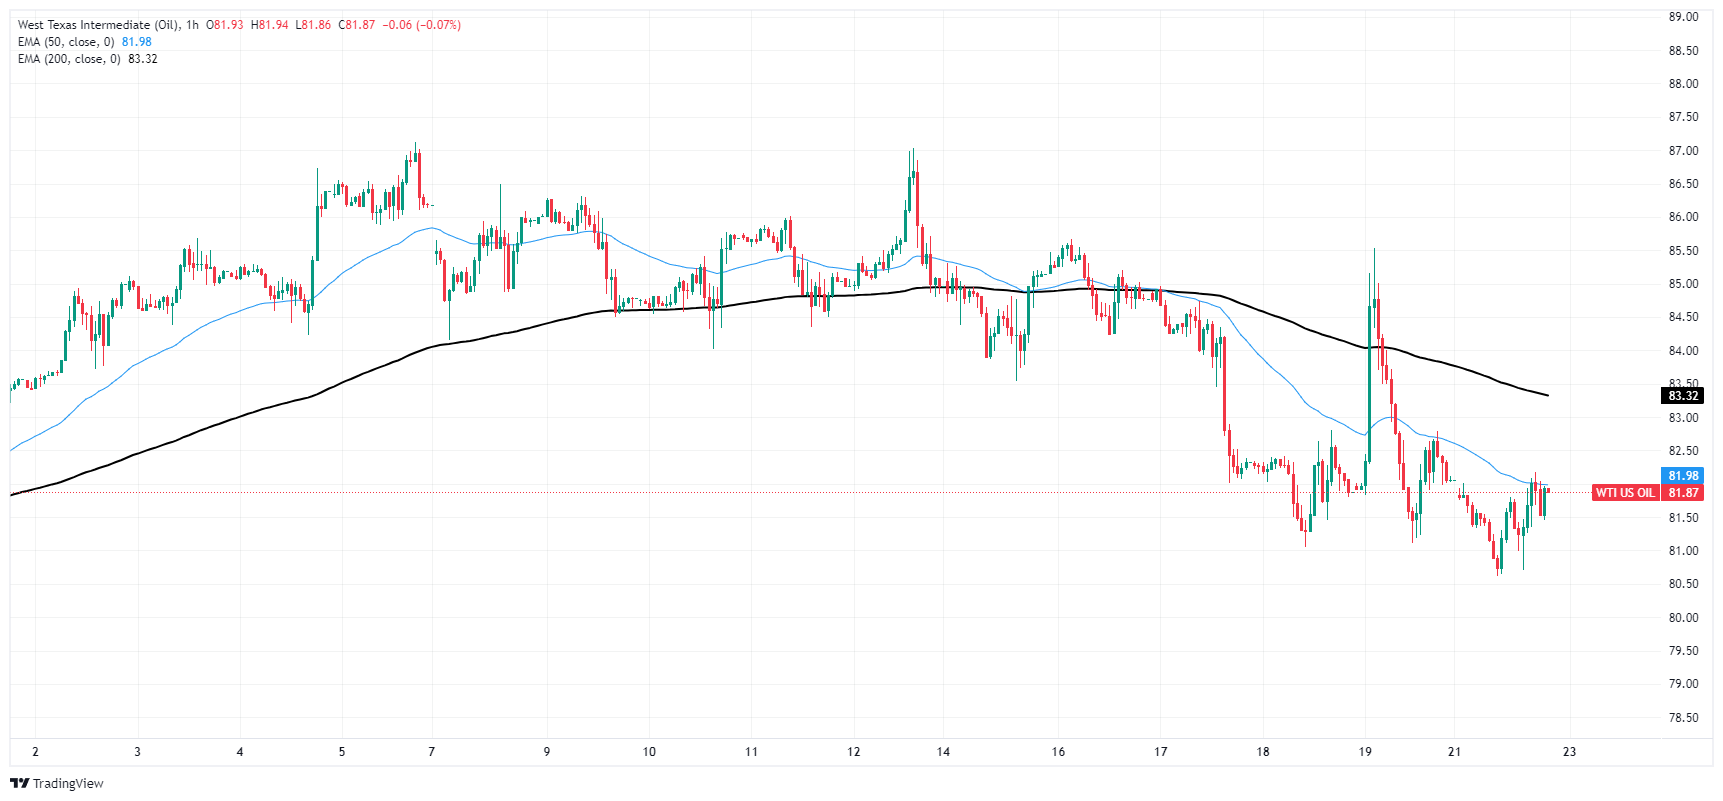
WTI daily chart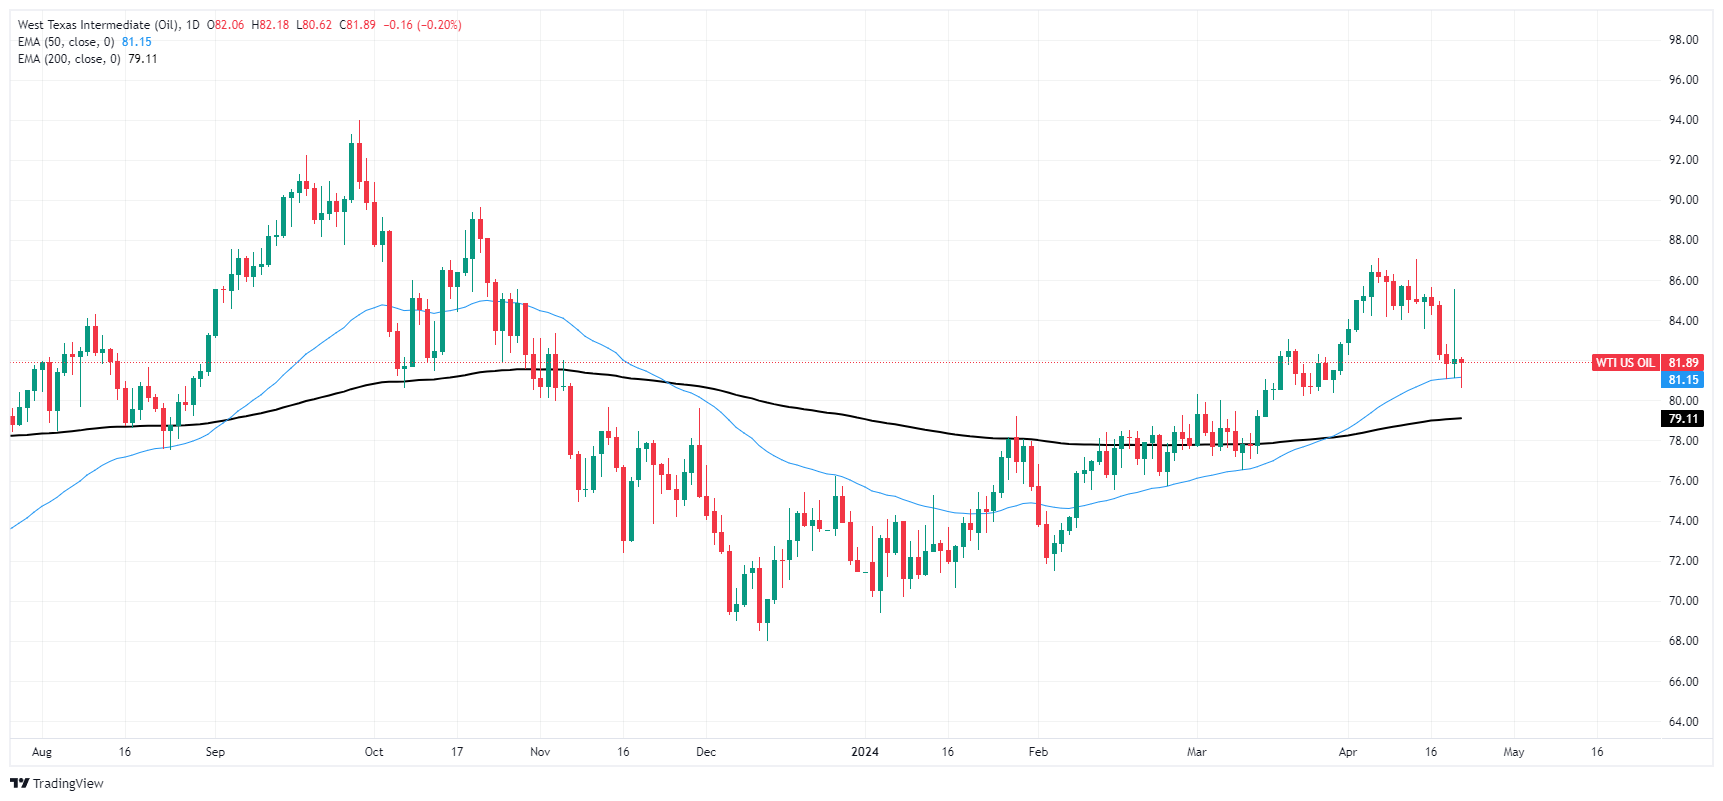
- AUD/JPY climbs sharply, approaching the key psychological level of 100.00, buoyed by renewed optimism in global markets.
- Technical analysis highlights potential resistance at the year-to-date high of 100.81, with further targets at 101.00.
- Key support levels identified at 99.65 and 99.20, with potential downside risk to the March 28 low at 98.17.
The AUD/JPY rallies sharply amid a risk-on impulse as Wall Street resumes its rally amid a light economic docket. At the time of writing, the cross-pair trades at 99.87 clocks gains of more than 0.60%.
AUD/JPY Price Analysis: Technical outlook
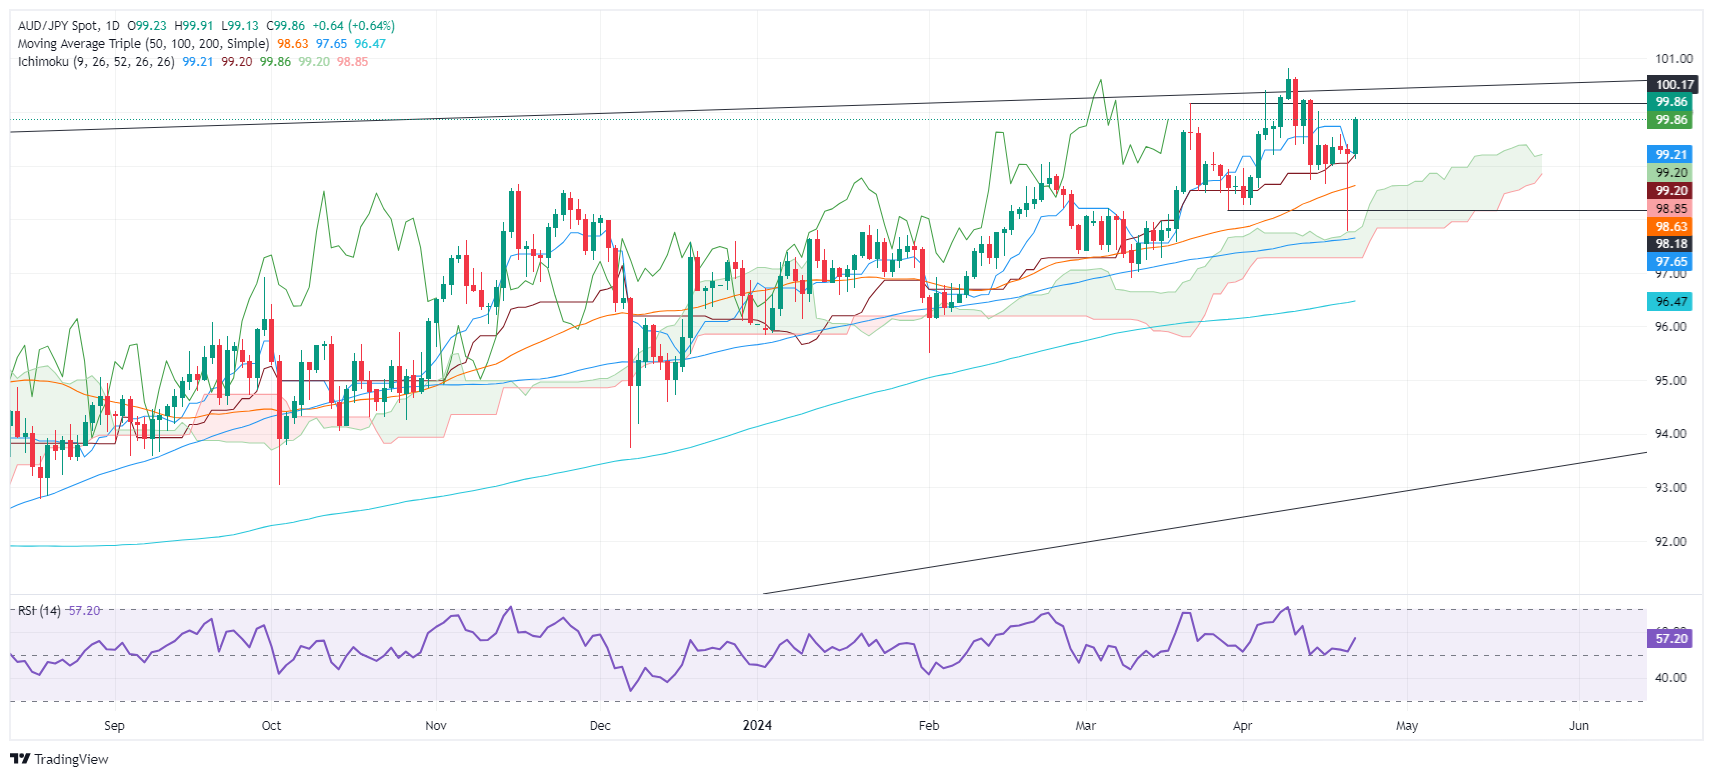
The AUD/JPY witnessed the formation of a ‘hammer’ on Friday in the daily chart, suggesting that further upside is seen. However, the pair plunged sharply toward a one-month low of 97.78 last Friday on geopolitical risks. As tensions abated, the Aussie Dollar (AUD) gained traction against the Japanese Yen (JPY).
If AUD/JPY continues its rally towards 100.00, it could potentially test the current year-to-date (YTD) high at 100.81. Once this level is cleared, the next significant resistance would be at 101.00, providing clear targets for traders to considers.
On the other hand, the AUD/JPY first support would be the 61.8% Fibo retracement at 99.65. Once cleared, the pair could drop toward the Tenkan-Sen and the Senkou Span A confluence at 99.20, followed by the 99.00 mark. Once surpassed, the next stop would be the March 28 swing low of 98.17.
AUD/JPY Price Action – Daily Chart
- Guppy recovers near-term after drop into 190.40.
- Thin data leaves the Pound Sterling exposed to further downside.
- Coming up this week: UK PMIs, Japanese Tokyo CPI inflation.
The GBP/JPY pair backslid into familiar lows near 190.40 as Pound Sterling (GBP) traders continue to look out for multiple rate cuts from the Bank of England (BoE) in 2024. Interest rate futures are currently pricing in a first cut from the UK’s central bank in July of this year, with at least two follow-up rate trims expected before the end of the year. Rate futures markets previously anticipated two cuts total in 2024, with the first initially pegged for August.
The S&P Global Purchasing Managers Indexes for the UK in April are slated to print early in the Tuesday market session. Markets anticipate a steady hold at 50.3 in the Manufacturing component. The Services component is expected to ease, albeit slightly, to 53.0 from 53.1.
Japan’s Tokyo Consumer Price Index (CPI) will print early Friday, with investors expecting YoY Tokyo CPI inflation to hold steady at 2.6%. The Bank of Japan’s (BoJ) latest Monetary Policy Statement will also occur sometime early Friday, with the BoJ’s Outlook Report for the first quarter expected around 03:00 GMT.
GBP/JPY technical outlook
The Guppy’s chart churn continues, with notable GBP weakness poking through. A near-term floor has been priced in near 190.40, with a heavy congestion zone built into the charts between 192.80 and 192.00.
Longer-term, the GBP/JPY pair is resting on the high end of an extremely bullish run up the charts. The pair trades well above the 200-day Exponential Moving Average (EMA) at 184.82, and the Guppy is sticking close to nine-year highs set in March above 192.50.
GBP/JPY hourly chart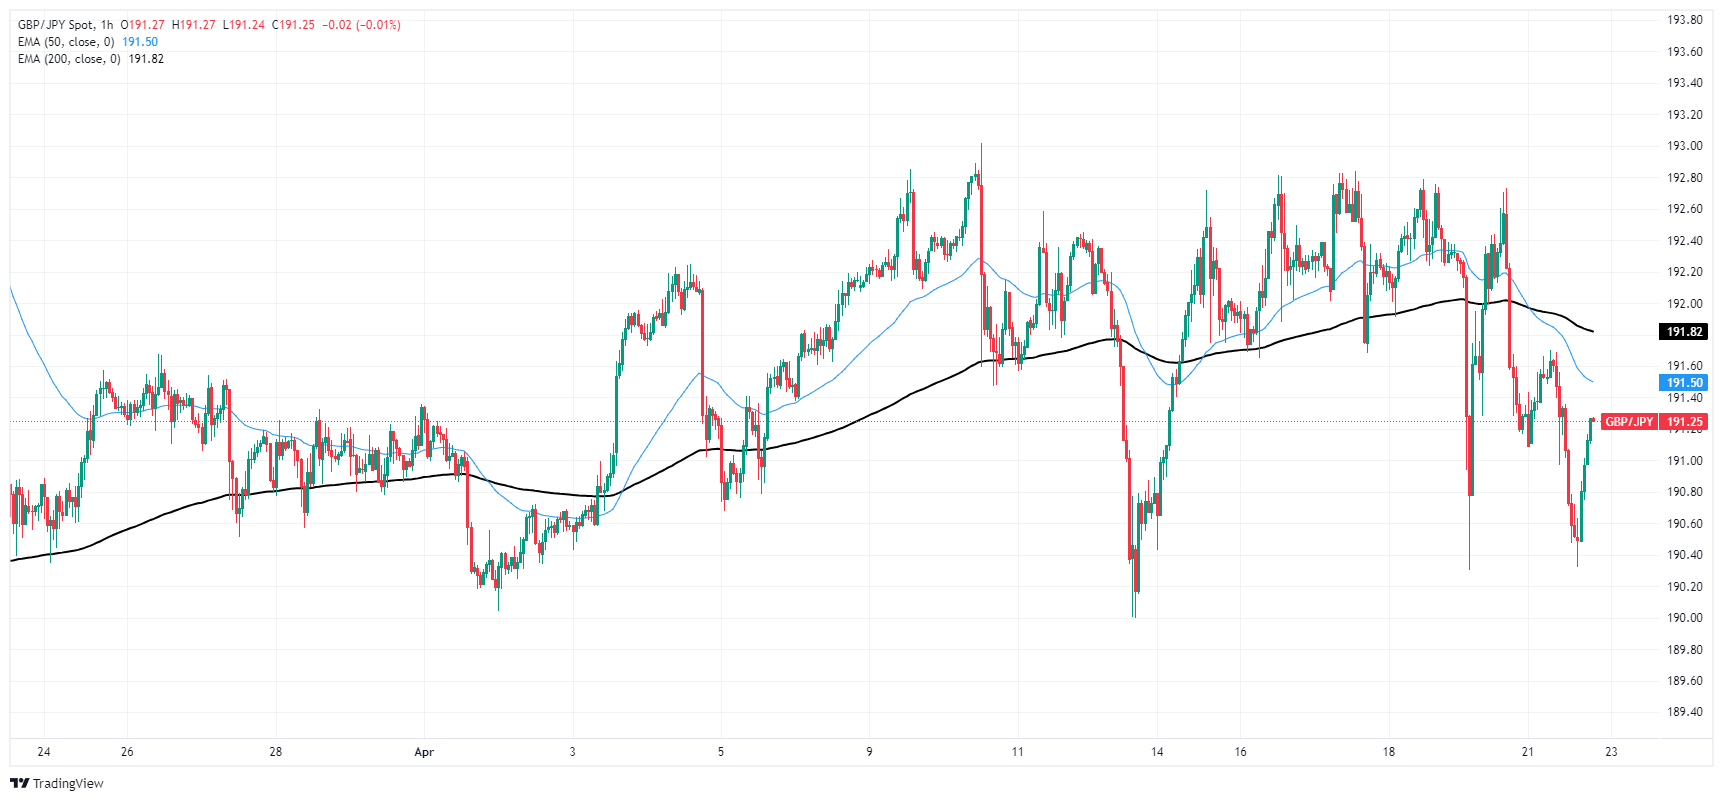
GBP/JPY daily chart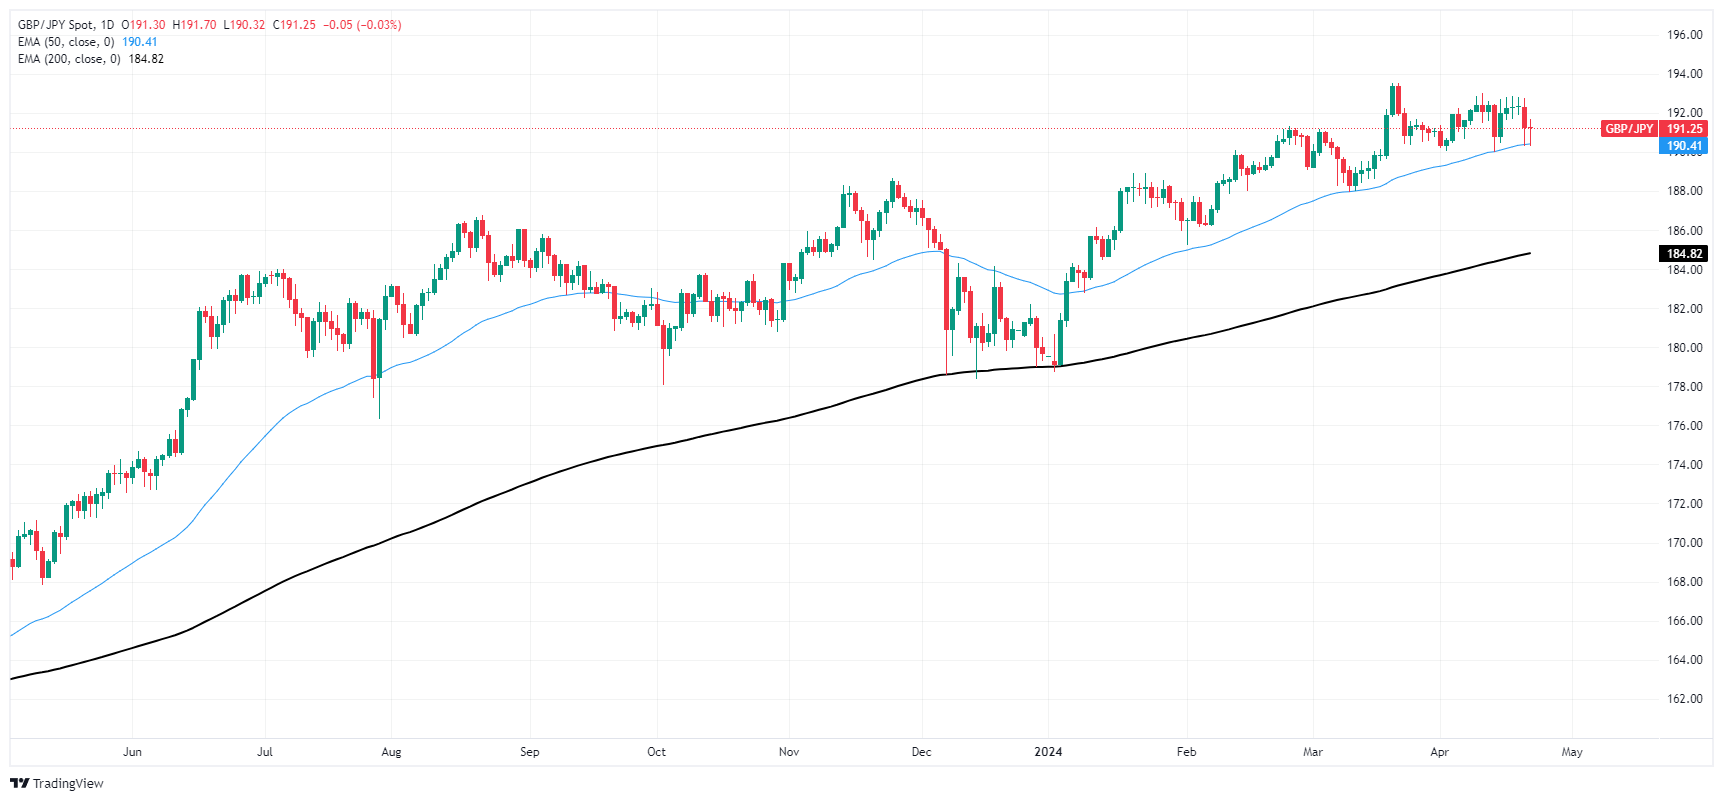
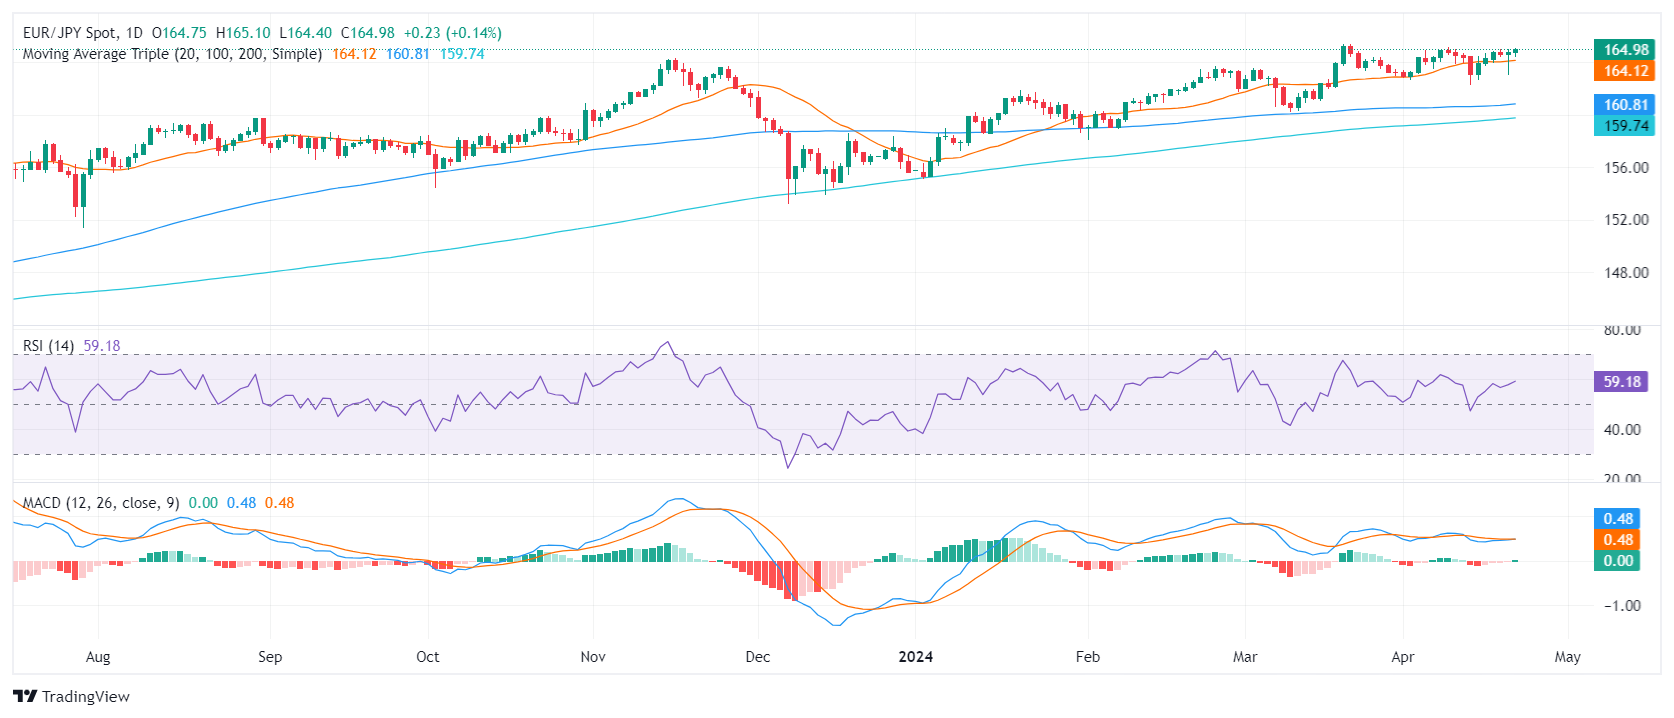
- The daily chart of EUR/JPY reveals a growing buying momentum, thanks to the RSI and the MACD strengthening.
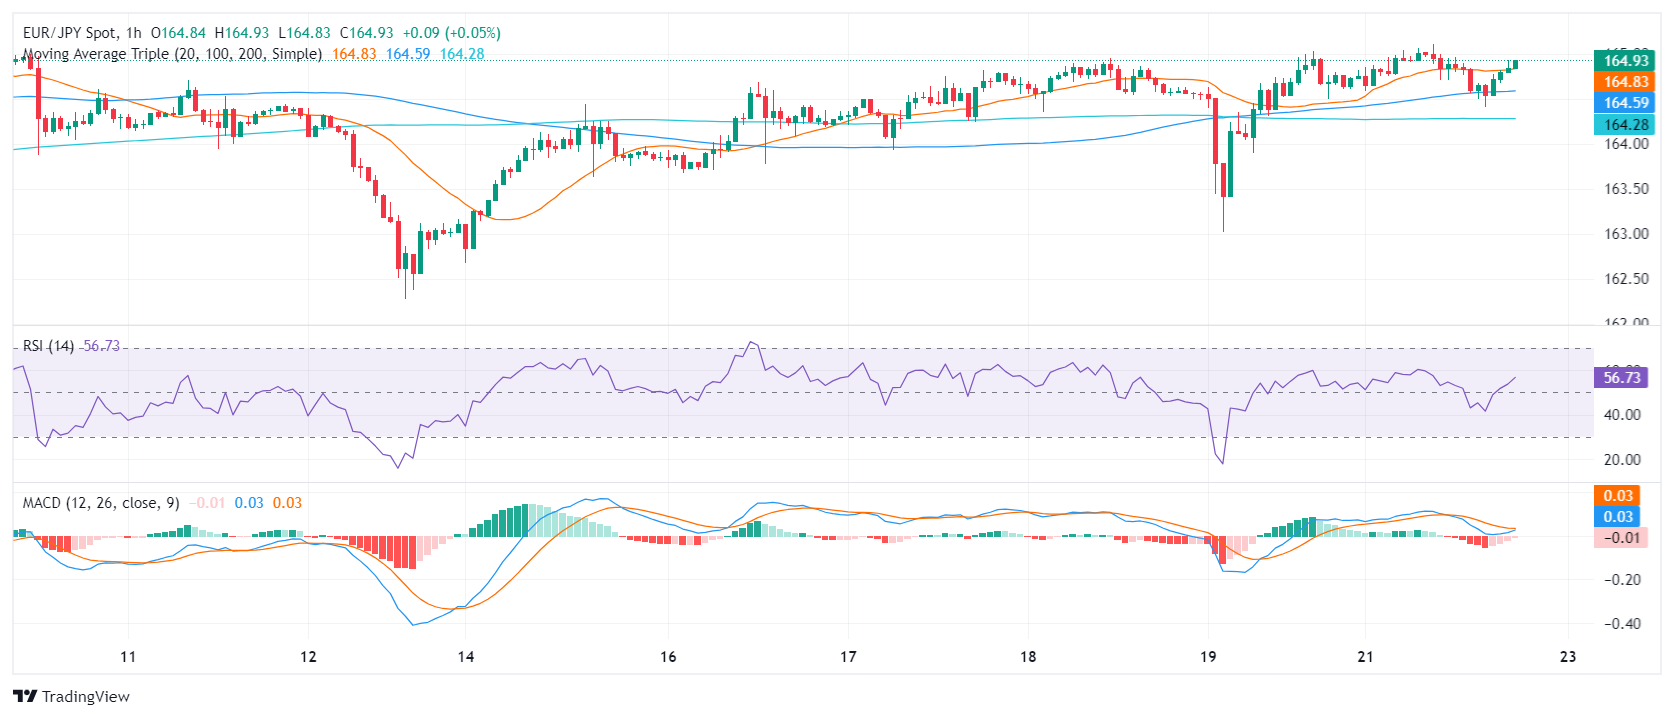
- The hourly chart shows a shift in market dynamics as indicators favor the buyers.
- Key Simple Moving Averages underline EUR/JPY's superiority, hinting at the potential long-term upside.
The EUR/JPY pair stands at 164.88, showing mild gains of on Monday’s session. The pair exhibits a firm bullish momentum echoed in the strengthening of the indicators on the hourly and daily charts.
Examining the Relative Strength Index (RSI) on the daily chart, indicates a continued rise towards the upper bounds, reinforcing upward momentum. The Moving Average Convergence Divergence (MACD) supports this positive momentum through fresh green bars, indicating strong buyer dominance.
EUR/JPY daily chart
In the hourly chart, the RSI has shown divergence from negative to positive territory, ranging from a low of 40 to a high of 56, which suggests a recovery of the buyers in the session. The hourly Moving Average Convergence Divergence (MACD) supports this as it prints decreasing red bars.
EUR/JPY hourly chart
In evaluating the broader market perspective, according to the Simple Moving Average (SMA), the pair's position above the 20, 100, and 200-day SMAs points towards a potential long-term positive trend. As long as the buyers keep the price above these key levels, the outlook will continue to be in their favor.
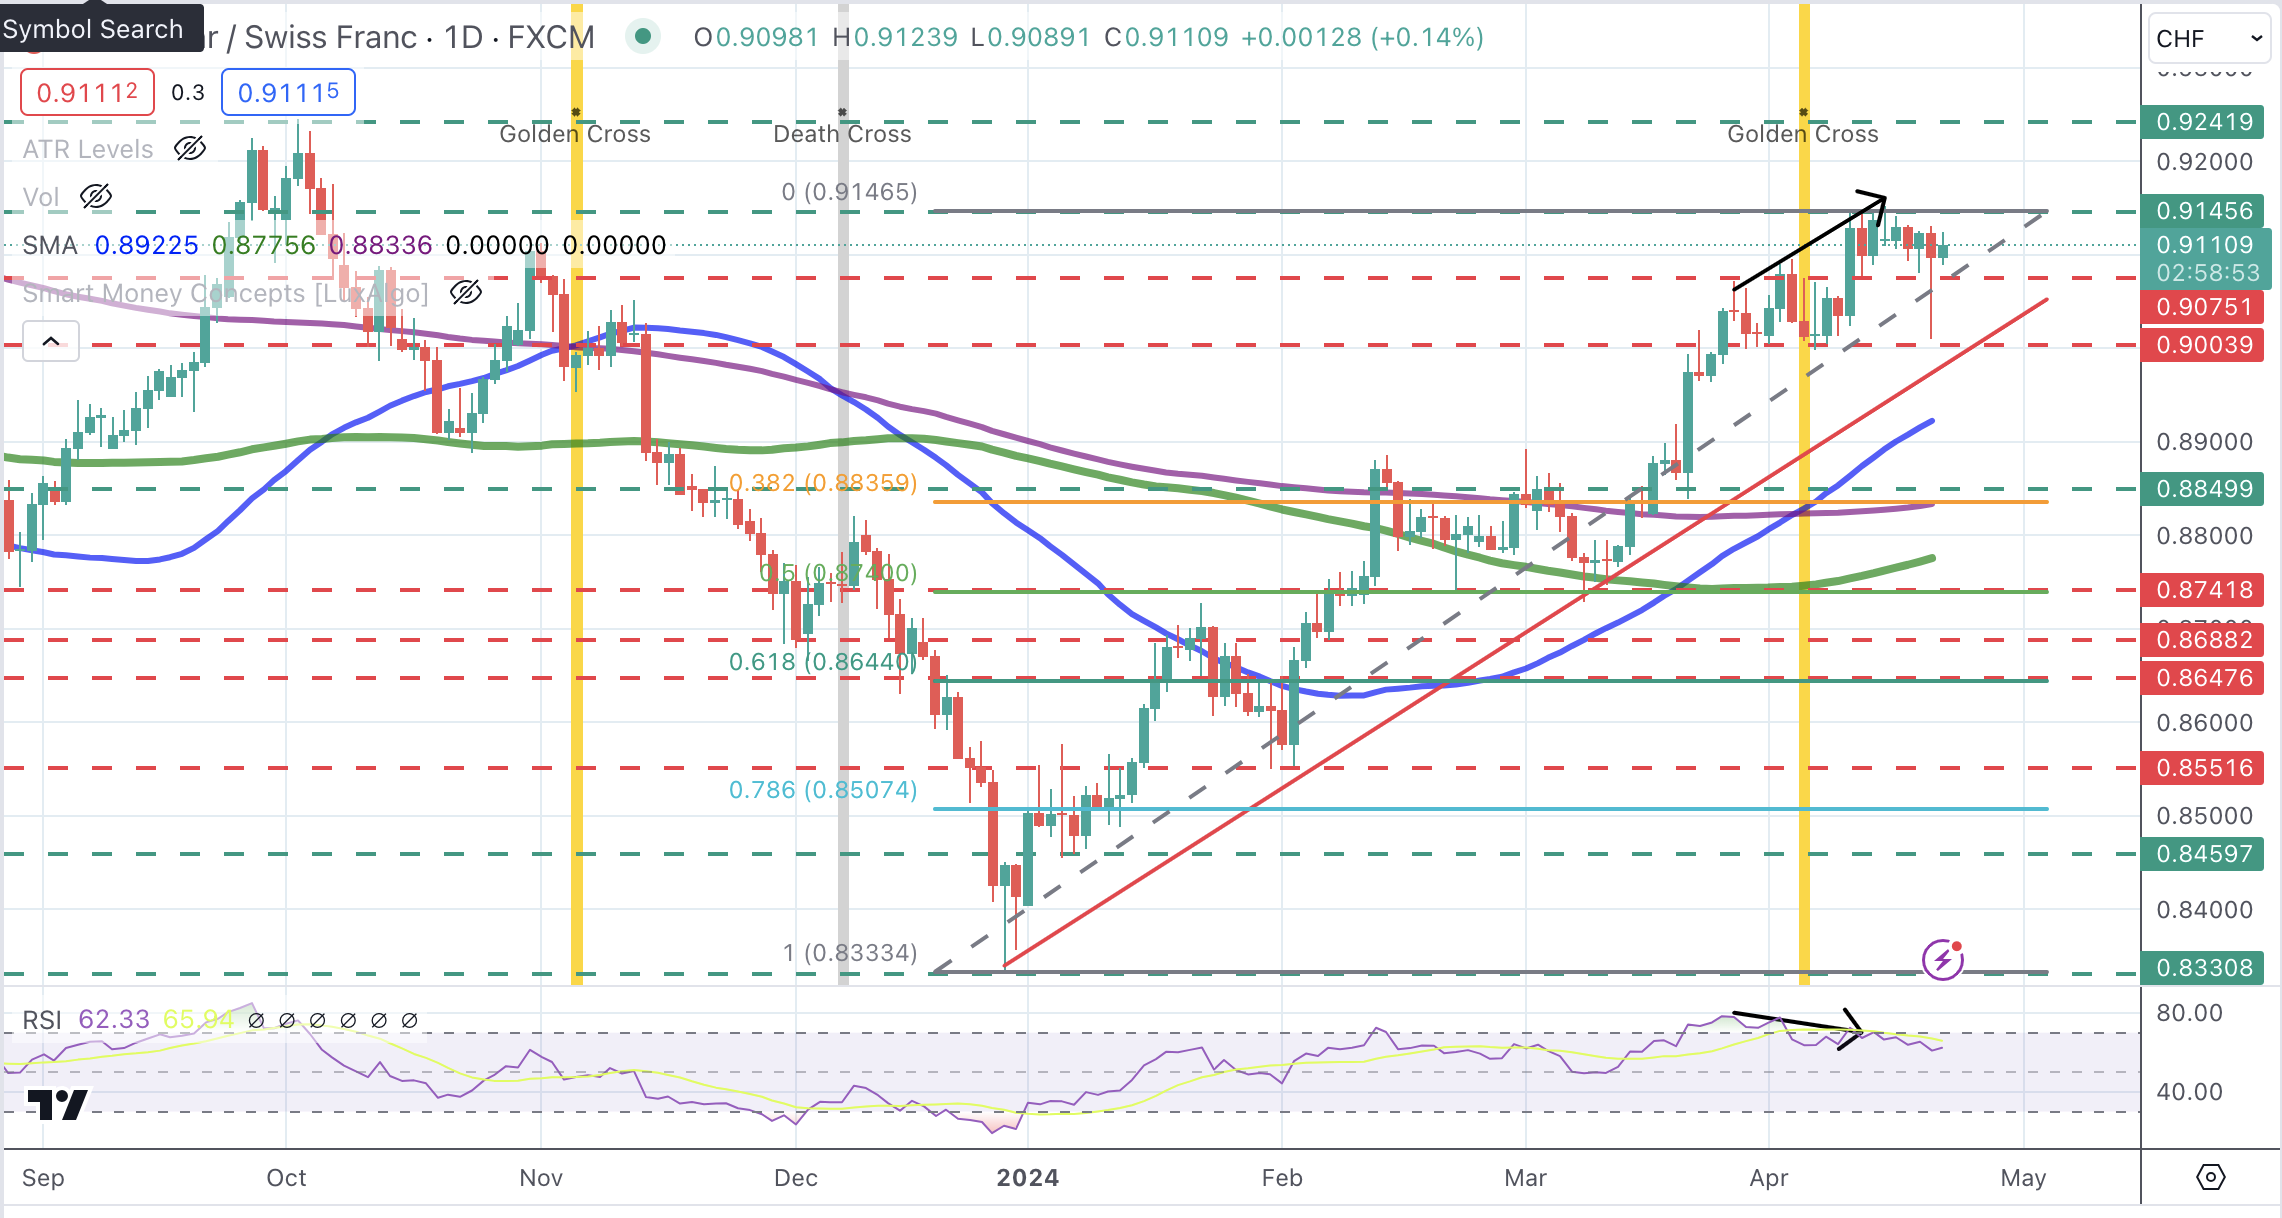
The US Dollar consolidates near highs with bears contained at 0.9075.
Easing geopolitical fears and monetary policy divergence are weighing on the Swiassie.
USD/CHF: Support at 0.9075 is closing the path towards the key 0.8980 - 0.9000 area.
The US Dollar regained lost ground on Friday, following a risk-averse reaction to Israel’s drone attack on Iran, and the pair has remained consolidating on Monday, with bears contained above 0.9075.
A moderate risk appetite, amid ebbing geopolitical fears, and lower US Treasury yields have weighed on demand for the USD. The US Dollar Index, which measures the price of the Dollar against a basket of the six most traded currencies has remained practically flat in the absence of key fundamental data.
Risks that the Middle East conflict might escalate into a regional war, involving Iran, have faded, at least for now, and that is likely to keep demand for the safe-haven Swiss Franc subdued.
In the US, investors have already priced in that the Fed will delay the monetary easing kick-off, and, most probably also reduce its size, and are looking for further clues about the Fed's policy plans. In this sense, Thursday’s US Q1 Gross Domestic Product and Friday’s PCE Prices Index will be analysed with particular interest.
USD/CHF Price Analysis: Technical outlook
Technical indicators show the bullish trend still active, with no clear sign of a trend shift in sight apart from some bearish divergence in the 4 H RSI. Immediate support at 0.9075 is closing the path towards the key 0.8980 - 0.9000 area, where the late-march lows and trendline support meet.
On the upside, a break of 0.9143 would resume the bullish trend and pave the path for a retest of November’s high, at 0.9240.
USD/CHF Daily Chart
- GBP/USD declines following dovish signals from Bank of England officials, with traders eyeing potential August rate cut.
- Strong US manufacturing data and a less dovish stance from the Federal Reserve boost the Greenback.
- Upcoming PMIs in the UK and US could further influence the currency pair.
The Pound Sterling lost ground against the US Dollar and dropped to its lowest level since November last year as investors began to price in a more dovish Bank of England. A scarce economic docket in the UK, left GBP/USD traders adrift to market mood and dynamics linked to the buck. Therefore, the pair trades at 1.2350, down 0.12%.
GBP/USD falls to 1.2350 amid speculation of BoE’s faster rate cuts
Last week, Bank of England Governor Andrew Baily said that inflation is edging lower and might warrant a rate cut. On Friday, BoE Deputy Governor Dave Ramsden shifted slightly dovish, saying that he expects incoming data to accentuate the economy's slowdown.
The swaps markets suggest the Bank of England might cut rates in August, with odds standing at 95.9%.
Across the pond, manufacturing activity in the United States (US) gathers steam, as revealed by the Chicago Federal Reserve. The Chicago Fed National Activity Index (CFNAI) rose to 0.15 in March from 0.09 in February. The index’s three-month moving average increased from -0.28 in February to -0.19 in March.
That, along with the hawkish tilt adopted by Federal Reserve Chair Jerome Powell, increased the odds of a less dovish Fed. Market participants expect fewer rate cuts than the Fed's March Summary of Economic Projections (SEP) projection.
Chicago Board of Trader (CBOT) data depicts the Fed could begin to ease policy until September 2024, a month after the BoE. That would keep the GBP/USD downward pressured, as the interest rate differential favors the Fed.
What’s ahead for the GBP/USD?
Ahead of the week, the UK economic docket will feature PMIs. In the US, Fed officials began its blackout period ahead of the May 1 meeting. However, April PMIs and housing data will be released by S&P Global.
Dwindling geopolitical jitters lent much-needed oxygen to the risk-linked galaxy at the beginning of a week dominated by upcoming US inflation readings as well as corporate earnings reports.
Here is what you need to know on Tuesday, April 23:
In quite an uneventful start to the week, the Greenback printed humble gains and kept the USD Index (DXY) afloat in the low 106.00s. On April 23, flash PMIs are due, seconded by New Home Sales.
EUR/USD retreated marginally and hovered around the 1.0650 region despite the dominating risk-on mood. The euro calendar will show preliminary PMIs in Germany and the broader euro bloc on April 23.
GBP/USD magnified its decline and revisited the sub-1.2300 area for the first time since mid-November. Advanced PMIs and Public Sector net borrowing are due in the UK docket on April 23.
USD/JPY advanced to a new 34-year high around 154.85 amidst the continuation of the broader consolidative mood. There are no data releases scheduled in the Japanese docket on April 23.
AUD/USD regained composure and rose to two-day highs in an auspicious beginning of the week. The Judo Bank flash PMIs are expected in Australia on April 23.
WTI ended the session barely changed after bottoming out in new lows in the sub-$81.00 region.
Declining geopolitical concerns dragged Gold prices to multi-session lows near $2,330 per troy ounce. In the same line, Silver prices collapsed more than 5% and revisited the boundaries of the $27.00 mark per ounce.
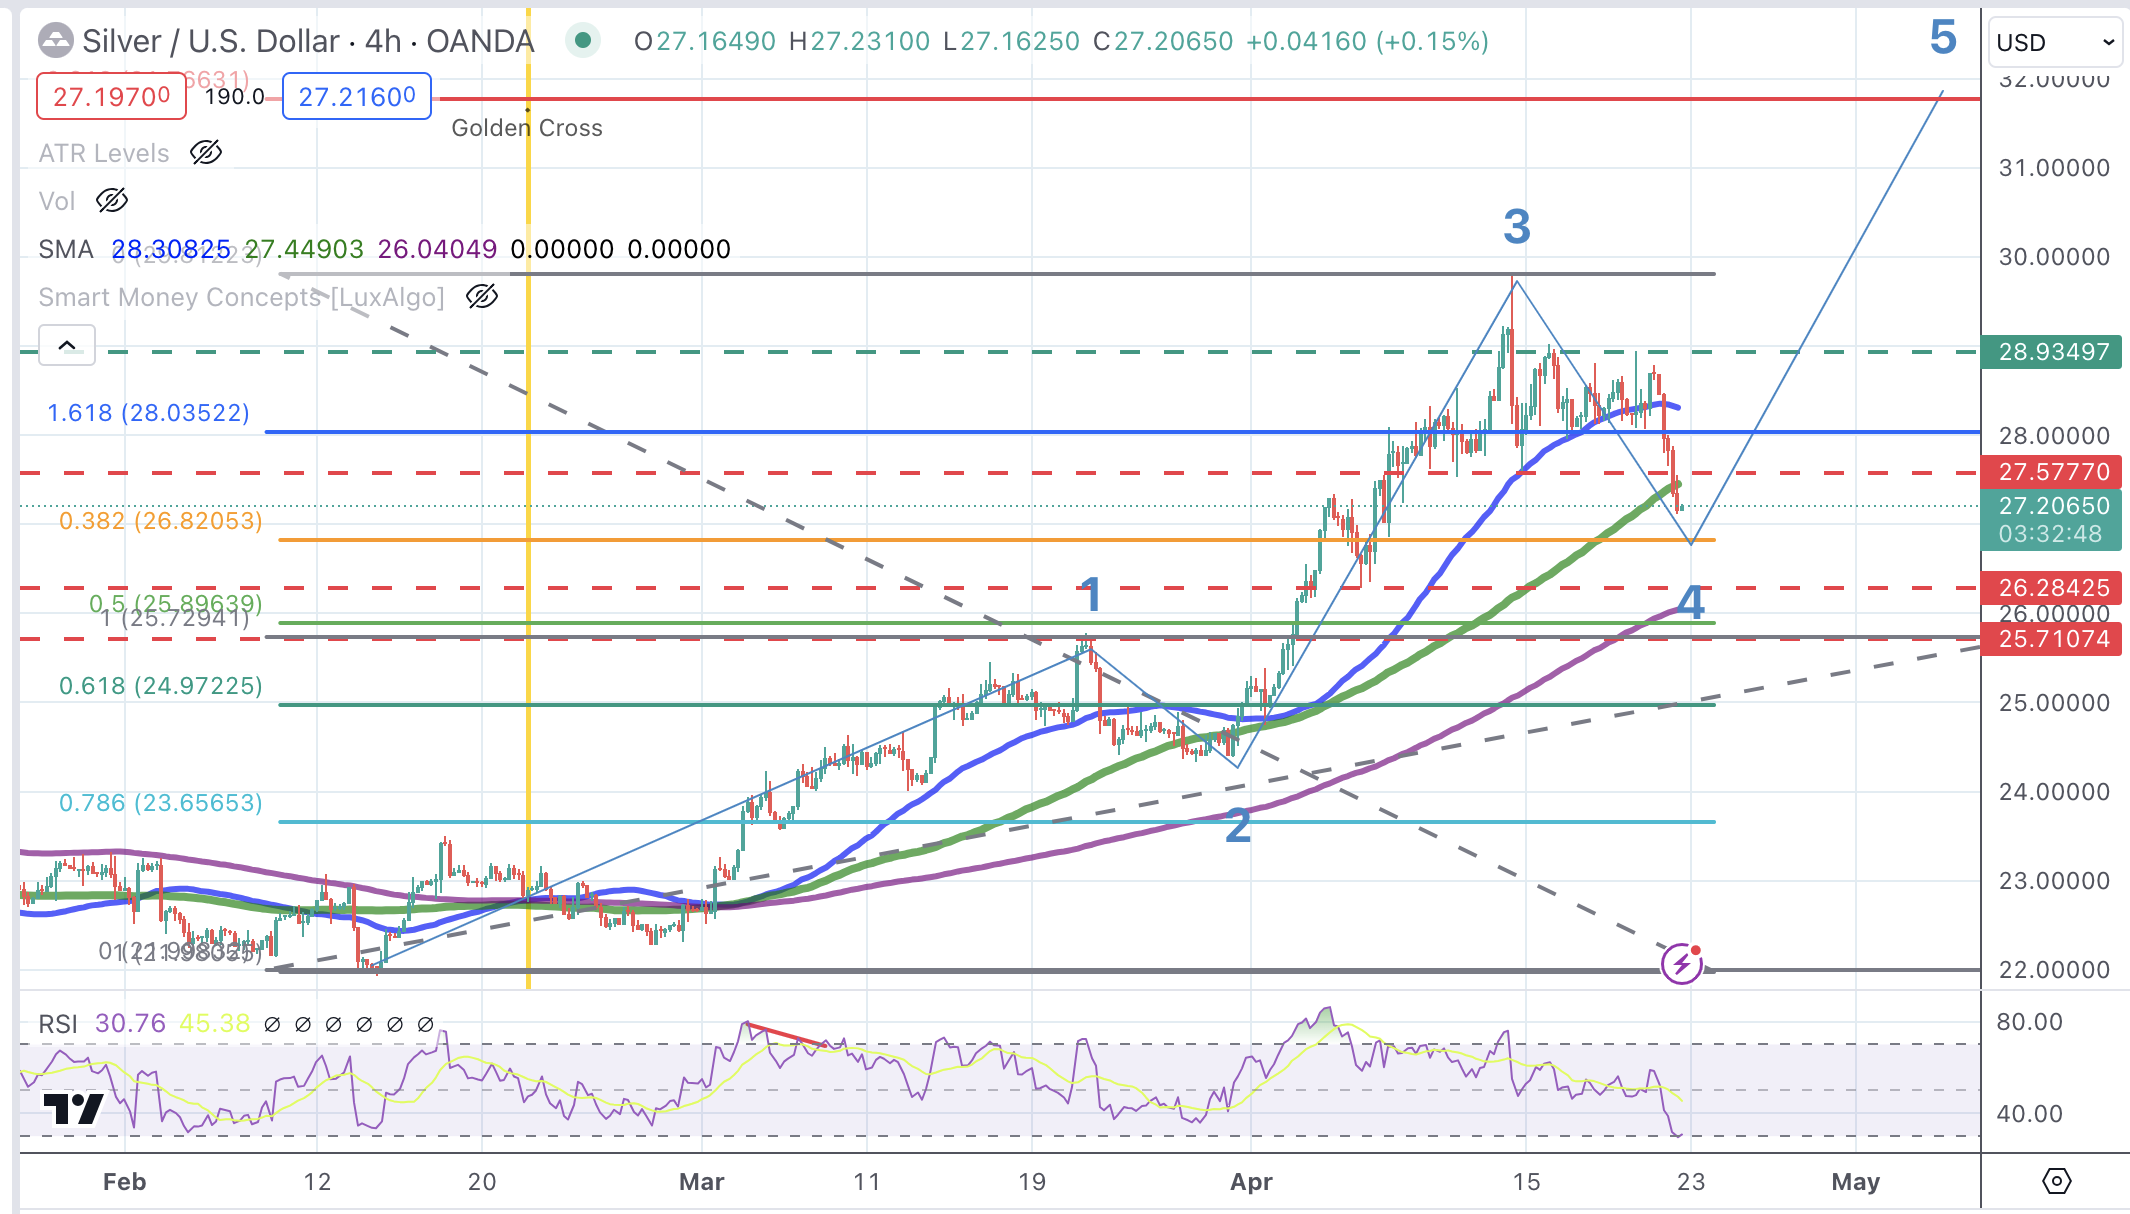
- Silver building up bearish momentum after breaching $27.57 support level.
- A brighter market mood amid receding geopolitical risks is weighing on Precious metals.
- XAG/USD has scope for further decline, next targets are $26.85 and $26.30.
Silver (XAG/USD) is going through a deep correction on Monday, with precious metals suffering as concerns about an escalation of the Middle East conflict ebb. The lower US Yields have failed to support demand for the pale metal, which has depreciated about 5.7% from Friday’s highs.
XAG/USD Price Analysis: Technical outlook
Bears gained confidence on Monday after pushing prices below the $27.57 support area. Technical indicators are pointing lower, with the 4h approaching but not yet at oversold levels and price action below the 50 and the 100 SMAS.
Using Elliott wave analysis, the pair seems on the 4th corrective wave of a five-wave bullish cycle. The 38.2% Fibonacci retracement of the mentioned bull run, at $26.85 is a common target for corrections, and close below is the April 5 low, at $26.30.
On the upside, the pair would need to regain the $27.60 previous support level to shift its focus to the $27.95 and Mid-April’s high, at $29.80.
XAG/USD Price Action - 4 Hour Chart
- Canadian Dollar finds room on high side as data-driven markets await US PMI print.
- Canada data remains limited until Wednesday's CAD Retail Sales.
- Tuesday's US PMIs expected to show a slight uptick in activity.
The Canadian Dollar (CAD) is moderately higher on Monday, trading into the green against most of its major currency peers. Monday's thin economic calendar leaves both the Canadian Dollar and the US Dollar (USD) adrift as investors await meaningful data.
Canada brought strictly low-tier data to the table on Monday with an uptick in the Raw Materials Price Index. At the same time, Industrial Product Prices met expectations, printing higher but less than the previous figure. The Canadian New Home Price Index flattened in March, missing forecasts while retreating slightly from the same period last year.
Daily digest market movers: Canadian Dollar extends recovery in steady markets
- Monday’s Canada data saw mixed prints, but market focus remains elsewhere, giving the CAD room to run.
- Canadian Industrial Produce Prices came in at the expected 0.8% in March, easing back slightly from the previous month’s 1.1% (revised upward from 0.7%).
- The Canadian New Housing Price Index flatted in March, printing 0.0% versus the forecast steady hold at 0.1%. YoY NHPI eased back -0.4% as housing prices wobble following years of accelerated growth.
- Canada’s Raw Material Price Index jumped 3.7% in March, vaulting over the forecast 2.9% compared to February’s 2.1%.
- Canadian February Retail Sales due to print in the midweek, forecast to rebound to 0.1% on Wednesday after January's -0.3% decline.
- Tuesday’s US S&P Global Purchasing Managers Index (PMI) will be the key data print for the early week, with the Manufacturing component forecast at 52.0 (previous 51.9) and the Services component also anticipated to print at 52.0 (last 51.7%).
- US Gross Domestic Product (GDP) and US Core Personal Consumption Expenditures (PCE) to dominate market focus in the back half of the trading week.
Canadian Dollar price today
The table below shows the percentage change of Canadian Dollar (CAD) against listed major currencies today. Canadian Dollar was the strongest against the Pound Sterling.
| USD | EUR | GBP | CAD | AUD | JPY | NZD | CHF | |
| USD | 0.11% | 0.26% | -0.19% | -0.24% | 0.12% | -0.20% | 0.14% | |
| EUR | -0.11% | 0.15% | -0.30% | -0.34% | 0.01% | -0.29% | 0.01% | |
| GBP | -0.26% | -0.15% | -0.45% | -0.49% | -0.14% | -0.45% | -0.13% | |
| CAD | 0.19% | 0.30% | 0.45% | -0.05% | 0.30% | 0.00% | 0.31% | |
| AUD | 0.24% | 0.35% | 0.49% | 0.05% | 0.35% | 0.04% | 0.37% | |
| JPY | -0.12% | 0.00% | 0.14% | -0.29% | -0.35% | -0.31% | 0.02% | |
| NZD | 0.19% | 0.28% | 0.42% | 0.01% | -0.04% | 0.30% | 0.30% | |
| CHF | -0.12% | -0.01% | 0.13% | -0.31% | -0.35% | -0.01% | -0.31% |
The heat map shows percentage changes of major currencies against each other. The base currency is picked from the left column, while the quote currency is picked from the top row. For example, if you pick the Euro from the left column and move along the horizontal line to the Japanese Yen, the percentage change displayed in the box will represent EUR (base)/JPY (quote).
Technical analysis: Canadian Dollar mounting a slow recovery, sights on 1.3700
The Canadian Dollar was broadly higher on Monday, gaining four-tenths of a percent against the Pound Sterling (GBP) and nearly a third of a percent against the Swiss Franc (CHF) and the Japanese Yen (JPY). The CAD is outperformed by the Australian Dollar (AUD) and the New Zealand Dollar (NZD) as the Antipodeans recover recently lost ground.
The USD/CAD pair fell from last week’s peak of 1.3840, and a bullish recovery attempt fell short after a bearish rejection from the 1.3800 handle. The pair is now targeting 1.3700, which will clear the way for a push toward a supply zone near 1.3550 as the Loonie leaks below technical support at the 200-hour Exponential Moving Average (EMA) near 1.3730.
Looking longer-term, daily candlesticks have the USD/CAD pair poised for a fourth consecutive down day as the Canadian Dollar extends a near-term recovery. The Greenback failed to recapture November’s highs near 1.3900, and momentum threatens to return USD/CAD back to heavy congestion at the 200-day EMA just above the 1.3500 handle.
USD/CAD hourly chart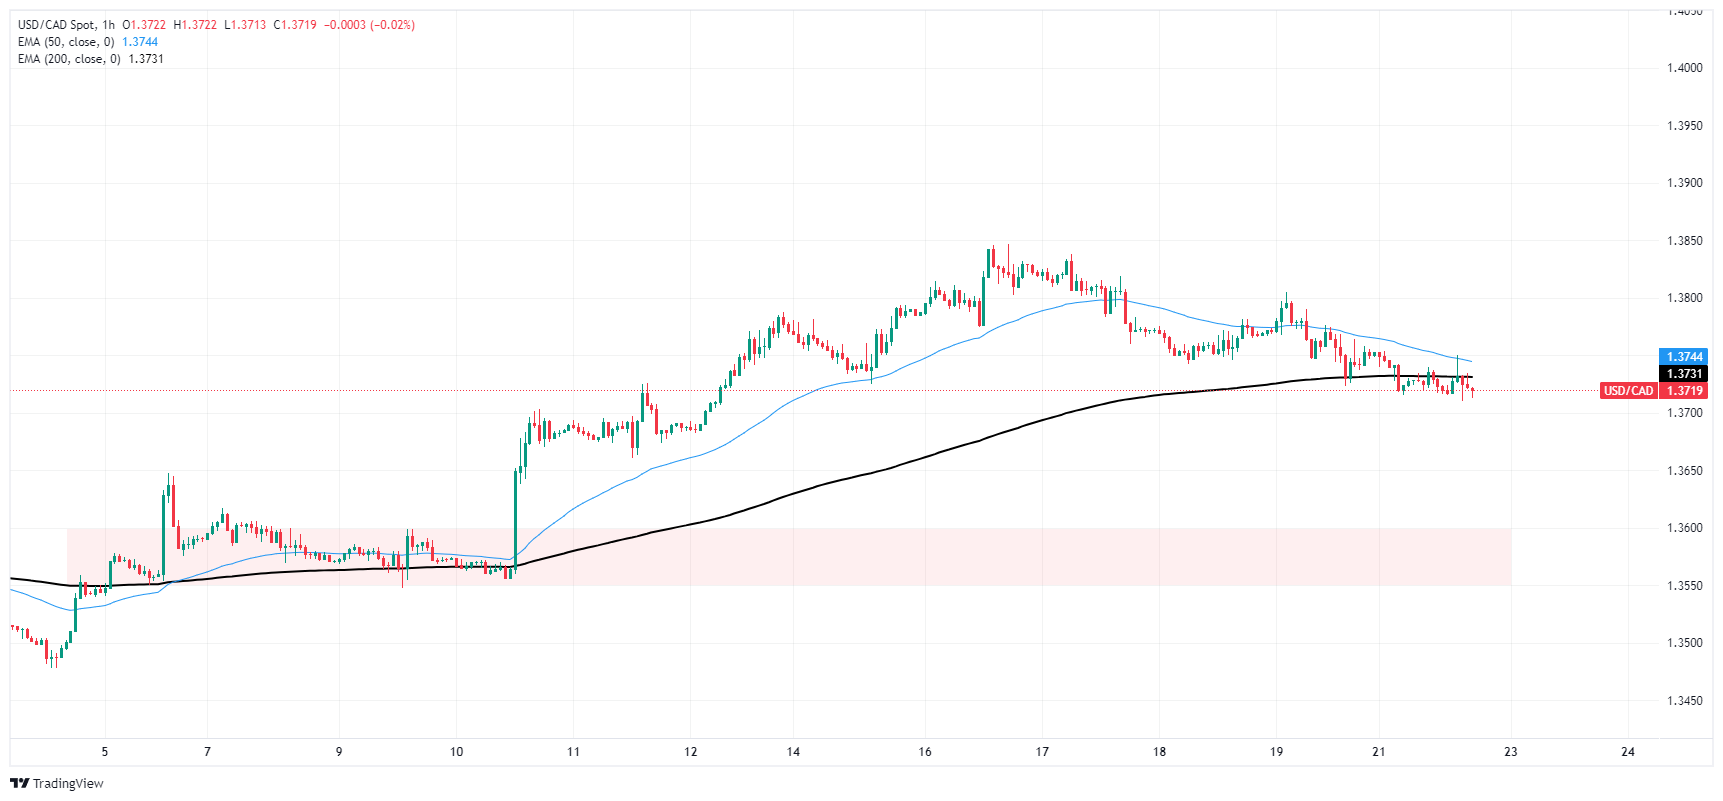
USD/CAD daily chart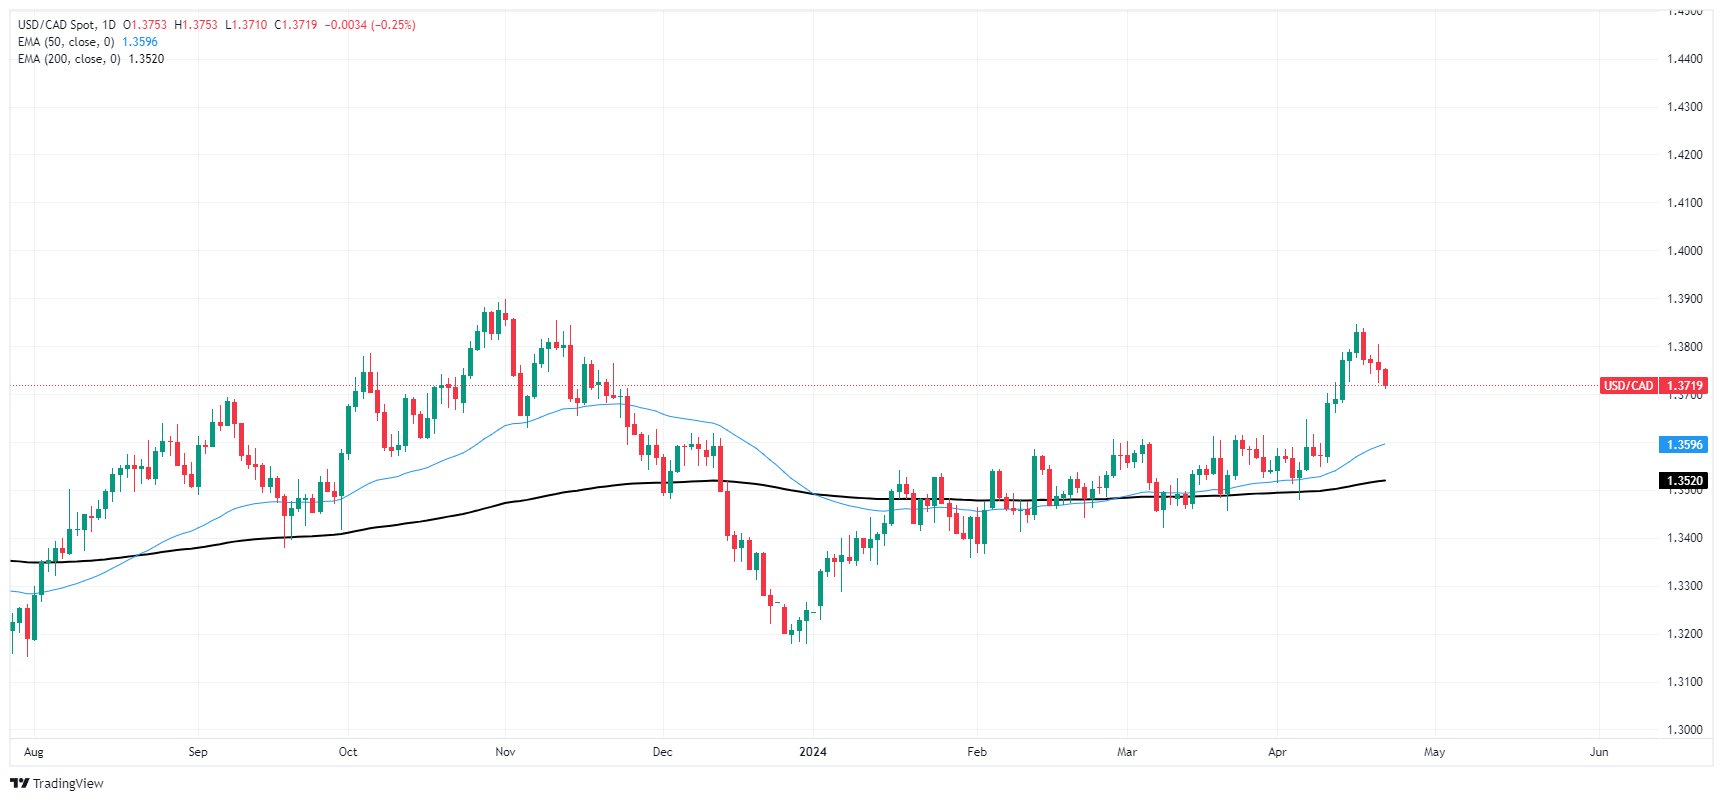
Canadian Dollar FAQs
The key factors driving the Canadian Dollar (CAD) are the level of interest rates set by the Bank of Canada (BoC), the price of Oil, Canada’s largest export, the health of its economy, inflation and the Trade Balance, which is the difference between the value of Canada’s exports versus its imports. Other factors include market sentiment – whether investors are taking on more risky assets (risk-on) or seeking safe-havens (risk-off) – with risk-on being CAD-positive. As its largest trading partner, the health of the US economy is also a key factor influencing the Canadian Dollar.
The Bank of Canada (BoC) has a significant influence on the Canadian Dollar by setting the level of interest rates that banks can lend to one another. This influences the level of interest rates for everyone. The main goal of the BoC is to maintain inflation at 1-3% by adjusting interest rates up or down. Relatively higher interest rates tend to be positive for the CAD. The Bank of Canada can also use quantitative easing and tightening to influence credit conditions, with the former CAD-negative and the latter CAD-positive.
The price of Oil is a key factor impacting the value of the Canadian Dollar. Petroleum is Canada’s biggest export, so Oil price tends to have an immediate impact on the CAD value. Generally, if Oil price rises CAD also goes up, as aggregate demand for the currency increases. The opposite is the case if the price of Oil falls. Higher Oil prices also tend to result in a greater likelihood of a positive Trade Balance, which is also supportive of the CAD.
While inflation had always traditionally been thought of as a negative factor for a currency since it lowers the value of money, the opposite has actually been the case in modern times with the relaxation of cross-border capital controls. Higher inflation tends to lead central banks to put up interest rates which attracts more capital inflows from global investors seeking a lucrative place to keep their money. This increases demand for the local currency, which in Canada’s case is the Canadian Dollar.
Macroeconomic data releases gauge the health of the economy and can have an impact on the Canadian Dollar. Indicators such as GDP, Manufacturing and Services PMIs, employment, and consumer sentiment surveys can all influence the direction of the CAD. A strong economy is good for the Canadian Dollar. Not only does it attract more foreign investment but it may encourage the Bank of Canada to put up interest rates, leading to a stronger currency. If economic data is weak, however, the CAD is likely to fall.
- The US Dollar maintains a bid tone and is testing 154.78 high.
- The Yen remains weighed by interest rate differentials between the Fed and the BoJ.
- Friday’s BoJ momentary policy statement might give a fresh impulse to the Yen.
Nothing stops the US Dollar. Neither the moderate risk appetite seen on Monday nor the reiterated intervention warnings by diverse economic authorities, the Yen remains pinned to long-term lows near 155.00.
The pair extended its recovery on Monday, following a spike lower last week, following news of the Israeli attack on Iran. Tehran downplayed the event, suggesting its will to avoid a direct confrontation with Tel Aviv, which the market has welcomed.
This has failed to give some oxygen to a battered Yen, which is struggling on carry trade dynamics. The widening yield differential between the Yen and most of the major currencies encourages speculators to borrow JPY and exchange for higher-yielding assets elsewhere.
Adverse interest rate differentials are weighing on the JPY
Last week, an unusual joint statement from the US, Japanese, and South Korean authorities pledged to act against excessive currency volatility. This had an immediate easing impact on the US Dollar, which seems to have faded on Monday.
Yen's weakness helps Japanese exporters to sell their products on foreign markets but makes imports more expensive in the domestic ones. This has an inflationary impact on prices and forces the BoJ to accelerate its normalization pace. The Japanese central bank meets on Friday, after the release of the anticipated Tokyo CPI figures. Any hint on that lion at the bank’s statement might give some fresh impulse to the Yen.
In the US, the focus will be on Thursday’s first-quarter GDP figures and Friday’s PCE Prices Index data. This is the Fed’s gauge of choice to assess inflationary trends and might set the US Dollar’s near-term direction.
- US Dollar Index shows steady momentum, holds above 106.00.
- Investors will eye bond auctions in the US as increased supply may fuel a hike in US yields.
- Along with mid-tier reports, the week’s highlight will be March’s Personal Consumption Expenditures (PCE) data.
The US Dollar Index (DXY) is mildly edging higher on Monday, currently trading at 106.20. The Greenback’s strength is driven by robust domestic economic and persistent inflation pressures, which fuels a more hawkish stance by the Federal Reserve (Fed). Despite a quiet start to the week, the DXY continues its resilience, with signs pointing toward a possible retest of the November highs near 107.10.
The US economy demonstrates enduring strength with increased yields and robust growth, aiding the US Dollar's steadiness. Some Fed officials started to consider a rate hike as they see no progress on inflation. As for now, markets are delaying the start of the easing cycle. This week, the US will release Personal Consumption Expenditures (PCE) and Durable Goods from March, Gross Domestic Product (GDP) estimations from Q1, and S&P PMIs from April, all of which will likely impact expectations on the next Fed decision.
Daily digest market movers: DXY holds steady as markets await drivers
- A hawkish turn from the Fed, coupled with additional US Treasury supply, could fuel additional upward movements in the US Treasury bond yields. This scenario can drive further Greenback gains following market adjustments to the Fed's actions.
- According to market expectations, investors assign a 15% probability of a rate cut in the coming June meeting. This chance increases to 45% for a July rate cut, and even a September rate cut is only priced at 85% odds.
- Upon examining the bond market, US Treasury bond yields are registering a slight decline. Specifically, the 2-year yield is seen at 4.97%, the 5-year yield at 4.64%, and the 10-year yield is slightly lower at 4.61%.
DXY technical analysis: DXY bulls struggle amid flat indicators
Despite the bullish momentum being halted, the DXY pair appears well-supported by its position above the 20,100 and 200-day Simple Moving Averages (SMAs), suggesting ongoing bullish sentiment.
The Relative Strength Index (RSI), being flat in positive territory, leaves room for possible bullish incursions. The lack of any definitive inclination may indicate an ongoing struggle between bulls and bears, yet retaining a latent potential for bullish behavior. Coinciding with the neutral RSI, the Moving Average Convergence Divergence (MACD) presenting flat green bars signals a sustained but flat buying momentum. Despite the occasional downturns, the prevalent green histogram highlights bulls’ resilience.
US Dollar FAQs
The US Dollar (USD) is the official currency of the United States of America, and the ‘de facto’ currency of a significant number of other countries where it is found in circulation alongside local notes. It is the most heavily traded currency in the world, accounting for over 88% of all global foreign exchange turnover, or an average of $6.6 trillion in transactions per day, according to data from 2022. Following the second world war, the USD took over from the British Pound as the world’s reserve currency. For most of its history, the US Dollar was backed by Gold, until the Bretton Woods Agreement in 1971 when the Gold Standard went away.
The most important single factor impacting on the value of the US Dollar is monetary policy, which is shaped by the Federal Reserve (Fed). The Fed has two mandates: to achieve price stability (control inflation) and foster full employment. Its primary tool to achieve these two goals is by adjusting interest rates. When prices are rising too quickly and inflation is above the Fed’s 2% target, the Fed will raise rates, which helps the USD value. When inflation falls below 2% or the Unemployment Rate is too high, the Fed may lower interest rates, which weighs on the Greenback.
In extreme situations, the Federal Reserve can also print more Dollars and enact quantitative easing (QE). QE is the process by which the Fed substantially increases the flow of credit in a stuck financial system. It is a non-standard policy measure used when credit has dried up because banks will not lend to each other (out of the fear of counterparty default). It is a last resort when simply lowering interest rates is unlikely to achieve the necessary result. It was the Fed’s weapon of choice to combat the credit crunch that occurred during the Great Financial Crisis in 2008. It involves the Fed printing more Dollars and using them to buy US government bonds predominantly from financial institutions. QE usually leads to a weaker US Dollar.
Quantitative tightening (QT) is the reverse process whereby the Federal Reserve stops buying bonds from financial institutions and does not reinvest the principal from the bonds it holds maturing in new purchases. It is usually positive for the US Dollar.
- Mexican Peso dips further despite upbeat economic figures from Mexico.
- Higher US yields, strong US Dollar continue to limit Peso gains, keeping it above crucial 17.00 level.
- Banxico Governor Victoria Rodriguez suggests that upcoming election risks are factored into inflation projections, maintaining policy stability.
The Mexican Peso tumbles on Monday as the North American session reaches lunchtime, though it remains well below the year-to-date (YTD) low reached on April 19, when the USD/MXN rose toward 17.92. Positive economic data from Mexico failed to underpin the emerging market currency, while the US Dollar remains firm. The USD/MXN trades at 17.14, up by 0.42%.
Mexico’s National Statistics Agency (INEGI) revealed the economy fared better than expected in February, according to monthly and yearly figures, though higher US yields capped the USD/MXN downtrend. Meanwhile, Bank of Mexico (Banxico) Governor Victoria Rodriguez Ceja commented on Friday that Banxico already considers election risks in Mexico and the United States (US) and won’t alter the bank’s estimate that inflation would hit the institution target in Q2 2025.
Across the border, the US economic docket revealed the Chicago Fed National Activity Index in March improved, exceeding February’s upward revision, an indication of strength in the economy. That, along with Federal Reserve Chair Jerome Powell saying the lack of progress on inflation warrants keeping current policy restrictiveness, boosts the USD/MXN to stand above the psychological 17.00 figure.
Daily digest market movers: Mexican Peso treads water amid improvement on economic activity
- INEGI revealed the Economic Activity Indicator in February expanded by 1.4% MoM, up from a -0.9% contraction, and 4.4% YoY, better than the 2% in January.
- Banxico Governor Rodriguez Ceja added that services inflation is not showing a clear downward trend. She added that the Peso’s strength has, at some points, helped contain inflation since the cost of goods has not risen as quickly as before, especially because of the effect on importers.
- Last week, the International Monetary Fund (IMF) updated its economic growth projections for Mexico, reducing the 2024 growth forecast from 2.7% to 2.4% and the 2025 forecast from 1.5% to 1.4%. The IMF explains that the downward revision for 2025 is due to expected fiscal tightening by the incoming administration, which will likely reverse the current fiscal expansion, contributing to this year's growth.
- Chicago Fed National Activity Index increased to 0.15 in March from 0.09 in February. The index’s three-month moving average increased from -0.28 in February to -0.19 in March.
- Besides Powell's hawkish tilt last week, Chicago Fed President Goolsbee shifted neutral, saying that it makes sense to wait and get more clarity before easing policy, adding that the current restrictive monetary policy is appropriate.
- Earlier, Atlanta Fed President Raphael Bostic commented that the Fed might not reduce rates until the end of 2024, while the New York Fed's John Williams commented that current monetary policy is in a good place, indicating no rush to cut rates.
- Data from the Chicago Board of Trade (CBOT) suggests that traders expect the fed funds rate to finish 2024 at 4.985%, down from 4.995% last Friday.
Technical analysis: Mexican Peso slumps as USD/MXN buyers target the 200-day SMA
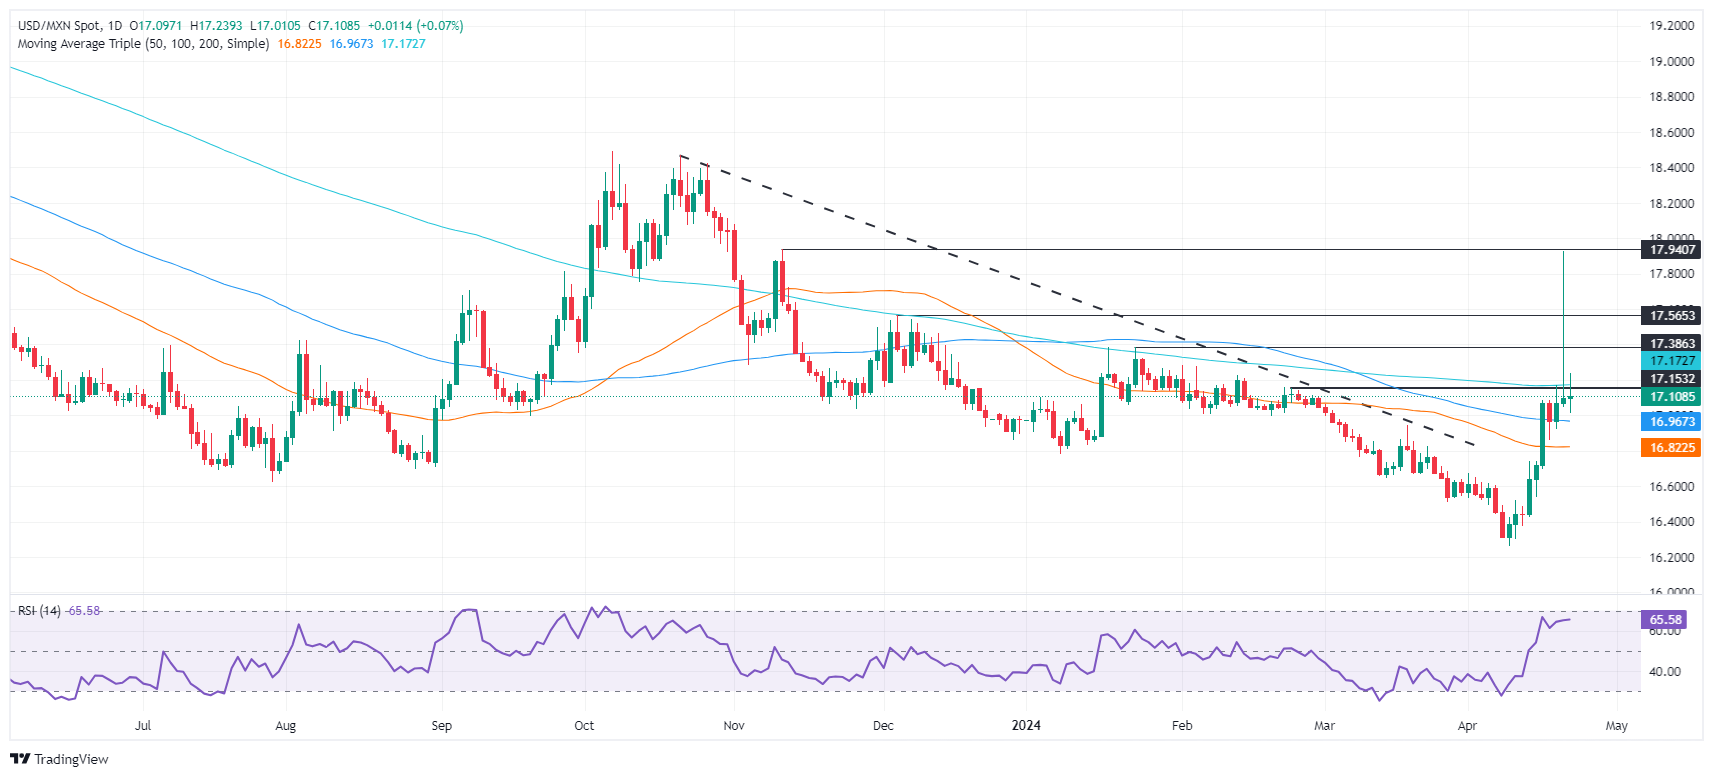
The Mexican Peso is on the defensive after depreciating to fresh five-month lows past 17.90. Key resistance levels were broken during the USD/MXN rally, with the 200-day Simple Moving Average (SMA) pierced at 17.16. Although buyers hadn’t been able to achieve a daily close above the latter, the risks for further Peso weakness remain.
In that outcome, the USD/MXN's next resistance would be January 23’s high at 17.38, followed by December 5’s 17.56. Once those levels are surpassed, look for a test of the 18.00 handle.
On the other hand, if the exotic pair drops below the 100-day SMA at 17.03, the 17.00 mark is up next. Once cleared, the next support would be the 50-day SMA at 16.81.
Mexican Peso FAQs
The Mexican Peso (MXN) is the most traded currency among its Latin American peers. Its value is broadly determined by the performance of the Mexican economy, the country’s central bank’s policy, the amount of foreign investment in the country and even the levels of remittances sent by Mexicans who live abroad, particularly in the United States. Geopolitical trends can also move MXN: for example, the process of nearshoring – or the decision by some firms to relocate manufacturing capacity and supply chains closer to their home countries – is also seen as a catalyst for the Mexican currency as the country is considered a key manufacturing hub in the American continent. Another catalyst for MXN is Oil prices as Mexico is a key exporter of the commodity.
The main objective of Mexico’s central bank, also known as Banxico, is to maintain inflation at low and stable levels (at or close to its target of 3%, the midpoint in a tolerance band of between 2% and 4%). To this end, the bank sets an appropriate level of interest rates. When inflation is too high, Banxico will attempt to tame it by raising interest rates, making it more expensive for households and businesses to borrow money, thus cooling demand and the overall economy. Higher interest rates are generally positive for the Mexican Peso (MXN) as they lead to higher yields, making the country a more attractive place for investors. On the contrary, lower interest rates tend to weaken MXN.
Macroeconomic data releases are key to assess the state of the economy and can have an impact on the Mexican Peso (MXN) valuation. A strong Mexican economy, based on high economic growth, low unemployment and high confidence is good for MXN. Not only does it attract more foreign investment but it may encourage the Bank of Mexico (Banxico) to increase interest rates, particularly if this strength comes together with elevated inflation. However, if economic data is weak, MXN is likely to depreciate.
As an emerging-market currency, the Mexican Peso (MXN) tends to strive during risk-on periods, or when investors perceive that broader market risks are low and thus are eager to engage with investments that carry a higher risk. Conversely, MXN tends to weaken at times of market turbulence or economic uncertainty as investors tend to sell higher-risk assets and flee to the more-stable safe havens.
- Euro recovery stalls below 1.0700, and remains dangerously close to the 1.0610 low.
- A combination of the Fed’s “higher for longer” with hopes of ECB easing is weighing on the Euro.
- This week the US GDP and PCE Prices Index figures might give a fresh boost to the USD.
Euro bears remain in control on Monday, as the pair wavers without a clear direction, with upside attempts capped below 1.0700. This is a previous support turned resistance and keeps the five-months low, 1.0610 at a dangerously close distance.
The economic calendar has been light today, but the unexpected deterioration of the Eurozone Consumer Confidence Index has not helped to increase demand for the Euro. On Tuesday the preliminary HCOB manufacturing and Services PMI might set the pair’s near-term direction.
A hawkish Fed and a dovish ECB are weighing on the pair
In the mid-term, the Euro is expected to remain on the defensive on the diverging monetary policy outlook of the Fed and the ECB. Recent data has reinforced the US “no-landing” view, forcing the Federal Reserve to delay and downsize its easing plans for 2024.
The ECB, on the contrary, has been giving hints of a rate cut in June. This would put the bank amid the first of the major central banks to start rolling back its tightening cycle, which will likely keep Euro buyers at bay.
In the US the first quarter GDP data, due on Thursday, and Friday’s PCE Prices Index will be key to understanding the Fed’s monetary policy plans. Another batch of strong releases is likely to boat the USD and send the Euro exploring fresh year-to-date lows sub-1.0600.
- The Euro bounced up strongly after Friday's reversal, but it has stalled below the 0.9730 - 40 area.
- Weak eurozone Consumer Confidence data has eroded confidence in the Euro.
- Failure to extend gains beyond 0.9740 might give hope for bears to retest 0.9675.
The Euro bounced up sharply after fears of an escalation of the Middle East conflict pulled the pair to test the lowest levels in the last six weeks. The pair returned to previous levels, favoured by a frail risk appetite but it remains capped below previous support at 0.9730 - 40 so far.
In the Eurozone, the unexpected deterioration of the region’s Consumer Confidence Index has failed to provide confidence in the pair. Somewhat later ECB Chair Lagarde will meet the press. She will likely confirm that the Bank is planning to start lowering rates soon, probably in June. The risk of the Euro is skewed to the downside.
On Tuesday, the Eurozone PMI data will provide further insight into the area’s growth prospects and might give some guidance to the common currency. In Switzerland, the ZEW survey, on Wednesday and, above all, SNB’s Jordan speech on Thursday will be the highlights of the week.
From a technical perspective, the failure to extend gains beyond 0.9730 leaves the pair in no man’s land. Above here, the next target would be the April 11 high, at 0.9815 and the April 5 high at 0.9850. Immediate support remains at 0.9675. Below here, 0.9620 and 0.9560 will be targeted.
- NZD/USD recaptures 0.5900 as the RBNZ is expected to pivot to rate cuts after the Fed.
- The USD Index moves higher as the strong US economic outlook allows the Fed to maintain interest rates higher.
- Fed Bostic expects that conditions for rate cuts won’t be favorable towards the end of the year.
The NZD/USD pair holds onto gains around 0.5900 in Monday’s early American session. The Kiwi asset clings to gains as ebbing risks of widening Middle East conflict has improved demand for Asian currencies.
The market sentiment turns upbeat after Iran said they are not planning any immediate retaliation to the limited attack of Israel on Isfahan. No further escalation in the conflict between Iran and Israel has dented bullions' demand.
The S&P 500 opens on a positive note, exhibiting improved risk appetite among market participants. 10-year US Treasury yields jump to 4.64% as Federal Reserve (Fed) policymakers argue that the current restrictive monetary policy framework is appropriate given strong labor demand and stubbornly higher price pressures.
The US Dollar Index (DXY) jumps to 106.30 as the strong United States economic outlook due to robust consumer spending and tight labor market conditions have made Fed policymakers comfortable with interest rates remaining at their current levels.
Last week, Atlanta Fed President Raphael Bostic said the progress in inflation declining towards the 2% target will be slower than expected, and conditions for rate cuts won’t be favorable for the central bank towards the end of the year. Bostic added he is comfortable being patient and not madly rushing for rate cuts because labor demand is robust and wage growth remains resilient.
European FX is underperforming against the US Dollar due to expectations that the Bank of England (BoE) and the European Central Bank (ECB) will pivot to rate cutes earlier than the Fed. The Reserve Bank of Australia (RBA) and Reserve Bank of New Zealand (RBNZ) are expected to reduce interest rates later than the Fed. Traders are pricing in the November meeting when the RBNZ will start lowering borrowing rates, and no rate cuts are expected by the RBA this year.
- AUD/USD trades marginally higher versus the USD on easing Middle East tensions.
- Higher commodity prices, especially amongst metals of which Australia exports are also supportive.
- Aussie CPI data for Q1 and US PCE inflation data are likely to be the main movers in the week ahead.
AUD/USD is trading higher in the 0.6430s at the start of the week as Middle East tensions ease and commodities hold their value.
The Australian Dollar (AUD) tends to decline during periods of uncertainty, unlike the US Dollar (USD) which has safe-haven qualities, so the unwinding of geopolitical risk helps AUD more than USD.
Israel’s counter-attack against Iran led to a sudden spike in the fear index on Friday and a resulting new low for April in AUD/USD at 0.6362. The Israelis fired a warning shot at a nuclear facility near Isfahan. The strike could have set off a thermonuclear explosion but in the end didn’t, and Iran has not retaliated. As a result, markets have settled back down on Monday, leading to renewed upside for the Aussie.
US Dollar stronger in most pairs
The US Dollar remains strong in most pairs despite the fall in safe-haven flows. This is due to the fact that markets expect data out of the United States this week to show continued economic growth.
“The US preliminary April PMIs (Tuesday), Q1 GDP (Thursday) and March Personal Income and Outlays report (Friday) are expected to back American economic exceptionalism,” says Brown Brothers Herriman in a note on Monday, adding, “Overall, as long as US economic activity remains solid, the cyclical USD uptrend is intact.”
The most important release will be Friday’s US Personal Consumption Expenditure (PCE) data for March, including the Federal Reserve’s (Fed) preferred gauge of inflation, the Personal Consumption Expenditure – Price Index.
If PCE inflation in the United States (US) registers a higher-than-expected rise it will boost USD/JPY, by suggesting an even longer delay before the Fed reduces interest rates. If interest rates remain higher for longer it increases demand for USD from foreign investors looking to park their capital.
Australian exceptionalism
AUD/USD is fairing better than most USD pairs partly because commodities, which Australia is a major exporter of, are holding their value better than expected.
“The ongoing squeeze in global commodity prices are helping shield the Aussie somewhat on crosses. The LME’s base metals index rose 5.3% last week taking its gains so far in April to 14%,” says Richard Franulovich, Head of FX Strategy, at Westpac.
The supportive effect may not last, however, since Iron Ore, which is Australia’s largest export, could be peaking and about to roll over.
“Iron ore markets showed some signs of peaking after the sharp ru up through April. The May SGX contract is up $1.15 from the same time Friday at $115.90 while the 62% Mysteel index is down 35c at $116.90,” says Westpac.
Chile has increased tariffs on Chinese steel and in the US President Biden is calling for higher tariffs to prevent Chinese steel from flooding the market and pricing out the competition. Australia is a major supplier of Iron Ore to China for its steel production so a trade war or higher tariffs could hit Australian exports, and the Aussie Dollar.
“In a sign that close to record Chinese steel exports is pressuring steel producers around the world, Chile slapped anti-dumping tariffs on Chinese steel products with a 33.5% import tax on steel balls and 24.9% on steel bars. The move follows US President Biden last week calling on the USTR to triple the tariff on Chinese steel,” adds Westpac.
Australia to publish Inflation data
The major release for AUD in the week ahead is Australian Consumer price Index (CPI) data for the first quarter of 2024, out on Wednesday, April 24.
Analysts expect Q1 CPI to rise 0.8%, compared to 0.6% in Q4, though base effects will see the annual pace easing to 3.4%, from 4.1%.
“Westpac’s forecast for the trimmed mean is 0.8% for the quarter, taking the annual pace from 4.2% YoY to 3.8% YoY, the slowest since March 2022, says Richard Franulovich.
The Reserve Bank of Australia (RBA) is not expected to cut rates before the Federal Reserve (Fed) which is another supportive factor for the AUD/USD. Relatively higher interest rates support currencies since they encourage more capital inflows. Whilst the RBA has set base interest rates at 4.35% against the Fed’s 5.25%-5.50%, favoring the US Dollar overall, whether or not the differential widens or closes is a key factor for AUD/USD’s valuation.
Current market expectations are for the RBA to cut interest rates in December after the Fed cuts in September/November, according to Westpac’s Franulovich. This is supporting AUD/USD since the differential is expected to narrow.
However, Wednesday’s Aussie CPI data could be key in this regard since, “A softer than consensus Q1 CPI could galvanize the potential for RBA rate cuts before the Fed,” says the Westpac analyst, which would translate into further downside for the AUD/USD.
- Silver price witnesses bloodshed drops vertically to $27.30 as safe-haven demand eases.
- The demand for safe-haven assets weakens as fears of widening Middle East conflict ease.
- The US Dollar and bond yields rise as investors see the Fed keeping interest rates higher for longer.
Silver price (XAG/USD) faces an intense sell-off and drops to $27.30 in Monday’s early American session. The white metal falls on the backfoot as investors expect that conflicts in the Middle East region will not widen further. Fears from Middle East tensions ebb after Iran commented that currently, they are not planning any immediate retaliation to Israel’s limited attack on Isfahan.
Receding risks of further escalation in conflicts between Israel and Iran has weakened demand for safe-haven assets. This has improved investors’ appetite for risky assets. The S&P 500 opens on a bullish note, suggesting a cheerful market mood. 10-year US Treasury yields rise to 4.65% as investors expect that the Federal Reserve (Fed) would be a laggard in unwinding the restrictive policy framework compared with other central banks from developed nations.
The CME FedWatch tool shows traders pricing in the September policy meeting, when the central bank could start reducing interest rates. Expectations for Fed rate cuts have shifted to September from June as policymakers expect that progress in inflation declining to the 2% target has stalled.
On Friday, Chicago Fed Bank President Austan Goolsbee said, “Given the strength of the labor market and progress on easing inflation seen over a longer arc, I believe the Fed's current restrictive monetary policy is appropriate," Reuters reported.
This has also improved the appeal of the US Dollar. The US Dollar Index (DXY) jumps higher to 106.30 as the Fed maintains that interest rates need to remain at their current levels for a longer period.
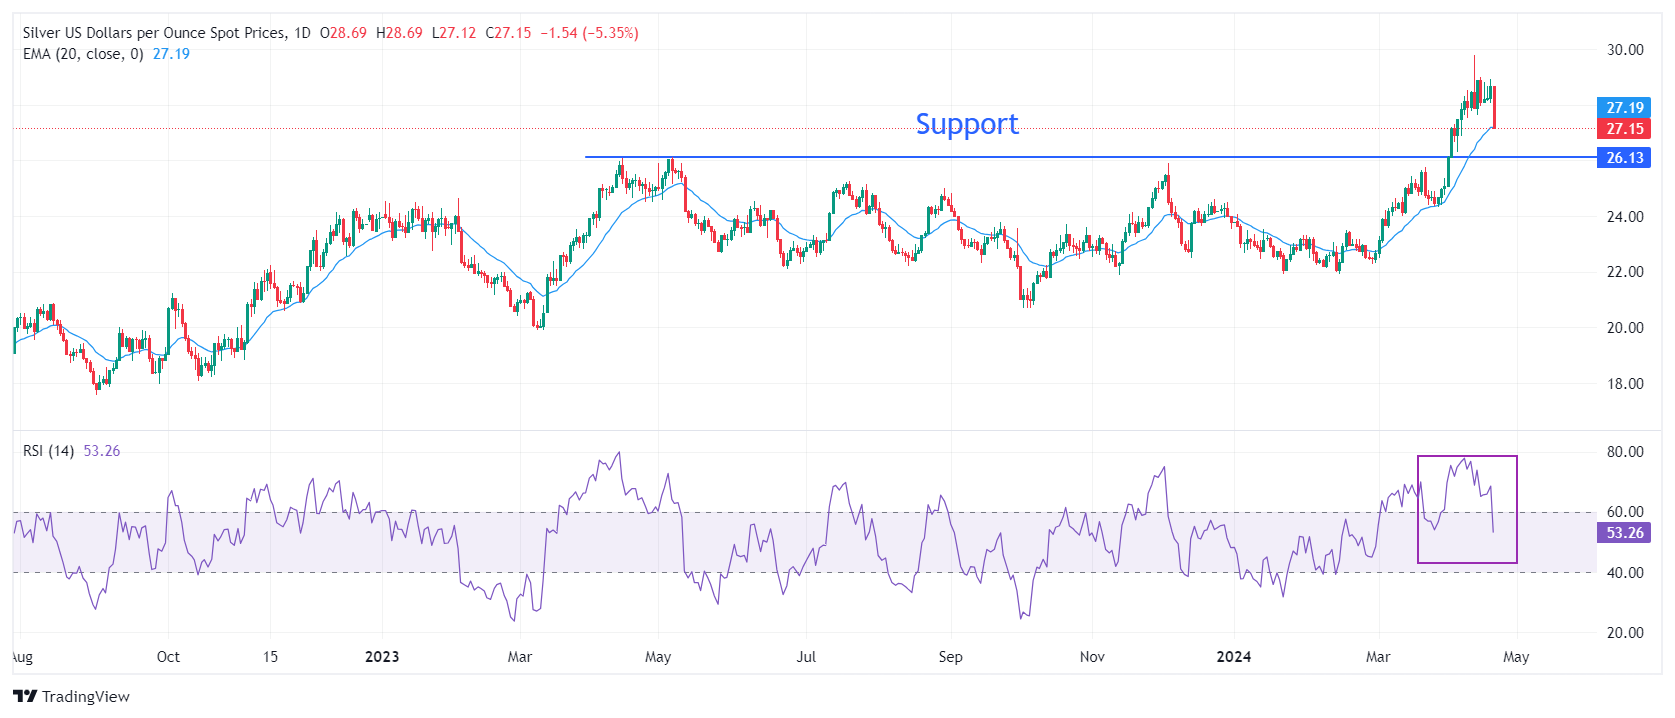
Silver technical analysis
Silver price falls sharply to near the 20-day Exponential Moving Average (EMA), which trades around $27.20 after failing extend upside above three-year high of $29.80. The horizontal support plotted from April 14 high at $26.09 will be a major cushion for the Silver price.
The 14-period Relative Strength Index (RSI) slips into the 40.00-60.00 range, suggesting that momentum is not bullish anymore. However, the bullish bias is intact.
Silver daily chart
- USD/CHF has risen over 8.0% since the start of 2024.
- It has broken above some very important levels.
- The question now is, has USD/CHF changed trend?
USD/CHF was in a long-term downtrend until the pair found a floor at the end of 2023.
Since then USD/CHF has made steady progress higher, gaining over 8.0% in the first three months of 2024.
An interesting question now is whether from a technical point of view, the long-term trend has changed from bearish to bullish?
This is important because, as the old adage goes “the trend is your friend until the bend at the end.”
In short, has USD/CHF met its “bend” and made enough progress to reverse its downtrend?
USD/CHF Weekly Chart
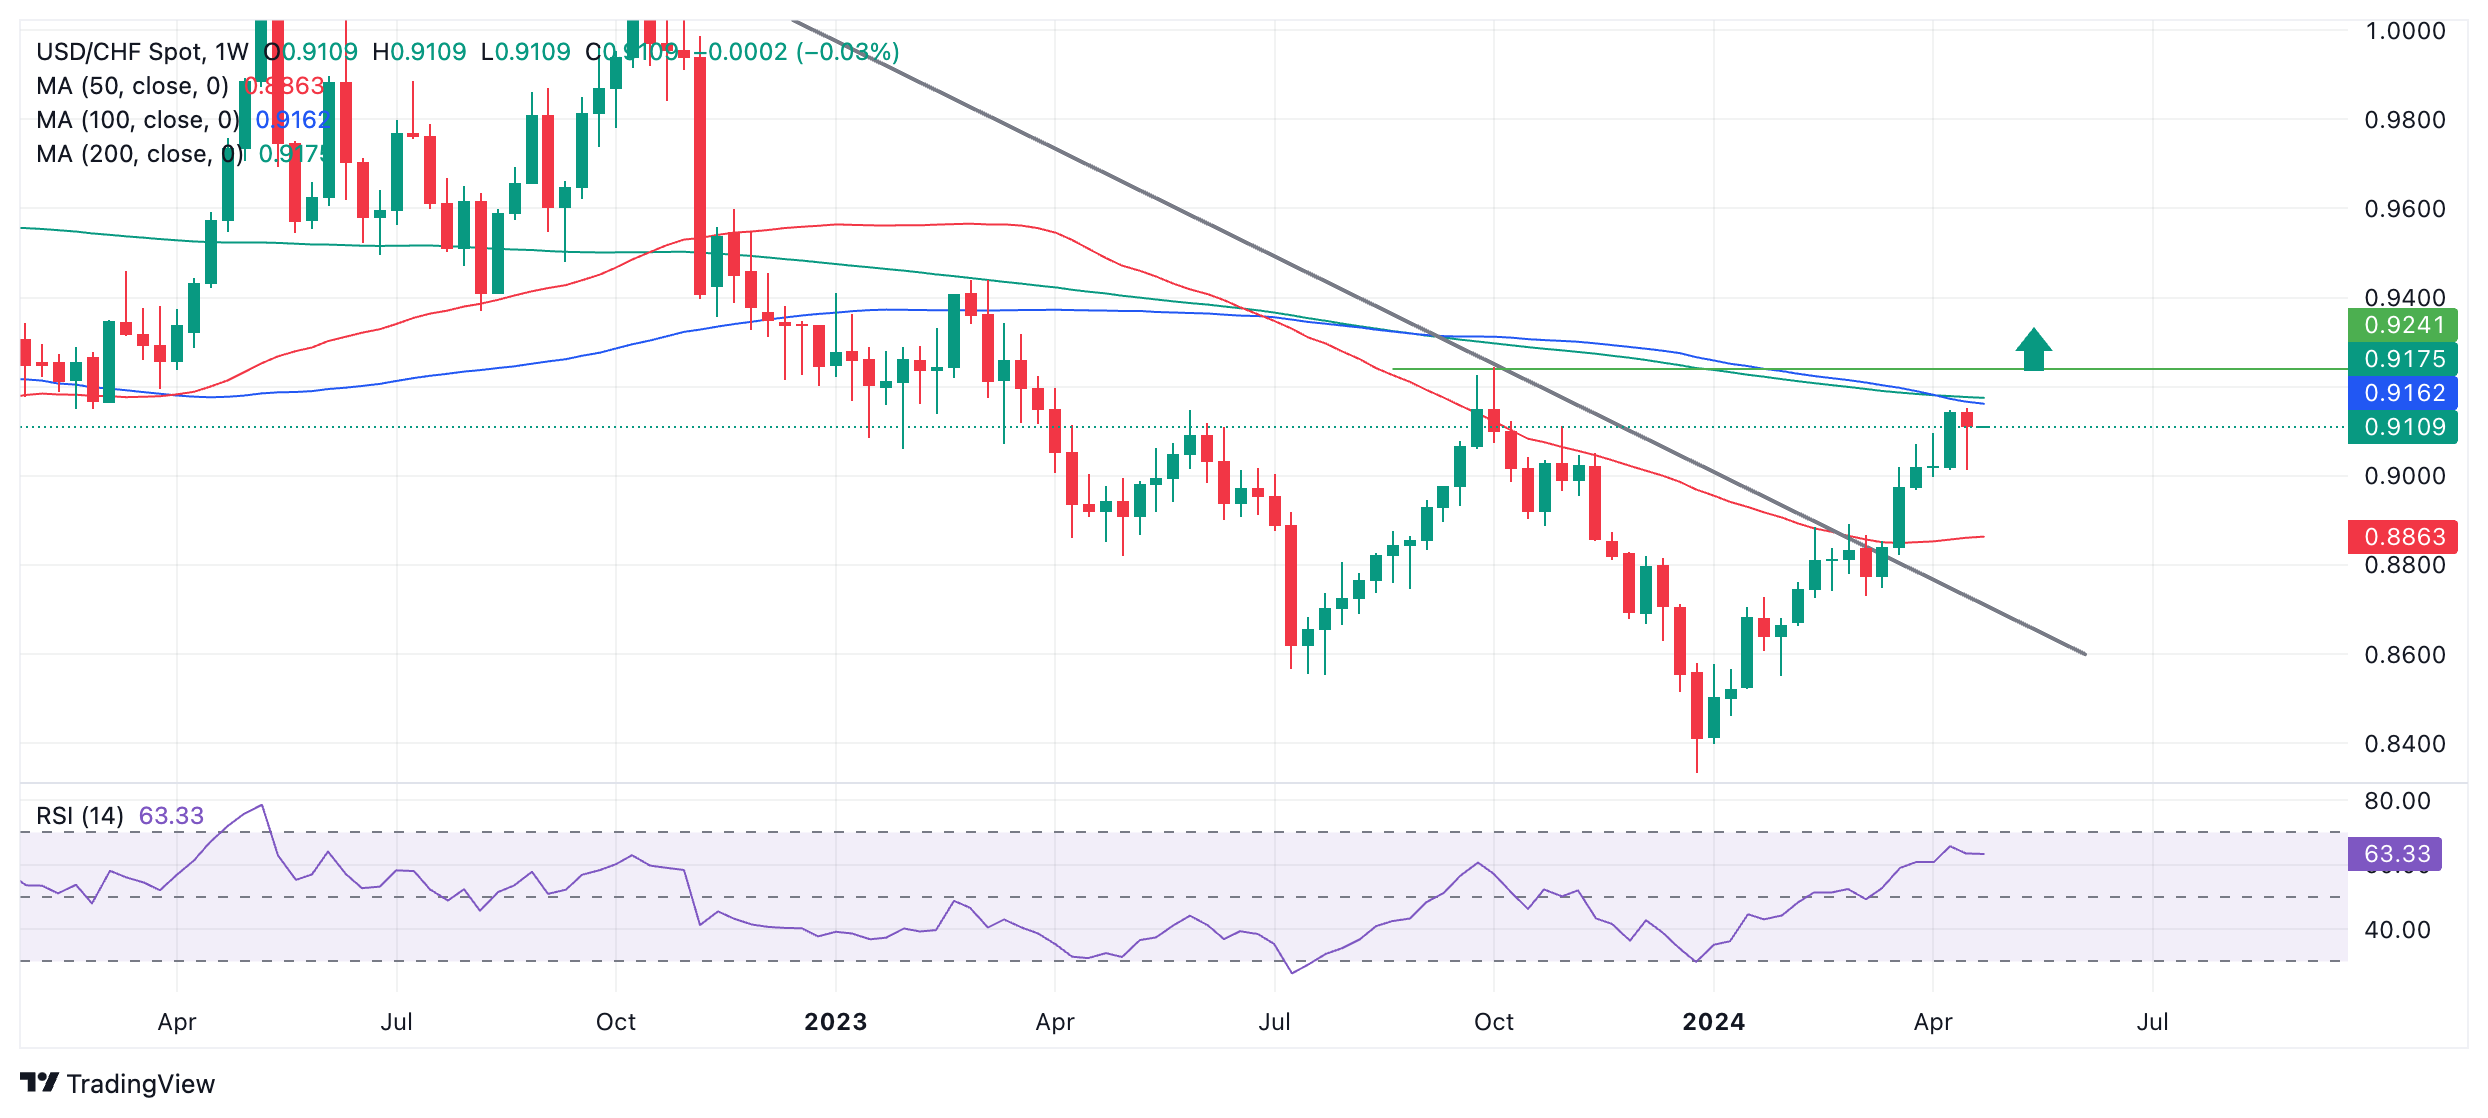
In February USD/CHF rose above the last major lower high of the prior downtrend which formed in December 2023, at 0.8821. Technical analysts consider this as a key level. If price breaks above it, it increases the chances the asset has undergone a trend reversal.
In March USD/CHF broke above the red 50-week Simple Moving Average (SMA) – another sign the long-term downtrend might be ending. At the same time it breached a long-term down trendline, providing yet more evidence of a reversal.
During its rise USD/CHF has formed two sets of peaks and troughs (two “higher highs” and two “higher lows”). This further suggests a heightened probability the pair might be reversing trend. If it had only formed one peak and trough it might still be said to be correcting rather than reversing. This is because it could still be a common ABC three-wave correction. Because it has formed two, however, this cannot now be the case.
Momentum has been reasonably solid during the move higher, though not quite as strong as the bearish momentum on the corresponding way down – this unfortunately is evidence the move may yet still be only a pullback within a broader downtrend. The difference in momentum is mild, however, reducing the risk that is the case.
USD/CHF has now reached a formidable band of resistance from the 100-week and 200-week SMAs coiling just above the current highs in the 0.9100s. These remain a tough obstacle for bears to overcome.
To really seal the deal on a reversal of the long-term downtrend in USD/CHF arguably must decisively break above the two major MAs currently bearing down on price.
A decisive break is one characterized by the formation of a long green bullish candle that pierces through the MAs and closes near its high or three consecutive bullish candles that breach the level.
Another key level is the October 2023 high at 0.9244 and this should arguably also be breached for there to be enough evidence to support the view USD/CHF had entered an uptrend.
Last week USD/CHF also formed a bearish Hanging Man Japanese candlestick pattern which if followed by a bearish candle this week would signal a potential short-term reversal lower. This would keep bearish hopes alive and delay further the moment when it could be said with any degree of confidence that USD/CHF was in a long-term uptrend.
- USD/JPY inches towards April high as Japanese Yen loses safe-haven appeal amidst easing Middle East tensions.
- Geopolitical risks have not gone away completely, new Omicron variant an outside threat.
- Friday is likely to be a big day for USD/JPY with the BoJ meeting and US PCE inflation data.
The USD/JPY inches back up towards the April highs at 154.79 on Monday after a de-escalation in Middle East tensions reduces safe-haven flows to the Japanese Yen (JPY). This affects the JPY more than the US Dollar (USD), despite both holding safe-haven status.
The conflict between Israel and Iran has not escalated in the way markets feared. After Israel’s one-off attack on a military base outside Isfahan on Friday, Iran has not counter-attacked. As a major safe-haven, the JPY has seen demand fall and continues its long-term trend of depreciating against USD.
USD/JPY at risk from risk
Although hostilities in the Middle East have temporarily subsided, the threat of outbreaks in the future are an ever present risk.
Geopolitical risks have not completely dissipated and a division appears to be opening up in the world between the West and what Gideon Rachman, Chief Foreign Affairs Commentator for the Financial Times, calls an “axis of adversaries”. These include Russia, Iran, North Korea and China.
Rachman points out that the military base outside Isfahan targeted by the Israelis in Friday’s attack, is in fact, a nuclear enrichment site which utilizes Chinese-supplied reactor technology.
A further outbreak of hostilities or general ratcheting up of geopolitical risk factors is likely to see safe-havens like the JPY rise, with bearish implications for USD/JPY.
War is not the only potential source of geopolitical risk that could pressure USD/JPY. Reports of a fresh strain of the Omicron variant of the Covid-19 virus have also destabilized markets at the start of the new week.
“While the WHO is urging caution, it noted that symptoms linked to the new strain so far have been mild. Because it will take some time to determine the likely impact on the global economy, we believe risk aversion will continue this week,” say analysts at private investment bank Brown Brothers Harriman in a note on Monday.
A handful of countries have already introduced minor social distancing measures, but if the strain begins to spread and pose a more serious health risk, this could present a fresh risk factor for investors, leading to a steady stream of funds into safe-havens, favoring the Japanese Yen above all.
USD/JPY traders could come out on Friday
Friday April 26 stands out as a big day for USD/JPY as it is then that the Bank of Japan (BoJ) will hold its April policy meeting and the US will publish Personal Consumption Expenditure (PCE) data for March, including the Federal Reserve’s (Fed) preferred gauge of inflation, the Personal Consumption Expenditure – Price Index.
If PCE inflation in the United States (US) registers a higher-than-expected rise it will boost USD/JPY, by suggesting an even longer delay before the Fed reduces interest rates. If interest rates remain higher for longer it increases demand for USD from foreign investors looking to park their capital.
Likewise if the BoJ increases interest rates at its meeting or drops clues it intends to in the near future, the JPY will appreciate (pushing down USD/JPY).
BoJ unlikely to raise interest rates, chance of policy tweak
Amongst institutional analysts the consensus expectation is that the BoJ will not raise interest rates until October.
“We expect the Bank of Japan to keep its short-term rate target unchanged (range 0-0.1%), after hiking the policy rate for the first time in 17 years in March. Going forward, we expect the BoJ to keep a modest, gradual hiking path,” said ABN Amro.
Deutsche Bank sees a risk the BoJ will “remove its JGB purchasing guidelines from its statement or revise them to make its purchasing operations more flexible,” – a move which could support the Yen.
Despite seeing another hike as unlikely, many Japanese officals think the US Dollar’s recent ascent has gone too far and something needs to be done to support the Yen.
“Ongoing yen weakness (partly driven by the pricing out of Fed rate cuts) means that there is an increasing probability that the BoJ may consider to come with the next rate hike earlier than the current consensus expectation of October 2024 (as indicated by market pricing),” says ABN Amro, adding that against this backdrop, Governor Ueda may try to verbally intervene by dropping clues about future tightening.
Last week, the finance ministers of both Japan and South Korea acknowledged “serious concerns about the recent sharp depreciation of the Japanese Yen and the Korean Won.” The Bank of Indonesia went further and intervened to stabilize its slumping currency, according to analysts at Brown Brothers Harriman (BBH).
USD impregnability? “It’s hard to find reasons to bet against..USD”
The US Dollar is currently basking in the glory of an almost bullet-proof US economy. Apart from PCE inflation data on Friday, proof of further US economic success could come in other macro data out on Tuesday and Wednesday.
“Overall, as long as US economic activity remains solid, the cyclical USD uptrend is intact. The US preliminary April PIs (Tuesday), Q1 GDP (Thursday) and March Personal Income and Outlays report (Friday) are expected to back American economic exceptionalism,” says BBH in a note on Monday.
USD/JPY bears could be facing an uphill struggle given the US Dollar’s perceived impregnability.
“It is hard to find any reasons to bet against the Dollar,” said Michael Pfister, FX Analyst at Commerzbank in an interview with Bloomberg News. “We have seen an appreciation in the Greenback over the last two weeks on the back of an inflation surprise. On top of that we have a strong growth advantage and a very hawkish Fed,” added the analyst.
On Friday the trend of Federal Reserve members becoming more cagey about when they might start cutting interest rates gained further momentum. Chicago Fed President Austan Goolsbee hinted at a longer timeline for interest rate cuts as progress on inflation had “stalled”, adding inflation has significantly dropped from its pandemic-era peak of 9.1%, but remains stubbornly above the Fed’s target. Meanwhile, Atlanta Fed President Raphael Bostic noted that the US central bank wouldn’t cut rates until the end of the year, according to Lallalit Srijandorn, an Editor at FXStreet.
- EUR/GBP moves higher as soft inflation outlook uplifts BoE early rate cut prospects.
- BoE Ramsden sees inflation remaining lower than BoE’s latest forecasts.
- ECB Villeroy is comfortable with the central bank pivoting to rate cuts from June.
The EUR/GBP pair rises to 0.8630 in Monday’s European session. The cross moves higher as investors hope that Bank of England (BoE) Deputy Governor Dave Ramsden will join policymaker Swati Dhingra and vote for a rate cut in the upcoming monetary policy meeting on May 9.
On Friday, Dave Ramsden commented that risks to United Kingdom inflation remaining persistent have receded and he expects price pressures could remain below BoE’s latest inflation forecasts. Ramsden added that he sees inflation remaining around BoE’s 2% target in the next three years and expects it won’t rise again as expected for later this year.
Soft inflation guidance from BoE Ramsden has boosted expectations for early rate cuts. Traders have priced out bets leaned towards the BoE pivoting to rate cuts in November and are expecting them now from August. The impact is visible in the Pound Sterling’s performance against the Euro.
Going forward, investors will focus on the UK S&P Global/CIPS preliminary PMI data for April, which will be published on Tuesday. The Services PMI is estimated to have declined slightly to 53.0 from 53.1. The Manufacturing PMI is expected to expand steadily by 50.3.
Meanwhile, the Euro will remain on the tenterhooks as investors see a move by the European Central Bank (ECB) to rate cuts as imminent. The ECB is projected to reduce interest rates three times this year as Eurozone inflation has softened significantly and the economic outlook is weak.
The expectations for ECB reducing rate cuts from June remains firm as French central bank head and ECB policymaker Villeroy de Galhau said on Thursday that they could cut rates in the next meeting, barring a major surprise. Villeroy emphasized returning to structural transformation as inflation is receding.
- Gold price drops as investors see no immediate escalation in Israel-Iran tensions.
- Fizzling Fed rate cut prospects combined with easing geopolitical fears weigh on Gold.
- Fed’s Goolsbee said progress in taming inflation has stalled.
Gold price (XAU/USD) dips vertically after failing to recapture the crucial resistance of $2,400 in Monday’s European session, driven by less safe-haven demand as Middle East tensions ease.
No further escalation in tensions between Iran and Israel has provided some relief to dismal market sentiment. Also, markets are increasingly pricing out the possibility that the Federal Reserve (Fed) will lower interest rates in the June and July meetings, further weighing on Gold.
10-year US Treasury yields rise to 4.66%. Yields on interest-bearish assets such as US bonds rise on firm prospects that the Fed could be a laggard in pivoting to rate cuts compared with other central banks from developed nations. Higher bond yields, in turn, weigh on non-yielding assets such as Gold as they become a less-attractive alternative to invest in.
This week, the United States core Personal Consumption Expenditure Price Index (PCE) data for March will likely move bond yields and Gold prices. As the Fed’s preferred inflation gauge, PCE data could shift expectations of when the US central bank will start lowering interest rates. According to the CME FedWatch tool, markets currently expect the Fed to make the move at its September meeting.
Meanwhile, the US Dollar Index (DXY), which tracks the US Dollar’s value against six major currencies, consolidates in a tight range around 106.00. Gold is a dollar-denominated asset, so a firm US Dollar tends to keep its price under control.
Going forward, investors will focus on the preliminary Q1 Gross Domestic Product (GDP) data, which will be published on Thursday. The US economy is estimated to have expanded by 2.5%. Strong growth exhibits robust consumer spending and higher production, which translates into higher price pressures. Higher GDP numbers would allow the Fed to keep interest rates at the current high levels, which will eventually improve the US Dollar’s demand.
Daily digest market movers: Gold price drops sharply as US yields advance
- Gold price tumbles to $2,360 after refreshing all-time highs near $2,430 as safe-haven demand diminishes. Investors are less worried about further escalation in Middle East tensions. On Friday, Tehran’s air defence said it destroyed a limited drone attack by Israel and confirmed no harm to nuclear facilities in the central region of Isfahan. Iran didn’t announce any plan for an immediate retaliation, so investors see no major escalation in the short term even as tensions between both parties persist.
- The precious metal comes under pressure after five weeks of gains as risk sentiment improves. The appeal for Gold has remained buoyant despite fading expectations that the Fed will reduce interest rates in June. Prospects for rate cuts in the June and July meetings have waned after the inflation report for March turned out hotter than expected.
- The recent inflation data have dented Fed policymakers' confidence in inflation declining to the 2% target, with many of them saying they want to maintain interest rates higher for a longer period. On Friday, Chicago Fed Bank President Austan Goolsbee said: “Given the strength of the labor market and progress on easing inflation seen over a longer arc, I believe the Fed's current restrictive monetary policy is appropriate," Reuters reported.
- Goolsbee said that hotter-than-expected inflation data for the first three months of the year "can't be dismissed.” He advised the Fed will need to determine if continued strong growth in the economy and job market is a sign of overheating.
Technical Analysis: Gold price fails to reclaim $2,400

Gold price plunges to near $2,360 after retreating from $2,418. A mean-reversion move is anticipated in the yellow metal, which will drag it to the 20-day Exponential Moving Average (EMA) at around $2,315. Usually, the asset reverses to the 20-day EMA after a sharp rally. However, the move is generally considered a correction, not a bearish reversal.
On the downside, April 5 low near $2,268 and March 21 high at $2,223 will be major support areas.
The 14-period Relative Strength Index (RSI) cools down to 64.40 after turning extremely overbought. The overall outlook for the asset remains strong if the RSI shifts into the bullish range of 60.00-80.00.
Gold FAQs
Gold has played a key role in human’s history as it has been widely used as a store of value and medium of exchange. Currently, apart from its shine and usage for jewelry, the precious metal is widely seen as a safe-haven asset, meaning that it is considered a good investment during turbulent times. Gold is also widely seen as a hedge against inflation and against depreciating currencies as it doesn’t rely on any specific issuer or government.
Central banks are the biggest Gold holders. In their aim to support their currencies in turbulent times, central banks tend to diversify their reserves and buy Gold to improve the perceived strength of the economy and the currency. High Gold reserves can be a source of trust for a country’s solvency. Central banks added 1,136 tonnes of Gold worth around $70 billion to their reserves in 2022, according to data from the World Gold Council. This is the highest yearly purchase since records began. Central banks from emerging economies such as China, India and Turkey are quickly increasing their Gold reserves.
Gold has an inverse correlation with the US Dollar and US Treasuries, which are both major reserve and safe-haven assets. When the Dollar depreciates, Gold tends to rise, enabling investors and central banks to diversify their assets in turbulent times. Gold is also inversely correlated with risk assets. A rally in the stock market tends to weaken Gold price, while sell-offs in riskier markets tend to favor the precious metal.
The price can move due to a wide range of factors. Geopolitical instability or fears of a deep recession can quickly make Gold price escalate due to its safe-haven status. As a yield-less asset, Gold tends to rise with lower interest rates, while higher cost of money usually weighs down on the yellow metal. Still, most moves depend on how the US Dollar (USD) behaves as the asset is priced in dollars (XAU/USD). A strong Dollar tends to keep the price of Gold controlled, whereas a weaker Dollar is likely to push Gold prices up.
- The US Dollar eases on Monday as markets embrace a very quiet weekend on the geopolitical front.
- Tensions in the Middle East ease substantially, triggering a rally in equities.
- The US Dollar Index holds onto recent gains around 106.00, but downside pressure is mounting.
The US Dollar trades broadly steady on Monday, with markets having a sigh of relief after the weekend remained fairly calm as there was no further retaliation from Iran towards Israel. The de-escalation provides fuel to risk assets, particularly equities, to rally higher this Monday. With the risk-on tone, the Greenback might have some further room to ease.
On the economic data front, Monday’s calendar is very thin ahead of the US Gross Domestic Product (GDP) release on Thursday and the US Personal Consumption Expenditures Price Index (PCE) numbers on Friday. The latter is the most important for this week as the PCE is the Federal Reserve’s preferred inflation gauge and another red hot print might lead markets to price in a rate hike before considering any cuts.
Daily digest market movers: Enjoy it for now
- The Chicago Fed National Activity Index will be released at 12:30 GMT. The previous reading, for February, was at 0.05.
- The US Treasury is auctioning a 3-month and a 6-month bill at 15:30 GMT.
- In the commodity space, both Oil and Gas futures are falling as the tensions in the Middle East ease.
- Equity markets are having a sigh of relief. Asian equities are overall trading up by 1% in both Japan and China. European equities are in line with US equity futures, up near 0.5% on the day.
- According to the CME Group’s FedWatch Tool, expectations are further cementing for a no-change to the Fed’s monetary policy in June, with a small 17% chance for a rate cut.
- The benchmark 10-year US Treasury Note trades around 4.64%, recovering further after its decline on Friday to 4.50%.
US Dollar Index Technical Analysis: Rate differential remains main driver
The US Dollar Index (DXY) is facing a little bit of selling pressure at the start of this week. More and more traders are trying to sell the peak in the DXY, with the idea that the Greenback could fall back to lower levels seen in the first three months of this year near 104.00-105.00. With the PCE inflation numbers right at the end of this week, some easing might be taking place until PCE could trigger a turnaround if there is an upbeat surprise.
On the upside, the fresh Tuesday’s high from last week at 106.52 is the level to beat. Further up and above the 107.00 round level, the DXY Index could meet resistance at 107.35, the October 3 high.
On the downside, the first important level is 105.88, a pivotal level (since March 2023 with the peaks from November 2023 and recent support as drivers) . Further down, 105.12 and 104.60 should also act as support ahead of the region with the 55-day and the 200-day Simple Moving Averages (SMAs) at 104.17 and 103.91, respectively.
US Dollar FAQs
The US Dollar (USD) is the official currency of the United States of America, and the ‘de facto’ currency of a significant number of other countries where it is found in circulation alongside local notes. It is the most heavily traded currency in the world, accounting for over 88% of all global foreign exchange turnover, or an average of $6.6 trillion in transactions per day, according to data from 2022. Following the second world war, the USD took over from the British Pound as the world’s reserve currency. For most of its history, the US Dollar was backed by Gold, until the Bretton Woods Agreement in 1971 when the Gold Standard went away.
The most important single factor impacting on the value of the US Dollar is monetary policy, which is shaped by the Federal Reserve (Fed). The Fed has two mandates: to achieve price stability (control inflation) and foster full employment. Its primary tool to achieve these two goals is by adjusting interest rates. When prices are rising too quickly and inflation is above the Fed’s 2% target, the Fed will raise rates, which helps the USD value. When inflation falls below 2% or the Unemployment Rate is too high, the Fed may lower interest rates, which weighs on the Greenback.
In extreme situations, the Federal Reserve can also print more Dollars and enact quantitative easing (QE). QE is the process by which the Fed substantially increases the flow of credit in a stuck financial system. It is a non-standard policy measure used when credit has dried up because banks will not lend to each other (out of the fear of counterparty default). It is a last resort when simply lowering interest rates is unlikely to achieve the necessary result. It was the Fed’s weapon of choice to combat the credit crunch that occurred during the Great Financial Crisis in 2008. It involves the Fed printing more Dollars and using them to buy US government bonds predominantly from financial institutions. QE usually leads to a weaker US Dollar.
Quantitative tightening (QT) is the reverse process whereby the Federal Reserve stops buying bonds from financial institutions and does not reinvest the principal from the bonds it holds maturing in new purchases. It is usually positive for the US Dollar.
- Natural Gas price retreats on Monday on Iran’s communication.
- Iran'S foreign ministry said nuclear weapons have no place in Iran’s nuclear doctrine.
- The US Dollar Index eases with markets favoring risk assets over safe havens and cash.
Natural Gas (XNG/USD) retreats from its last week’s peaks near $2.03 after tensions were nearly spill over between Israel and Iran in a direct confrontation. However, the retaliation from Israel on Iran was mild, which already offered markets a sigh of relief on Friday when US equities almost erased an earlier 2% decline before the US opening bell. With new easing communication from Iran on Monday, investors are heading back into equities with the idea that any further escalation will not be at hand any time soon.
Meanwhile, the US Dollar Index (DXY) is weakening on outflows out of safe havens into risk assets. Apart from geopolitics, important US macro data may influence the Greenback’s valuation, as the US Gross Domestic Product (GDP) and the US Personal Consumption Expenditures (PCE) Price Index are set to be released this week. After the hot inflation print from two weeks ago, another higher-than-expected PCE figure could trigger expectations for a rate hike, rather than an interest rate cut as the first move from the US Federal Reserve (Fed).
Natural Gas is trading at $1.98 per MMBtu at the time of writing.
Natural Gas news and market movers: Tail risk deflates
- European Gas prices are seeing a broader correction than US Gas prices, down over 3%. as tail risks deflating quickly in the Middle East and European Gas storages still reasonably well-stocked.
- Interfax reports that Swedish Foreign Minister Tobias Billström said that the European Union plans to consider a ban on Russian Liquefied Natural Gas (LNG) imports as part of the 14th sanctions package.
- BloombergNEF calculated that Europe should have its Gas storage back to 100% full by October. The report was released on Bloomberg onMonday.
- Good news comes from the US Freeport LNG plant, where operations are restarting after being offline for nearly two weeks.
Natural Gas Technical Analysis: Expect risk to linger while easing
Natural Gas is trading in a consolidation pattern here for the coming weeks. Certainly, there is room for some easing with the summer season ahead and less demand for Gas. Meanwhile, the recent uptrend since February keeps holding and could spark up at any moment if tensions in the Middle East flare up. While Europe is restocking for the next heating season, no big sell-off is expected in Gas prices with the supportive demand throughout the summer period from Europe.
On the upside, the blue line at $2.11, the 2023 low, is the level to watch. Next, the 100-day Simple Moving Average (SMA) at $2.12 becomes the main resistance level.
On the downside, the 55-day SMA around $1.88 should be a safety net. Below it, the green ascending trend line near $1.87 should support the ongoing rally since mid-February. If that level breaks, a dive to $1.60 and $1.53 would not be impossible.
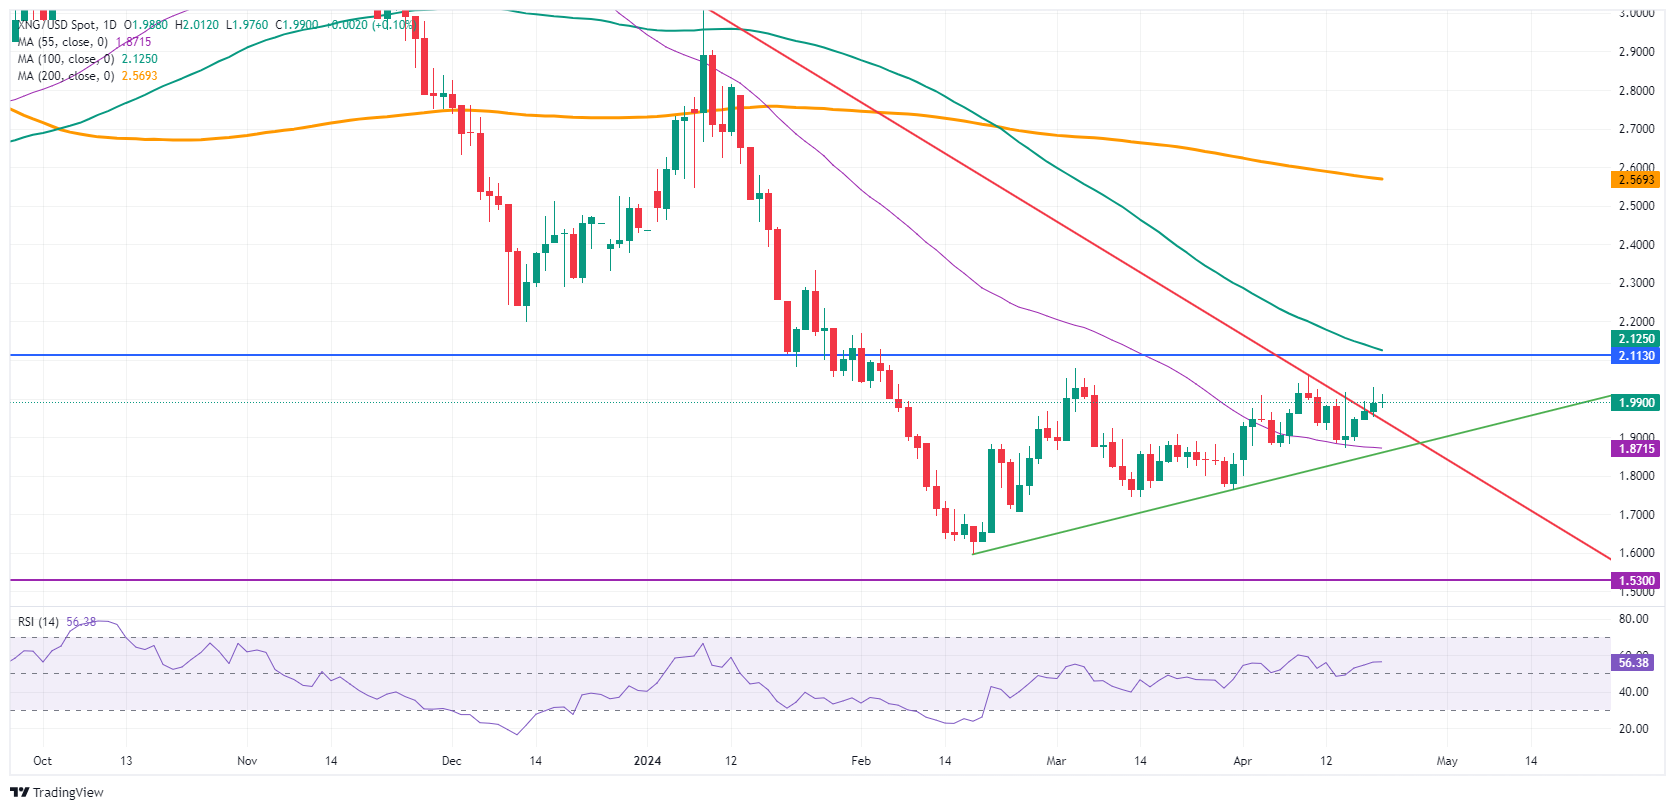
Natural Gas: Daily Chart
Natural Gas FAQs
Supply and demand dynamics are a key factor influencing Natural Gas prices, and are themselves influenced by global economic growth, industrial activity, population growth, production levels, and inventories. The weather impacts Natural Gas prices because more Gas is used during cold winters and hot summers for heating and cooling. Competition from other energy sources impacts prices as consumers may switch to cheaper sources. Geopolitical events are factors as exemplified by the war in Ukraine. Government policies relating to extraction, transportation, and environmental issues also impact prices.
The main economic release influencing Natural Gas prices is the weekly inventory bulletin from the Energy Information Administration (EIA), a US government agency that produces US gas market data. The EIA Gas bulletin usually comes out on Thursday at 14:30 GMT, a day after the EIA publishes its weekly Oil bulletin. Economic data from large consumers of Natural Gas can impact supply and demand, the largest of which include China, Germany and Japan. Natural Gas is primarily priced and traded in US Dollars, thus economic releases impacting the US Dollar are also factors.
The US Dollar is the world’s reserve currency and most commodities, including Natural Gas are priced and traded on international markets in US Dollars. As such, the value of the US Dollar is a factor in the price of Natural Gas, because if the Dollar strengthens it means less Dollars are required to buy the same volume of Gas (the price falls), and vice versa if USD strengthens.
- The Mexican Peso recovers as tensions in the Middle East abate temporarily.
- Several sources of geopolitical risk, however, continue to present threats to the Peso.
- A new Omicron variant of the Covid virus is spreading, though symptoms appear mild so far.
The Mexican Peso (MXN), which is especially vulnerable to geopolitical risk, is edging higher in most pairs on Monday morning as relief ripples through markets due to a temporary easing of tensions in the Middle East.
The Israel-Iran conflict has not escalated in the way markets feared. The one-off Israeli attack on a military base outside Isfahan on Friday has not led to a counter-punch from Iran as yet, and as a result, the Mexican Peso has recovered.
From a peak of 17.92 on Friday – when fears of escalation were at their most extreme – the USD/MXN has fallen to 17.02 on Monday.
On the data front, the week ahead sees the release of Mexican Economic Activity on Monday, 1st half-month inflation and core inflation on Wednesday, and Balance of Trade as well as Jobless Rate data on Friday. These are unlikely to move the dial much on MXN unless they show significant deviations from past results or estimates.
Mexican Peso is still at risk
The Mexican Peso’s sharp decline at the end of last week was triggered by geopolitical risk, which seems to be the currency’s most significant driver at the moment.
Although hostilities in the Middle East have temporarily subsided, the threat of outbreaks in the future continues to present a risk to the currency.
According to the Chief Foreign Affairs Commentator for the Financial Times, Gideon Rachman, Russia, Iran, North Korea and China now constitute an “axis of adversaries” who are working together against the West. Rachman points out that the military base outside Isfahan targeted by the Israelis is, in fact, a nuclear enrichment site which utilizes Chinese-supplied reactor technology.
Yet the Middle East is not the only potential source of geopolitical risk. Reports of a fresh strain of the Omicron variant of the Covid-19 virus have also destabilized markets at the start of the new week.
“While the WHO is urging caution, it noted that symptoms linked to the new strain so far have been mild. Because it will take some time to determine the likely impact on the global economy, we believe risk aversion will continue this week,” say analysts at private investment bank Brown Brothers Harriman in a note on Monday.
A handful of countries have already introduced minor social distancing measures, but if the strain begins to spread and pose a more serious health risk, this could present a fresh risk factor for investors, leading to a steady stream of funds into safe-havens and out of riskier assets like the Mexican Peso.
Technical Analysis: USD/MXN settles back down
USD/MXN – the value of one US Dollar in Mexican Pesos – has pulled back down after briefly breaking above a major trendline for the long-term downtrend.
The breakout higher was not enough to reverse the long-term downtrend but it did change the picture on the short-term and intermediate-term horizons, which now could be said to have reversed their bearish tenors, favoring long positions over shorts.
USD/MXN 4-hour Chart
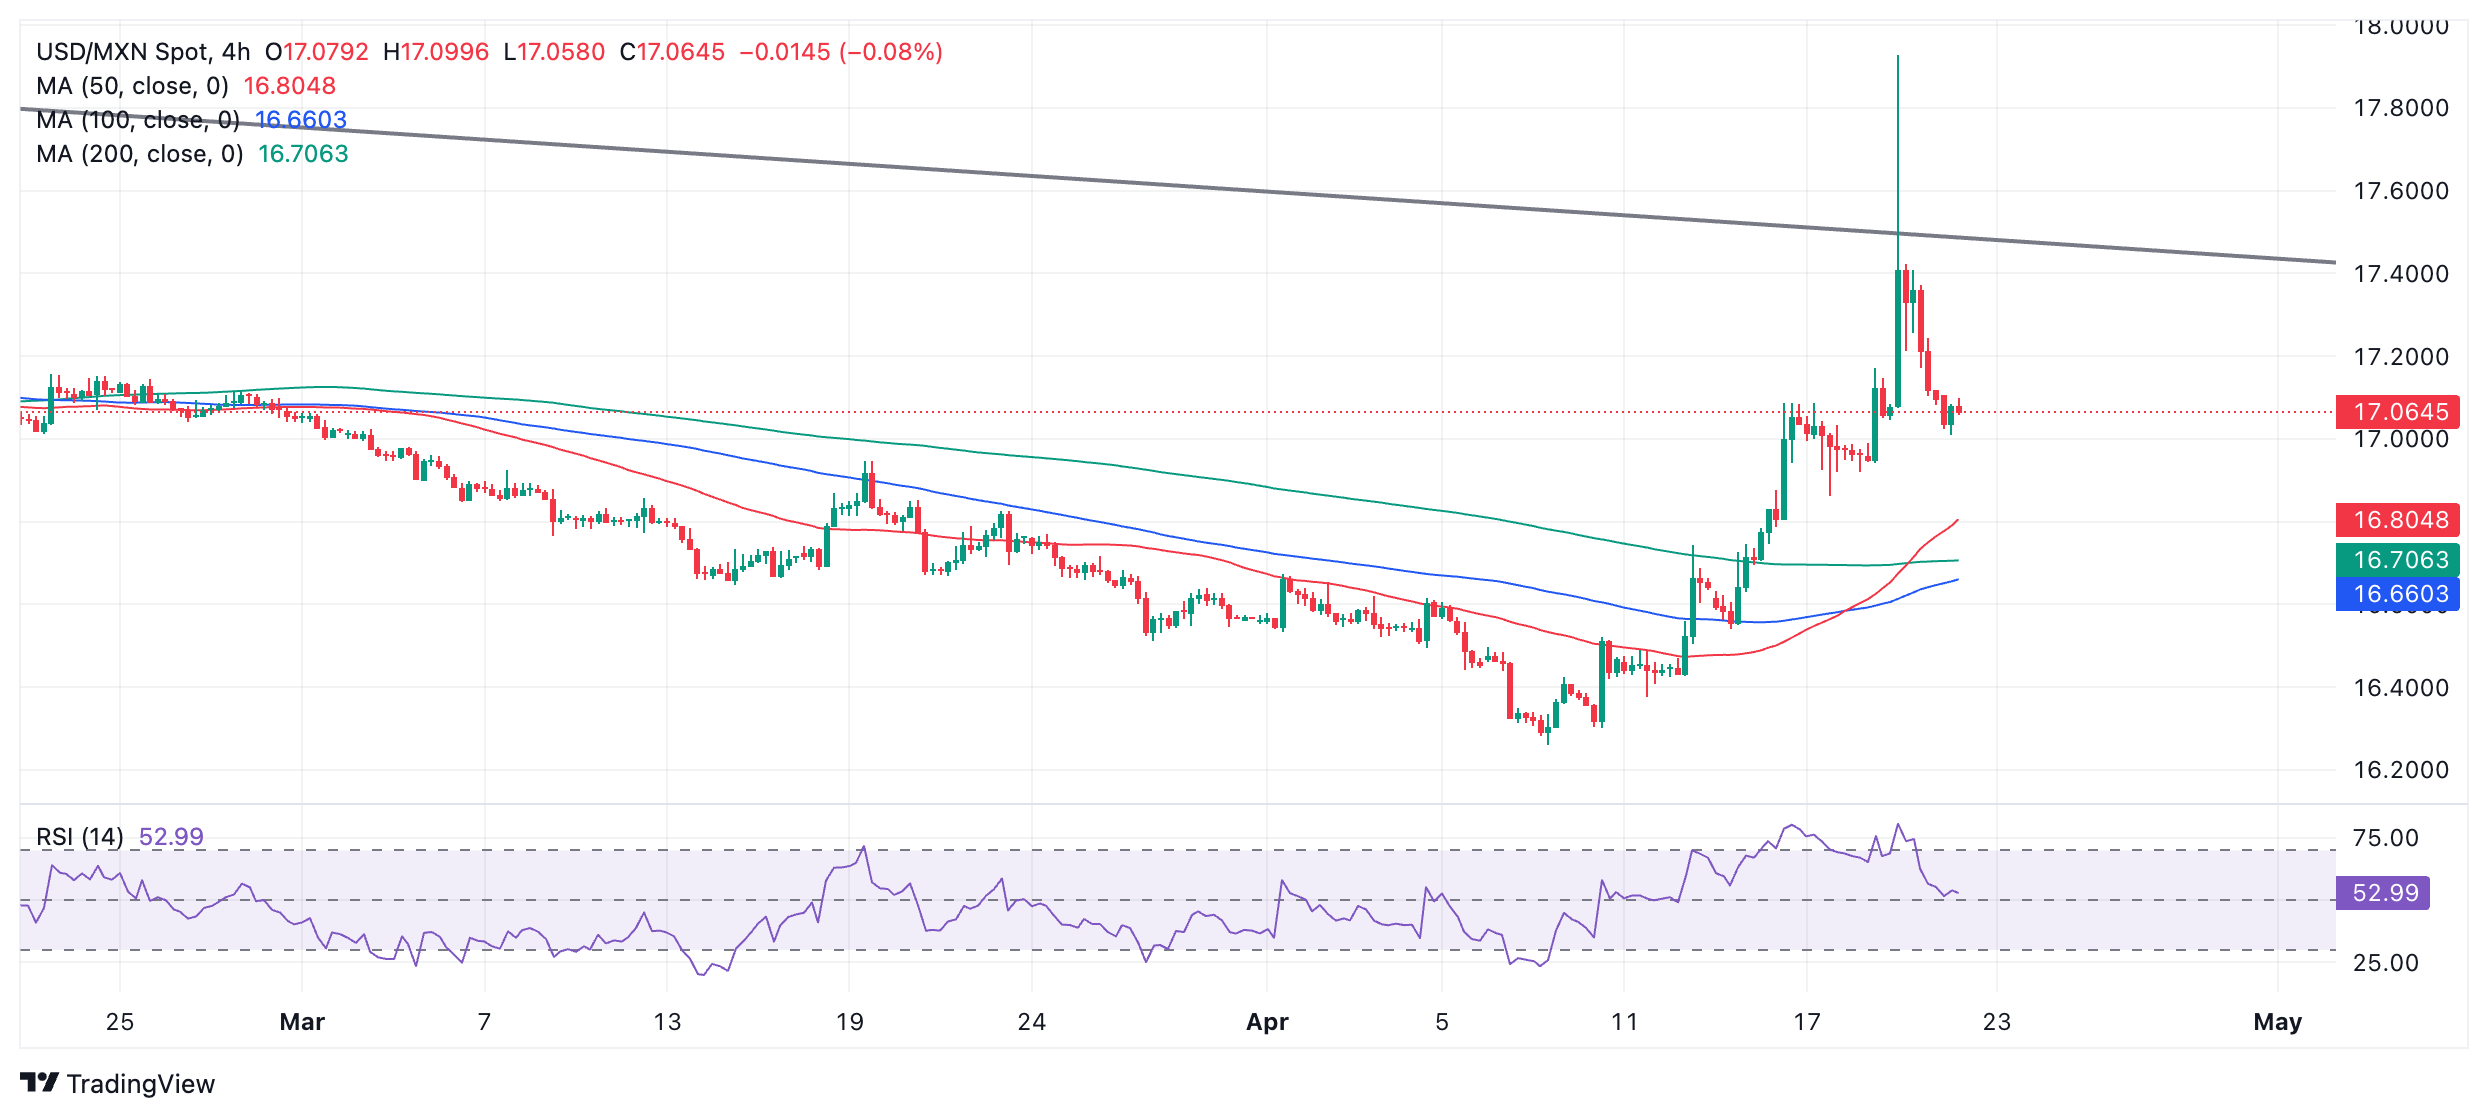
That said, the new short-term uptrend on USD/MXN is showing signs of weakness already as the pullback from Friday’s peak continues and a lack of fresh bullish momentum injects price appreciation. Support from the 200-day Simple Moving Average (SMA) at 17.17 also now appears to have been broken. A negative close on Monday would confirm a bearish Shooting Star Japanese candlestick pattern on the daily chart, with bearish overtones.
A decisive break above the trendline at roughly 17.45 would be required to provide bullish reconfirmation and activate an upside target at roughly 18.15.
A decisive break would be one characterized by a longer-than-average green daily candlestick that pierces above the trendline and closes near its high, or three green candlesticks in a row that pierce above the level.
The Relative Strength Index (RSI) has now exited overbought territory and reentered neutral ground, suggesting fresh scope for upside.
If a pullback persists, however, support from the 100-day SMA at 16.96 followed by the 50-day SMA at 16.82 is likely to provide a foothold for the backsliding price.
Mexican Peso FAQs
The Mexican Peso (MXN) is the most traded currency among its Latin American peers. Its value is broadly determined by the performance of the Mexican economy, the country’s central bank’s policy, the amount of foreign investment in the country and even the levels of remittances sent by Mexicans who live abroad, particularly in the United States. Geopolitical trends can also move MXN: for example, the process of nearshoring – or the decision by some firms to relocate manufacturing capacity and supply chains closer to their home countries – is also seen as a catalyst for the Mexican currency as the country is considered a key manufacturing hub in the American continent. Another catalyst for MXN is Oil prices as Mexico is a key exporter of the commodity.
The main objective of Mexico’s central bank, also known as Banxico, is to maintain inflation at low and stable levels (at or close to its target of 3%, the midpoint in a tolerance band of between 2% and 4%). To this end, the bank sets an appropriate level of interest rates. When inflation is too high, Banxico will attempt to tame it by raising interest rates, making it more expensive for households and businesses to borrow money, thus cooling demand and the overall economy. Higher interest rates are generally positive for the Mexican Peso (MXN) as they lead to higher yields, making the country a more attractive place for investors. On the contrary, lower interest rates tend to weaken MXN.
Macroeconomic data releases are key to assess the state of the economy and can have an impact on the Mexican Peso (MXN) valuation. A strong Mexican economy, based on high economic growth, low unemployment and high confidence is good for MXN. Not only does it attract more foreign investment but it may encourage the Bank of Mexico (Banxico) to increase interest rates, particularly if this strength comes together with elevated inflation. However, if economic data is weak, MXN is likely to depreciate.
As an emerging-market currency, the Mexican Peso (MXN) tends to strive during risk-on periods, or when investors perceive that broader market risks are low and thus are eager to engage with investments that carry a higher risk. Conversely, MXN tends to weaken at times of market turbulence or economic uncertainty as investors tend to sell higher-risk assets and flee to the more-stable safe havens.
- EUR/JPY extends gains on improved risk sentiment due to the de-escalated tensions between Israel and Iran.
- ECB’s Villeroy said that Middle East situation is unlikely to impact the central bank’s intention of rate cuts in June.
- BoJ Governor Kazuo Ueda advocated maintaining the loose monetary policy.
EUR/JPY traded on a stronger note around 164.90 during the early Asian session on Monday. However, the European Central Bank (ECB) will commence interest rate cuts in June, driven by a tepid Eurozone economic outlook and moderating core inflationary pressures. The ECB has conveyed a clear message to markets, suggesting that an interest rate cut could be imminent if significant developments don't occur.
As Reuters reported on Sunday, François Villeroy de Galhau, the governor of the Bank of France, said that the tension in the Middle East is not expected to lead to a significant increase in energy prices, and as a result, it is unlikely to impact the European Central Bank's intention to commence interest rate cuts in June.
The Japanese Yen (JPY) encounters challenges amid a resurgence in risk-on sentiment, with no notable geopolitical developments emerging over the weekend. Antony Blinken, the US Secretary of State, called for restraint following comments from an Iranian official indicating no immediate plans for retaliation against the reported Israeli missile strike. Blinken's statements came after the G7 meeting of foreign ministers in Capri, Italy, as reported by "The Guardian."
Furthermore, Bank of Japan (BoJ) Governor Kazuo Ueda made dovish remarks during a seminar hosted by the Peterson Institute for International Economics on Friday, according to Reuters. Ueda emphasized the necessity for the BoJ to maintain accommodative monetary policies in the foreseeable future due to underlying inflation remaining "somewhat below" the 2% target, with long-term inflation expectations hovering around 1.5%.
Silver prices (XAG/USD) fell on Monday, according to FXStreet data. Silver trades at $27.85 per troy ounce, down 2.92% from the $28.69 it cost on Friday.
Silver prices have increased by 9.34% since the beginning of the year.
| Unit measure | Today Price |
|---|---|
| Silver price per troy ounce | $27.85 |
| Silver price per gram | $0.90 |
The Gold/Silver ratio, which shows the number of troy ounces of Silver needed to equal the value of one troy ounce of Gold, stood at 84.77 on Monday, up from 83.39 on Friday.
Investors might use this ratio to determine the relative valuation of Gold and Silver. Some may consider a high ratio as an indicator that Silver is undervalued – or Gold is overvalued – and might buy Silver or sell Gold accordingly. Conversely, a low ratio might suggest that Gold is undervalued relative to Silver.
(An automation tool was used in creating this post.)
Silver FAQs
Silver is a precious metal highly traded among investors. It has been historically used as a store of value and a medium of exchange. Although less popular than Gold, traders may turn to Silver to diversify their investment portfolio, for its intrinsic value or as a potential hedge during high-inflation periods. Investors can buy physical Silver, in coins or in bars, or trade it through vehicles such as Exchange Traded Funds, which track its price on international markets.
Silver prices can move due to a wide range of factors. Geopolitical instability or fears of a deep recession can make Silver price escalate due to its safe-haven status, although to a lesser extent than Gold's. As a yieldless asset, Silver tends to rise with lower interest rates. Its moves also depend on how the US Dollar (USD) behaves as the asset is priced in dollars (XAG/USD). A strong Dollar tends to keep the price of Silver at bay, whereas a weaker Dollar is likely to propel prices up. Other factors such as investment demand, mining supply – Silver is much more abundant than Gold – and recycling rates can also affect prices.
Silver is widely used in industry, particularly in sectors such as electronics or solar energy, as it has one of the highest electric conductivity of all metals – more than Copper and Gold. A surge in demand can increase prices, while a decline tends to lower them. Dynamics in the US, Chinese and Indian economies can also contribute to price swings: for the US and particularly China, their big industrial sectors use Silver in various processes; in India, consumers’ demand for the precious metal for jewellery also plays a key role in setting prices.
Silver prices tend to follow Gold's moves. When Gold prices rise, Silver typically follows suit, as their status as safe-haven assets is similar. The Gold/Silver ratio, which shows the number of ounces of Silver needed to equal the value of one ounce of Gold, may help to determine the relative valuation between both metals. Some investors may consider a high ratio as an indicator that Silver is undervalued, or Gold is overvalued. On the contrary, a low ratio might suggest that Gold is undervalued relative to Silver.
- NZD/USD maintains gains despite the bearish sentiment indicated by the technical analysis.
- Traders might contemplate short positions if the pair breaks below the support area encompassing 0.5863 and 0.5850.
- A pullback from the level of 0.5863 could lead the pair toward lower boundary of a symmetrical pattern around 0.5933.
NZD/USD snaps its two-day losing streak, trading around 0.5910 during the European session on Monday. The recent break below the symmetrical channel on April 15 on the daily chart denotes a bearish sentiment.
Furthermore, analysis of the lagging indicator Moving Average Convergence Divergence (MACD) suggests a prevailing downward trend for the NZD/USD pair. This is evident from the MACD line's placement below the centerline and the signal line.
Additionally, the 14-day Relative Strength Index (RSI) remains below the 50 level, offering further confirmation of the bearish sentiment. This could prompt traders of the NZD/USD pair to focus on the region around the significant support levels of 0.5863 and 0.5850. Should these levels be breached, traders may consider short positions, potentially driving the pair to test the psychological barrier at 0.5800, followed by the support level of 0.5772.
Alternatively, if the pair rebounds from the support level of 0.5863, it could target the lower boundary of a symmetrical pattern around 0.5933 and the key level of 0.5950. A breakthrough above these levels might encourage traders to adopt long positions, shifting the sentiment towards bullish, with a potential aim to reach the 50-day Exponential Moving Average (EMA) positioned at 0.6030.
A break above the 50-day EMA will strengthen the bullish sentiment and test the upper boundary of the symmetrical pattern around 0.6043. A breakthrough at this level could prompt the traders to go bullish and approach the resistance barrier at 0.6219.
NZD/USD: Daily Chart
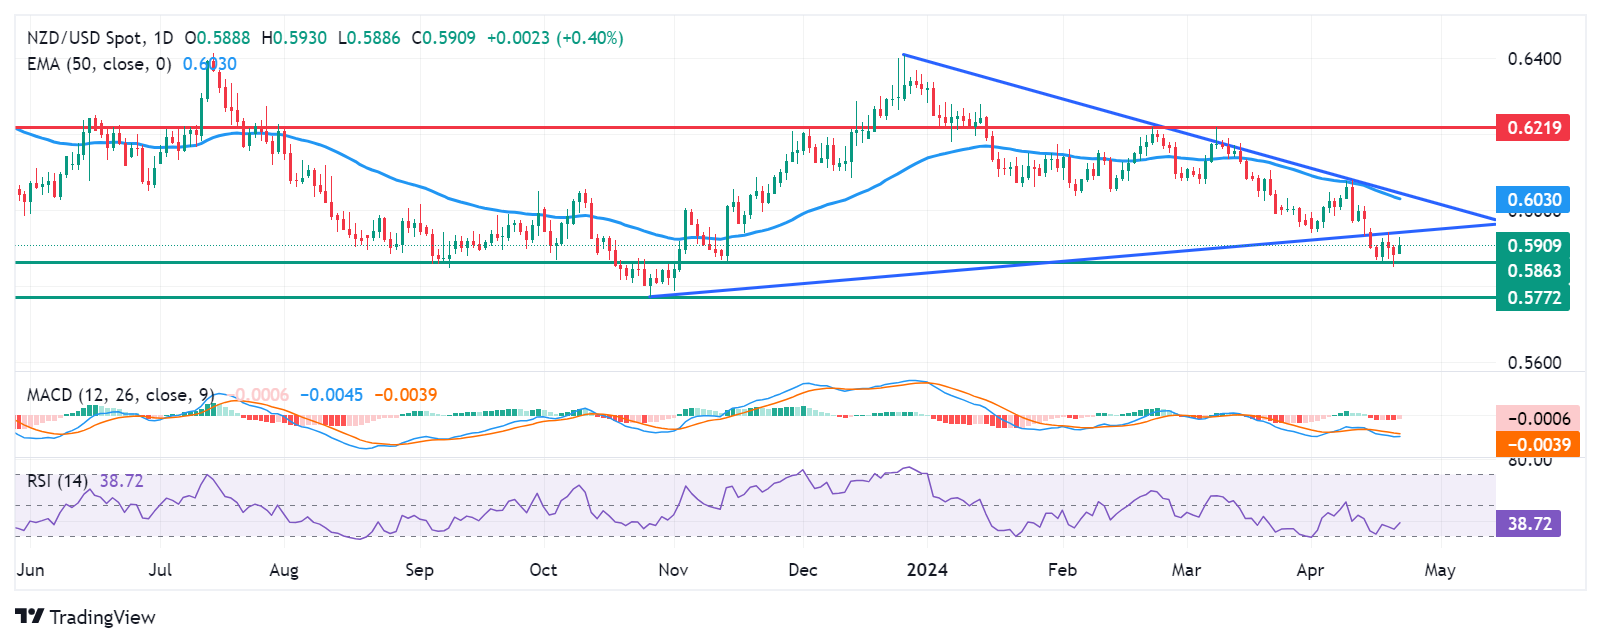
- USD/CAD drops further to 1.3720 as the Canadian Dollar holds strength despite weak Oil prices.
- This week, the US Core PCE Price Index and Q1 GDP data will guide the US Dollar.
- USD/CAD corrects after a sharp rally, driven by an Ascending Triangle breakout.
The USD/CAD pair continues its losing streak for the fourth trading session on Monday. The Loonie asset drops to 1.3720 as investors have underpinned the Canadian Dollar against the US Dollar despite multiple headwinds.
The Canadian Dollar holds strength even though the Oil price plummets below $81.00. The appeal of the Oil price weakens as geopolitical risks ease after Friday's event in the Middle East indicated that Iran was downplaying Israel's limited retaliatory attack. Lower Oil prices generally dent demand for the Canadian Dollar, as Canada is the leading exporter of Oil to the United States.
Also, the soft Canadian inflation outlook fails to dampen the Canadian Dollar outlook. Bank of Canada’s (BoC) preferred inflation measure that excludes eight volatile items annually ease to 2% in March, prompting expectations of early rate cuts.
Meanwhile, the US Dollar consolidates above 106.00 as investors shift focus to the preliminary Q1 Gross Domestic Product (GDP) and the core Personal Consumption Expenditure Price Index (PCE) data for March, which will be published on Thursday and Friday, respectively.
USD/CAD delivered a sharp rally after a breakout of the Ascending Triangle chart pattern formed on a daily timeframe. The near-term outlook remains strong as the 20- and 50-day Exponential Moving Averages (EMAs), which trades around 1.3680 and 1.3600, respectively, are moving higher.
The 14-period Relative Strength drops to near 60.00 but still holds inside the bullish range of 60.00-80.00.
As a mild correction is generally followed by a sharp rally after a breakout, a mean-reversion move to near the 20-day EMA around 1.3680 will present a buying opportunity to market participants. Investors would find resistance near the 22 November 2023, high at 1.3766, followed by the round-level resistance of 1.3800.
In an alternate scenario, a breakdown below April 9 low around 1.3547 will expose the asset to the psychological support of 1.3500 and March 21 low around 1.3456.
USD/CAD daily chart
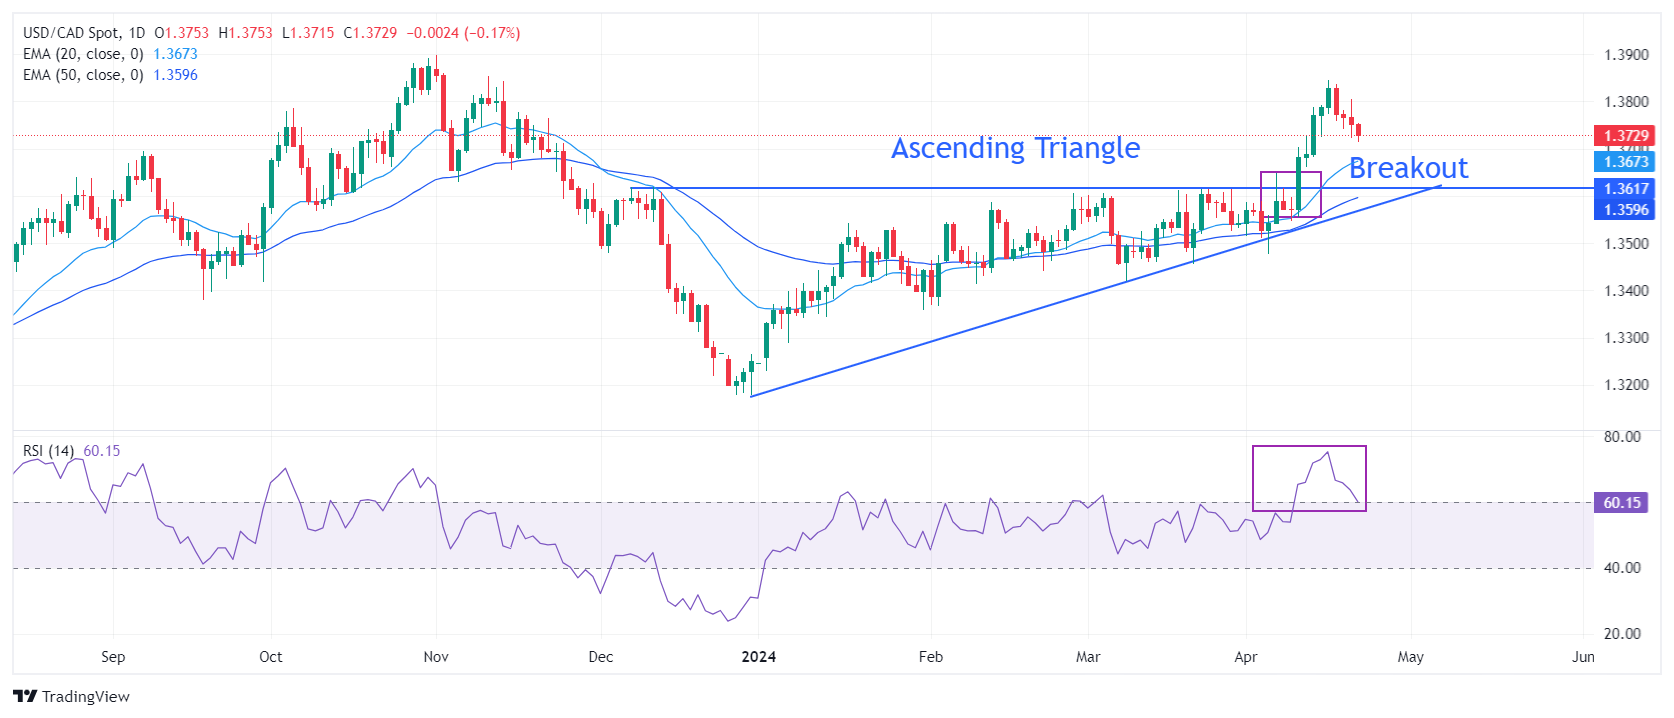
Gold prices fell in India on Monday, according to data from India's Multi Commodity Exchange (MCX).
Gold price stood at 72,711 Indian Rupees (INR) per 10 grams, down INR 569 compared with the INR 73,280 it cost on Friday.
As for futures contracts, Gold prices decreased to INR 71,900 per 10 gms from INR 72,806 per 10 gms.
Prices for Silver futures contracts decreased to INR 81,870 per kg from INR 83,507 per kg.
| Major Indian city | Gold Price |
|---|---|
| Ahmedabad | 75,345 |
| Mumbai | 75,130 |
| New Delhi | 75,160 |
| Chennai | 75,370 |
| Kolkata | 75,315 |
Global Market Movers: Comex Gold price hits weekly lows on easing geopolitical risks
- Iran signaled that it has no plans to retaliate against the Israeli limited-scale missiles strike on Friday, easing fears about a further escalation of geopolitical tensions in the Middle East and undermining the safe-haven Gold price on Comex.
- Investors have pushed back their expectations about the timing of the first interest rate cut by the Federal Reserve to September and also downsized bets for the number of rate cuts in 2024 to two, or around 40 basis points.
- Chicago Fed President Austan Goolsbee argued on Friday that progress on US inflation has stalled this year and that it would make sense to wait to get more clarity on the inflation outlook before taking a policy step.
- The yield on the benchmark 10-year US government bond stands tall near a multi-month peak, which, in turn, is seen acting as a tailwind for the US Dollar and exerting additional pressure on the non-yielding yellow metal.
- Concerns about slowing global economic growth support prospects for synchronized interest-rate cuts by most major central banks in the second half of this year, which, in turn, could lend support to the XAU/USD.
- Traders might also wait for this week's release of flash global PMI prints, the Advance US Q1 GDP report, and the US Personal Consumption Expenditures (PCE) Price Index before placing fresh directional bets.
(An automation tool was used in creating this post.)
Gold FAQs
Gold has played a key role in human’s history as it has been widely used as a store of value and medium of exchange. Currently, apart from its shine and usage for jewelry, the precious metal is widely seen as a safe-haven asset, meaning that it is considered a good investment during turbulent times. Gold is also widely seen as a hedge against inflation and against depreciating currencies as it doesn’t rely on any specific issuer or government.
Central banks are the biggest Gold holders. In their aim to support their currencies in turbulent times, central banks tend to diversify their reserves and buy Gold to improve the perceived strength of the economy and the currency. High Gold reserves can be a source of trust for a country’s solvency. Central banks added 1,136 tonnes of Gold worth around $70 billion to their reserves in 2022, according to data from the World Gold Council. This is the highest yearly purchase since records began. Central banks from emerging economies such as China, India and Turkey are quickly increasing their Gold reserves.
Gold has an inverse correlation with the US Dollar and US Treasuries, which are both major reserve and safe-haven assets. When the Dollar depreciates, Gold tends to rise, enabling investors and central banks to diversify their assets in turbulent times. Gold is also inversely correlated with risk assets. A rally in the stock market tends to weaken Gold price, while sell-offs in riskier markets tend to favor the precious metal.
The price can move due to a wide range of factors. Geopolitical instability or fears of a deep recession can quickly make Gold price escalate due to its safe-haven status. As a yield-less asset, Gold tends to rise with lower interest rates, while higher cost of money usually weighs down on the yellow metal. Still, most moves depend on how the US Dollar (USD) behaves as the asset is priced in dollars (XAU/USD). A strong Dollar tends to keep the price of Gold controlled, whereas a weaker Dollar is likely to push Gold prices up.
- The Pound Sterling faces selling pressure as the soft inflation outlook prompts BoE rate cut prospects.
- Weak UK Retail Sales also contribute to a softer inflation outlook.
- Fed’s higher for longer interest-rates argument strengthens the US Dollar.
The Pound Sterling (GBP) remains on the back foot in Monday’s London session as investors continue to price in the Bank of England (BoE) will pivot to interest-rate cuts earlier than the US Federal Reserve (Fed). The GBP/USD pair trades close to a five-month low around 1.2360 as investors expect that the Fed will keep its monetary policy framework restrictive for longer. A strong economic outlook and robust consumer spending in the United States are keeping inflation higher.
The US Dollar Index (DXY), which tracks the US Dollar’s value against six major currencies, trades broadly steady near the crucial support of 106.00. This week, the US Dollar will be guided by the core Personal Consumption Expenditure Price Index (PCE) data for March, which is expected to influence Fed rate cut expectations. Currently, financial markets are anticipating that the Fed will begin to reduce borrowing rates from September.
Meanwhile, easing fears of further escalation in tensions between Israel and Iran could offer some support to risk-sensitive assets. Iran said they have no plans for an immediate retaliation, according to Al Jazeera.
Daily digest market movers: Pound Sterling slips further while US Dollar sees upside
- The Pound Sterling finds temporary support near 1.2360 after retreating from 1.2470. More downside is likely after comments from Bank of England Deputy Governor Dave Ramsden on Friday, who said that upside risks to inflation have receded and that price growth could undershoot the central bank’s recent projections.
- Ramsden said "Over the last few months I have become more confident in the evidence that risks to persistence in domestic inflation pressures are receding, helped by improved inflation dynamics," Reuters reported. However, he warned that unlike the United States the backdrop to inflation in Britain was of continuing weak economic growth.
- Strong prospects for UK inflation easing sooner and a downbeat economic outlook are expected to allow the BoE to start reducing interest rates earlier than previously anticipated.
- The prospects for inflation easing further were also boosted by weak Retail Sales data for March. The Office for National Statistics (ONS) showed Friday that Retail Sales were unchanged in March compared with the previous month and below the 0.3% increase forecast by economists. In February, Retail Sales grew by a meagre 0.1%. The Retail Sales data is a leading indicator of consumer spending, so weak figures signal the deepening cost-of-living crisis due to higher interest rates by the central bank.
- Going forward, the Pound Sterling will dance to the tunes of the S&P Global/CIPS preliminary PMI data for April, which will be published on Tuesday. The Manufacturing PMI is expected to expand steadily by 50.3. The Services PMI is estimated to have declined slightly to 53.0 from 53.1.
Technical Analysis: Pound Sterling dips below 1.2400
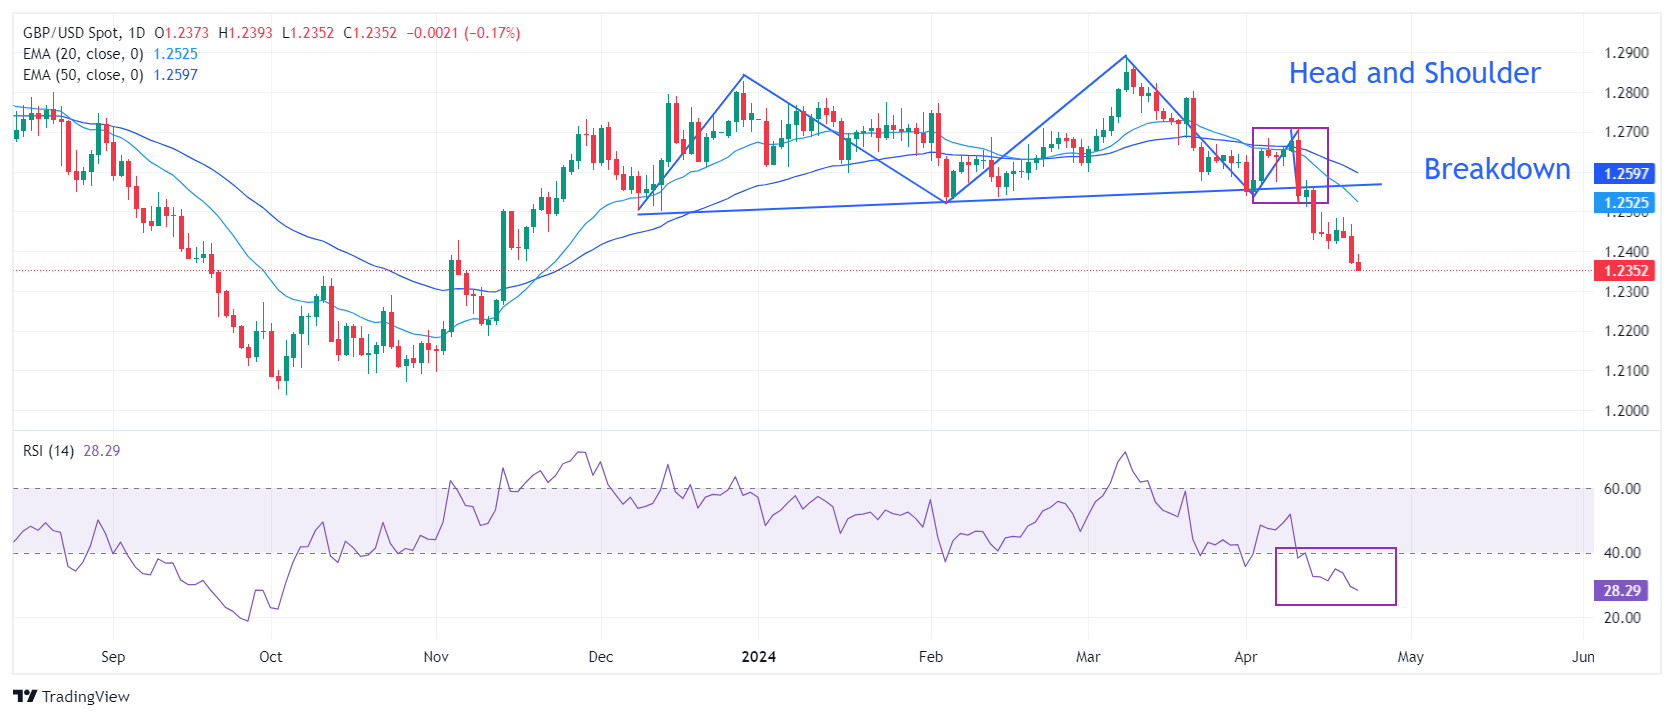
The Pound Sterling resumes its downside journey after failing to recapture the crucial resistance of 1.2400. The GBP/USD pair weakens after a breakdown of the Head and Shoulder chart pattern, whose neckline is plotted from the December 8 low around 1.2500. Declining 20-day and 50-day Exponential Moving Averages (EMAs) at 1.2525 and 1.2600, respectively, indicate that the long-term outlook is bearish.
The 14-period Relative Strength Index (RSI) oscillates in the range of 20.00-40.00, indicating a strong bearish momentum.
Pound Sterling FAQs
The Pound Sterling (GBP) is the oldest currency in the world (886 AD) and the official currency of the United Kingdom. It is the fourth most traded unit for foreign exchange (FX) in the world, accounting for 12% of all transactions, averaging $630 billion a day, according to 2022 data. Its key trading pairs are GBP/USD, aka ‘Cable’, which accounts for 11% of FX, GBP/JPY, or the ‘Dragon’ as it is known by traders (3%), and EUR/GBP (2%). The Pound Sterling is issued by the Bank of England (BoE).
The single most important factor influencing the value of the Pound Sterling is monetary policy decided by the Bank of England. The BoE bases its decisions on whether it has achieved its primary goal of “price stability” – a steady inflation rate of around 2%. Its primary tool for achieving this is the adjustment of interest rates. When inflation is too high, the BoE will try to rein it in by raising interest rates, making it more expensive for people and businesses to access credit. This is generally positive for GBP, as higher interest rates make the UK a more attractive place for global investors to park their money. When inflation falls too low it is a sign economic growth is slowing. In this scenario, the BoE will consider lowering interest rates to cheapen credit so businesses will borrow more to invest in growth-generating projects.
Data releases gauge the health of the economy and can impact the value of the Pound Sterling. Indicators such as GDP, Manufacturing and Services PMIs, and employment can all influence the direction of the GBP. A strong economy is good for Sterling. Not only does it attract more foreign investment but it may encourage the BoE to put up interest rates, which will directly strengthen GBP. Otherwise, if economic data is weak, the Pound Sterling is likely to fall.
Another significant data release for the Pound Sterling is the Trade Balance. This indicator measures the difference between what a country earns from its exports and what it spends on imports over a given period. If a country produces highly sought-after exports, its currency will benefit purely from the extra demand created from foreign buyers seeking to purchase these goods. Therefore, a positive net Trade Balance strengthens a currency and vice versa for a negative balance.
- EUR/USD finds support from a lack of escalation in the Israel-Iran conflict.
- Diverging interest rate expectations are an overall bearish factor however.
- EUR/USD may be forming a Bear Flag price pattern.
EUR/USD continues to trade within a contained box-like range, up a marginal tenth of a percentage point in the 1.0660s on Monday.
A lack of escalation in the Israel-Iran conflict has led to an unwinding in geopolitical risk, which has reduced demand for the safe-haven US Dollar and provided EUR/USD with a slight lift.
Most analysts are bearish EUR/USD, however, because of a diverging outlook for future path of interest rates – a key FX driver – in the US as compared to Europe.
EUR/USD doomed by diverging interest rates
EUR/USD is expected to continue weakening by many experts because of the comparative outlook for interest rates, which drive capital flows. Interest rates are expected to remain higher in the US compared to Europe, making it a more attractive place to store capital, thereby increasing inflows and Dollar-demand.
On the US side, stubbornly high inflation, a robust jobs market and strong economic growth are all reasons to keep interest rates at their current level (5.25%-5.50%).
“It is hard to find any reasons to bet against the Dollar,” said Michael Pfister, FX Analyst at Commerzbank in an interview with Bloomberg News on Monday. “We have seen an appreciation in the Greenback over the last two weeks on the back of an inflation surprise. On top of that we have a strong growth advantage and a very hawkish Fed,” added the analyst.
Pfister sees the Federal Reserve (Fed) not making a first rate cut until December, which is a big change from expectations earlier this year, when the consensus was that the Fed would make its first interest rate cut in June. The Fed themselves, in their last Summary of Economic Projections (SEP), forecast about three 0.25% cuts over the whole of 2024.
This contrasts with Europe, where disinflation has been stronger and economic activity weaker. Additionally, officials at the European Central Bank (ECB) which sets base lending rates for the entire region (currently at 4.5%), appear more united in advocating for a cut in June, compared to their colleagues across the Atlantic.
“To be honest, I am often surprised that the Euro is not much weaker,” says Ulrich Leuchtmann, Head of FX and Commodity Research also at Commerzbank in a note on Monday.
“Over the weekend, news services reported in advance on an interview with François Villeroy de Galhau, Governor of the Banque de France. According to these reports, Villeroy confirmed the ECB Governing Council's intention to cut interest rates at its meeting on June 6,” adds Leuchtmann.
How low could the Euro go? When asked whether he saw EUR/USD falling all the way to parity, Pfister replied “Not quite as low as parity but we see EUR/USD probably falling to 1.0400.”
Technical Analysis: EUR/USD forms potential Bear Flag
EUR/USD has been yo-yoing in a rectangular range since it bottomed at 1.0601 on April 16. The range is roughly at the level of the 100-week Simple Moving Average (SMA).
Taken together with the steep decline that preceded it, the rectangle resembles an almost-complete Bear Flag pattern on the 4-hour chart below.
EUR/USD 4-hour Chart
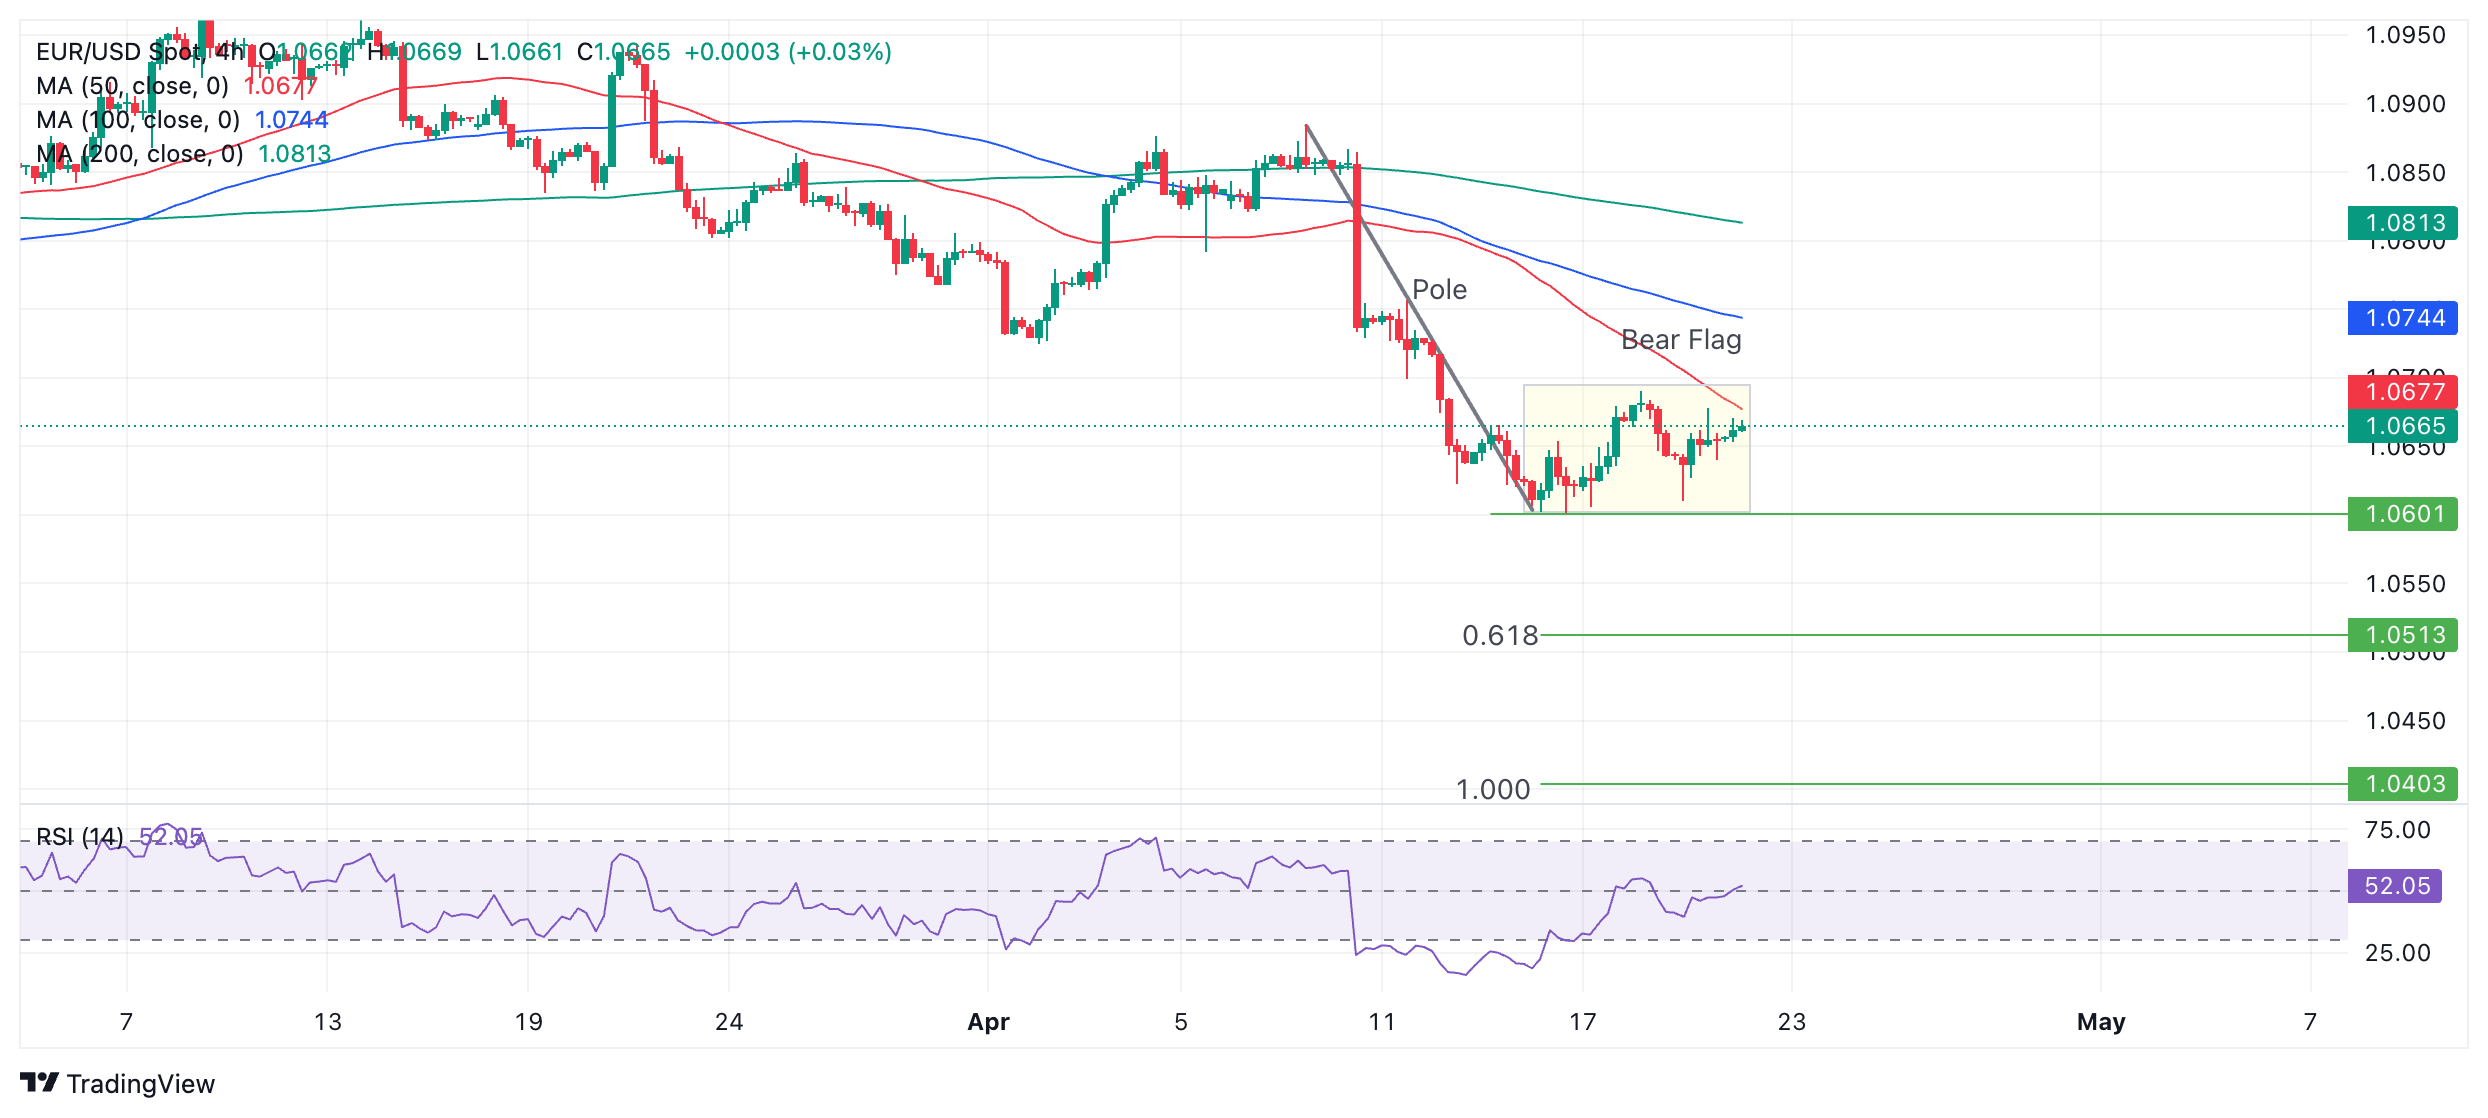
A break below the 1.0601 April 16 low would signal a probable activation of the Bear Flag and the start of a deep decline. Technical analysts forecast the move out of a Bear Flag as equal to the length of the “pole” or the steep decline preceding the box-like formation of the flag square, or a Fibonacci ratio of the pole.
The Fibonacci 0.618 ratio of the pole extrapolated lower provides the most reliable conservative target. This gives a price objective at 1.0503. After that, the next concrete target is at 1.0446 – the October 2023 low. A fall of equal length to the pole would take the exchange rate all the way down to 1.0403.
The Relative Strength Index (RSI) has exited oversold conditions, indicating renewed potential for more downside.
For bulls, resistance at around 1.0700 will need to be overcome to have any hope of recovery. After that, the April 2 swing low at 1.0725 provides the next upside target followed by 1.0800, where a cluster of major Moving Averages coils.
Euro FAQs
The Euro is the currency for the 20 European Union countries that belong to the Eurozone. It is the second most heavily traded currency in the world behind the US Dollar. In 2022, it accounted for 31% of all foreign exchange transactions, with an average daily turnover of over $2.2 trillion a day. EUR/USD is the most heavily traded currency pair in the world, accounting for an estimated 30% off all transactions, followed by EUR/JPY (4%), EUR/GBP (3%) and EUR/AUD (2%).
The European Central Bank (ECB) in Frankfurt, Germany, is the reserve bank for the Eurozone. The ECB sets interest rates and manages monetary policy. The ECB’s primary mandate is to maintain price stability, which means either controlling inflation or stimulating growth. Its primary tool is the raising or lowering of interest rates. Relatively high interest rates – or the expectation of higher rates – will usually benefit the Euro and vice versa. The ECB Governing Council makes monetary policy decisions at meetings held eight times a year. Decisions are made by heads of the Eurozone national banks and six permanent members, including the President of the ECB, Christine Lagarde.
Eurozone inflation data, measured by the Harmonized Index of Consumer Prices (HICP), is an important econometric for the Euro. If inflation rises more than expected, especially if above the ECB’s 2% target, it obliges the ECB to raise interest rates to bring it back under control. Relatively high interest rates compared to its counterparts will usually benefit the Euro, as it makes the region more attractive as a place for global investors to park their money.
Data releases gauge the health of the economy and can impact on the Euro. Indicators such as GDP, Manufacturing and Services PMIs, employment, and consumer sentiment surveys can all influence the direction of the single currency. A strong economy is good for the Euro. Not only does it attract more foreign investment but it may encourage the ECB to put up interest rates, which will directly strengthen the Euro. Otherwise, if economic data is weak, the Euro is likely to fall. Economic data for the four largest economies in the euro area (Germany, France, Italy and Spain) are especially significant, as they account for 75% of the Eurozone’s economy.
Another significant data release for the Euro is the Trade Balance. This indicator measures the difference between what a country earns from its exports and what it spends on imports over a given period. If a country produces highly sought after exports then its currency will gain in value purely from the extra demand created from foreign buyers seeking to purchase these goods. Therefore, a positive net Trade Balance strengthens a currency and vice versa for a negative balance.
Here is what you need to know on Monday, April 22:
US stock index futures started the week on a bullish note, reflecting an improvement in risk mood. European Commission will release the preliminary Consumer Confidence data for April on Monday and European Central Bank (ECB) President will deliver a speech. The US economic docket will not feature any high-impact data releases.
Investors remain optimistic about an avoidance of a further deepening of the crisis in the Middle East following a relatively quiet weekend in terms of news regarding the Iran-Israel conflict. At the time of press, US stock index futures were up between 0.4% and 0.6%. The US Dollar (USD) Index holds steady near 106.00 and the benchmark 10-year US Treasury bond yield continues to fluctuate above 4.6%.
US Dollar price in the last 7 days
The table below shows the percentage change of US Dollar (USD) against listed major currencies in the last 7 days. US Dollar was the strongest against the Japanese Yen.
| USD | EUR | GBP | CAD | AUD | JPY | NZD | CHF | |
| USD | -0.15% | 0.66% | -0.25% | 0.72% | 0.90% | 0.62% | -0.29% | |
| EUR | 0.15% | 0.80% | -0.10% | 0.87% | 1.06% | 0.78% | -0.12% | |
| GBP | -0.67% | -0.81% | -0.91% | 0.06% | 0.24% | -0.04% | -0.97% | |
| CAD | 0.25% | 0.10% | 0.90% | 0.97% | 1.14% | 0.87% | -0.05% | |
| AUD | -0.73% | -0.88% | -0.07% | -0.98% | 0.18% | -0.10% | -1.02% | |
| JPY | -0.89% | -1.05% | -0.22% | -1.16% | -0.18% | -0.26% | -1.21% | |
| NZD | -0.63% | -0.77% | 0.02% | -0.88% | 0.10% | 0.27% | -0.93% | |
| CHF | 0.27% | 0.12% | 0.93% | 0.03% | 0.99% | 1.17% | 0.89% |
The heat map shows percentage changes of major currencies against each other. The base currency is picked from the left column, while the quote currency is picked from the top row. For example, if you pick the Euro from the left column and move along the horizontal line to the Japanese Yen, the percentage change displayed in the box will represent EUR (base)/JPY (quote).
During the Asian trading hours, the People's Bank of China (PBoC) reported that it left the one-year and five-year Loan Prime Rates unchanged at 3.45% and 3.95%, respectively. Meanwhile, China’s Commerce Ministry announced on Friday that they decided to impose a levy of 43.5% on imports of propionic acid from the United States. Propionic acid is commonly used in food, feed, pesticides and medical fields.
AUD/USD pair showed no reaction to China-related news and edged higher to the 0.6450 area at the weekly opening before retreating slightly. Judo Bank Manufacturing and Services PMI data for April will be released in the early trading hours of the Asian session on Tuesday.
Australian Dollar holds steady following gains amid the lackluster US Dollar.
The Swiss National Bank (SNB) announced early Monday that it raised the minimum reserve requirement for banks from 2.5% to 4%. USD/CHF largely ignored this headline and was last seen trading modestly higher on the day above 0.9100.
EUR/USD closed the previous week virtually unchanged. The pair holds steady above 1.0650 in the European morning on Monday.
GBP/USD came under bearish pressure in the American session on Friday and broke below 1.2400, ending the week in negative territory. The pair stays in a consolidation phase above 1.2350 in the early European session.
Gold registered small daily gains on Friday but closed the week below $2,400. XAU/USD stages a technical correction on Monday and was last seen losing over 1% on the day below $2,360.
Gold price extends its steady intraday descent to $2,360 area, bullish potential seems intact.
USD/JPY moves up and down in a very tight channel below 155.00 on Monday. On Friday, the Bank of Japan will announce monetary policy decisions.
Japanese Yen bears retain control near multi-decade low, 155.00 eyed ahead of BoJ on Friday.
Risk sentiment FAQs
In the world of financial jargon the two widely used terms “risk-on” and “risk off'' refer to the level of risk that investors are willing to stomach during the period referenced. In a “risk-on” market, investors are optimistic about the future and more willing to buy risky assets. In a “risk-off” market investors start to ‘play it safe’ because they are worried about the future, and therefore buy less risky assets that are more certain of bringing a return, even if it is relatively modest.
Typically, during periods of “risk-on”, stock markets will rise, most commodities – except Gold – will also gain in value, since they benefit from a positive growth outlook. The currencies of nations that are heavy commodity exporters strengthen because of increased demand, and Cryptocurrencies rise. In a “risk-off” market, Bonds go up – especially major government Bonds – Gold shines, and safe-haven currencies such as the Japanese Yen, Swiss Franc and US Dollar all benefit.
The Australian Dollar (AUD), the Canadian Dollar (CAD), the New Zealand Dollar (NZD) and minor FX like the Ruble (RUB) and the South African Rand (ZAR), all tend to rise in markets that are “risk-on”. This is because the economies of these currencies are heavily reliant on commodity exports for growth, and commodities tend to rise in price during risk-on periods. This is because investors foresee greater demand for raw materials in the future due to heightened economic activity.
The major currencies that tend to rise during periods of “risk-off” are the US Dollar (USD), the Japanese Yen (JPY) and the Swiss Franc (CHF). The US Dollar, because it is the world’s reserve currency, and because in times of crisis investors buy US government debt, which is seen as safe because the largest economy in the world is unlikely to default. The Yen, from increased demand for Japanese government bonds, because a high proportion are held by domestic investors who are unlikely to dump them – even in a crisis. The Swiss Franc, because strict Swiss banking laws offer investors enhanced capital protection.
FX option expiries for Apr 22 NY cut at 10:00 Eastern Time, via DTCC, can be found below
- EUR/USD: EUR amounts
- 1.0550 943m
- 1.0700 1.4b
- GBP/USD: GBP amounts
- 1.2400 1b
- USD/JPY: USD amounts
- 153.25 1.4b
- 154.00 411m
- 154.10 635m
- 154.20 567m
- 154.75 529m
- 155.00 1.4b
- AUD/USD: AUD amounts
- 0.6475 559m
- USD/CAD: USD amounts
- 1.3775 810m
- USD/CHF holds positive ground near 0.9115 in Monday’s early Asian session.
- Many Fed officials prefer to wait longer than previously anticipated to cut rates amid the elevated inflation, lifting the Greenback.
- SNB Chairman Thomas Jordan said monetary policy should remain focused on price stability.
The USD/CHF pair trades on a positive note on Monday during the early European session. The uptick of the pair is supported by the lower bets on rate cut expectations from the Federal Reserve (Fed), with traders seeing just one or two rate cuts happening this year. The preliminary US Gross Domestic Product Annualized for the first quarter (Q1) and the Personal Consumption Expenditures (PCE) Price Index will be the highlights for this week.
With a robust US economy and stickier-than-expected inflation, investors dial back interest rate cut expectations. Several Fed officials prefer to wait longer than previously expected to cut rates following a series of surprisingly high inflation readings. The high-for-longer US rate narrative lifts the Greenback and acts as a tailwind for the USD/CHF pair.
On Friday, Chicago Federal Reserve (Fed) President Austan Goolsbee hinted at a longer timeline for interest rate cuts as progress on inflation had “stalled”, adding inflation has significantly dropped from its pandemic-era peak of 9.1%, but remains stubbornly above the Fed’s target. Meanwhile, Atlanta Fed President Raphael Bostic noted that the US central bank wouldn’t cut rates until the end of the year.
On the Swiss front, Swiss National Bank (SNB) Chairman Thomas Jordan said on Saturday that monetary policy should remain focused on price stability. He said that economic growth and productivity are too low and many countries are running too much debt and excessive deficits. Apart from this, the escalating geopolitical tensions in the Middle East, particularly Israel and Iran, might boost safe-haven assets like Swiss France and cap the pair’s upside.
- WTI Oil price depreciates on de-escalated geopolitical tensions in the Middle East.
- US House passed new sanctions on Iran’s oil sector set to become part of a foreign-aid package.
- The hawkish sentiment surrounding the Fed’s monetary policy puts pressure on the crude Oil’s outlook.
West Texas Intermediate (WTI) Oil price trades around $81.20 per barrel, hovering around its monthly low of $81.05, marked on Thursday. The decline in crude Oil prices can indeed be linked to eased geopolitical concerns in the Middle East, particularly following Reuters reports that Israel and Iran downplayed the risk of further escalation after Israel's strike on Iran.
Meanwhile, the passage of new sanctions on Iran's Oil sector by the US House, as reported by Bloomberg on Saturday, could also have implications for Oil prices, and restrict its ability to export crude Oil. This can reduce global Oil supply and contribute to upward pressure on prices. However, the impact of such sanctions on Oil prices depends on various factors, including the extent of the sanctions, and the response of other Oil-producing countries.
The expansion of secondary sanctions to cover transactions between Chinese financial institutions and sanctioned Iranian banks used for purchasing petroleum and Oil-derived products could indeed impact the crude Oil market.
On the demand side, the outlook for crude Oil is influenced by expectations regarding US monetary policy. The Federal Reserve's (Fed) indication that it may keep interest rates higher for longer, driven by concerns about persistent inflation, can affect the price of Oil. Higher interest rates tend to strengthen the US dollar (USD), making Oil more expensive for countries using other currencies, which can dampen global demand and contribute to lower prices.
The hawkish remarks from Federal Reserve officials, such as those made by Chicago Fed President Austan Goolsbee and Atlanta Fed President Raphael Bostic, reinforce expectations of a tighter monetary policy stance, which could further support the US dollar and potentially weigh on crude Oil prices.
- NZD/USD holds positive ground around near 0.5910 on the weaker USD on Monday.
- The recent New Zealand inflation data prompted speculation that the RBNZ might cut its rate in November.
- Fed’s Goolsbee signaled a longer timeline for interest rate cuts as progress on inflation had “stalled”.
The NZD/USD pair gains momentum near 0.5910 on Monday during the early Asian session. The recovery of the pair is bolstered by the risk-on sentiment and modest decline of the US dollar (USD). Traders await more evidence of inflation data for cues on the rates path ahead of a policy decision next week. The US Core Personal Consumption Expenditures Price Index (PCE) for March will be due on Friday.
The New Zealand inflation data last week showed that inflation has continued to fall, but remains above the Reserve Bank of New Zealand’s (RBNZ) target range of 1 to 3%. This triggered the expectation that the RBNZ might cut its Official Cash Rate (OCR) from the November meeting and provide some support to the New Zealand Dollar (NZD).
Furthermore, both Israel and Iran downplayed the possibility of escalating conflicts in the Middle East after Israel's apparently small strike on Iran, per Reuters. This development contributes to improving market sentiment and lifts riskier assets like the Kiwi.
On the other hand, Chicago Federal Reserve (Fed) President Austan Goolsbee on Friday hinted at a longer timeline for interest rate cuts as progress on inflation had “stalled". Goolsbee further stated that Inflation has significantly dropped from its pandemic-era peak of 9.1%, but remains stubbornly above the Fed’s target. The high-for-longer US rate narrative boosts the Greenback and creates a headwind for the NZD/USD pair.
On Monday, China's Ministry of Commerce implemented a new tariff on US imports. China has imposed a 43.5% tax on imports of propionic acid from the US. This chemical is widely used in a variety of industries, including food, feed, pesticides, and medicinal applications. The NZD/USD pair drifts higher despite the renewed trade war between the US and China.
- Gold price drifts lower on Monday amid hopes that the Iran-Israel conflict will not escalate further.
- Reduced Fed rate cut bets are keeping the US bond yields elevated and also exert pressure on the metal.
- The fundamental backdrop warrants caution before positioning for any further depreciating move.
Gold price (XAU/USD) kicks off the new week on a weaker note and, for now, seems to have snapped a two-day winning streak, though it remains confined in a familiar trading range held over the past week or so. Hopes for an Iran-Israel conflict de-escalation boost investors' confidence and turn out to be a key factor driving flows away from the safe-haven precious metal. Apart from this, bets that the Federal Reserve (Fed) will keep interest rates higher for longer in the wake of still sticky inflation in the US exert additional pressure on the non-yielding commodity.
The downside for the Gold price, however, seems cushioned amid speculations that major central banks will cut interest rates this year. Adding to this, worsening global economic conditions should contribute to limiting any meaningful depreciating move for the XAU/USD. Traders also seem reluctant and prefer to wait on the sidelines ahead of this week's release of flash global PMIs on Tuesday and important US macro data – the Advance Q1 GDP report and the Personal Consumption Expenditures (PCE) Price Index on Thursday and Friday, respectively.
Daily Digest Market Movers: Gold price is pressured by fading safe-haven demand, hawkish Fed expectations
- Iran signaled that it has no plans to retaliate against the Israeli limited-scale missiles strike on Friday, easing fears about a further escalation of geopolitical tensions in the Middle East and undermining the safe-haven Gold price.
- Investors have pushed back their expectations about the timing of the first interest rate cut by the Federal Reserve to September and also downsized bets for the number of rate cuts in 2024 to two, or around 40 basis points.
- Chicago Fed President Austan Goolsbee argued on Friday that progress on US inflation has stalled this year and that it would make sense to wait to get more clarity on the inflation outlook before taking a policy step.
- The yield on the benchmark 10-year US government bond stands tall near a multi-month peak, which, in turn, is seen acting as a tailwind for the US Dollar and exerting additional pressure on the non-yielding yellow metal.
- Concerns about slowing global economic growth support prospects for synchronized interest-rate cuts by most major central banks in the second half of this year, which, in turn, could lend support to the XAU/USD.
- Traders might also wait for this week's release of flash global PMI prints, the Advance US Q1 GDP report, and the US Personal Consumption Expenditures (PCE) Price Index before placing fresh directional bets.
Technical Analysis: Gold price oscillates in a one-week-old trading range, bullish potential seems intact
From a technical perspective, the range-bound price action witnessed over the past week or so constitutes the formation of a rectangle on short-term charts. Against the backdrop of the recent blowout rally, this might still be categorized as a bullish consolidation phase. Moreover, oscillators on the daily chart have eased from the overbought territory and suggest that the path of least resistance for the Gold price is to the upside. That said, bulls might wait for sustained strength and acceptance above the $2,400 mark – representing the top end of the trading range – before positioning for any further gains.
On the flip side, the lower boundary of the aforementioned range, around the $2,364-2,363 region, is likely to protect the immediate downside and act as a key pivotal point. A convincing break below might prompt some technical selling and drag the Gold price to the $2,325-2,322 area en route to the $2,300 round figure.
Gold FAQs
Gold has played a key role in human’s history as it has been widely used as a store of value and medium of exchange. Currently, apart from its shine and usage for jewelry, the precious metal is widely seen as a safe-haven asset, meaning that it is considered a good investment during turbulent times. Gold is also widely seen as a hedge against inflation and against depreciating currencies as it doesn’t rely on any specific issuer or government.
Central banks are the biggest Gold holders. In their aim to support their currencies in turbulent times, central banks tend to diversify their reserves and buy Gold to improve the perceived strength of the economy and the currency. High Gold reserves can be a source of trust for a country’s solvency. Central banks added 1,136 tonnes of Gold worth around $70 billion to their reserves in 2022, according to data from the World Gold Council. This is the highest yearly purchase since records began. Central banks from emerging economies such as China, India and Turkey are quickly increasing their Gold reserves.
Gold has an inverse correlation with the US Dollar and US Treasuries, which are both major reserve and safe-haven assets. When the Dollar depreciates, Gold tends to rise, enabling investors and central banks to diversify their assets in turbulent times. Gold is also inversely correlated with risk assets. A rally in the stock market tends to weaken Gold price, while sell-offs in riskier markets tend to favor the precious metal.
The price can move due to a wide range of factors. Geopolitical instability or fears of a deep recession can quickly make Gold price escalate due to its safe-haven status. As a yield-less asset, Gold tends to rise with lower interest rates, while higher cost of money usually weighs down on the yellow metal. Still, most moves depend on how the US Dollar (USD) behaves as the asset is priced in dollars (XAU/USD). A strong Dollar tends to keep the price of Gold controlled, whereas a weaker Dollar is likely to push Gold prices up.
- The Australian Dollar appreciates possibly due to improved risk sentiment amid de-escalated tensions in the Middle East.
- The Australian currency could face challenges on the market sentiment of RBA cutting policy rates before the year's end.
- The US Dollar may rebound as comments from Federal Reserve officials suggest a hawkish stance on monetary policy tightening.
The Australian Dollar (AUD) breaks its two-day losing streak on Monday amid risk-on sentiment, supported by indications of de-escalating geopolitical tensions. An Iranian official's statement suggesting no immediate plans for retaliation against Israeli airstrikes contributes to the improved sentiment.
The Australian Dollar may encounter challenges ahead, particularly as domestic inflation continues to moderate, aligning with the Reserve Bank of Australia's (RBA) latest forecasts. Furthermore, the persistently tight labor market could lead to calls for an RBA rate reduction before the year's end.
The US Dollar Index (DXY), which gauges the US Dollar (USD) against six major currencies, faces pressure despite the increase in US Treasury yields. However, the potential downside for the USD pair could be restrained by comments from Federal Reserve (Fed) officials suggesting a move toward a more hawkish stance.
Daily Digest Market Movers: Australian Dollar appreciates on improved risk sentiment
- The People's Bank of China maintained its Loan Prime Rates (LPR) at 3.45% on Monday. The LPR serves as a crucial benchmark rate for Chinese banks when determining the interest rates for loans offered to their clients. Given the significant economic ties between China and Australia, any changes in Chinese monetary policy have the potential to impact the Australian market.
- The Chinese Ministry of Commerce has announced a new tariff on US goods. Specifically, China has imposed a duty of 43.5% on imports of propionic acid from the United States. This chemical is extensively utilized in various sectors, including food, feed, pesticides, and medical applications, as per Reuters report.
- The Australian Dollar gains ground with no significant geopolitical developments over the weekend. As per “The Guardian” report, Antony Blinken, the US Secretary of State, urged for calm after an Iranian official stated that there is no immediate plan for retaliation to the reported Israeli missile strike. Blinken made these remarks while addressing the press on Friday after the G7 meeting of foreign ministers in Capri, Italy.
- Chicago Fed President Austan Goolsbee remarked on Friday that progress on inflation had "stalled," and the Federal Reserve's current restrictive monetary policy is appropriate. Meanwhile, Atlanta Fed President Raphael Bostic stated that the US central bank would refrain from cutting interest rates until the end of the year.
- Traders are expected to closely monitor upcoming Purchasing Managers Index (PMI) data from both countries on Tuesday, followed by the Australian Consumer Price Index (CPI) data on Wednesday and the US Gross Domestic Product Annualized on Thursday.
Technical Analysis: Australian Dollar remains below the major barrier of 0.6450
The Australian Dollar trades around 0.6440 on Monday. The AUD/USD pair remains below the major support region around 0.6456, along with the 14-day Relative Strength Index (RSI) remaining below the 50 level, suggesting a bearish sentiment. Notable support is identified at the psychological level of 0.6400. A break below the latter could put pressure on the AUD/USD pair to revisit the previous week’s low of 0.6362, followed by the major level of 0.6350.
On the upside, immediate resistance for the AUD/USD pair is anticipated at the major level of 0.6450, followed by the 14-day Exponential Moving Average (EMA) at 0.6476. A break above this level could lead the pair to reach the psychological level of 0.6500
AUD/USD: Daily Chart
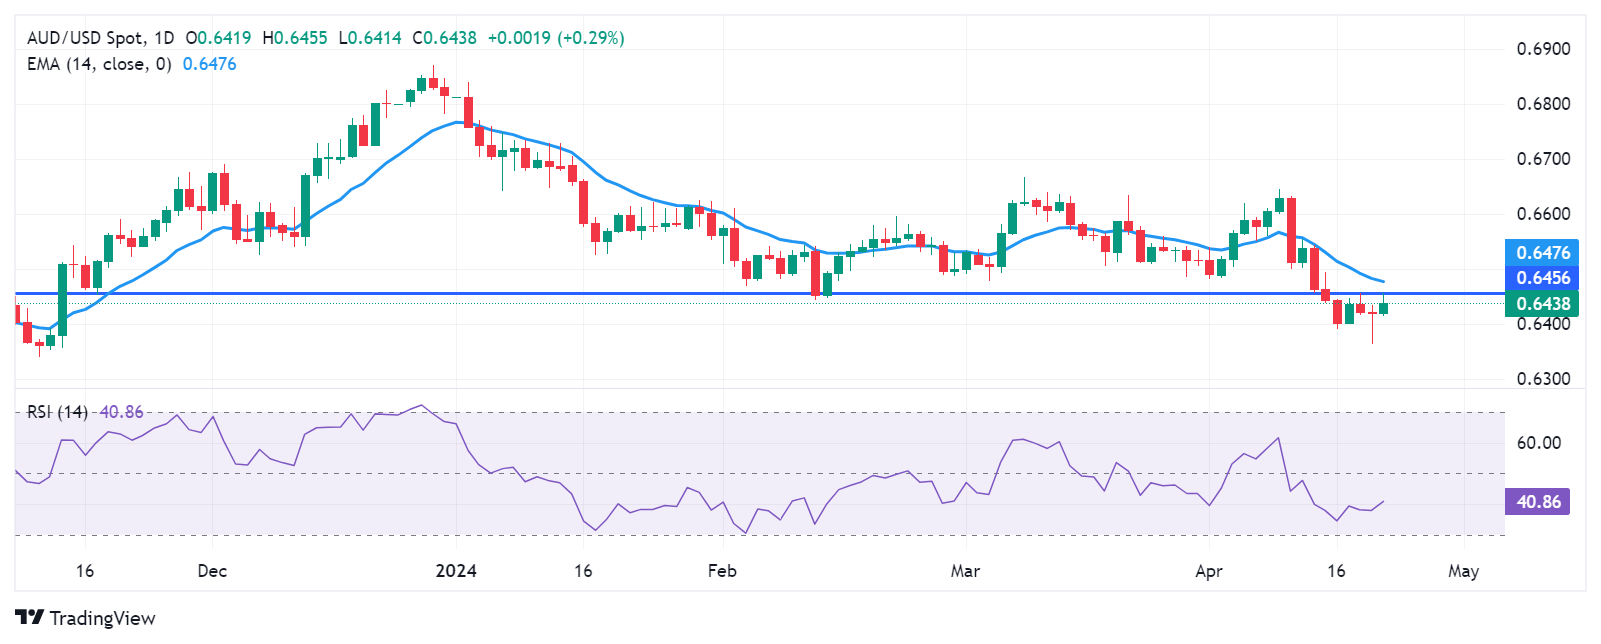
Australian Dollar price today
The table below shows the percentage change of Australian Dollar (AUD) against listed major currencies today. Australian Dollar was the strongest against the Swiss Franc.
| USD | EUR | GBP | CAD | AUD | JPY | NZD | CHF | |
| USD | -0.05% | -0.09% | -0.10% | -0.21% | 0.04% | -0.26% | 0.08% | |
| EUR | 0.05% | -0.04% | -0.05% | -0.14% | 0.09% | -0.20% | 0.13% | |
| GBP | 0.08% | 0.04% | -0.01% | -0.11% | 0.13% | -0.17% | 0.17% | |
| CAD | 0.10% | 0.05% | 0.01% | -0.11% | 0.14% | -0.16% | 0.18% | |
| AUD | 0.21% | 0.16% | 0.11% | 0.11% | 0.24% | -0.06% | 0.29% | |
| JPY | -0.04% | -0.09% | -0.13% | -0.15% | -0.25% | -0.30% | 0.04% | |
| NZD | 0.25% | 0.21% | 0.17% | 0.16% | 0.05% | 0.29% | 0.37% | |
| CHF | -0.08% | -0.14% | -0.17% | -0.18% | -0.28% | -0.03% | -0.33% |
The heat map shows percentage changes of major currencies against each other. The base currency is picked from the left column, while the quote currency is picked from the top row. For example, if you pick the Euro from the left column and move along the horizontal line to the Japanese Yen, the percentage change displayed in the box will represent EUR (base)/JPY (quote).
Australian Dollar FAQs
One of the most significant factors for the Australian Dollar (AUD) is the level of interest rates set by the Reserve Bank of Australia (RBA). Because Australia is a resource-rich country another key driver is the price of its biggest export, Iron Ore. The health of the Chinese economy, its largest trading partner, is a factor, as well as inflation in Australia, its growth rate and Trade Balance. Market sentiment – whether investors are taking on more risky assets (risk-on) or seeking safe-havens (risk-off) – is also a factor, with risk-on positive for AUD.
The Reserve Bank of Australia (RBA) influences the Australian Dollar (AUD) by setting the level of interest rates that Australian banks can lend to each other. This influences the level of interest rates in the economy as a whole. The main goal of the RBA is to maintain a stable inflation rate of 2-3% by adjusting interest rates up or down. Relatively high interest rates compared to other major central banks support the AUD, and the opposite for relatively low. The RBA can also use quantitative easing and tightening to influence credit conditions, with the former AUD-negative and the latter AUD-positive.
China is Australia’s largest trading partner so the health of the Chinese economy is a major influence on the value of the Australian Dollar (AUD). When the Chinese economy is doing well it purchases more raw materials, goods and services from Australia, lifting demand for the AUD, and pushing up its value. The opposite is the case when the Chinese economy is not growing as fast as expected. Positive or negative surprises in Chinese growth data, therefore, often have a direct impact on the Australian Dollar and its pairs.
Iron Ore is Australia’s largest export, accounting for $118 billion a year according to data from 2021, with China as its primary destination. The price of Iron Ore, therefore, can be a driver of the Australian Dollar. Generally, if the price of Iron Ore rises, AUD also goes up, as aggregate demand for the currency increases. The opposite is the case if the price of Iron Ore falls. Higher Iron Ore prices also tend to result in a greater likelihood of a positive Trade Balance for Australia, which is also positive of the AUD.
The Trade Balance, which is the difference between what a country earns from its exports versus what it pays for its imports, is another factor that can influence the value of the Australian Dollar. If Australia produces highly sought after exports, then its currency will gain in value purely from the surplus demand created from foreign buyers seeking to purchase its exports versus what it spends to purchase imports. Therefore, a positive net Trade Balance strengthens the AUD, with the opposite effect if the Trade Balance is negative.
- Indian Rupee kicks off the new week on a positive note on Monday.
- The speculation that the Fed will delay the interest rate cuts and the rising Middle East tension boosted the Greenback.
- Indian HSBC PMI data for April will be due on Tuesday.
Indian Rupee (INR) snaps the three-day winning streak on Monday. The hawkish tone of Federal Reserve (Fed) officials has prompted investors to dial back interest rate cut expectations, which boosts the US Dollar (USD). Additionally, the fear of oil supply disruption due to the ongoing geopolitical tensions in the Middle East has exerted some selling pressure on the INR as India is heavily dependent on oil imports. Nonetheless, the downside of INR might be capped due to the possibility that the Reserve Bank of India (RBI) would intervene heavily again to prevent the INR from depreciation.
Market players will focus on the preliminary India’s HSBC Purchasing Managers Index (PMI) for April, due on Tuesday. On the US docket, the Federal Reserve (Fed) will not speak during the blackout period. The S&P Global PMI for April will be released on Tuesday. The first reading of Gross Domestic Product (GDP) Annualized for the first quarter (Q1) will be published on Thursday. On Friday, the final reading of the US March Personal Consumption Expenditures Price Index (PCE) will be in the spotlight. The Core PCE inflation is expected to rise to 2.6% YoY.
Daily Digest Market Movers: The Indian Rupee weakens amid the multiple global factors
- India’s foreign exchange reserves contracted by $5.4 billion to $643.16 billion for the week ended on April 12, according to the Reserve Bank of India (RBI).
- RBI governor Shaktikanta Das cited robust growth in the Indian economy, underpinned by an upturn in manufacturing and the investment cycle, as grounds to keep interest rates on hold.
- RBI's monetary policy committee focuses on uncertainties like supply-side shocks, geo-political tensions, and financial market volatility to meet the 4% inflation target by carefully managing monetary policy tools such as the repo rate.
- Chicago Fed President Austan Goolsbee said that inflation progress had “stalled” and the Fed’s current restrictive policy is appropriate.
- Atlanta Fed President Raphael Bostic stated that the US central bank wouldn’t cut rates until the end of the year.
Technical analysis: USD/INR remains bullish in the long term
The Indian Rupee trades on a stronger note on the day. The positive outlook of USD/INR remains intact above the key 100-day Exponential Moving Average (EMA) on the daily timeframe. Furthermore, the 14-day Relative Strength Index (RSI) holds in bullish territory around 55.00, supporting the buyers for the time being.
A high of April 15 at 83.50 acts as an immediate resistance level for the pair. Extended bullish movement may provide an opportunity for USD/INR to reach an all-time high of 83.72. A clear break above this level will expose the 84.00 psychological level. On the flip side, the first downside target to watch is a low of April 11 at 83.30. Consistent trading below the mentioned level could lead to the 100-day EMA at 83.12.
US Dollar price today
The table below shows the percentage change of US Dollar (USD) against listed major currencies today. US Dollar was the strongest against the Swiss Franc.
| USD | EUR | GBP | CAD | AUD | JPY | NZD | CHF | |
| USD | -0.03% | -0.05% | -0.07% | -0.18% | 0.03% | -0.45% | 0.08% | |
| EUR | 0.03% | -0.02% | -0.04% | -0.14% | 0.06% | -0.17% | 0.11% | |
| GBP | 0.04% | 0.01% | -0.03% | -0.14% | 0.07% | -0.17% | 0.12% | |
| CAD | 0.07% | 0.04% | 0.02% | -0.11% | 0.09% | -0.15% | 0.15% | |
| AUD | 0.18% | 0.15% | 0.13% | 0.11% | 0.21% | -0.04% | 0.26% | |
| JPY | -0.03% | -0.06% | -0.09% | -0.11% | -0.21% | -0.25% | 0.05% | |
| NZD | 0.21% | 0.19% | 0.16% | 0.14% | 0.04% | 0.24% | 0.30% | |
| CHF | -0.08% | -0.11% | -0.13% | -0.15% | -0.25% | -0.05% | -0.28% |
The heat map shows percentage changes of major currencies against each other. The base currency is picked from the left column, while the quote currency is picked from the top row. For example, if you pick the Euro from the left column and move along the horizontal line to the Japanese Yen, the percentage change displayed in the box will represent EUR (base)/JPY (quote).
Indian Rupee FAQs
The Indian Rupee (INR) is one of the most sensitive currencies to external factors. The price of Crude Oil (the country is highly dependent on imported Oil), the value of the US Dollar – most trade is conducted in USD – and the level of foreign investment, are all influential. Direct intervention by the Reserve Bank of India (RBI) in FX markets to keep the exchange rate stable, as well as the level of interest rates set by the RBI, are further major influencing factors on the Rupee.
The Reserve Bank of India (RBI) actively intervenes in forex markets to maintain a stable exchange rate, to help facilitate trade. In addition, the RBI tries to maintain the inflation rate at its 4% target by adjusting interest rates. Higher interest rates usually strengthen the Rupee. This is due to the role of the ‘carry trade’ in which investors borrow in countries with lower interest rates so as to place their money in countries’ offering relatively higher interest rates and profit from the difference.
Macroeconomic factors that influence the value of the Rupee include inflation, interest rates, the economic growth rate (GDP), the balance of trade, and inflows from foreign investment. A higher growth rate can lead to more overseas investment, pushing up demand for the Rupee. A less negative balance of trade will eventually lead to a stronger Rupee. Higher interest rates, especially real rates (interest rates less inflation) are also positive for the Rupee. A risk-on environment can lead to greater inflows of Foreign Direct and Indirect Investment (FDI and FII), which also benefit the Rupee.
Higher inflation, particularly, if it is comparatively higher than India’s peers, is generally negative for the currency as it reflects devaluation through oversupply. Inflation also increases the cost of exports, leading to more Rupees being sold to purchase foreign imports, which is Rupee-negative. At the same time, higher inflation usually leads to the Reserve Bank of India (RBI) raising interest rates and this can be positive for the Rupee, due to increased demand from international investors. The opposite effect is true of lower inflation.
- USD/CAD faces challenges due to the weaker US Dollar despite higher US Treasury yields.
- The decline in WTI prices, attributed to de-escalated geopolitical tensions in the Middle East, restrains the upward momentum of the Canadian Dollar.
- The downside potential for the US Dollar may be limited as remarks from Fed officials indicate a hawkish stance on monetary policy tightening.
USD/CAD continues its decline for the fourth consecutive session, hovering around 1.3720 during Asian trading hours on Monday. This downward movement may be attributed to the subdued performance of the US Dollar (USD) despite the rise in US Treasury yields. However, the downside potential for the USD/CAD pair could be limited due to comments from Federal Reserve (Fed) officials hinting at a shift towards a more hawkish stance.
However, the Canadian Dollar's (CAD) gains may face limitations due to lower crude Oil prices, considering Canada's status as the largest oil exporter to the United States (US). West Texas Intermediate (WTI), the US crude Oil benchmark, trades around $81.50, reflecting a 0.66% decline on Monday, by the press time.
According to the Reuters report, the Iranian authorities have downplayed rumors regarding a drone attack by Israel. With no imminent threat of escalation in the conflict, the immediate risk aversion has gradually subsided, putting pressure on the USD/CAD pair.
Furthermore, data from Canada indicates a softening inflationary trend, underscoring the divergent monetary policy outlook between the Bank of Canada (BoC) and the US Federal Reserve (Fed). While interest rates in Canada are anticipated to decrease in the summer amid declining inflation and slower growth, the situation is increasingly different in the United States (US).
From the Federal Reserve’s officials, Chicago Fed President Austan Goolsbee remarked on Friday that progress on inflation had "stalled," and the Federal Reserve's current restrictive monetary policy is appropriate. Meanwhile, Atlanta Fed President Raphael Bostic stated that the US central bank would refrain from cutting interest rates until the end of the year.
- GBP/USD attracts some dip-buyers on Monday amid a softer USD, though lacks follow-through.
- Easing geopolitical tensions boosts investors’ confidence and undermines the safe-haven buck.
- Reduced Fed rate cut bets should help limit the USD losses and cap any further gains for the pair.
The GBP/USD pair stages a modest recovery from the 1.2365-1.2360 area, or its lowest level since November 14 touched during the Asian session on Monday and for now, seems to have snapped a two-day losing streak. The uptick is supported by a modest US Dollar (USD) downtick and lift spot prices back closer to the 1.2400 mark in the last hour, though any meaningful upside still seems elusive.
Iran signaled that it has no plans to retaliate against the Israeli limited-scale missiles strike on Friday, easing fears about a further escalation of tensions in the Middle East. This, in turn, boosts investors' confidence, which, in turn, is seen undermining the safe-haven Greenback and acting as a tailwind for the GBP/USD pair. Meanwhile, expectations that the Federal Reserve (Fed) will keep rates higher for longer in the wake of still-sticky inflation in the US help limit the USD downside and might cap the major.
Market participants have been pushing back their expectations about the likely timing when the Fed will start cutting rates to September and also downsizing their bets for the number of rate cuts this year. The hawkish outlook remains supportive of elevated US Treasury bond yields and acts as a tailwind for the buck. Apart from this, speculations about more aggressive policy easing by the Bank of England (BoE) might contribute to keeping a lid on any further appreciating move for the GBP/USD pair.
There isn't any relevant market-moving economic data due for release on Monday, either from the UK or the US, leaving spot prices at the mercy of the USD price dynamics. The focus, meanwhile, will remain glued to this week's important US macro data – the Advance Q1 GDP report and the Personal Consumption Expenditures (PCE) Price Index on Thursday and Friday, respectively. Apart from this, the flash UK/US PMI prints might provide some meaningful impetus to the GBP/USD pair.
- The Japanese Yen remains on the defensive amid the BoJ’s uncertain policy outlook.
- A positive risk tone also undermines the JPY, though intervention fears limit losses.
- Reduced Fed rate cut bets act as a tailwind for the USD and lend support to USD/JPY.
- Traders now seem reluctant ahead of this week’s key central bank event and data risks.
The Japanese Yen (JPY) kicks off the new week on a subdued note and remains pinned near a multi-decade trough against its American counterpart during the Asian session. The uncertainty over the Bank of Japan's (BoJ) further policy tightening and easing fears about a further escalation of geopolitical tensions in the Middle East turned out to be key factors undermining the JPY. That said, the BoJ Governor Kazuo Ueda's hawkish rhetoric and fresh warnings by Japanese Finance Minister Shunichi Suzuki against excessive currency market moves help limit deeper JPY losses.
Traders also seem reluctant to place fresh directional bets ahead of the crucial BoJ policy decision on Friday. Investors this week will also confront the release of important US macro data – the Advance Q1 GDP on Thursday and the Personal Consumption Expenditures (PCE) Price Index on Friday. In the meantime, investors have been pushing back their expectations about the timing of the first rate cut by the Federal Reserve (Fed) to September and downsizing bets for the number of rate cuts this year. This acts as a tailwind for the US Dollar (USD) and the USD/JPY pair.
Daily Digest Market Movers: Japanese Yen continues to be undermined by the divergent BoJ-Fed policy expectations
- Data released on Friday showed that Japan’s consumer inflation eased more than expected in March, raising uncertainty about whether the Bank of Japan will raise rates again and weighing on the Japanese Yen.
- Iran signaled that it has no plans to retaliate against the Israeli limited-scale missiles strike on Friday, which helps improve investors' appetite for riskier assets and further dents the JPY’s relative safe-haven status.
- BoJ Governor Kazuo Ueda said on Friday that the central bank might consider raising interest rates again if significant declines in the Yen substantially boost inflation, lending support to the domestic currency.
- Japan's Finance Minister Shunichi Suzuki issued fresh warnings to speculators about pushing down the JPY too much and reiterated that he would take appropriate action against excessive currency market moves.
- According to Fed funds futures, the Federal Reserve is now anticipated to cut interest rates by roughly 40 basis points (bps), or less than two cuts this year starting September in the wake of sticky US inflation.
- This suggests that the large rate differential between the US and Japan will stay, which should act as a headwind for the JPY and lend support to the USD/JPY pair ahead of the crucial BoJ monetary policy decision.
- Markets predict no policy change following last month’s historic decision to end the negative rate policy and Yield Curve Control (YCC) program, suggesting that the focus will remain on the quarterly outlook report.
- From the US, the Advance Q1 GDP print and the Personal Consumption Expenditures (PCE) Price Index are due for release on Thursday and Friday, respectively, which should influence the US Dollar price dynamics.
Technical Analysis: USD/JPY consolidates near multi-decade high amid slightly overbought RSI, bullish potential seems intact
From a technical perspective, the range-bound price action witnessed over the past week or so might still be categorized as a bullish consolidation phase against the backdrop of the recent rally from the March low. That said, oscillators on the daily chart are flashing overbought conditions and capping the upside for the USD/JPY pair. Nevertheless, the setup suggests that the path of least resistance for spot prices is to the upside, and any meaningful corrective pullback might still be seen as a buying opportunity near the 154.30 area. This should help limit the downside near the 154.00 mark, which, if broken, might expose Friday's swing low, around the 153.60-153.55 region. Some follow-through selling has the potential to drag the pair further towards the 153.30-153.25 intermediate support en route to the 153.00 round figure.
On the flip side, the multi-decade high, around the 154.75-154.80 region touched last week, could act as an immediate hurdle ahead of the 155.00 psychological mark. A sustained strength beyond the latter will confirm a fresh breakout through the short-term trading range and set the stage for an extension of a well-established appreciating trend.
Japanese Yen FAQs
The Japanese Yen (JPY) is one of the world’s most traded currencies. Its value is broadly determined by the performance of the Japanese economy, but more specifically by the Bank of Japan’s policy, the differential between Japanese and US bond yields, or risk sentiment among traders, among other factors.
One of the Bank of Japan’s mandates is currency control, so its moves are key for the Yen. The BoJ has directly intervened in currency markets sometimes, generally to lower the value of the Yen, although it refrains from doing it often due to political concerns of its main trading partners. The current BoJ ultra-loose monetary policy, based on massive stimulus to the economy, has caused the Yen to depreciate against its main currency peers. This process has exacerbated more recently due to an increasing policy divergence between the Bank of Japan and other main central banks, which have opted to increase interest rates sharply to fight decades-high levels of inflation.
The BoJ’s stance of sticking to ultra-loose monetary policy has led to a widening policy divergence with other central banks, particularly with the US Federal Reserve. This supports a widening of the differential between the 10-year US and Japanese bonds, which favors the US Dollar against the Japanese Yen.
The Japanese Yen is often seen as a safe-haven investment. This means that in times of market stress, investors are more likely to put their money in the Japanese currency due to its supposed reliability and stability. Turbulent times are likely to strengthen the Yen’s value against other currencies seen as more risky to invest in.
- AUD/JPY gains ground as no significant geopolitical developments over the weekend.
- US Secretary of State Antony Blinken called for calm after an Iranian official stated no immediate plan for retaliation.
- The Japanese Yen faces challenges as BoJ Governor Kazuo Ueda stated that the central bank must keep the loose monetary policy as underlying inflation remains below its 2% target.
AUD/JPY snaps its two-day losing streak on Monday as risk-on sentiment returned, with no significant geopolitical developments over the weekend. Antony Blinken, the US Secretary of State, urged for calm after an Iranian official stated that there is no immediate plan for retaliation to the reported Israeli missile strike. Blinken made these remarks while addressing the press on Friday after the G7 meeting of foreign ministers in Capri, Italy, as reported by "The Guardian".
The Australian Dollar (AUD) edges higher alongside the higher domestic equity market. The ASX 200 Index gains ground for the second consecutive session on Monday, with the increase in metals prices, including Iron Ore, Copper, and Gold. These movements coincide with a reduction in geopolitical tensions in the Middle East, which has uplifted market sentiment.
The Japanese Yen (JPY) encounters obstacles following dovish remarks from Bank of Japan (BoJ) Governor Kazuo Ueda during a seminar hosted by the Peterson Institute for International Economics on Friday, as per Reuters’ report. Ueda stated that the BoJ must sustain loose monetary policy for the foreseeable future as underlying inflation remains "somewhat below" its 2% target, and long-term inflation expectations are still close to 1.5%. He also indicated that the Japanese central bank is "very likely" to raise interest rates if underlying inflation continues to rise and may commence reducing its bond-buying in the future, although the timing remains undecided.
Daily Digest Market Movers: AUD/JPY appreciates on risk-on sentiment
- On Monday, the People's Bank of China maintained its Loan Prime Rates (LPR) at 3.45%. The LPR functions as a benchmark rate for Chinese banks in setting interest rates for loans extended to their clients. This decision could potentially influence the Australian market, given the close trade relationship between the two countries.
- The Chinese Ministry of Commerce has announced a new tariff on US goods. Specifically, China has imposed a duty of 43.5% on imports of propionic acid from the United States. This chemical is extensively utilized in various sectors including food, feed, pesticides, and medical applications.
- Japan’s National CPI, excluding fresh food but including fuel costs, increased 2.6% year-over-year in February, decelerating from a four-month high of 2.8% in January and falling below forecasts of 2.7%. The slowdown was attributed to mild increases in food prices, although it remained above the Bank of Japan’s 2% target due to the weakness of the Yen and high commodity prices.
- On Thursday, Bank of Japan board member Asahi Noguchi stated that the pace of future rate hikes would probably be much slower than that of its global counterparts in recent policy tightening. This is because the impact of rising domestic wages has yet to be fully transmitted to prices, as reported by Reuters.
- Analysts at Rabobank suggested that stronger Japanese economic data, coupled with stronger expectations that the Bank of Japan (BoJ) may raise rates again later this year, would likely provide the Japanese Yen (JPY) with broad-based strength. They posit that if Japanese real household incomes turn positive later this year, there is a possibility of another BoJ rate hike.
- According to a Westpac report, while the central bank signaled that rates are unlikely to be raised further, greater confidence in the inflation outlook is required before contemplating the possibility of rate cuts.
Technical Analysis: AUD/JPY moves above the major level of 99.50
The AUD/JPY traded around 99.70 on Friday. The breakthrough above the significant support level of 99.65, coupled with the 14-day Relative Strength Index (RSI) persisting above the 50 level, indicates an evolving bullish sentiment for the pair. The psychological level of 100.00 appears as the barrier, following the major level of 100.50 and April’s high of 100.81. On the downside, the AUD/JPY cross could find immediate support at the psychological level of 99.50. A break below this level could lead the pair to approach the psychological level of 99.00. A break below this level could push the pair to navigate the region around the 50-day Exponential Moving Average (EMA) at 98.67 and major level of 98.50.
AUD/JPY: Daily Chart
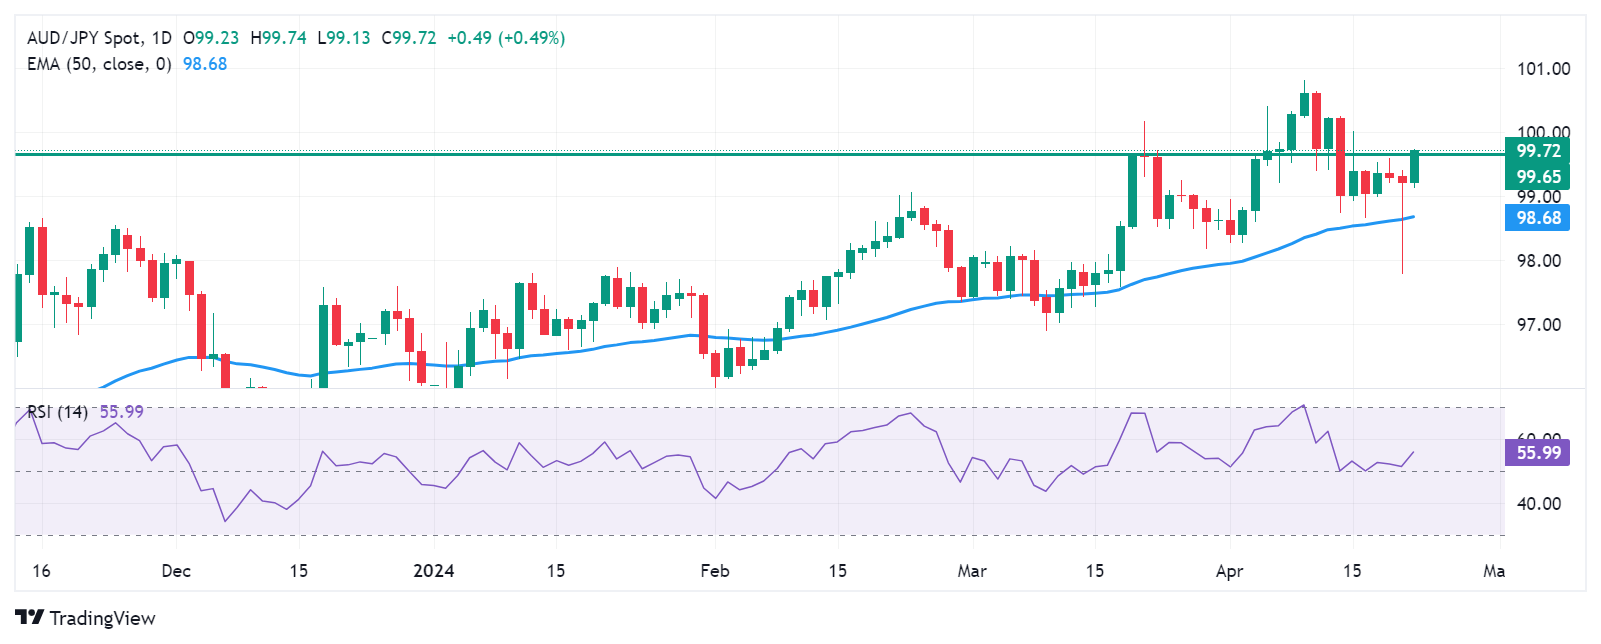
Australian Dollar price today
The table below shows the percentage change of Australian Dollar (AUD) against listed major currencies today. Australian Dollar was the strongest against the US Dollar.
| USD | EUR | GBP | CAD | AUD | JPY | NZD | CHF | |
| USD | -0.09% | -0.10% | -0.14% | -0.36% | -0.03% | -0.33% | -0.08% | |
| EUR | 0.09% | -0.01% | -0.05% | -0.26% | 0.06% | -0.23% | 0.00% | |
| GBP | 0.09% | 0.00% | -0.05% | -0.27% | 0.06% | -0.24% | 0.01% | |
| CAD | 0.13% | 0.04% | 0.04% | -0.22% | 0.10% | -0.19% | 0.05% | |
| AUD | 0.36% | 0.26% | 0.26% | 0.22% | 0.32% | 0.03% | 0.28% | |
| JPY | 0.03% | -0.06% | -0.07% | -0.11% | -0.33% | -0.30% | -0.06% | |
| NZD | 0.34% | 0.25% | 0.25% | 0.21% | -0.01% | 0.31% | 0.28% | |
| CHF | 0.08% | -0.02% | -0.02% | -0.06% | -0.28% | 0.04% | -0.24% |
The heat map shows percentage changes of major currencies against each other. The base currency is picked from the left column, while the quote currency is picked from the top row. For example, if you pick the Euro from the left column and move along the horizontal line to the Japanese Yen, the percentage change displayed in the box will represent EUR (base)/JPY (quote).
Australian Dollar FAQs
One of the most significant factors for the Australian Dollar (AUD) is the level of interest rates set by the Reserve Bank of Australia (RBA). Because Australia is a resource-rich country another key driver is the price of its biggest export, Iron Ore. The health of the Chinese economy, its largest trading partner, is a factor, as well as inflation in Australia, its growth rate and Trade Balance. Market sentiment – whether investors are taking on more risky assets (risk-on) or seeking safe-havens (risk-off) – is also a factor, with risk-on positive for AUD.
The Reserve Bank of Australia (RBA) influences the Australian Dollar (AUD) by setting the level of interest rates that Australian banks can lend to each other. This influences the level of interest rates in the economy as a whole. The main goal of the RBA is to maintain a stable inflation rate of 2-3% by adjusting interest rates up or down. Relatively high interest rates compared to other major central banks support the AUD, and the opposite for relatively low. The RBA can also use quantitative easing and tightening to influence credit conditions, with the former AUD-negative and the latter AUD-positive.
China is Australia’s largest trading partner so the health of the Chinese economy is a major influence on the value of the Australian Dollar (AUD). When the Chinese economy is doing well it purchases more raw materials, goods and services from Australia, lifting demand for the AUD, and pushing up its value. The opposite is the case when the Chinese economy is not growing as fast as expected. Positive or negative surprises in Chinese growth data, therefore, often have a direct impact on the Australian Dollar and its pairs.
Iron Ore is Australia’s largest export, accounting for $118 billion a year according to data from 2021, with China as its primary destination. The price of Iron Ore, therefore, can be a driver of the Australian Dollar. Generally, if the price of Iron Ore rises, AUD also goes up, as aggregate demand for the currency increases. The opposite is the case if the price of Iron Ore falls. Higher Iron Ore prices also tend to result in a greater likelihood of a positive Trade Balance for Australia, which is also positive of the AUD.
The Trade Balance, which is the difference between what a country earns from its exports versus what it pays for its imports, is another factor that can influence the value of the Australian Dollar. If Australia produces highly sought after exports, then its currency will gain in value purely from the surplus demand created from foreign buyers seeking to purchase its exports versus what it spends to purchase imports. Therefore, a positive net Trade Balance strengthens the AUD, with the opposite effect if the Trade Balance is negative.
- EUR/USD rebounds to 1.0665 amid the modest decline of the US Dollar.
- Several ECB policymakers favor high-interest rates for longer.
- Fed's Goolsbee said inflation progress had stalled and the Fed’s current restrictive policy is appropriate.
The EUR/USD pair trades on a stronger note around 1.0665 during the early Asian session on Monday. However, the pair’s upside might be limited due to the commentary from Federal Reserve (Fed) officials suggesting a shift to an increasingly hawkish stance. Investors will keep an eye on the preliminary Eurozone HCOB PMI for April on Tuesday ahead of the final reading of the US March Personal Consumption Expenditures Price Index (PCE) on Friday.
The European Central Bank (ECB) is expected to hold rates steady in its June meeting. The ECB delivered a firm message that markets should expect an interest rate cut soon if we don’t have a major shock in development. Meanwhile, François Villeroy de Galhau, governor of the Bank of France, stated the ECB should cut in June so that higher rates do not cause too much damage to the euro area economy. Joachim Nagel, president of Germany’s Bundesbank, commented that the “probability of June rate cut is increasing, adding that there were caveats, including the risk of higher oil prices.
However, ECB Governing Council member Madis Muller said that the central bank mustn’t rush into further interest rate cuts after a likely first step in June. Additionally, ECB policymaker Robert Holzmann, one of the most hawkish members, flagged geopolitical tensions as the biggest threat to interest rate cuts this year. The lower bets on rate cut expectations provide some support to the Euro (EUR) and
On the other hand, the hawkish remarks from the Federal Reserve (Fed) officials and the ongoing geopolitical tensions in the Middle East could lift the Greenback against its rivals. Chicago Fed President Austan Goolsbee said on Friday that inflation progress had “stalled” and the Fed’s current restrictive policy is appropriate. While Atlanta Fed Raphael Bostic stated that the US central bank wouldn’t cut rates until the end of the year.
China’s Commerce Ministry on Friday imposed a levy of 43.5% on imports of propionic acid from the United States. Propionic acid is commonly used in food, feed, pesticides and medical fields.
The Ministry attributed the imposition of tariffs to an investigation that found the Chinese domestic propionic acid industry was "materially damaged."
China’s Commerce Ministry warned Thursday that It firmly objects to the US raising tariffs and will take all necessary measures to protect its rights and interests.
Market reaction
Despite the simmering US-China trade war, AUD/USD is unperturbed and scales higher amid a better market mood and broad US Dollar weakness. At the time of writing, AUD/USD adds 0.44% on the day to trade at 0.6445.
The People's Bank of China announced on Monday that it maintained the Loan Prime Rate (LPR) unchanged across the time curve, as widely expected.
The Chinese central bank left the one-year and five-year LPR steady at 3.45% and 3.95%, respectively. The 5-year LPR was last cut in February by 25 basis points (bps) from 4.20% to 3.95%.
Market reaction
At the time of writing, AUD/USD is holding higher ground near 0.6441, adding 0.35% on the day.
ee
Australian Dollar FAQs
One of the most significant factors for the Australian Dollar (AUD) is the level of interest rates set by the Reserve Bank of Australia (RBA). Because Australia is a resource-rich country another key driver is the price of its biggest export, Iron Ore. The health of the Chinese economy, its largest trading partner, is a factor, as well as inflation in Australia, its growth rate and Trade Balance. Market sentiment – whether investors are taking on more risky assets (risk-on) or seeking safe-havens (risk-off) – is also a factor, with risk-on positive for AUD.
The Reserve Bank of Australia (RBA) influences the Australian Dollar (AUD) by setting the level of interest rates that Australian banks can lend to each other. This influences the level of interest rates in the economy as a whole. The main goal of the RBA is to maintain a stable inflation rate of 2-3% by adjusting interest rates up or down. Relatively high interest rates compared to other major central banks support the AUD, and the opposite for relatively low. The RBA can also use quantitative easing and tightening to influence credit conditions, with the former AUD-negative and the latter AUD-positive.
China is Australia’s largest trading partner so the health of the Chinese economy is a major influence on the value of the Australian Dollar (AUD). When the Chinese economy is doing well it purchases more raw materials, goods and services from Australia, lifting demand for the AUD, and pushing up its value. The opposite is the case when the Chinese economy is not growing as fast as expected. Positive or negative surprises in Chinese growth data, therefore, often have a direct impact on the Australian Dollar and its pairs.
Iron Ore is Australia’s largest export, accounting for $118 billion a year according to data from 2021, with China as its primary destination. The price of Iron Ore, therefore, can be a driver of the Australian Dollar. Generally, if the price of Iron Ore rises, AUD also goes up, as aggregate demand for the currency increases. The opposite is the case if the price of Iron Ore falls. Higher Iron Ore prices also tend to result in a greater likelihood of a positive Trade Balance for Australia, which is also positive of the AUD.
The Trade Balance, which is the difference between what a country earns from its exports versus what it pays for its imports, is another factor that can influence the value of the Australian Dollar. If Australia produces highly sought after exports, then its currency will gain in value purely from the surplus demand created from foreign buyers seeking to purchase its exports versus what it spends to purchase imports. Therefore, a positive net Trade Balance strengthens the AUD, with the opposite effect if the Trade Balance is negative.
On Monday, the People’s Bank of China (PBoC) set the USD/CNY central rate for the trading session ahead at 7.1043 as compared to Friday's fix of 7.1046 and 7.2359 Reuters estimates.
The European Central Bank (ECB) Governing Council member and the Estonian central bank chief, Madis Muller, said that the ECB mustn’t rush into further interest rate cuts after a likely first step in June.
Key quotes
“We should be careful not to move too quickly with the loosening of monetary policy and wait until the data gives us the necessary confidence that inflation is getting sustainably back to the target.”
“As long as economic developments are in line with our expectations, it is reasonable to expect a few more rate cuts after June by the end of the year.”
“But when and how many will depend on how the economic situation develops as we go along.”
Market reaction
These comments have little to no market reaction to the Euro. The EUR/USD pair is trading at 1.0655, unchanged for the day.
ee
ECB FAQs
The European Central Bank (ECB) in Frankfurt, Germany, is the reserve bank for the Eurozone. The ECB sets interest rates and manages monetary policy for the region. The ECB primary mandate is to maintain price stability, which means keeping inflation at around 2%. Its primary tool for achieving this is by raising or lowering interest rates. Relatively high interest rates will usually result in a stronger Euro and vice versa. The ECB Governing Council makes monetary policy decisions at meetings held eight times a year. Decisions are made by heads of the Eurozone national banks and six permanent members, including the President of the ECB, Christine Lagarde.
In extreme situations, the European Central Bank can enact a policy tool called Quantitative Easing. QE is the process by which the ECB prints Euros and uses them to buy assets – usually government or corporate bonds – from banks and other financial institutions. QE usually results in a weaker Euro. QE is a last resort when simply lowering interest rates is unlikely to achieve the objective of price stability. The ECB used it during the Great Financial Crisis in 2009-11, in 2015 when inflation remained stubbornly low, as well as during the covid pandemic.
Quantitative tightening (QT) is the reverse of QE. It is undertaken after QE when an economic recovery is underway and inflation starts rising. Whilst in QE the European Central Bank (ECB) purchases government and corporate bonds from financial institutions to provide them with liquidity, in QT the ECB stops buying more bonds, and stops reinvesting the principal maturing on the bonds it already holds. It is usually positive (or bullish) for the Euro.
Swiss National Bank (SNB) Chairman Thomas Jordan told Switzerland's national broadcast on Saturday that monetary policy should remain focused on price stability, per Reuters.
Key quotes
"In many countries, the debt level is too high, deficits are too big.”
"That cannot be sustainable and will have to be corrected in the future.”
"It is very important that at the same time, monetary policy remains geared towards price stability, rather than monetary policy being needed to finance debt, otherwise it will not end well.”
Market reaction
At the time of press, the USD/CHF pair was up 0.02% on the day at 0.9106.
SNB FAQs
The Swiss National Bank (SNB) is the country’s central bank. As an independent central bank, its mandate is to ensure price stability in the medium and long term. To ensure price stability, the SNB aims to maintain appropriate monetary conditions, which are determined by the interest rate level and exchange rates. For the SNB, price stability means a rise in the Swiss Consumer Price Index (CPI) of less than 2% per year.
The Swiss National Bank (SNB) Governing Board decides the appropriate level of its policy rate according to its price stability objective. When inflation is above target or forecasted to be above target in the foreseeable future, the bank will attempt to tame excessive price growth by raising its policy rate. Higher interest rates are generally positive for the Swiss Franc (CHF) as they lead to higher yields, making the country a more attractive place for investors. On the contrary, lower interest rates tend to weaken CHF.
Yes. The Swiss National Bank (SNB) has regularly intervened in the foreign exchange market in order to avoid the Swiss Franc (CHF) appreciating too much against other currencies. A strong CHF hurts the competitiveness of the country’s powerful export sector. Between 2011 and 2015, the SNB implemented a peg to the Euro to limit the CHF advance against it. The bank intervenes in the market using its hefty foreign exchange reserves, usually by buying foreign currencies such as the US Dollar or the Euro. During episodes of high inflation, particularly due to energy, the SNB refrains from intervening markets as a strong CHF makes energy imports cheaper, cushioning the price shock for Swiss households and businesses.
The SNB meets once a quarter – in March, June, September and December – to conduct its monetary policy assessment. Each of these assessments results in a monetary policy decision and the publication of a medium-term inflation forecast.
- Gold price trades on a softer note near $2,385 on Monday.
- The hawkish shift in market sentiment could dampen demand for yellow metal.
- The rising conflict between Israel and Iran might lift the gold price.
Gold Price (XAU/USD) attracts some sellers around $2,385 on Monday during the early Asian trading hours. The hawkish comments by Federal Reserve (Fed) officials have capped the precious metal’s upside. However, the escalating tensions in the Middle East might boost safe-haven assets like gold.
The probability that the US Fed will keep interest rates unchanged this year is rising. New York Fed President John Williams said last week that another rate hike isn’t his base case, but if the data are telling the Fed to hike to achieve its goals, then the Fed would obviously want to do that. Chicago Fed President Austan Goolsbee said that inflation progress had “stalled” and the Fed’s current restrictive policy is appropriate. Atlanta Fed President Raphael Bostic emphasized that the Fed wouldn’t cut rates until the end of the year. The hawkish shift in market sentiment could diminish the appeal of non-yielding metals and weigh on the gold price.
Geopolitical tensions between Israel and Iran intensified in recent weeks. A suspected Israeli attack on an Iranian consulate in Syria earlier this month was followed by Iran's retaliatory attack on Israel on April 13. Iran and Israel seem to have stepped back from the brink of a broader conflict as lawmakers in the US approved new Israeli military aid on Saturday. However, investors will monitor the developments surrounding the Middle East conflict. The rising tension in the region could boost the gold price, and traditional safe-haven assets.
| Pare | Closed | Change, % |
|---|---|---|
| AUDUSD | 0.64171 | -0.06 |
| EURJPY | 164.786 | 0.17 |
| EURUSD | 1.06569 | 0.12 |
| GBPJPY | 191.311 | -0.46 |
| GBPUSD | 1.23713 | -0.51 |
| NZDUSD | 0.58871 | -0.26 |
| USDCAD | 1.37482 | -0.13 |
| USDCHF | 0.91015 | -0.24 |
| USDJPY | 154.641 | 0.05 |


© 2000-2026. All rights reserved.
This site is managed by Teletrade D.J. LLC 2351 LLC 2022 (Euro House, Richmond Hill Road, Kingstown, VC0100, St. Vincent and the Grenadines).
The information on this website is for informational purposes only and does not constitute any investment advice.
The company does not serve or provide services to customers who are residents of the US, Canada, Iran, The Democratic People's Republic of Korea, Yemen and FATF blacklisted countries.
Making transactions on financial markets with marginal financial instruments opens up wide possibilities and allows investors who are willing to take risks to earn high profits, carrying a potentially high risk of losses at the same time. Therefore you should responsibly approach the issue of choosing the appropriate investment strategy, taking the available resources into account, before starting trading.
Use of the information: full or partial use of materials from this website must always be referenced to TeleTrade as the source of information. Use of the materials on the Internet must be accompanied by a hyperlink to teletrade.org. Automatic import of materials and information from this website is prohibited.
Please contact our PR department if you have any questions or need assistance at pr@teletrade.global.
transfers