- Analytics
- News and Tools
- Market News
Analytics, News, and Forecasts for CFD Markets: currency news — 26-05-2022.
- EUR/USD remains on the front foot around weekly/monthly top, sidelined of late.
- Softer USD, risk-on mood underpin the bullish bias targeting 50-DMA, early April’s low.
- Shrinking Fed vs. ECB divergence appears the key catalyst to recall bulls, highlighting US PCE Price Index for April.
EUR/USD grinds higher around the weekly top, as well as monthly high, recently steady around 1.0735 as bulls await fresh clues during a lackluster Asian session on Friday. The major currency pair cheered broad US dollar weakness, as well as the market’s optimism, to portray the run-up.
That said, the US Dollar Index (DXY) fades the mid-week bounce off the monthly low, dropping back to 101.78 at the latest, as market participants welcomed the lack of uncertainty over the Fed’s next move with zeal.
While portraying the mood, Wall Street benchmarks portrayed the second day of gains whereas the US 10-year Treasury yields remained indecisive around 2.75%. Further, S&P 500 Futures begins Friday without any major surprises around 4,055, down 0.05% intraday at the latest.
Also favoring the greenback bears were fears of an economic slowdown amid the recent raft of downbeat data. The US preliminary Q1 2022 Annualized GDP eased to -1.5%, below -1.4% prior and -1.3% forecasts, whereas a slump in the US Pending Home Sales for April, to -3.9% versus -2.0% forecast, also weighed on the greenback.
On a different page, recently hawkish comments from the European Central Bank (ECB) officials and the Eurozone diplomats, shrugging off recession fears due to the Russia-Ukraine crisis. The bloc’s policymakers also teased rate hikes of late and cut the monetary policy divergence between the US Federal Reserve (Fed) and the ECB, which bolstered the EUR/USD prices.
To sum up, EUR/USD prices are likely to remain firmer as the ECB vs. Fed drama turned in favor of the bloc. However, today’s US inflation data is the Fed’s preferred gauge of price pressure and may change the show of appeared extreme, expected at 4.9% YoY versus 5.2% prior. Also important will be the Fedspeak and the geopolitical headlines concerning China and Russia.
Read: US Core PCE Preview: Why there is room for a dollar-lifting upside surprise
Technical analysis
Bullish MACD and RSI (14) back the clear break of a monthly horizontal hurdle to keep buyers hopeful of crossing the 50-DMA level surrounding 1.0750. However, lows marked during early April, near 1.0760, could probe the bulls before March’s low of 1.0806.
Alternatively, a fortnight-old support line, near 1.0650, could test the pullback moves before the aforementioned horizontal resistance-turned-support around 1.0640.
US inflation expectations, as per the 10-year breakeven inflation rate per the St. Louis Federal Reserve (FRED) data, rose for the second consecutive day by the end of Thursday’s North American session.
That said, the inflation gauge rose from 2.56% to 2.62% at the latest as traders await the Fed’s preferred inflation barometer, namely the US Core Personal Consumption Expenditure (PCE) Price Index for April, for better decision-making.
It’s worth noting that the recently downbeat US data and confirmations of the Fed’s 50 bps rate hikes in the next two meetings favored market sentiment and dragged the US dollar.
While portraying the mood, Wall Street benchmarks portrayed the second day of gains whereas the US 10-year Treasury yields remained indecisive around 2.75%. Further, S&P 500 Futures begins Friday without any major surprises around 4,055, down 0.05% intraday at the latest.
To sum up, the recently firmer inflation expectations may help the US dollar consolidate weekly losses amid the market’s anxiety ahead of the key data.
Read: US Core PCE Preview: Why there is room for a dollar-lifting upside surprise
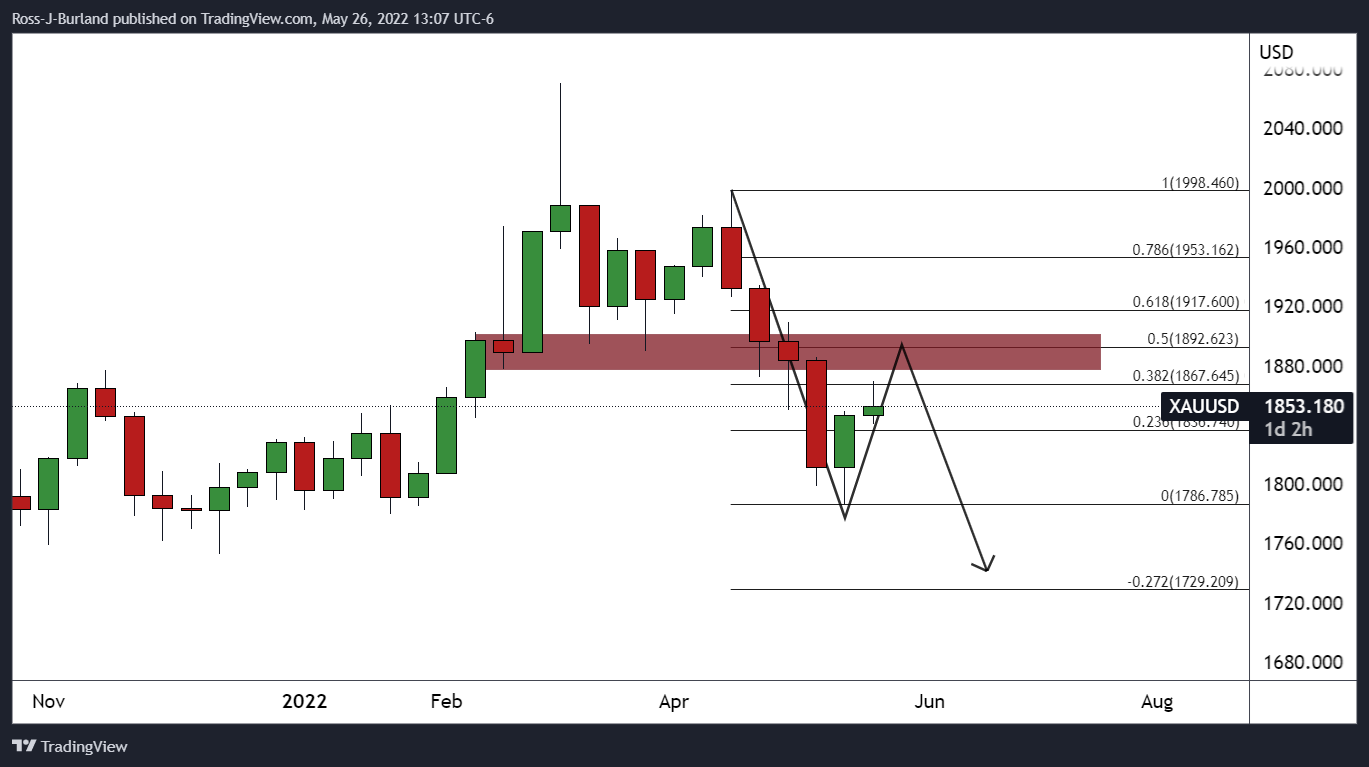
- Gold price has attracted bids to near $1,850.00 on broader weakness in the DXY.
- Poor GDP numbers and flat PCE figure has dented the demand for the DXY.
- In today’s session, US Core PCE and Michigan CSI are in focus.
Gold price (XAU/USD) witnessed a minor pullback towards $1,850.00 in its initial trading hours but has bounced back sharply. The precious metal is displaying a balance auction in a range of $1,840.76-1,856.35 from Wednesday amid the unavailability of any potential trigger that could provide a direction to the asset. Also, the release of the US Gross Domestic Product (GDP) numbers and Personal Consumption Expenditure (PCE) figures on Thursday failed to provide any meaningful move in the counter.
The annualized US GDP landed at -1.5%, lower than the estimates of -1.3% and the prior print of -1.4%. An underperformance on the GDP front didn’t bring a supportive move in the asset. Apart from that, the precious metal didn’t respond to the unchanged PCE numbers.
On the dollar front, the US dollar index (DXY) is established below 102.00. The DXY is expected to extend its losses after slipping below Tuesday’s low at 101.65. A firmer rebound in the positive market sentiment brought some significant offers to the counter.
On Friday, investors will keep the Core Personal Consumption Expenditure (PCE) Price Index on their radar, which may tumble to 4.9% against the prior print of 5.2%. Apart from that, Michigan Consumer Sentiment Index (CSI) will remain in focus, which is seen unchanged at 59.1.
Gold technical analysis
On an hourly scale, gold prices are trading in a consolidation range of $1,840.76-1,856.35 near the upward sloping trendline placed from May 16 low at $1,786.94, adjoining May 19 low at $1,811.01. The 20- and 50-period Exponential Moving Averages (EMAs) have given a bearish crossover at $1,856.23, which adds to the downside filters. Meanwhile, the Relative Strength Index (RSI) (14) is oscillating in a no trading zone.
Gold hourly chart
-637892043162561320.png)
- WTI remains sidelined after rising the most in a fortnight.
- Break of two-month-old descending trend line, bullish MACD signals favor buyers.
- Rising wedge can test buyers on the way to late March swing high.
WTI struggles to extend the upside break of the key hurdle, grinds higher around the two-month top during Friday’s Asian session. That said, the black gold seesaws near $113.10 at the latest.
Given the firmer RSI (14), not overbought, joining the bullish MACD signals to back WTI’s latest breakout, the commodity prices are likely to extend the run-up.
However, a six-week-old rising wedge bearish chart pattern tests the upside momentum, with the formation’s resistance line near $114.90 acting as an immediate hurdle.
Also challenging the short-term WTI buyers is March’s high near $115.90, a break of which will allow the bulls to aim for the yearly top marked in March near $129.45.
Meanwhile, pullback moves remain elusive beyond the resistance-turned-support line from March 24, around $112.55 by the press time.
Following that, the 10-DMA and support line of the aforementioned wedge, respectively near $110.35 and $108.75, will be crucial to watch.
Should the quote drops past $108.75, it confirms the rising wedge and becomes vulnerable to testing April’s low near $92.65.
WTI: Daily chart
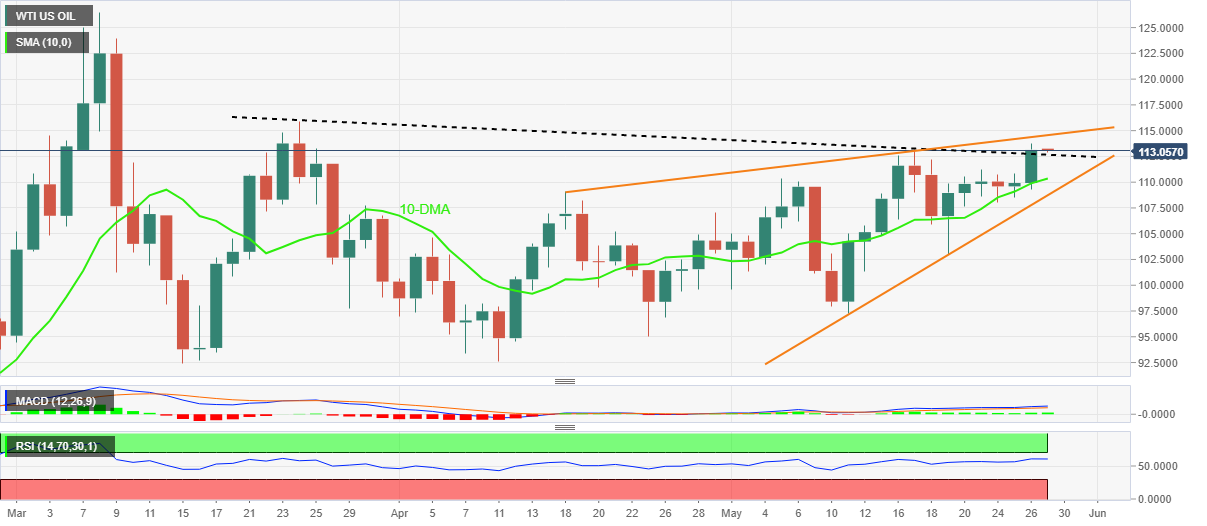
Trend: Further upside expected
“Chinese Premier Li Keqiang warned of dire consequences if officials don’t move decisively to prevent the economy from sliding further, saying a contraction in the second quarter must be avoided,” said Bloomberg.
The news also adds that Li’s comments at an emergency meeting Wednesday were more frank than the official readout published by state media.
Key quotes
He said China will pay a huge price with a long road to recovery if the economy can’t keep expanding at a certain rate.
That means growth must be positive in the second quarter, he said, according to the people, who declined to be identified in order to discuss official matters.
The remarks reinforce economists’ expectations that the government’s growth target this year of about 5.5% is increasingly out of reach.
Li listed a handful of objectives for local officials to focus on this year, including better balancing Covid controls and economic growth.
Li said the spike in the jobless rate -- it hit 6.1% in April, close to a record -- would bring about grave consequences.
Li also stressed the need to ensure grain output does not fall below last year’s levels, as such production is key to keeping inflation in check.
FX implications
The news seems to have a negative impression on the AUD/USD traders, due to Australia’s trade ties with China. Even so, the Aussie pair remains sidelined at around 0.7100 during the early Friday’s Asian session.
Read: AUD/USD bulls flirt with 0.7100 with eyes on Aussie Retail Sales, US PCE Inflation
- The EUR/JPY remains firm in the week, advancing 1.02%.
- On Thursday, BoJ Kuroda’s hawkish commentary did not weigh on the EUR/JPY.
- EUR/JPY Price Analysis: To fall towards 132.50 once the rising wedge break is achieved.
The EUR/JPY marches firmly inside a “rising wedge” above the 50-day moving average (DMA), advancing for the third day out of five, but remains below the weekly highs reached on May 23, at 136.79, and since then, the cross-currency has been unable to approach those levels. At 136.31, the EUR/JPY edges higher some 0.03% as the Asian Pacific session begins.
Sentiment-wise, investors’ spirits are upbeat after Wall Street registered hefty gains on Thursday, and Asian equity futures prepare to open higher. Wednesday’s release of the US Federal Reserve minutes did not change what Fed policymakers have expressed since May 5 and, in fact, reaffirmed that the US central bank would hike 0.50% in each of the June and July meetings.
Elsewhere, the EUR/JPY recovered from Wednesday’s losses, despite hawkish commentary from the Bank of Japan (BoJ) Governor Haruiko Kuroda, who said that “When debating exit strategy, key will be how to raise rates and reduce BOJ’s balance sheet.”
Also read: BOJ’s Kuroda: Don’t expect inflation to stay around 2% next year, and the year after
EUR/JPY Price Forecast: Technical outlook
EUR/JPY price action remains confined within the boundaries imposed by the “rising wedge” formed in the daily chart. Usually, the aforementioned chart pattern has a bearish bias. However, EUR/JPY traders need to be attentive to the cross-currency price action near the 50-day moving average (DMA) at 135.93, which could be difficult to break for EUR/JPY bears on their way to achieving a downward break of the pattern.
In the case of that event playing out, the EUR/JPY first support would be the 50-DMA at 135.93. A breach of the latter would send the cross towards the May 20 daily low at 134.58. Once cleared, the following support would be the confluence of the May 12 low and the 100-DMA around the 132.65-81 area.
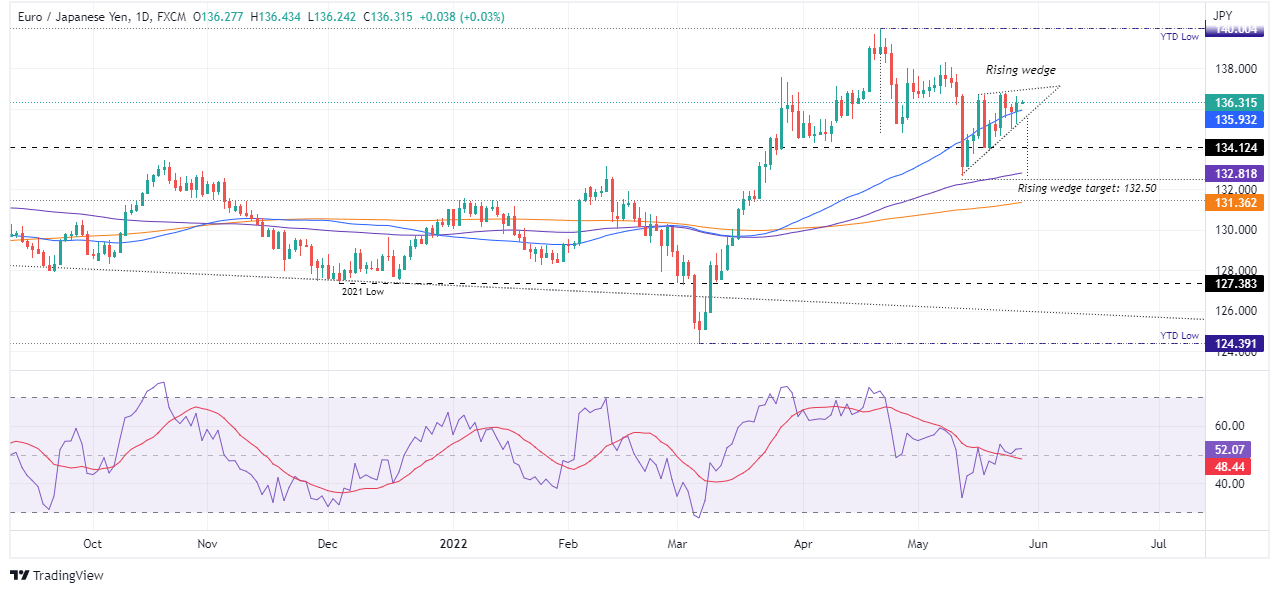
Key Technical Level
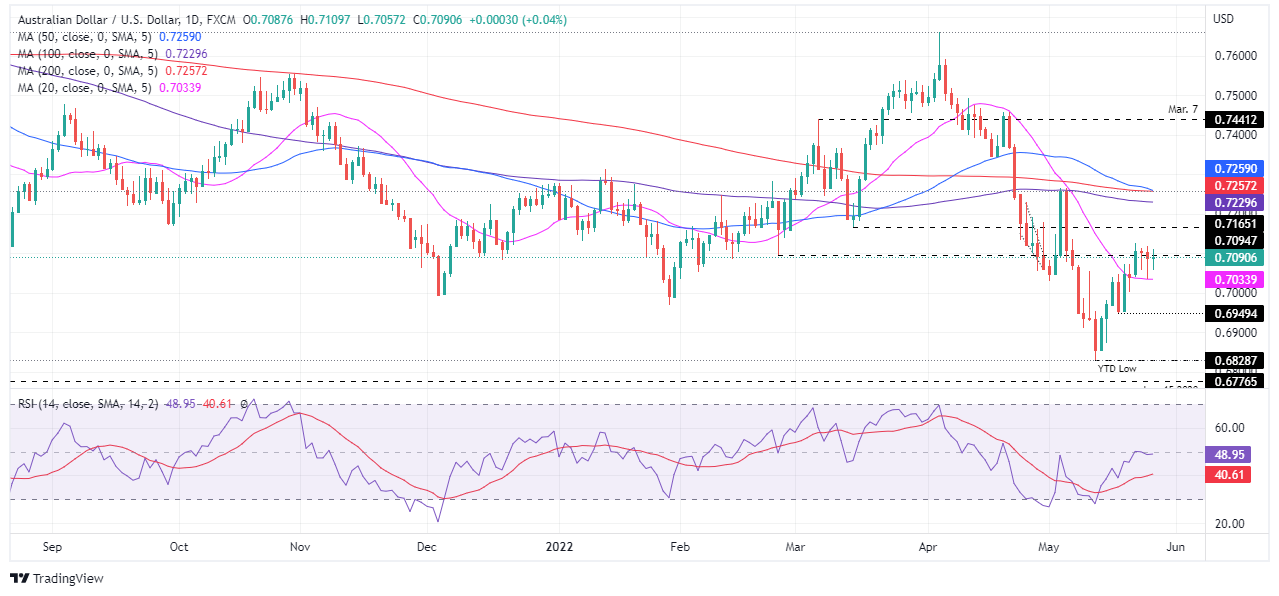
- AUD/USD fails to cheer equity gains amid market’s indecision, growth fears.
- Softer US GDP, housing data join repetitive Fedspeak to underpin US dollar weakness.
- Market sentiment improves despite recession woes, known path for Fed, downbeat US data play their role.
- Australia’s Retail Sales for April may entertain intraday traders ahead of Fed’s preferred version of inflation.
AUD/USD holds onto the recently sidelined moves around 0.7100 as bulls and bears jostle over mixed clues heading into the key data on Friday. Also restricting the Aussie prices are downbeat statistics at home and looming economic fears over the largest customer China, not to forget uncertainty in the markets.
Although the softer US data helped the AUD/USD pair to recover early losses on Thursday, the pair remains capped below 0.7100 as traders recollect downbeat figures at home. That said, Australia’s Private Capital Expenditure (CAPEX) for Q1 2022 dropped below 1.5% expected to -0.3%. On the other hand, the US preliminary Q1 2022 Annualized GDP eased to -1.5%, below -1.4% prior and -1.3% forecasts. Further, a slump in the US Pending Home Sales for April, to -3.9% versus -2.0% forecast also weighed on the greenback.
Elsewhere, market sentiment remained positive, as traders feel relieved in predicting the Fed’s next move with more accuracy, mainly supported by the repeated Fedspeak of 50 bps move and downbeat US data. It’s worth noting, however, that the looming fears of economic recession in the US and China probe the AUD/USD bulls due to trade ties with Beijing and also being a risk barometer pair.
Amid these plays, Wall Street benchmarks portrayed the second day of gains whereas the US 10-year Treasury yields remained indecisive around 2.75%. Further, S&P 500 Futures begins Friday without any major surprises around 4,055, down 0.05% intraday at the latest.
Moving on, Australia’s Retail Sales for April, expected 0.9% versus 1.6% prior, will offer immediate directions to the AUD/USD pair, especially after recently softer Aussie data. Also important will be the Fedspeak and the geopolitical headlines concerning China and Russia, not to forget the US Core Personal Consumption Expenditure (PCE) Price Index for April, expected at 4.9% YoY versus 5.2% prior.
Read: US Core PCE Preview: Why there is room for a dollar-lifting upside surprise
Should the scheduled Aussie figures came in softer, the bears may have an upper hand after multiple days of struggle for entry.
Technical analysis
AUD/USD buyers seem running out of fuel after rising to 0.7127 on Monday. Even so, a convergence of the 21-DMA and previous resistance line from early April, around 0.7030, becomes necessary for the bear’s entry.
- A formation of a Falling Channel is advocating the yen bulls.
- Investors should brace for a death cross formation, which will strengthen yen further.
- The RSI (14) is expected to weaken the greenback after a prompt action below 40.00.
The USD/JPY pair is attempting to rebound after a minor correction from 127.40 in early Tokyo. A rangebound move has been observed this week as the asset has remained in a bracket of 126.36-127.48. The volatility has been contracted sharply investors are bracing for wild moves going forward.
A Falling Channel chart formation on a four-hour scale is advocating the dominance of the yen bulls in the upcoming trading sessions. The upper boundary of the Rising Channel is placed from May 11 high at 130.81 while the lower boundary is plotted from May 4 low at 128.63. The asset is displaying back and forth moves in a 126.36-127.48 range near its crucial support at 126.97.
The 50- and 200-period Exponential Moving Averages (EMAs) are expected to display the death cross formation, which will strengthen the Japanese yen against the greenback further.
Meanwhile, the Relative Strength Index (RSI) is oscillating in a 40.00-60.00 range, which signals topsy-turvy moves in the asset. A decisive slippage below 40.00 will bring a prompt downside action into the asset.
Investors should tighten their shorts if the asset drops below Tuesday’s low at 126.36, which will drag the asset towards March 28 high at 125.10, followed by April 1 high at 123.04.
On the flip side, the greenback bulls could take the charge if the asset oversteps May 19 high at 128.95, which will drive the asset towards May 17 high at 129.78. A breach of the latter will expose the asset to recapture its multi-year high at 131.28.
USD/JPY four-hour chart
-637892013840381041.png)
- GBP/USD grinds higher at three-week top, eyes further gains.
- UK government announced multiple measures to help the most vulnerable households.
- US Dollar Index remains pressured around monthly low amid risk-on mood, downbeat US data.
- Fed’s preferred inflation gauge eyed for further USD weakness.
GBP/USD remains on the way to a monthly high, after rising for three consecutive days to a three-week top, as the UK’s aid package joins broad US dollar weakness. That said, the cable pair grinds higher around 1.2600 by the press time of early Friday morning in Asia.
UK’s Chancellor Rishi Sunak announced multiple measures to tame the cost of living on Thursday. The government’s temporary levy on energy profits and targeted support to the most vulnerable households in the UK are some of the measures that favored the cable bulls the previous day.
It’s worth noting that the recently hawkish BOE and comparatively less appreciation for the Fed’s 50 bps rate-hike plans also underpin the GBP/USD pair’s latest advances.
On the other hand, the US Dollar Index (DXY) reversed Wednesday’s rebound from the monthly low as the US preliminary Q1 2022 Annualized GDP eased below -1.4% prior and -1.3% forecasts to -1.5%. Further, a slump in the US Pending Home Sales for April, to -3.9% versus -2.0% forecast also weighed on the greenback.
Elsewhere, market sentiment remained positive, as traders feel relieved in predicting the Fed’s next move with more accuracy. Also, downbeat US data and an absence of major data played their roles to underpin the GBP/USD upside.
While portraying the mood, Wall Street benchmarks portrayed the second day of gains whereas the US 10-year Treasury yields remained indecisive around 2.75%.
Looking forward, Fedspeak and the geopolitical headlines concerning China and Russia will be crucial for short-term GBP/USD moves. Above all, the US Core Personal Consumption Expenditure (PCE) Price Index for April, expected at 4.9% YoY versus 5.2% prior, will be crucial amid the latest run of softer US data weighing on the greenback.
Read: US Core PCE Preview: Why there is room for a dollar-lifting upside surprise
Technical analysis
Sustained trading beyond the fortnight-old rising support line, near 1.2575, directs GBP/USD buyers towards the monthly high near 1.2640. However, bulls remain unconvinced below a downward sloping trend line from late February, around 1.2740.
- The AUD/JPY is recording gains of 0.17% during the week.
- Despite an upbeat market sentiment, the AUD/JPY failed to break above crucial resistance above 91.72.
- AUD/JPY Price Forecast: Range-bound in a congestion area, preceded by an uptrend; an upward break looms.
The AUD/JPY barely moves as the Asian Pacific session begins, though on Thursday ended recording minimal losses, despite an upbeat market mood, mainly ignored by FX traders, as the sentiment in the FX complex was mixed. At 90.25, the AUD/JPY posts minimal gains of 0.08%.
US equities finished with gains, between 1.61% and 2.68%, eyeing to end the week on a higher note. Meanwhile, Asian stock indexes are poised for a higher open. Now that the Federal Reserve has released its May Meeting Minutes, investors have become more confident that Fed officials have set the pace of rate hikes, as Fed speakers expressed since May 5.
AUD/JPY Price Forecast: Technical outlook
Turning to Price action, the AUD/JPY has failed to reclaim above the 50-day moving average (DMA) at 91.72, and the cross-currency weekly high is the May 23 daily peak at 91.04. AUD/JPY traders need to be aware that the pair is consolidating in the 89.08-91.15 range, but market mood and the lack of a catalyst keep the pair range-bound. Nevertheless, the previously-mentioned congestion area is preceded by an uptrend, meaning that an upside break would aim towards the measured distance of the high-low of that range, being 93.20, the measured target, short of the May 5 swing low at 94.02.
However, if that scenario is about to play out, as of today, the AUD/JPY’s first resistance would be the May 23 daily high at 91.04. Break above would expose the 50-DMA at 91.72. Once that supply zone is cleared, there’s nothing on the way up to the measured 93.20 targets.
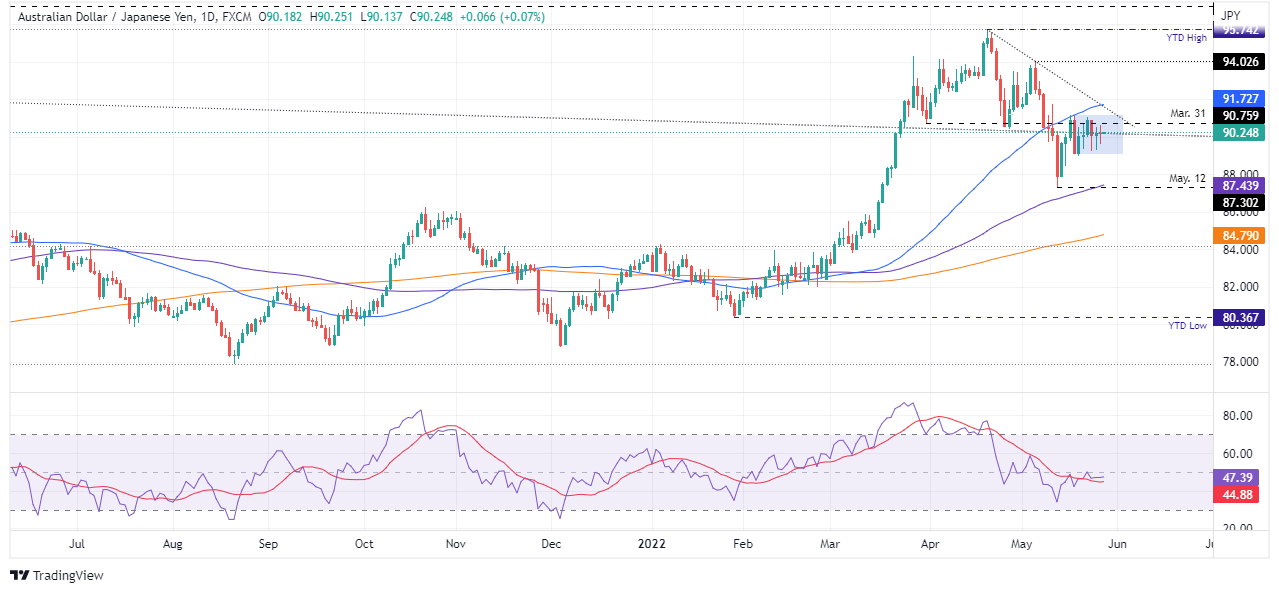
Key Technical Levels
- EUR/USD's market structure is now bullishon the daily chart.
- EUR/USD's support near 1.0705 could offer a base from which bulls can engage in order to target the 1.08 areas.
As per the prior analysis, EUR/USD Price Analysis: Traders looking for a catalyst from the Fed, bulls on a knife's edge, the euro, following initial mitigation of some upside eventually melted to the downside into the targetted area of 1.0640.
EUR/USD prior analysis
''The bearish head and shoulders are a topping pattern that currently features in the 15-min time frame. A break of the neckline near 1.0725 could spell trouble for the committed bulls. A break of 1.0705 will likely open the way for further supply to mitigate the price imbalance towards a 38.2% Fibonacci retracement of the daily bullish breakout impulse near 1.0665 that guards a 50% mean reversion to 1.0640.''
Subsequent price action:
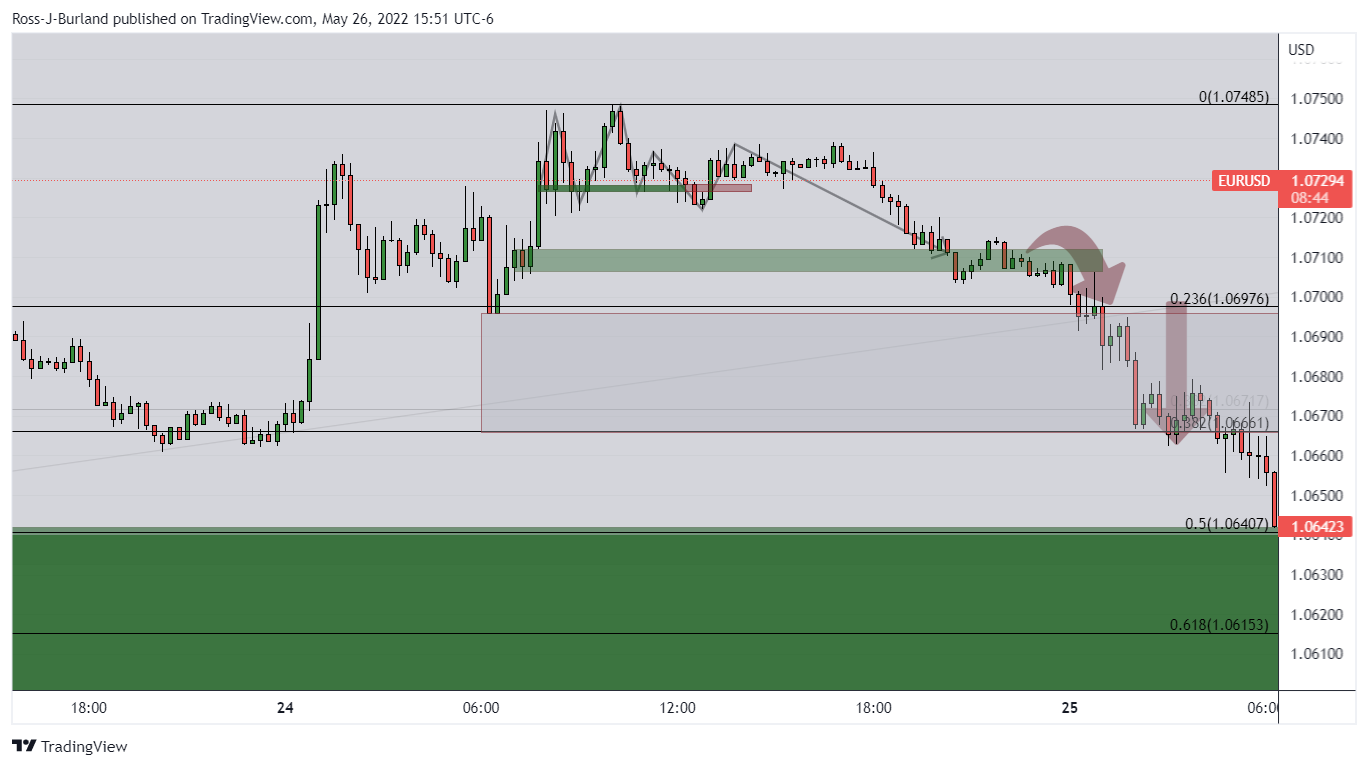
For the FOMC minutes, the pair was based at the targetted support area and there were prospects of a higher correction from support:
Immediately following the minutes the price indeed resumed the upside:
This now invalidates the immediate bearish outlook and leaves a bullish daily continuation on the map:
EUR/USD daily chart

The price broke the horizontal resistance that is now responding as a support zone on the retest. The bulls have committed to the course and a run into prior support and resistance between 1.0761 and 1.0936 could be in order with the 1.08 figure a key target.
EUR/USD H4 chart

The Information's neckline near 1.0705 could offer a base from which bulls can engage in order to target the 1.08 areas.
- NZD/USD is aiming to recapture 0.6500 as the risk-on impulse is dominating the FX domain.
- A spree of jumbo rate hikes by the RBNZ has triggered the recession fears.
- The DXY is expected to report more losses on weak economic data.
The NZD/USD pair is advancing gradually higher in the early Asian session after hitting a low of 0.6455 on Thursday. The pair is displaying a consolidation on a broader note and eventually a squeeze in volatility, which will be followed by a breakout in the same. The trading range in the asset after the monetary policy announcement by the Reserve Bank of New Zealand (RBNZ) has been 0.6437-0.6500.
It seems like a set trading range after the announcement of the interest rate decision by the RBNZ has puzzled the market participants as they are unable to decide whether to ditch kiwi bulls or not. The RBNZ featured a consecutive Official Cash Rate (OCR) hike by 50 basis points (bps) as the central bank is deploying all necessary measures to contain the soaring inflation. However, a spree of prompt actions by the RBNZ by stepping up their OCR has pressed the recession button. The continuation of an extreme hawkish monetary policy by the RBNZ will squeeze liquidity from the market swiftly and the unavailability of the dirt-cheap money will force the corporate to stick to multi-filtered investments.
Meanwhile, the US dollar index (DXY) is expected to refresh its monthly lows amid positive market sentiment. The risk-on impulse has diminished the safe-haven’s appeal. The DXY has been hammered on Thursday on lower than expected Gross Domestic Product (GDP) numbers. The annualized GDP landed at -1.5% vs. -1.3% as expected. Also, the Personal Consumption Expenditure (PCE) prices remained stable at 7%.
Going forward, investors will focus on the Core PCE Price Index, which may tumble to 4.9% against the prior print of 5.2%. Apart from that, Michigan Consumer Sentiment Index (CSI) will hog the limelight, which is seen unchanged at 59.1.
- USD/CAD is in the hands of the bears but a correction could be in the making.
- The daily chart remains bullish but the hourly bearish impulse may have run its course.
USD/CAD's bearish hourly impulse is starting to decelerate which could lead to a correction for the coming sessions to end the week. The following illustrates the market structure from both a daily and hourly perspective.
USD/CAD daily chart
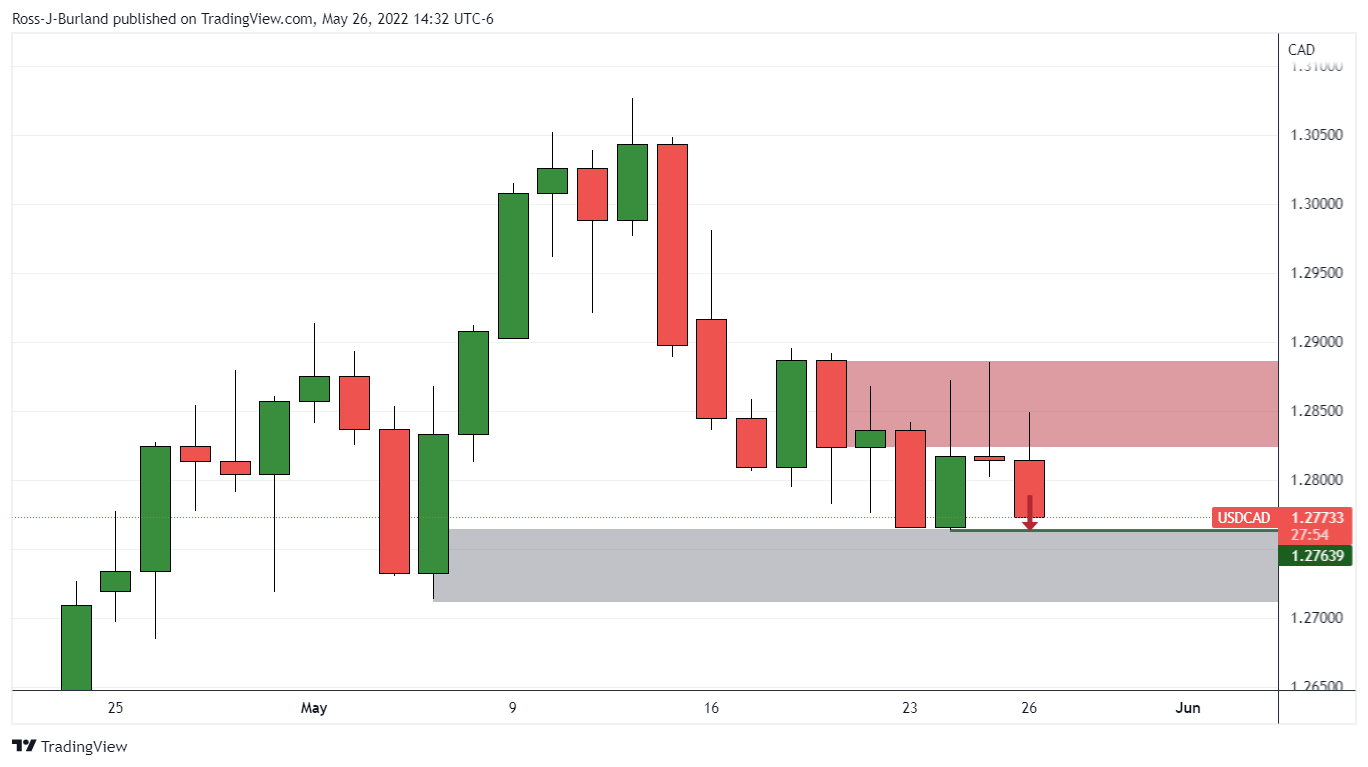
The price is being rejected in the resistance zone and the bearish shooting star followed by the current bearish daily candle is bearish which likely leaves the prior lows vulnerable near 1.27639. However, a break of there opens the void in the price imbalance towards 1.2713 open for mitigation.
On the other hand, there are prospects building for a significant correction on the lower time frames:
USD/CAD H1
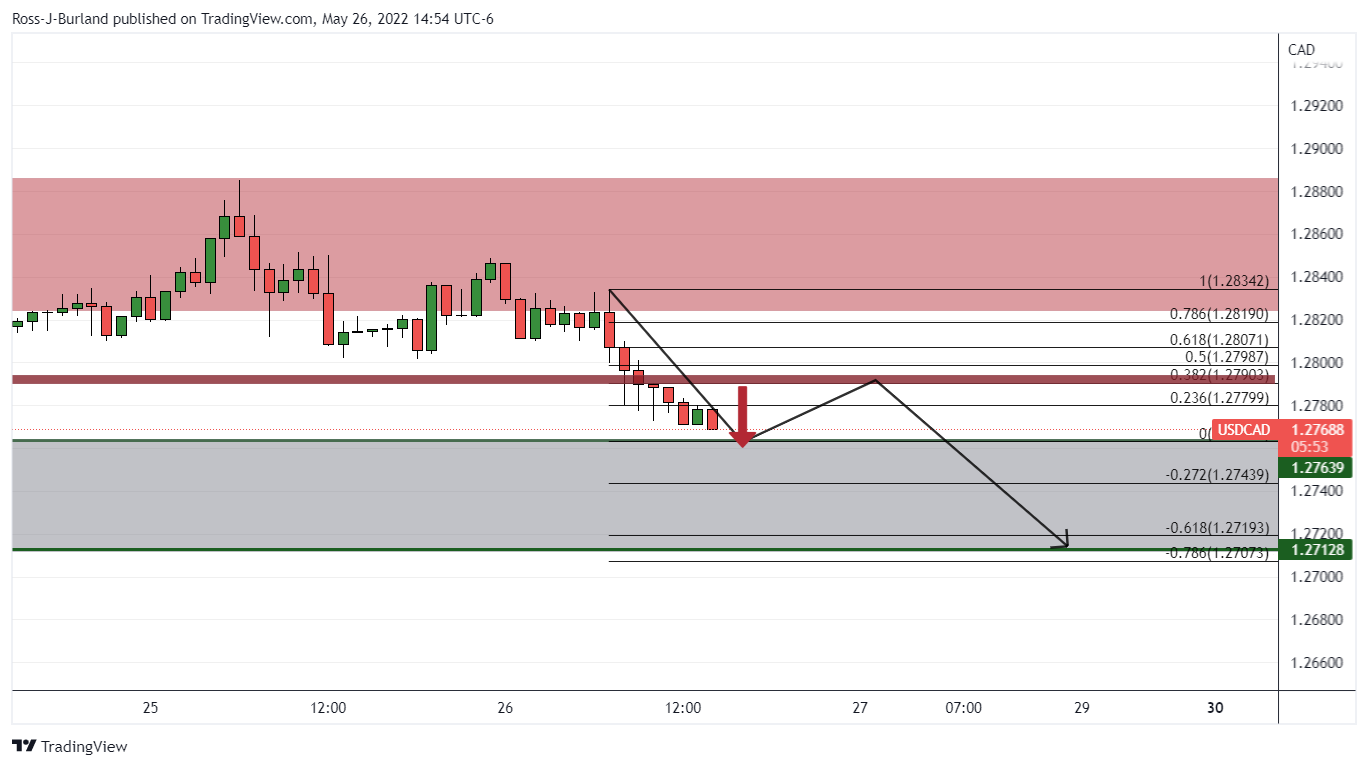
The price is moving in on the aforementioned lows whereby a correction to the upside could occur towards the 38.2% Fibonacci retracement of the bearish move that has a confluence with prior support. A downside continuation could then occur, if not from a higher ratio along the Fibo scale.
- The GBP/JPY is trading positive in the week by 0.27%.
- The Bank of Japan (BoJ) Governor Kuroda lifted the Japanese yen as he discussed an exit strategy to an accommodative policy stance.
- GBP/JPY Price Forecast: Failure at 161.00 might send the pair tumbling towards 158.20s.
The GBP/JPY barely edges higher in the day after seesawing in a wide 180 pip range and is set to finish Thursday’s session in the green, up just 0.04%. At the time of writing, the GBP/JPY is trading at 160.15.
US equities are recording gains as Wall Street is about to close, reflecting a risk-on mood. The GBP/JPY shifted gears, turned positive, and consolidated above the 160.00 mark, tested throughout the week. It’s worth noting that the Japanese yen got a lift from the Bank of Japan Kuroda, who talked about the exit strategy from an accommodative monetary stance to a restrictive one.
On Thursday, the GBP/JPY opened just above the 160.00 figure and bounced towards the daily high around 160.80. However, a raft of selling pressure dragged the pair towards the daily low at around 159.01, reached during the European session, followed by a recovery above the 160.00, where the cross-currency settled around.
GBP/JPY Price Forecast: Technical outlook
The GBP/JPY daily chart depicts the pair as upward biased. Nevertheless, failure to reclaim 161.00 would leave the cross-currency vulnerable to additional selling pressure. The RSI reinforces the previously-mentioned, with an almost horizontal slope and its reading in bearish territory.
That said, the GBP/JPY first support would be the 159.00 mark. Break below would expose the 100-DMA at 158.27, followed by the 200-DMA at 155.49.
Key Technical Levels
What you need to take care of on Friday, May 27:
Australian Retail Sales are coming up in Asia.
The American dollar attempted a modest recovery early on Thursday but finished the day with losses against most major rivals. Tepid US data and rallying equities helped particularly safe-haven rivals.
The US second estimate of the Q1 Gross Domestic Product, which growth was downwardly revised to -1.5%, worse than the previous estimate of -1.3% and missing the market's expectations of -1.4%.
The EUR/USD pair nears its weekly high at the end of the day, trading at around 1.0720. The GBP/USD pair hovers just below 1.2600. The Canadian dollar was among the strongest, with USD/CAD changing hands at 1.2770 as oil prices surged. WTI settled at $113.90 a barrel. The AUD/USD pair, on the other hand, remained steady in the 0.7090 region, unable to take advance of Wall Street´s rally.
Gold seesawed between gains and losses, ending the day little changed at around $1,852 a troy ounce.
Among US indexes, the Nasdaq Composite was the best performer, up roughly 3%. The S&P 500 and the Dow Jones Industrial Average added around 2% each.
Solana, Avalanche, Polkadot and NEAR Protocol at risk of a 40% flash crash
Like this article? Help us with some feedback by answering this survey:
- Gold bulls moving back in as the US dollar remains on the backfoot.
- This week's candle is bullish and the bulls have corrected to a 38.2% ratio milestone.
At $1,850, the gold price is losing around 0.18% on the day, falling from a high of $1,854.43, but has recovered from the day's lows of $1,840.75. The US dollar continues to struggle after the Federal Open Market Committee minutes. DXY is trading near the lows of the day at 101.768 dut the markets’ dovish take on the minutes.
Despite the minutes from the Federal Reserve's May meeting pointing to additional 50 basis point interest rate hikes in June and July, investors moved out of the greenback as observers considered the prospects for the Fed slowing the tightening cycle later in the year.
The minutes revealed that most participants at the Fed's May meeting judged 50 basis point hikes would likely be appropriate at the June and July policy meetings to combat inflation that they agreed had become a key threat to the economy's performance. Additionally, many of the board members believed that a fast pace of tightening would leave the central bank well-positioned later this year to assess the effects of policy firming.
No one really knows how far rates have to go
''We disagree with the market’s dovish take on the minutes,'' analysts at Brown Brothers Harriman argued.
''The dollar has softened after the FOMC minutes and US yields have fallen. To us, the views expressed in the minutes are about all they could say at the start of an aggressive tightening cycle where no one really knows how far rates have to go. The Fed is facing a very complicated situation and so is trying to burnish its hawkish credentials while trying not to pre-commit to any rate path. The minutes clearly reflect this balancing act.''
Earlier in the month, the dollar index had reached a nearly two-decade peak above 105, however, the signs that aggressive Fed action may already be slowing economic growth have prompted traders to scale back tightening bets, with Treasury yields also dropping from multi-year highs as well.
Meanwhile, to the contrary, data released on Thursday showed the number of Americans filing new claims for unemployment benefits fell last week, signalling continued tightness in the labour market. However, the decline partially unwound some of the prior week's surge, which had pushed claims to their highest level since January.
In other data on Thursday, the Commerce Department confirmed the economy contracted in the first quarter under the weight of a record trade deficit and a slightly slower pace of inventory accumulation compared to the fourth quarter. Real Gross Domestic Product fell at a 1.5% annualized pace in the March quarter, compared to a 1.4% drop initially projected, according to the second estimate from the Bureau of Economic Analysis.
Looking ahead, Friday's data schedule will include April personal income and spending data, with the Fed's preferred inflation measure, and the final reading for the May Michigan Sentiment index.
Besides data, there are fears about slowing growth in China and energy security risks in Europe could bolster safe-haven demand for the USD. ''In an environment in which the Fed and other central banks are removing liquidity, we expect higher levels of volatility in FX market,'' analysts at Rabobank argued.
Gold technical analysis
The bulls have failed to maintain control of the gold price as it crumbles below a 78.6% Fibonacci of a fake-out bullish impulse:
However, the price is now moving in on resistance and should bulls commit near $1,850, there will be prospects of a move beyond resistance which could be the foundations of a bullish close to the week.
Gold weekly chart
This week's candle is bullish and the bulls have corrected to a 38.2% ratio milestone with prospects of a 50% mean reversion in due course.
- The AUD/USD remains positive in the week, up by 0.70%.
- China’s Premier Li Keqiang warned that the economy could not achieve its goals, weighing on the AUD/USD.
- AUD/USD Price Forecast: Tilted to the downside and might have peaked around 0.7100.
The AUD/USD is almost flat during the North American session after trading in a 0.7057 low to 0.7109 high trading range, amid a risk-on market mood that keeps US equities buoyant while safe-haven assets retraced. At 0.7090, the AUD/USD is poised to finish the day with minimal gains.
Sentiment remains positive after Wednesday’s release of the Federal Reserve’s May meeting minutes. The US central bank stated that all participants agreed to rate raises of 50 bps in the next couple of meetings and mentioned that they need to move “expeditiously” to a neutral posture. Also, officials said they would remain focused on inflationary pressures, much In line with the Fed speaking rhetoric, since May 5.
Meanwhile, the US Dollar Index slumps some 0.20% during the North American session, sitting at 101.877, opening the door for a fall towards April 21 daily low at 99.818. US Treasury yields recovered some ground, led by the 10-year benchmark note, which appears to have bottomed just shy of the 50-day moving average (DMA), and is gaining two basis points, sitting at 2.768%.
During the Asian session, China’s Premier Li Keqiang sound the alarm about the slowing economy. He made comments to local officials in an emergency meeting. He said that growth risks were slipping below a “reasonable” range and warned that China would face a much longer road to recovery if the economy doesn’t keep expanding at a certain rate.
Those remarks put a lid on the AUD/USD, which was headed to record a fresh weekly high above the current one at 0.7127, eyeing a test of March’s 15 swing low at 0.7165.
Regarding US macroeconomic data, the docket featured Gross Domestic Product (GDP) preliminary figures for the first quarter, which showed a contraction of 1.5% YoY, much larger than the -1.3% expected. Trade dynamics weighed on the readings, as Exports fell at a 5.4% pace in Q1, while Imports skyrocketed 18.3%. Nonetheless, consumer spending increased by 3.1% vs. estimations of 2.7% YoY. Also, the Labor Department reported Initial Jobless Claims for the week that ended on May 20, which rose 210K, lower than the 215K foreseen.
The Australian economic docket would feature Retail Sales on its preliminary reading, foreseen at 0.9% MoM on Friday. On the US front, the economic docket would reveal the Fed’s favorite measurement for Inflation, the Personal Consumption Expenditure (PCE), foreseen at 6.4%, triple the US central bank objective.
AUD/USD Price Forecast: Technical outlook
The AUD/USD remains downward biased in the mid to long term. In the short term, the 20-day moving average (DMA), spotted at 0.7034, suggests the major is trending higher, but it’s worth noting that the four-day rally was capped at the 0.7100 figure, meaning that it might be ending. Further confirmation was provided by oscillators, which are trending lower within a bearish territory.
That said, the AUD/USD first support would be the 20-DMA at 0.7034. A break below would expose the May 18 cycle low at 0.69490, followed by the YTD low at 0.6828.
Key Technical Levels
- GBP/USD bulls stay in the driving seat as US dollar remains soft.
- Higher levels of volatility could keep USD underpinned.
At 1.2580, GBP/USD is flat in midday trade on Wall Street. The pair has moved within a range of between 1.2551 and 1.2620 so far. Sterling, among the rest of the G7 block, has benefitted from a softer US dollar in the closing stages of the month.
Comments from FOMC officials this week have turned slightly dovish and the focus turned to other central banks, such as the European central bank, the Reserve bank of New Zealand and meetings on the horizon, such as the Bank of England in June.
The greenback hit a one-month low at 101.64 on Tuesday after European Central Bank chief Christine Lagarde flagged an end to negative interest rates in the eurozone in the third quarter. The governor's remarks implied an increase of at least 50 basis points in the deposit rate and fueled speculation of bigger hikes this summer.
Elsewhere, the RBNZ became the latest central bank to raise interest rates by half a point. While that move was expected, it also provided hawkish guidance on its policy path, noting a larger and earlier hike reduced the risk of inflation becoming persistent.
As for the BoE, some commentators have concluded that the committee may be forced to be more aggressive on rate hikes than had previously been thought likely. ''Textbooks suggest that the prospect of a more aggressive interest rate cycle from the BoE is a positive near term factor for the pound,'' analysts at Rabobank said. ''However,'' the analysts argued, ''insofar as this would increase the likelihood of a hard landing for the UK, upside potential for GBP on more rate rises could turn out to be limited.''
Nevertheless, the current inflation focus of the BoE and the growth concerns in the US have enabled cable to recover from the lows this week. The greenback declined against its major trading partners early Thursday ahead of an update to the first quarter Gross Domestic Product and the PCE price index that was unrevised at a 7% rise in the first quarter, while the measure excluding food and energy rose 5.1%, compared with a 5.2% gain in the initial estimate.
The US economy contracted more than initially feared in the first quarter due to downward revisions to inventories and residential investment. Consumer spending came in stronger than previously expected, government data showed Thursday. Real GDP dropped at a 1.5% annualized pace in the March quarter, compared to a 1.4% drop initially projected, according to the second estimate from the Bureau of Economic Analysis.
Looking ahead, Friday's data schedule will include April personal income and spending data, with the Fed's preferred inflation measure, and the final reading for the May Michigan Sentiment index.
Besides data, there are fears about slowing growth in China and energy security risks in Europe could bolster safe haven demand for the USD. ''In an environment in which the Fed and other central banks are removing liquidity, we expect higher levels of volatility in FX market. We see risk that GBP/USD could again re-visit it recent lows in the coming months,'' analysts at Rabobank argued.
- The USD/CHF continues extending its two-week rally, gaining 1.53%.
- Risk appetite increased and weighed on the USD/CHF, falling 0.15%.
- USD/CHF Price Forecast: In the short-term, to persist downward biased.
The USD/CHF records minimal losses for the third day in the week, though it clings above the 0.9600 mark, just above the 50-day moving average (DMA) at 0.9562. At the time of writing, the USD/CHF is trading at 0.9596.
A risk-on market mood keeps the greenback on the defensive. European bourses finished Thursday’s session with gains, while US equities are gaining. The US Dollar Index, a measure of the buck’s value vs. a group of peers, is falling 0.10%, sitting at 101.970.
Elsewhere, the USD/CHF appears to found its feet after dropping from YTD highs at 1.0000 towards 0.9600. For two consecutive days, the major has been trading within the 0.9573-0.9642 band, unable to break above/below the range, despite some US economic data that investors ignored.
From a technical analysis perspective, the USD/CHF remains in an uptrend, and it’s worth noting that the price action of the last three days formed a “bullish-harami,” a reversal candle-chart pattern.
During the day, the USD/CHF began trading near 0.9606 and so far has seesawed around the 0.9585-0.9632 range. Of late, it stabilized around 0.9600 as market players prepare for Friday’s Personal Consumption Expenditure (PCE), the Federal Reserve’s preferred measure for inflation.
USD/CHF Price Forecast: Technical outlook
Volatility in the USD/CHF shrank, as shown by the Bollinger bands, in the 4-hour chart, depicting a trading range of 0.9579-0.9669. However, a continuation to the downside remains in play in the short term, as the 20, 50, 100, and 200-4H simple moving averages (SMAs) reside above the spot price, leaving the major vulnerable to additional selling pressure.
That said, the USD/CHF first support would be Bollinger’s bottom band at 0.9579. Break below would expose the June 30, 2020 highs at 0.9533, followed by March 16 swing high-turned-support at 0.9460.
Key Technical Levels
- US dollar remains weak, but losses are limited.
- Wall Street rises sharply, US yields at fresh 2-day highs.
- EUR/USD short-term outlook is bullish, and faces resistance at 1.0730 and 1.0750.
The EUR/USD rose further during the American session and printed a fresh daily high at 1.0729. It then pulled back, staying above 1.0700. The euro is holding onto important weekly gains.
Bullish but capped under 1.0750
The recovery of EUR/USD appears to be resuming after a pullback from the 1.0750 area to 1.0640. The euro remains below the recent top but the chart still shows some positive momentum. A break of 1.0730 should clear the way for a test of 1.0750. The next resistance stands at 1.0765. A deli back below 1.0700 would alleviate the pressure. And under 1.0645, the pair could drop to test the important support area of 1.0600.
The move higher on Thursday is being driven by a weaker US dollar and risk appetite, the day after the FOMC minutes. The DXY is falling 0.12%, under 102.00. Equity prices in the US are up considerably. The Dow Jones gains 1.72% and the Nasdaq 2.87%.
The improvement in market sentiment is keeping the dollar on the defensive. At the same time, US yields are reacting. The US 10-year rose to 2.78% and the 30-year to 3.02%, both at 2-day highs.
Economic data from the US came in mixed on Thursday. The second reading of Q1 GDP showed a negative revision from -1.4% to -1.5%. Initial Jobless Claims dropped more than expected to 210K while Continuing Claims rose to 1.34 million above the 1.31 million of market consensus. The Kansas Fed Manufacturing Index declined unexpectedly in May to 19 from 28, against an expectation of 37. On Friday, Personal Income and Spending data are due in the US, including the Core PCE.
Ahead of a long weekend in the US, the EUR/USD is holding into important weekly gains as it continues to rebound from multi-year lows. During the last two weeks, it gains more than 300 pips. “EUR/USD looks to have stalled at the top of a potential 1.02-1.08 trading range this summer and we could quite easily see a near-term move back towards the 1.0500/1.0550 area as the Fed cycle is repriced higher”, explained analysts at ING.
Technical levels
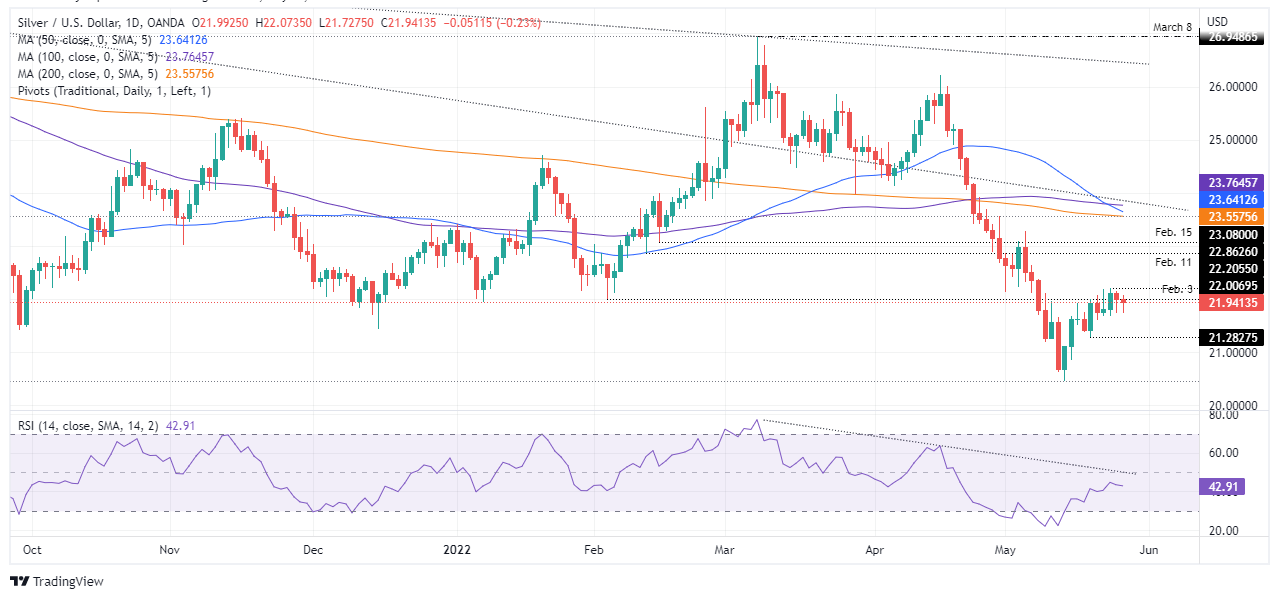
- Silver prices remains under pressure and falls 0.23% on Thursday.
- An upbeat sentiment and elevated US Treasury yields a headwind for XAG/USD.
- Silver Price Forecast (XAG/USD): To remain sideways amid the lack of a catalyst.
Silver (XAG/USD) retraces for the second straight day on rising US Treasury yields led by the 10-year benchmark note, which was parked around 2.750% for the last two days, but shows signs of life advancing two-basis points, a headwind for precious metals. At $21.94, XAG/USD retraces from weekly highs at around $22.00 and remains range-bound, with just one day left in the week.
The rise of US Treasury yields begins to weigh on the bright metal after being stationary for two days. At the same time, European and US equities are recording solid gains, reflecting an increase for riskier assets, another factor influencing the fall of precious metals.
The US Dollar Index, which measures the greenback’s value vs. a basket of six currencies, loses 0.22% and sits at 101.843.
The awaited Federal Reserve’s last meeting minutes were revealed and reinforced what Fed policymakers have said since May 5. The minutes showed that all the board members agreed to 50 bps increases for the next couple of meetings and emphasized the need to move “expeditiously.” Officials stated that moving to a neutral stance was appropriate and added that they are focused on inflationary pressures.
Meanwhile, the US docket featured preliminary readings of the US GDP Q1 for 2022 reported a contraction of 1.5% YoY. The report blamed the drop on trade dynamics, with US Exports falling at an annual pace of 5.4% in the first quarter while imports increased 18.3%. However, estimates showed healthy growth in consumer spending of 3.1% vs. forecasts of 2.7% YoY. Additionally, the US Department of Labor reported that Initial Jobless Claims for the week ending on May 20 fell to 210K against a 215K expectations.
On Friday, the US docket would unveil the Fed’s favorite measurement for Inflation, the Personal Consumption Expenditure (PCE), foreseen at 6.4%, triple the US central bank objective.
Silver Price Forecast (XAG/USD): Technical outlook
XAG/USD remails downward biased after failing to trade above the February 3 swing low-turned-resistance at $22.00. Nonetheless, Silver prices are range-bound and would keep trading within the $21.28-$22.00 area unless a catalyst triggers a break above/below the boundaries.
Upwards, the XAG/USD first supply level would be $22.00. Once cleared, the following resistance would be the May 24 weekly high at $22.20, followed by the February 11 cycle low-turned-resistance at 22.86. On the other hand, the XAG/USD first support would be the weekly low at $21.67. Break below would expose the May 19 swing low at $21.28, followed by the $21.00 barrier.
Key Technical Levels
A new estimate of US Q1 GDP growth revised the original contraction of 1.4% to 1.5%. According to analysts at Wells Fargo, the economy continues to plow ahead, despite the modest contraction in real GDP growth observed during the first quarter.
Key Quotes:
“Revised data that were released this morning showed that U.S. real GDP contracted at an annualized rate of 1.5% in Q1-2022. The outturn represents a slight downward revision to the “advance” estimate of -1.4% that was reported last month.
“The revised data continue to show that two volatile spending components, namely inventories and net exports, were largely responsible for the contraction in real GDP that occurred in the first quarter. Specifically, the downshift in stock building in Q1 subtracted 1.1 percentage points off the overall rate of GDP growth while net exports made a negative contribution to growth that was worth 3.2 percentage points.”
“Today's release also gave us the first look at real gross domestic income (GDI) in Q1-2022. In theory, growth in GDI should be identical to growth in GDP. In practice, however, the two measures are rarely identical due to data errors and omissions. In that regard, real GDI grew at an annualized rate of 2.1% in Q1. This growth in the income side of the national income and product accounts (NIPA) is more in line with the “core” parts of the spending side.”
“Real personal consumption expenditures grew at an annualized rate of 3.1% in Q1 while fixed investment spending rose 6.8%. In short, the economy continues to plow ahead, despite the modest contraction in real GDP growth in the first quarter.”
Next week, the Bank of Canada (BoC) will have its monetary policy meeting. Market consensus is for another 50 basis points rate hike to 1.50%. According to analysts from TD Securities, global factors remain a crucial driver of the Canadian dollar, likely limiting the impact of the rate hike from the BoC.
Key Quotes:
“We look for the Bank to deliver another 50bp hike in June to bring the overnight rate to 1.50%. With little uncertainty around the decision itself, the focus will shift to the policy statement where we expect a hawkish tone. The Bank will note that growth and inflation are both tracking above the April MPR, and repeat that rates will need to rise further.”
“Global factors remain a crucial driver of the loonie, likely limiting the impact of the BoC's anticipated 50bp rate hike. As a result, we expect USD/CAD to maintain the 1.26-1.30 range through the summer months but will look to fade extremes. For now, CAD is more attractive to trade tactically on the crosses where we remain short versus NOK and like scaling into short exposure versus AUD.”
“A 50bp move is broadly expected, but the accompanying tone could impact front-end rates on the margin. A hawkish statement would reinforce the index-related flattening which we see as the dominant event in CAD markets on June 1.”
Data released on Thursday showed retail sales in Canada stagnated in March against expectations of a 1.4% increase. Analysts at CIBC, point out the headline number disappointed but the details of the report were stronger with growth in ten out of 11 subsectors.
Key Quotes:
“Headline retail sales disappointed in March, but the details of the report were stronger with growth in 10 out of 11 subsectors. Nominal retail sales were flat in March, much weaker than the consensus and advance estimate for 1.4% growth, as lower sales of motor vehicles offset gains elsewhere.”
“Excluding auto sales, receipts were up by a healthy 2.4%, but some of those gains would be driven mainly by higher prices. In volume terms, overall retail sales were down 1%.”
“The advance estimate for April suggests that sales grew 0.8%, which, given continued inflationary pressures, would not be very impressive in volume terms.”
“Motor vehicle sales look to have limited overall spending on goods in Q1, despite decent contributions from other goods consumption. The April advanced estimate from this release, combined with previously released data for manufacturing sales (+1.6%) and wholesale trade (+0.2%), suggests little help in real terms from these sectors for monthly GDP, which will rely on the continued growth in services. Overall, the impact of surging inflation on household disposable incomes will likely be a stronger headwind to sales volumes in Q2.”
- Mexican peso rises versus the US dollar for the third time in a row.
- USD/MXN stays bearish, looking at 2022 lows near 19.70.
- The 19.90 area is not the immediate resistance.
The USD/MXN keeps a bearish tone and continues to move lower at a slow pace, as equity markets recover. A few minutes ago, the Bank of Mexico released the minutes of its latest board meeting. The central bank could act more forcefully to curb inflation according to the document. Members noted inflation expectations have increased significantly.
The move lower in USD/MXN faces a strong barrier around 19.70/75 that contains many horizontal support levels and the 2022 low. A consolidation below should open the doors to a slide to the next critical support at 19.50/55.
If the pair remains above 19.75, the odds of a rebound will increase. A recovery to 19.90 should be seen as a modest correction, keeping the bearish tone intact. Above, at 20.10 awaits the 20-day Simple Moving Average. A daily close above should negate the bearish short-term outlook.
Technical indicators continue to favor the downside in USD/MXN. The RSI is still above 30, but it is flattening; Momentum remains below 100, now again pointing south.
USD/MXN daily chart
-637891756426703409.png)
- WTI has managed a bullish break after three days of consolidating around $110 and is looking to test last week’s highs.
- Traders are citing a combination of factors, including US demand, EU/Russia sanctions and OPEC+ production woes as supportive.
Oil prices broke out of a three-day consolidation pattern on Thursday, with front-month WTI futures leaping into the $114s per barrel from earlier session lows closer to $110. The more than $3.50 gain seen on Thursday is the largest move of the week yet, with WTI now eyeing a test of last earlier monthly highs in the $115s, plus the late March highs in the $116s. There wasn’t one specific catalyst/fundamental development to drive the upside. Rather, the gains really got going upon the open of the COMEX crude oil pit from 13:00 GMT, after which time its not uncommon to see a spike in volumes.
Market commentators/commodity analysts cited a combination of bullish factors as supporting prices on Thursday. Firstly, there is a lot of chatter about rising demand in the US as the peak driving season approaches (most define peak US driving season as starting with the coming Memorial Day weekend and going into September). So far, despite high prices, gasoline demand and vehicle miles traveled has remained robust.
Secondly, various EU officials have pushed back against recent pessimism being expressed by Hungarian officials about how soon a deal on an EU embargo on Russian oil imports can be reached. European Council President Charles Michel on Wednesday said he was confident a deal could be struck between the EU/Hungary prior to the upcoming EU Council Summit on 30 May. German Finance Minister Robert Habeck also said a deal could be struck in the coming days, or else Germany would look to “other instruments”.
Moreover, OPEC+ and its production woes have been in focus. Sources told Reuters on Thursday that, as expected, the group will proceed with its usual policy of lifting output quotas by 432,000 barrels per day (BPD) each month. The cartel has been unable to meet these output hike targets for months, initially owing to the struggles faced by smaller OPEC producers (mainly in Africa), but now more recently as Russian output drops due to Western sanctions following its invasion of Ukraine.
A recent Reuters report said OPEC+ missed its output target by 2.6M BPD in April, with Russia accounting for half of the miss. Production woes are only expected to have worsened in May. Finally, macro flows are also helping crude oil prices on Thursday, with gains being seen on Wall Street as traders pare back on hawkish Fed bets in wake of Wednesday’s Fed meeting minutes and Thursday’s underwhelming US GDP figures. Bulls will be confident that WTI’s pattern of printing higher highs and lower lows that has been in play over the past few weeks will continue, meaning a likely break higher towards $120 before some likely profit-taking.
- The NZD/USD retraces from weekly highs at 0.6518, although the RBNZ hiked rates on Wednesday.
- Fed minutes confirmed that all participants agreed to 50 bps increases for the June and July meetings.
- NZD/USD Price Forecast: A “bearish-harami” in the daily chart looms, once confirmed, might pave the way for a re-test of the 20-DMA at 0.6385.
The NZD/USD runs to resistance and fails to extend Wednesday’s gains after the Reserve Bank of New Zealand (RBNZ) hiked rates by 0.50%, lifting the Overnight Cash Rates (OCR) to 2%. At 0.6460, the NZD/USD is retracing from weekly highs above 0.6500, despite an upbeat market mood.
Global equities are rising, depicting a positive market sentiment. In the FX complex, the mood is mixed as the gainers fluctuate between safe-haven peers and risk-sensitive currencies. The New Zealand dollar is the weakest currency as the North American session begins, with no fundamental reason supporting the move.
In the meantime, the US Dollar Index, a gauge of the greenback’s value against a basket of peers, is losing traction and is back beneath the 102.000 mark, down 0.12% at 101.956. At the same time, US Treasury yields, led by the 10-year benchmark note, is flat, sitting at 2.754%, a reflection of market players backpedaling an aggressive Fed, as preliminary readings of the US GDP Q1 for 2022 reported a contraction of 1.5% YoY.
Additionally, the US Department of Labor reported that Initial Jobless Claims for the week ending on May 20 fell to 210K against a 215K expectations.
On Wednesday, the US Federal Reserve’s Open Market Committee released the May meeting minutes, which delivered already known news, though confirmed policymakers’ stance of raising rates by 50 bps on each of its June and July meetings. Furthermore, the Fed agreed that they needed to move “expeditiously” to a neutral posture and that a “restrictive” approach was appropriate. Also added that some members emphasized that they were and will be focused on inflationary pressures and noted that prices are skewed to the upside.
For the remainder of the week, the NZ docket would feature the ANZ Roy Morgan Consumer Confidence for May, foreseen at 83. On the US front, the Personal Consumption Expenditure (PCE) is widely expected, as it’s the Federal Reserve’s favorite gauge of inflation.
NZD/USD Price Forecast: Technical outlook
The NZD/USD daily chart shows that the pair remains downwards, despite that NZD/USD buyers lifted the major above the 20-day moving average (DMA) on May 23, a signal that consolidated the pair. However, failure to trade above 0.6568 would not shift the bias to neutral-downwards and even could expose the NZD/USD to further selling pressure, as it is forming a “bearish-harami” pattern.
If the latter scenario plays out, the NZD/USD first support would be the May 25 swing low at 0.6417. A break below would expose the May 19 cycle low at 0.6290, followed by the YTD low at 0.6145. Otherwise, if NZD/USD bulls push the exchange rate above 0.6568, that would open the door for further gains, though the major would face some supply zones. The NZD/USD’s first resistance would be the 50-DMA at 0.6647. Once cleared, the immediate supply level would be the 100-DMA at 0.6688, followed by April 20 swing high at 0.6813.
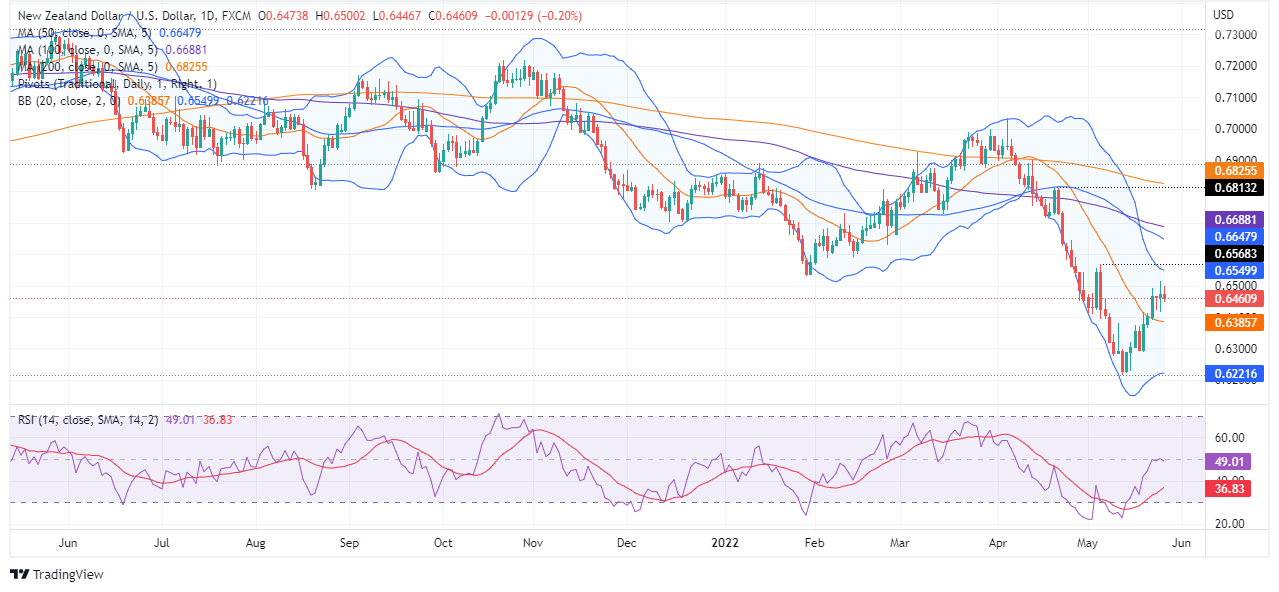
Key Technival Levels
- Gold is holding above its 200DMA in the $1850 area and is back to nearly flat on the week.
- Traders are weighing the tailwinds of a softer USD/US yields versus strong US equities as key Friday inflation data looms.
Spot gold (XAU/USD) is for now holding just above its 200-Day Moving Average at $1839 and trading near the $1850 level, though still with a slight downside bias on the day, despite Thursday’s worse than expected US GDP figures and Wednesday’s not as hawkish as feared Fed minutes release. Indeed, in wake of the weak data and modest paring back of hawkish Fed bets, the US dollar is a tad weaker and US yields are nudging lower, a combination that would normally be a tailwind for gold.
But US equities are rallying, with the S&P 500 last trading up around 1.4% on the day and eyeing a test of its 21-Day Moving Average for the first time since mid-April. On the week, the index is trading with gains of more than 3.0% and this appears to be weighing on the safe-haven precious metal. Traders are attributing stock market gains to weak GDP data reducing the need for aggressive Fed tightening and to strong earnings from a few US companies, including retail giant Macy’s.
Either way, the better tone to risk appetite is for now keeping XAU/USD on the back foot. Having been as high as the $1870 level earlier in the week, spot gold’s gains on the week have been eroded back to only about 0.2% from around 1.2%. But the recent pullback towards the 200DMA might prove a good opportunity for the gold bulls to add to long positions if they think that hawkish Fed bets will continue to be pared in the weeks ahead and, as a result, the buck and US yields continue softening. If it contributes to the strengthening narrative that US inflation has peaked, Friday’s US April Core PCE report could lead to a further reduction of Fed tightening bets and gold could well end the week back at highs in the $1870 area.
- A combination of factors attracted fresh selling around USD/CAD on Thursday.
- Rising oil prices underpinned the loonie and exerted pressure amid a weaker USD.
- Sustained break below the 50% Fibo. level will set the stage for additional losses.
The USD/CAD pair surrendered its modest intraday gains and dropped to a fresh daily low, around the 1.2800 mark during the early North American session.
The risk-on impulse - as depicted by strong rally in the equity markets - weighed on aven US dollar amid speculations that the Fed could pause the rate hike cycle later this year. On the other hand, a goodish pickup in crude oil prices underpinned the commodity-linked loonie and attracted some intraday selling around the USD/CAD pair.
From a technical perspective, spot prices, so far, have been struggling to find acceptance above the 38.2% Fibonacci retracement level of the 1.2459-1.3077 strong move up. Apart from this, repeated failures ahead of the 1.2900 mark favour bearish traders and supports prospects for an extension of the recent pullback from the YTD peak.
That said, it will still be prudent to wait for some follow-through selling below the 50% Fibo. level, around the 1.2770-1.2765 region, before positioning for any further downfall. The USD/CAD pair might then accelerate the fall towards the 1.2720-1.2715 intermediate support before eventually dropping to sub-1.2700 levels, or the 61.8% Fibo. level.
On the flip side, the daily swing high, around mid-1.2800s, which coincides with the 38.2% Fibo., now seems to act as an immediate hurdle ahead of the weekly high, around the 1.2885 region. Some follow-through buying, leading to a subsequent move beyond the 1.2900 mark will negate the bearish outlook and prompt a short-covering rally.
The momentum might then push spot prices beyond the 1.2930 zone, or the 23.6% Fibo. level, and allow the USD/CAD pair to aim back to reclaim the 1.3000 psychological mark. The next relevant resistance is pegged near the recent daily closing high, around the 1.3045-1.3050 region, ahead of the YTD peak, around the 1.3075 area.
USD/CAD daily chart
-637891702833735548.png)
Key levels to watch
- EUR/USD reverses the initial pullback and regains 1.0700 and above.
- Immediately to the upside now comes the 55-day SMA at 1.0774.
EUR/USD regains part of the ground lost on Wednesday and manages to reclaim the area above the 1.0700 figure on Thursday.
Considering the pair’s current price action, the continuation of the rebound looks likely in the very near-term at least. That said, the next up barrier now appears at the 55-day SMA, today at 1.0774 prior to the 3-month resistance line near 1.0820.
The breakout of this area should mitigate the selling pressure and allow for a probable move to the weekly high at 1.0936 (April 21).
The daily RSI around 55 also indicates that extra upside could still be in store for the pair until it reaches the overbought territory (>70).
EUR/USD daily chart
- USD/JPY recovered a major part of its intraday losses, though lacked follow-through buying.
- The risk-on impulse undermined the safe-haven JPY and extended some support to the pair.
- Subdued USD price action did little to provide any impetus and kept a lid on any further gains.
The USD/JPY pair attracted some dip-buying in the vicinity of mid-126.00s on Thursday and recovered a part of its early lost ground. The intraday uptick pushed spot prices back above the 127.00 mark during the early North American session, though lacked any follow-through.
The risk-on impulse - as depicted by a generally positive tone around the equity markets - undermined the safe-haven Japanese yen and was seen as a key factor that extended some support to the USD/JPY pair. That said, concerns about softening global economic growth kept a lid on the optimistic move, which, along with subdued US dollar demand acted as a headwind for the major.
Speculations that the Fed could pause the rate hike cycle later this year dragged the yield on the benchmark 10-year US government bond to a fresh six-week low. This, in turn, failed to assist the USD to capitalize on the overnight bounce from the monthly low. Even the mixed US macro data also did little to impress the USD bulls or provide any impetus to the USD/JPY pair.
The Prelim US GDP report showed that the world's largest economy contracted by a 1.5% annualized pace during the first quarter of 2022 as against the advance estimate for a 1.4% decline. The slight disappointment from the backwards-looking data, to some extent, was offset by better-than-expected US Weekly Initial Jobless Claims, which fell to 210K last week from the 218K previous.
Thursday's US economic docket also features the release of Pending Home Sales, though is unlikely to influence the buck or produce any meaningful trading opportunities around the USD/JPY pair. Meanwhile, spot prices, so far, have managed to hold above the monthly low. This, in turn, makes it prudent to wait for some follow-through selling before positioning for any further losses.
Technical levels to watch
USD/CAD is little changed on the session. Looking ahead, economists at Scotiabank expect the pair to tick down towards the low 1.27s.
More range trading in the short-run
“We look for the CAD to pick up a little more support in the short run if the data run continues to support the impression that the domestic economy is running ahead of BoC expectations, which will keep policymakers on a relatively aggressive tightening path in the next few months.”
“The underlying momentum signals on the shorter-term studies remain mixed, suggesting more range trading in the short run.”
“We still view broader risks as being tilted to the downside (low 1.27s at least), on the basis of bearish, longer term (weekly) price signals.”
“Intraday weakness below minor trend support at 1.2810 would suggest a run to 1.2765.”
Gold Price is back in the red, falling for the second straight day. A hawkish Federal Reserve (Fed) is set to weigh on the yellow metal, with little demand for gold ahead, economists at TD Securities report.
The world is chasing the same Fed narrative
“Quantitative tightening is going to sap liquidity at a fast clip, while the Fed hikes into slowing growth – and everyone knows it. This leaves positioning analytics as a critical source of information for price action in the coming months.”
“Trend followers have completed their buying program and still remain long, which argues for additional downside on the horizon as momentum persists to the downside, with the macro narrative sapping investment demand for gold.”
“Without conviction that the Fed could blink, there are few participants remaining to buy gold, which still leaves a liquidation vacuum as the playbook in gold.”
GBP/USD has struggled to hold its push above 1.26. Economists at Scotiabank expect cable to face more selling pressure above this level.
Dip under the daily low of 1.2550 to open up the big figure area
“The pound is not out of the woods yet, as it will likely continue to face selling pressure above 1.26 ahead of resistance at the early-May high of 1.2638.”
“Losses below the intraday low of ~1.2550 are followed by support at the big figure area and yesterday’s low of 1.2481.”
OPEC+ is set to stick to its current policy of raising output by 432K barrels per day (BPD) each month when it meeting again on 2 June, six sources told Reuters on Thursday. "Why change what works perfectly?" one of the sources said to Reuters, adding that "we will announce that we are going to increase our production by 432,000 bpd even if we are no longer able to do so".
Western nations have been putting pressure on Saudi Arabia and the UAE, the only OPEC+ nations with any real spare capacity to actually significantly ramp up oil output in the near term, to go beyond the current steady increases to output. That's partially because many of the smaller OPEC nations have been struggling to keep up with recent hikes to their output quotas, meaning that OPEC+ hasn't actually been lifting output by 432K BPD in recent quarters.
Sanctions on Russia since its invasion of Ukraine have substantially worsened the OPEC+ output picture. OPEC+ undershot its output quota by 2.6M BPD in April, a recent Reuters report showed, with Russia accounting for half of that miss. Things are expected to have gotten worse this month.
EUR/USD challenges 1.07. However, the shared currency may need a catalyst to extend gains, economists at Scotiabank report.
Further EUR upside currently looks limited
“Price action over the past few days suggests a stalling in the EUR’s recovery from the mid 1.03s since mid-May.”
“Daly gains were limited to ~1.0720 and price action showed limited signs of aiming for a push to key 1.0750 resistance (with the 50-day MA also standing at 1.0755).”
“The 1.07 zone, the intraday low of 1.0664, and the mid 1.06s area stand as support.”
UOB Group’s Senior Economist Julia Goh and Economist Loke Siew Ting assess the recently published inflation figures in Malaysia
Key Takeaways
“Headline inflation reverted higher to 2.3% y/y in Apr after moderating for its fourth straight month to 2.2% in Mar. The reading matched our estimate and Bloomberg consensus. It was largely lifted by costlier food & non-alcoholic beverages, transportation, recreation services & culture, expenditure in restaurant & café, as well as education.”
“Overall price pressure is expected to pick up on the back of persistent global supply shortages, higher commodity prices, the lapse of favourable base effects, and currency weakness. Recovering domestic economic activities and higher private-sector wages amid ongoing labour shortages are also posing upside risks to inflation. Taking these factors and the government’s short-term measures to tackle the rising costs of living and supply shortage issues into considerations, we maintain our 2022 full-year headline inflation forecast at 3.0% (BNM est: 2.2%-3.2%, 2021: 2.5%).”
- AUD/USD extended its sideways price moves and remained well within the weekly trading range.
- The gloomy global economic outlook was seen as a key factor that capped the risk-sensitive aussie.
- Weaker US GPD print prompted some USD selling and helped limit any deeper losses for the major.
The AUD/USD pair continued with its struggle to gain any meaningful traction and remained confined in a range held since the beginning of the currency week. Spot prices remained on the defensive below the 0.7100 mark through the North American session and had a rather muted reaction to the US macro releases.
The Prelim US GDP report showed that the world's largest economy contracted by a 1.5% annualized pace during the first quarter of 2022. The reading was weaker than the advance estimate for a 1.4% decline and the 1.3% fall anticipated, which, in turn, prompted fresh US dollar selling and extended some support to the AUD/USD pair.
Apart from this, speculations that the Fed could pause the rate hike cycle later this year, along with a generally positive tone around the equity markets, weighed on the safe-haven greenback. That said, concerns about the worsening global economic outlook kept a lid on the optimistic move and acted as a headwind for the risk-sensitive aussie.
From a technical perspective, the one-week-old trading range constitutes the formation of a rectangle on short-term charts and points to indecision over the near-term trajectory for the AUD/USD pair. This comes despite the Reserve Bank of Australia's hawkish signal that a bigger interest rate hike is still possible in June and favours bearish traders.
The price action seems to suggest that the recent strong recovery move from the YTD low has run its course and the path of least resistance for the AUD/USD pair is to the downside. That said, sustained strength beyond the 0.7125 region will negate any near-term negative outlook and pave the way for a further appreciating move.
Technical levels to watch
- DXY appears consolidative in the lower end of the range.
- Extra losses could see the monthly low near 101.60 retested.
The index trades without a clear direction and keeps hovering around the 102.00 neighbourhood on Thursday.
DXY remains under pressure and extra losses should not be ruled out for the time being. That said, a breakdown of the May low at 101.64 (May 24) could pave the way for a visit to the temporary 55-day SMA, today at 101.03 in the short-term horizon.
Looking at the broader picture, the current bullish stance in the index remains supported by the 3-month line around 100.50, while the longer-term outlook for the dollar is seen constructive while above the 200-day SMA at 96.72.
DXY daily chart
According to the latest global growth outlook from Moody's, G20 economies will grow at a pace of 3.1% in 2022, down from a growth rate of 5.9% in 2021, reported Reuters.
Additional Takeaways:
The post-pandemic economic recovery faces a complex set of challenges.
"We expect headline inflation rates to ease through next year."
Many risks add to macroeconomic uncertainty including escalation of the Russo-Ukraine conflict and a larger-than-expected slowdown to China's growth.
Many risks add to macroeconomic uncertainty including extended supply-chain disruptions and new virus waves.
"We expect global economic growth to further slow to 2.9% in 2023."
There are multiple risks that could further dampen growth.
"We forecast that advanced economies will grow 2.6% in 2022 and emerging market countries will grow 3.8%."
Although expect headline inflation rates to ease through next year, price levels remain high and will weigh on consumer demand.
"Except for Russia, we do not expect a recession in any G20 country in 2022 or 2023."
"We forecast that global monetary and financial conditions will be quite tight by end of this year and in 2023, meaning inflation rates are bound to fall."
There were 210,000 initial jobless claims in the US in the week ending on 21 May, according to the latest data from the US Labour Department released on Thursday. That was a little below the expected drop to 215,000 from 218,000 a week earlier.
Continued Claims, meanwhile, rose to 1.346 million in the week ending on 14 May, above expectations for a drop to 1.31 million from 1.315 million a week earlier. The Insured Unemployment rate thus rose back to 1.0% from 0.9%.
Market Reaction
Markets did not react to the latest weekly jobless claims figures, with more focus on the GDP data that was released at the same time.
- Headlines Retail Sales growth missed expectations in March but Core sales were robust.
- The loonie did not react to the latest Canadian Retail Sales figures.
Retail Sales in Canada remains unchanged in March versus a month earlier, the latest report from Statistics Canada on Thursday showed. That was a miss on expectations for a MoM growth rate of 1.4%. That marked a slowdown after February's growth rate of 0.2%. Statistics Canada also released its preliminary estimate for Retail Sales growth in April, which it expects to come in at 0.8% MoM.
Despite the weaker than anticipated headline figures, Core Retail Sales grew at a robust pace of 2.4% MoM in March, a little above the expected growth rate of 2.0%.
Market Reaction
The loonie did not react to the latest Canadian Retail Sales figures.
- US GDP growth was even worse than initially though in Q1 according to the latest estimate, dropping at a 1.5% annualised pace.
- Markets did not react to the latest US GDP data.
According to a second estimate by the US Bureau of Economic Analysis, the annualised pace of real GDP growth in Q1 2022 came in at -1.5%, below the first estimate of -1.4% and the market's expectation for a growth rate of -1.3%, data on Thursday showed. Nonetheless, the latest GDP estimate still showed healthy growth in consumer spending of 3.1% in Q1 (on an annualised basis) versus the prior estimate of 2.7%, plus robust business investment growth of 9.2% (unchanged from the first estimate.
The data also still showed that the drop in GDP is largely explained by trade dynamics, with US exports in Q1 dropping at an annualised pace of 5.4% (versus the prior estimate of 5.9%), while imports rose by 18.3% (versus the prior estimate of 17.7%). A deterioration in the trade balance, as suggested by these figures, suggests that the economic activity being conducted to satisfy domestic consumption is being shifted abroad.
In terms of Q1 inflationary measures; the second estimate of the GDP deflator was raised to 8.1% versus the first estimate of 8.0%. Meanwhile, the PCE Price Index showed inflationary pressures up 6.3% YoY in Q1, in line with the first estimate.
Market Reaction
Markets did not react much to the latest US GDP figures, despite the miss on expectations on the headline growth number.
- GBP/USD has pulled back from a fiscal stimulus inspired jump above 1.2600 ahead of US data/amid Brexit headlines.
- The pair is back to trading in the 1.2560s, despite Sunak’s announcement of significant further aid for low-income households.
GBP/USD jumped momentarily to fresh near three-week peaks above 1.2600 in earlier trade as sterling got a boost on reports alleging that UK Chancellor of the Exchequer Rishi Sunak could be about to announce significant further targetted support for UK consumers suffering amid the worst cost-of-living crisis in the UK in decades. In a recent announcement, Sunak appeared to exceed these expectations, announcing a new combination of grants and one-off energy-related payments that would take the total support fiscal aid dished out to consumers since the start of the cost-of-living crisis to around £37 billion.
Despite this, GBP/USD has waned back from earlier session highs and now back to trading slightly in the red in the 1.2560s. Currency traders may have been inclined to book some sterling profits ahead of a test of monthly highs in the 1.2630s prior to the upcoming release of the second estimate of US Q1 GDP growth and weekly jobless claims figures at 1230GMT. In the absence of any surprises, the buck may once again fall under modest selling pressure, as focus returns to the Fed in wake of Wednesday’s release of the minutes from the latest meeting.
To recap, while the minutes showed a strong backing on the FOMC for 50 bps rate hikes at the Fed’s next two meetings, there were no standout hawkish surprises. Indeed, analysts said that the tone of the minutes lent itself towards FOMC members favouring a pause or slowdown in rate hikes once rates have reached the neutral level later in the year (inflation allowing), where the Fed could then reassess the need for further tightening. Long-term US bond yields have been dropping as of late as US recession fears rise and hawkish Fed bets are pared back and should this trend continue, GBP/USD can get back above 1.2600.
But one big potential downside risk to be cognizant of is Brexit tensions. Reports this morning suggested that the UK government will be introducing legislation as soon as 6 June that would enable the UK to make unilateral tweaks to its adherence to the Northern Ireland Protocol (NIP). The EU has threatened that if the UK does unilaterally ditch the NIP, they might respond by scrapping the post-Brexit trade deal with the UK. This would be a catastrophe for the already weak, stagflationary UK economy and could weigh heavily on sterling if trade tensions with the EU continue to mount.
The dollar continues to struggle after the FOMC minutes. This move is seen as corrective but economists at BBH note that the US Dollar Index could slide below the 100 level on failure to hold 101.80.
Dollar soft in the wake of FOMC Minutes
“DXY is trading near 101.90 on the markets’ dovish take on the minutes. Key level to watch is 101.80 as a clean break below would set up a test of the April 21 low near 99.818.”
“We still view this recent move lower as a correction within the longer-term dollar rally but we continue to be surprised at how far the dollar has fallen from the early May peak.”
“We continue to believe that pessimism regarding the US is overdone, with markets overlooking the problematic fundamental outlooks for the eurozone, UK, and Japan.”
GBP/USD has briefly traded above the 1.26 level this morning. However, economists at Rabobank expect the cable to move back lower to retest recent lows.
Higher levels of volatility in FX market ahead
“Signs of weakness in the UK April GDP data, due in the middle of June, or a softening in consumer sentiment surveys are likely to undermine the pound. Simultaneously, fears about slowing growth in China and energy security risks in Europe could bolster safe-haven demand for the USD.”
“In an environment in which the Fed and other central banks are removing liquidity, we expect higher levels of volatility in FX market.”
“We see risk that GBP/USD could again re-visit its recent lows in the coming months.”
- A combination of factors led to good two-way price moved for GBP/JPY on Thursday.
- Recession fears undermined the safe-haven JPY and acted as a headwind for the cross.
- Weaker USD benefitted sterling and helped the cross to reverse a sharp intraday slide.
The GBP/JPY cross witnessed an intraday turnaround on Thursday and dropped over 180 pips from the daily swing high, around the 160.80-160.85 region. The sharp intraday fall, however, stalled and was quickly bought into near the 159.00 round figure. The cross now seems to have stabilized and was seen trading around the 160.00 mark, nearly unchanged for the day.
Investors remain worried that a more aggressive move by major central banks to constrain inflation and the Russia-Ukraine war could pose challenges to the global economy. This, in turn, continued driving haven flows towards the Japanese yen and prompted selling around the GBP/JPY cross. That said, a combination of factors extended support and helped limit deeper losses.
A goodish recovery in the global risk sentiment - as depicted by a generally positive tone around the equity markets - kept a lid on any meaningful gains for safe-haven currencies, including the JPY. On the other hand, the emergence of fresh US dollar selling - amid speculations that the Fed could pause the rate hike cycle later this year - benefitted the sterling.
The solid intraday bounce, however, lacked any follow-through or bullish conviction amid diminishing odds for any further interest rate hikes by the Bank of England. Apart from this, the UK-EU impasse over the Northern Ireland protocol of the Brexit agreement further held back traders from placing aggressive bullish bets around the GBP/JPY cross, at least for now.
The mixed fundamental backdrop, along with the recent range-bound price action witnessed over the past one-and-a-half week or so, warrants some caution before positioning for a firm near-term direction. In the absence of any major market-moving economic releases, the broader market risk sentiment will continue to play a key role in influencing the GBP/JPY cross.
Technical levels to watch
- USD/TRY extends the move higher to 16.50.
- Turkey Economic Confidence Index improved to 96.70 in May.
- The CBRT kept the policy rate unchanged at 14.00%.
The Turkish lira extends the bearish mood and now pushes USD/TRY to fresh 2022 highs near the 16.50 level on Thursday.
USD/TRY stronger post-CBRT
USD/TRY keeps the march north unabated for the fourth consecutive session on Thursday. This time, the negative performance of the lira appears propped up by another “hold” by the Turkish central bank (CBRT) at its event earlier on Thursday.
Indeed, the CBRT kept the One-Week Repo Rate intact at 14.00%, paying little-to-none attention to the rampant inflation that hit a 2-decade high in April at nearly 70% vs. the same month of 2021.
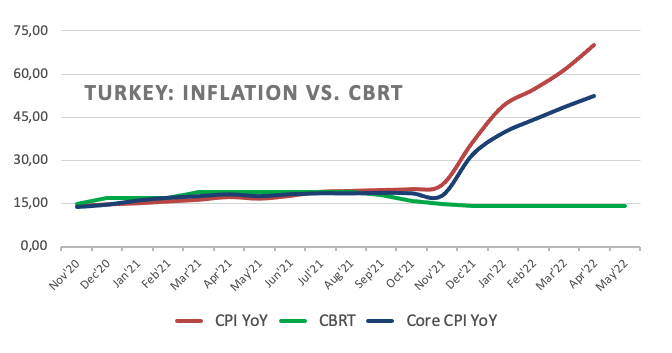
Once again, in its statement, the CBRT blames higher energy and commodity prices as well as supply shocks all stemming from the geopolitical landscape for the upside pressure in the domestic inflation, while it keeps unchanged the medium-term inflation goal at 5% amidst the ongoing “liraization strategy” (or whatever that means).
In the domestic calendar, the Economic Confidence Index improved to 96.70 in May (from 94.70).
What to look for around TRY
USD/TRY keeps the upside bias well and sound and trades beyond the 16.00 yardstick for the first time since late December 2021.
So far, price action in the Turkish currency is expected to gyrate around the performance of energy prices, the broad risk appetite trends, the Fed’s rate path and the developments from the war in Ukraine.
Extra risks facing TRY also come from the domestic backyard, as inflation gives no signs of abating, real interest rates remain entrenched in negative figures and the political pressure to keep the CBRT biased towards low interest rates remain omnipresent.
Key events in Turkey this week: Economic Confidence Index, CBRT Interest Rate Decision (Thursday).
Eminent issues on the back boiler: FX intervention by the CBRT. Progress (or lack of it) of the government’s new scheme oriented to support the lira via protected time deposits. Constant government pressure on the CBRT vs. bank’s credibility/independence. Bouts of geopolitical concerns. Structural reforms. Upcoming Presidential/Parliamentary elections.
USD/TRY key levels
So far, the pair is gaining 0.55% at 16.4053 and is expected to meet the next hurdle at 16.4554 (2022 high May 26) seconded by 18.2582 (all-time high December 20) and then 19.00 (round level). On the other and, a breach of 14.6836 (monthly low May 4) would expose 14.5458 (monthly low April 12) and finally 14.5136 (weekly low March 29).
UK Chancellor of the Exchequer (the UK's version of a Finance Minister) Rishi Sunak announced new plans to offer targeted support to the most vulnerable households in the UK on Thursday, reported Reuters. Sunak pledged to send one-off £650 payments to around 8 million of the country's lowest-income households, amounting to around £5 billion in support.
The payment will be made in two lump sums, Sunak continued, with the first to come in July and the second in the autumn. Payments will be made straight to bank accounts. People on disability benefits (around 6 million) will receive an additional £150 one-off payment. Taken together, the UK government's latest support package will help around one-third of UK households, Sunak stated.
Moreover, a prior repayment plan on energy bills that would have seen consumer paying off a government loan over the next few years has been converted into a grant and will thus no longer need to be repaid. Thus, the total measures announced on Thursday amount to an addition £15 billion in aid to households, Sunak noted, taking total support since the start of the cost-of-living crisis to around £37 billion.
US Q1 GDP Overview
Thursday's US economic docket highlights the release of the Preliminary GDP print for the first quarter, scheduled at 12:30 GMT. The second estimate is expected to show that growth in the world's largest economy contracted by 1.4% annualized pace during the January-March period as against the advance estimate pointing to a 1.4% decline.
How Could it Affect EUR/USD?
The backwards-looking data is unlikely to provide any meaningful impetus amid the worsening outlook for the global economy. Moreover, the markets have fully priced in a 50 bps at the next two FOMC meetings, suggesting that any reaction to the data is more likely to be short-lived. That said, a significant divergence from the expected numbers might still infuse some volatility, which, in turn, should influence the USD price dynamics and produce short-term trading opportunities around the EUR/USD pair.
Eren Sengezer, Editor at FXStreet, offered a brief technical outlook for the major: “EUR/USD is likely to continue to fluctuate within the 1.0740 (the end of the latest uptrend)-1.0630 (200-period SMA on the four-hour chart) range in the near term. The next significant action could be triggered once the pair breaks out of this channel..”
Eren also outlined important levels to trade the EUR/USD pair: “With a drop below 1.0630, EUR/USD could push lower toward 1.0600 (Fibonacci 38.2% retracement) and 1.0570 (50-period SMA). On the flip side, 1.0700 (psychological level) aligns as interim resistance ahead of 1.0740. A daily close above the latter could be seen as a significant bullish development and open the door for additional gains toward 1.0800 (psychological level).”
Key Notes
• EUR/USD Forecast: Key levels for next breakout defined
• EUR/USD regains composure and retargets 1.0700
• EUR/USD could quite easily see move back towards the 1.0550/1.0500 zone – ING
About US GDP
The Gross Domestic Product Annualized released by the US Bureau of Economic Analysis shows the monetary value of all the goods, services and structures produced within a country in a given period of time. GDP Annualized is a gross measure of market activity because it indicates the pace at which a country's economy is growing or decreasing. Generally speaking, a high reading or a better than expected number is seen as positive for equities, while a low reading is negative.
In an announcement relating to the UK's worst cost-of-living crisis in multiple decades on Thursday, UK Chancellor of the Exchequer (the UK's Finance Minister) said that the government will be introducing a temporary levy on energy profits, reported Reuters. The oil and gas sector is making extraordinary profits, Sunak noted, saying that he is sympathetic to taxing those profits.
It is possible to tax extraordinary profits and encourage investment, Sunak said, before announcing that the government would also be introducing a new investment tax incentive. The new profit levy will be charged at a rate of 25%, while the new investment allowance will double relief for energy and gas companies, meaning that the more a company invests, the less taxes they will pay.
UK Chancellor of the Exchequer (the same as a Finance Minister) Rishi Sunak delivered remarks regarding the UK cost of living crisis and outlined new government response measures on Thursday, Reuters reported. Sunak said that high inflation is causing acute distress, but that the UK has the tools needed to combat inflation, and that the country will turn the current moment of great difficulty into a springboard for economic growth.
- EUR/JPY alternates gains with losses in the sub-136.00 area.
- Further consolidation looks likely in the near term.
EUR/JPY trades in a volatile fashion after climbing as high as the 136.50 region earlier on Thursday.
Extra range bound appears on the cards for the cross in the short-term horizon, while gains could accelerate on a break above recent peaks in the 136.80 region. Beyond the latter, the next target of note comes at the May high at 138.31 (May 9).
In the meantime, while above the 200-day SMA at 131.32, the outlook for the cross is expected to remain constructive.
EUR/JPY daily chart
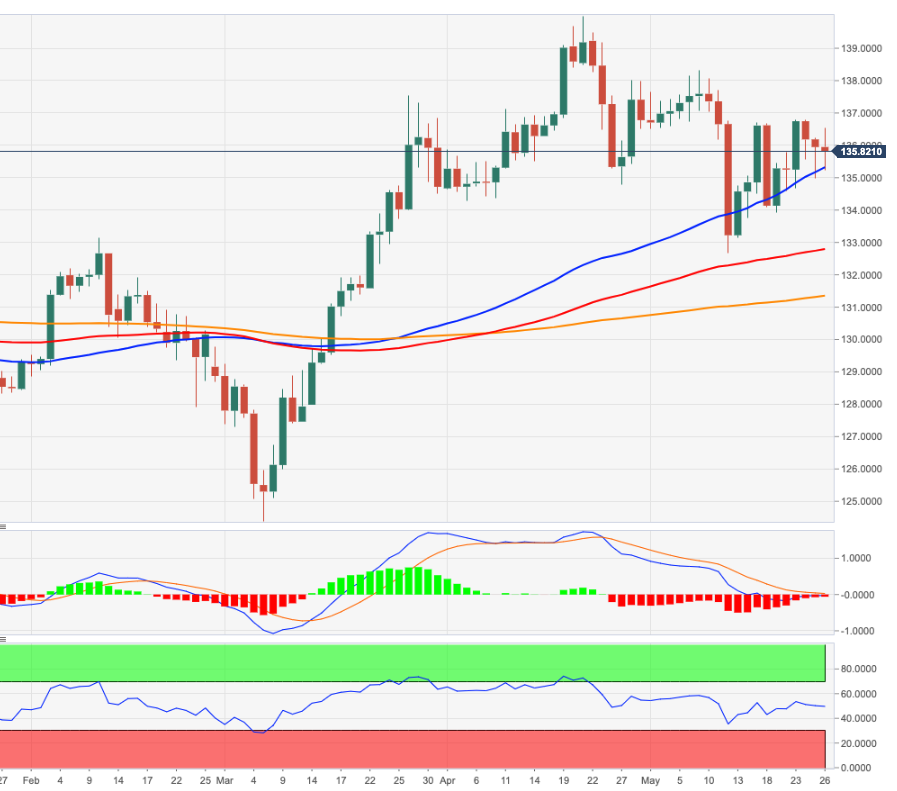
The Central Bank of the Republic of Turkey (CBRT) left its one-week repo rate unchanged at 14.0% on Thursday, as widely expected. The move to hold interest rates comes despite the fact that the YoY rate of inflation according to the Consumer Price Index rose to nearly 70% in April, data earlier in the month showed.
Market Reaction
The lira saw a choppy reaction to the latest CBRT announcement and USD/TRY continues to trade near multi-month highs in the 16.40 area on Thursday. The pair has rallied more than 10% from earlier monthly lows in the mid-14.00s over the past three weeks.
Many analysts suspect that the CBRT will be forced into hiking interest rates before the end of the year given the continued surge in inflation, as well as the continued devaluation of the lira, which is down roughly 20% on 2022 after dropping around 44% in value in 2021.
Lee Sue Ann, Economist at UOB Group, comments on the latest RBNZ event.
Key Takeaways
“In line with our and market expectations, the Reserve Bank of New Zealand (RBNZ) decided to raise its official cash rate (OCR) by 50bps to 2.00%. This is the first time the RBNZ has delivered back-to-back half-point increases since the OCR was introduced in 1999, and takes its accumulated amount of tightening to 175bps since Oct 2021.”
“The RBNZ clearly remains determined in containing inflation risks, stating that it remains appropriate to continue tightening monetary conditions at a pace to maintain price stability and support maximum sustainable employment.”
“There are four more monetary policy meetings for this year, with the next one on 13 Jul. Following the two back-to-back half-point increases, we expect the RBNZ to tune back to the more usual pace of 25bps hikes from Jul onwards as monetary policy tightening should get some traction by then, and amid likely evidence that demand will cool and the housing market will soften further.”
- NZD/USD was seen oscillating in a range below 0.6500 through the first half of the European session.
- Recession fears turned out to be a key factor that acted as a headwind for the perceived riskier kiwi.
- A softer tone surrounding the USD extended some support to the pair and helped limit the downside.
- Traders now look forward to the top-tier US macroeconomic releases for some meaningful impetus.
The NZD/USD pair struggled for a firm intraday direction and seesawed between tepid gains/minor losses through the first half of the European session. The pair was last seen trading in neutral territory, around the 0.6480 region.
Despite the Reserve Bank of New Zealand's hawkish signal on Wednesday, the worsening global economic outlook held back traders from placing aggressive bullish bets around the risk-sensitive kiwi. In fact, the markets remain worried that a more aggressive move by major central banks to constrain inflation and the Russia-Ukraine war could pose challenges to the global economy. That said, a softer tone surrounding the US dollar extended some support and helped limit the downside for the NZD/USD pair.
Minutes from the May 3-4 FOMC meeting showed that most participants believed a 50 bps rate hike would likely be appropriate in June and July. This, however, was fully priced in the markets and the lack of any major surprises reaffirmed the idea that the Fed could pause the rate hike cycle later this year. This, in turn, dragged the yield on the benchmark 10-year US government bond to a fresh six-week low. Apart from this, modest recovery in the risk sentiment further undermined the safe-haven greenback.
From a technical perspective, the NZD/USD pair, so far, has struggled to find acceptance above the 0.6500 psychological mark. This warrants some caution before positioning for an extension of the recent bounce from the YTD low. Traders now look forward to the US economic docket - featuring the Prelim Q1 GDP, Weekly Initial Jobless Claims and Pending Home Sales. This, along with the US bond yields and the broader market risk sentiment, will influence the USD and provide some impetus to the NZD/USD pair.
Technical levels to watch
- Gold Price is back in the red, falling for the second straight day.
- Less hawkish Fed minutes failed to impress gold bulls but not for long.
- XAUUSD inches closer towards critical 200-DMA support ahead of US data.
Gold Price is feeling the pull of gravity after less hawkish FOMC minutes released on Wednesday offered a brief reprieve to XAU bulls. The bright metal is extending the retreat from two-week highs of $1,870, as the US dollar clings onto minor recovery gains amid a cautious risk environment. The precious metal, however, seems to find some comfort from falling Treasury yields, as investors digest the latest Fed minutes, which squashed hopes for a more than 50 bps rate hike in the coming months. Going forward, gold’s fate hinges on the key US GDP, Pending Home Sales and PCE data, as it could impact the central bank’s expectations.
Also read: Gold Price Forecast: Key $1,838 support could be at risk ahead of US GDP
Gold Price: Key levels to watch
The Technical Confluences Detector shows that the Gold Price is facing a wall of powerful resistance levels, as it attempts a minor comeback.
Where the Fibonacci 23.6% one-day retracement and the 100-four-hour SMA converge at $1,848, provides an immediate upside barrier.
The next resistance is envisioned at around $1,850, where the Fibonacci 38.2% one-day retarcement, 5-four-hour SMA, and the previous high on the four-hour chart align.
Bulls will then look to take out the meeting point of the 5-day SMA and the 100-hour SMA at $1,854.
Further up, the Fibonacci 61.8% one-day retracement at $1,858 will be the level to beat for XAU buyers.
Alternatively, a sustained break below the $1,838 demand area, will trigger a fresh downswing. That price zone is a confluence of the previous day’s low, the daily S1 pivot point and the 200-day SMA.
Strong support at the intersection of the Fibonacci 23.6% weekly retracement, and the 10-day SMA at $1,836 will come to the rescue of bulls.
Should the selling pressure intensify, a steep drop towards the S2 daily pivot point at $1,827 will be in the offing.
Here is how it looks on the tool
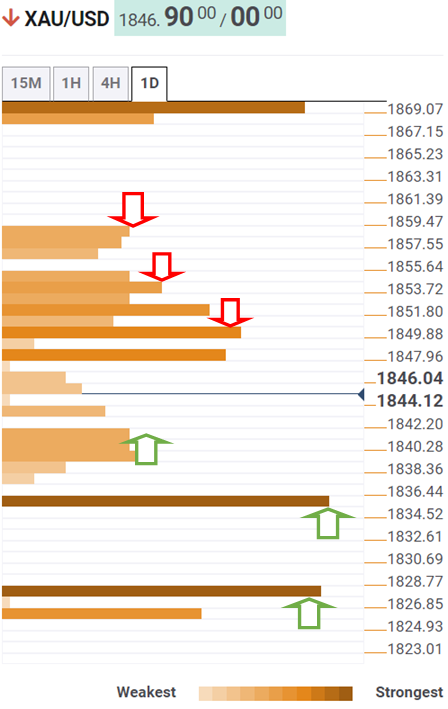
About Technical Confluences Detector
The TCD (Technical Confluences Detector) is a tool to locate and point out those price levels where there is a congestion of indicators, moving averages, Fibonacci levels, pivot points, etc.
If you are a short-term trader, you will find entry points for counter-trend strategies and hunt a few points at a time. If you are a medium-to-long-term trader, this tool will allow you to know in advance the price levels where a medium-to-long-term trend may stop and rest, where to unwind positions, or where to increase your position size.
- A combination of factors prompted fresh selling and dragged USD/JPY closer to the monthly low.
- Recession fears benefitted the safe-haven JPY and exerted pressure amid subdued USD demand.
- The Fed-BoJ policy divergence might help limit further losses ahead of the top-tier US macro data.
The USD/JPY pair maintained its offered tone through the first half of the European session and was last seen trading around the 126.75 region, just a few pips above the daily low.
The pair struggled to capitalize on the overnight modest recovery gains, instead came under renewed selling pressure on Thursday and retreated over 100 pips from the daily swing high. The prospects for a more aggressive move by major central banks to constrain inflation, along with the Russia-Ukraine war, have been fueling recession fears. This, in turn, continued lending some support to the safe-haven Japanese yen and acted as a headwind for the USD/JPY pair amid subsequent US dollar price action.
Minutes from the May 3-4 FOMC meeting showed that most participants believed a 50 bps rate hike would likely be appropriate in June and July. This, however, was fully priced in the markets and the lack of any major surprises reaffirmed the idea that the Fed could pause the rate hike cycle later this year. This, in turn, dragged the yield on the benchmark 10-year US government bond to a fresh six-week low, which kept the USD bulls on the defensive and further exerted downward pressure on the USD/JPY pair.
With the latest leg down, spot prices have moved well within the striking distance of the monthly low touched on Tuesday. It, however, remains to be seen if bearish are able to maintain their dominant position amid a big divergence in the monetary policy stance adopted by the Fed and the Bank of Japan. Hence, it will be prudent to wait for some follow-through selling before confirming a fresh bearish breakdown and positioning for any further near-term depreciating move for the USD/JPY pair.
Market participants now look forward to the US economic docket - featuring the release of the Prelim Q1 GDP, the usual Weekly Initial Jobless Claims and Pending Home Sales. This, along with the US bond yields, will influence the USD price dynamics and provide some impetus to the USD/JPY pair. Traders will further take cues from the broader market risk sentiment to grab short-term opportunities.
Technical levels to watch
Economist at UOB Group Enrico Tanuwidjaja reviews the latest interest rate decision by the Bank Indonesia (BI).
Key Takeaways
“Bank Indonesia (BI) kept its benchmark rate (7-Day Reverse Repo) unchanged at 3.50% at its May MPC meeting. Consequently, BI maintained the Deposit Facility rate at 2.75% as well as the Lending Facility rate at 4.25%.”
“The policy of liquidity normalisation will be accelerated through a gradual increase in Reserve Requirement (RR) for Conventional Bank from the current 5% to 6% starting on 1 June 2022, and further to 7.5% starting on 1 July 2022 and to 9.0% starting on 1 September 2022.”
“We keep our view for BI to start hiking in mid-2022, with two 25bps hikes in 3Q 2022 to 4.00%, followed by another two 25bps hikes in 4Q, taking its benchmark rate to 4.5% by the end of 2022.”
Global growth forecasts slip with Russia’s invasion of Ukraine and China lockdowns, Moody’s Investors Services highlighted in its latest report published on Thursday.
Additional takeaways
Advanced economies will expand 2.6% in 2022 and emerging market countries will grow 3.8%, down from march forecasts of 3.2% and 4.2%.
Currently high inflation rates could persist for several more months, owing to elevated energy and food prices.
Except for Russia, do not currently expect a recession in any G-20 country in 2022 or 2023.
Risks that could further reduce forecasts include escalation of Russia-Ukraine conflict, faster-than-expected slowdown in China’s growth.
- Silver edged lower for the second straight day and dropped back closer to the weekly low.
- The set-up favours bearish traders, though the lack of follow-through warrants some caution.
- Sustained move beyond the 61.8% Fibo. is needed to negate the near-term negative outlook.
Silver witnessed some selling for the second successive day on Thursday and dropped back closer to the lower end of its weekly range during the first half of the European session. The white metal was last seen trading around the $21.80 region, down 0.85% for the day.
From a technical perspective, the recent recovery from the YTD low faltered near a resistance marked by the 61.8% Fibonacci retracement level of the $23.24-$20.46 downfall. The subsequent decline favours bearish traders amid bearish oscillators on daily/hourly charts.
That said, the range-bound price moves witnessed over the past one-week point to indecision over the near-term trajectory for the XAG/USD. This makes it prudent to wait for a break below the trading range support, near the $21.65-$21.60 area, before placing fresh bearish bets.
Some follow-through selling below the 38.2% Fibo. level, around mid-$21.00s, will reaffirm the negative bias. The XAG/USD could then slide below the $21.30-$21.25 region and accelerate the slide towards the 23.6% Fibo. level, around the $21.15 area, en-route the $21.00 mark.
The downward momentum could further get extended and drag spot prices back towards the YTD low, around the $20.45 region touched earlier this month. The latter should act as a pivotal point, which if broken would make the XAG/USD vulnerable to challenging the $20.00 psychological mark.
On the flip side, any meaningful recovery attempt beyond the $22.00 round figure might continue to confront stiff resistance near the $22.20 region (61.8% Fibo. level). This is closely followed by the $21.35 hurdle, above which the XAG/USD could climb to the $22.65 region.
Silver 4-hour chart
-637891525992149736.png)
Key levels to watch
- USD/CAD drops back below 1.2600, tracking the pullback in the US dollar.
- The oil price rebound also lends support to the major.
- USD/CAD turns lower towards 21-DMA after rejection above 200-DMA.
USD/CAD is off the daily highs near 1.2850 but remains better bid above 1.2800, as bulls find support from the pause in the US dollar sell-off ahead of the US GDP and Canadian Retail Sales data.
The dollar licks its wound following the not-that-hawkish Fed May meeting’s minutes, as it downplayed expectations of a more than 50 bps rate hike in the third quarter.
Meanwhile, the strength in the US oil prices caps the upside in the major, lending support to the resource-linked Canadian dollar.
Looking ahead, the US Q1 GDP revision, Pending Home Sales and the Canadian Retail Sales data will offer fresh trading impetus to USD/CAD traders.
From a short-term technical perspective, USD/CAD bulls have failed to find acceptance at higher levels after Monday’s slump to 1.2765 levels.
The 14-day Relative Strength Index (RSI) is trading listlessly just above the midline, suggesting that the spot lacks a clear directional bias.
Only a sustained move above the horizontal 21-Daily Moving Average (DMA) level at 1.2870 could help initiate a meaningful recovery towards 1.2900.
The 1.2950 psychological level will be the next relevant upside target.
USD/CAD: Daily chart
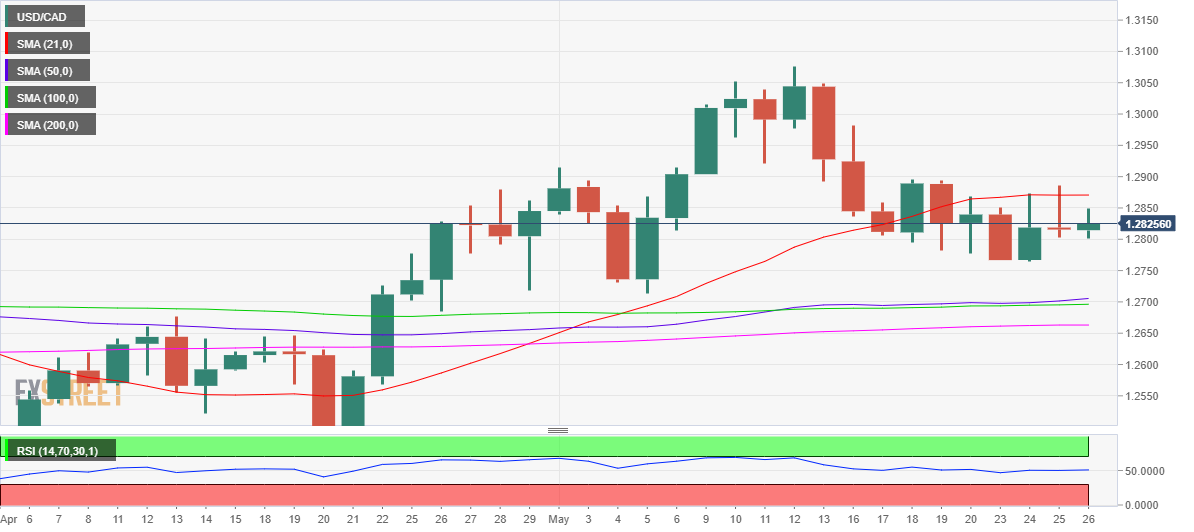
On the downside, bears need to crack the 1.2765 key demand area to resume the downtrend from May highs of 1.3076.
Further down, the confluence of the 50 and 100-DMAs around 1.2700 will act as strong support, below which the mildly bullish 200-DMA at 1.2663 will come into play.
USD/CAD: Additional levels to consider
- A combination of factors assisted AUD/USD to attract some dip-buying on Thursday.
- Sliding US bond yields and a positive risk tone undermined the safe-haven greenback.
- The RBA’s hawkish signal extended additional support to the perceived riskier aussie.
The AUD/USD pair attracted some dip-buying in the vicinity of mid-0.7000s during the early part of the European session, albeit struggled to capitalize on the move. The pair was last seen trading just a few pips below the 0.7100 mark, nearly unchanged for the day.
In the absence of any major surprises from the latest FOMC meeting minutes, the idea that the Fed could pause the rate hike cycle later this year dragged the US Treasury bond yields lower. This, along with a solid recovery in the equity markets, undermined the safe-haven US dollar and extended some support to the risk-sensitive aussie.
That said, the worsening global economic outlook should keep a lid on any optimistic move. Investors remain worried that a more aggressive move by major central banks to constrain inflation and the Russia-Ukraine war could pose challenges to the global economy. This, in turn, acted as a tailwind for the greenback and capped the AUD/USD pair.
Even from a technical perspective, spot prices have been oscillating in a broader trading range since the beginning of this week. The price action seems to suggest that the markets have already priced in the Reserve Bank of Australia's hawkish signal that a bigger interest rate hike is still possible in June. This warrants caution for bullish traders.
Market participants now look forward to the US economic docket - featuring the release of Prelim Q1 GDP, the usual Weekly Initial Jobless Claims and Pending Home Sales. The data might influence the USD price dynamics and provide some impetus to the AUD/USD pair. Traders will further take cues from the broader risk sentiment for short-term opportunities.
Technical levels to watch
A soft US Dollar Index (DXY) backdrop is forming. Nonetheless, in the opinion of economists at Westpac, it is still too early to call a long-term DXY peak. They believe that DXY could range for a bit, but retracements into the 101 level are a buy.
Too early to call a long-term peak
“Too early to call a long-term DXY peak, though a softer USD macro backdrop is nevertheless taking root.”
“China is starting to reopen, the ECB is adopting a more hawkish policy path and tighter US financial conditions are starting to bite into US growth.”
“DXY could range between 101-105 for a while here, but a long-term peak is not yet in.”
USD pullback has helped the aussie to probe 0.71. However, fragile equities and China worries argue for rallies to struggle around 0.7135 resistance, analysts at Westpac report.
AUD/USD to spend considerable time in the high 60s heading into the FOMC’s June meeting
“China’s Covid battle remains a headwind, despite Shanghai announcing wary loosening of restrictions. Fragile equities also argue for AUD/USD rallies to struggle around 0.7135 resistance.”
“We switch from down to neutral on the week but expect the aussie to spend considerable time in the high 60s heading into the FOMC’s June meeting.”
In the view of analysts at Westpac, kiwi’s April low at 0.6217 is potentially a launchpad to much higher levels. They target the 0.66 area during the week ahead.
Targeting 0.70 by year-end
“NZD/USD made a tentative bottom at 0.6217 on 12 May, but it’s not yet clear that will be the launching pad for a run to our year-end target of 0.7000.”
“Near term, we do remain bullish, particularly given the RBNZ’s more hawkish posture which was revealed yesterday. We target 0.66 during the week ahead.”
Escalating inflation and persistent labour market tightness, at least in the near term, are shifting yield spread trends. In the view of economists at Westpac, GBP/USD remains vulnerable but also likely to consolidate.
Heightened concerns of recession in the UK
“The combination of persistently higher inflation and the cost of living crunch on final demand put the UK at the top of major economies at risk of stagflation.”
“GBP/USD now appears to have lifted its likely consolidation range trading to 1.24-1.28 but with risks of flipping lower if business surveys were to weaken.”
European Central Bank’s (ECB) hawkish highlighting of an early end of NIRP have been accompanied by overt references to unfavourable EUR weakness. Further consolidation is likely into the June ECB meeting, economists at Westpac report.
More consolidation seems likely
“ECB has increased its rhetoric around more proactive policy tightening to be detailed at their 9th June General Council meeting with its updated staff projections. It is clear that the ECB’s core is now more hawkish, but the past week has also seen calls for gradual policy adjustments from more dovish ECB members, who may also be concerned about growth downgrades and the widening of bond spreads, euphemistically referred to as fragmentation.”
“EUR/USD has rebounded from forays below 1.05 and more consolidation seems likely, with a sharper squeeze unlikely prior to the ECB’s 9th June meeting.”
- GBP/USD climbed to a three-week high on Thursday amid subdued USD price action.
- Recession fears, the risk-off mood should limit deeper losses for the safe-haven buck.
- Doubts about further BoE rate hikes, Brexit woes might cap gains for the British pound.
The GBP/USD pair reversed an early European session dip to mid-1.2500s and jumped back closer to a three-week high touched earlier this Thursday. The pair was last seen trading around the 1.2585-1.2590 region, up less than 0.15% for the day.
The US dollar struggled to capitalize on the overnight bounce from a nearly one-month low, which, in turn, pushed the GBP/USD pair higher for the second successive day on Thursday. Minutes from the May 3-4 FOMC meeting showed that most participants believed a 50 bps rate increase would likely be appropriate in June and July. The expected move, however, is already priced in the markets and the lack of any major surprises reaffirmed the idea that the Fed could pause the rate hike cycle later this year. This, along with a softer tone surrounding the US Treasury bond yields, acted as a headwind for the buck.
That said, concerns about softening global economic growth and the prevalent risk-off mood might continue to benefit the greenback's status as the reserve currency. Investors remain worried that a more aggressive move by major central banks to constrain inflation and the Russia-Ukraine war could pose challenges to the global economy. Apart from this, diminishing odds for further rate hikes by the Bank of England and Brexit woes should hold back traders from placing aggressive bullish bets around the British pound. This warrants caution before positioning for any further appreciating move for the GBP/USD pair.
There isn't any major market-moving economic data due for release from the UK, leaving the pair at the mercy of the USD price dynamics. Later during the early North American session, traders will take cues from the US economic docket - featuring the release of Prelim Q1 GDP, the usual Weekly Initial Jobless Claims and Pending Home Sales. Apart from this, the broader market risk sentiment will drive the USD demand and produce short-term trading opportunities around the GBP/USD pair.
Technical levels to watch
The Central Bank of Russia announced on Thursday that it cut its policy rate by 300 basis points to 11% from 14%.
In its policy statement, the central bank noted that it holds open the prospect of additional rate reductions in its upcoming meetings.
Additional takeaways per Reuters
"Latest weekly data point to a significant slowdown in the current price growth rates."
"Funds continue to flow into fixed-term ruble deposits while lending activity remains weak."
"External conditions for the Russian economy are still challenging, considerably constraining economic activity."
"Financial stability risks decreased somewhat, enabling relaxation of some capital control measures."
"Annual inflation will decrease to 5-7% in 2023 and return to 4% in 2024."
Market reaction
With the initial reaction, the USD/RUB pair shot higher and was last seen rising 2.6% on the day at 60.9030.
- EUR/USD leaves behind Wednesday’s pullback.
- The dollar starts the European session on the back footing.
- US Flash Q1 GDP, Initial Claims take centre stage later in the NA session.
The single currency appears bid and motivates EUR/USD to attempt another bull run to the 1.0700 neighbourhood.
EUR/USD focuses on 1.0750
EUR/USD manages to regain some upside traction and trade at shouting distance from the 1.0700 barrier. The surpass of this level should sponsor a probable challenge of the May high near 1.0750 recorded earlier in the week.
The small gains in the pair come amidst shrinking yields in both US and German money markets in a context of alternating risk appetite trends and following recent hawkish messages from ECB’s rate setters and the absence of any surprises from the release of the FOMC Minutes on Wednesday.
The euro calendar will be empty on Wednesday and this should leave all the attention to another revision of the US Q1 GDP followed by usual weekly Claims and results from the housing sector.
What to look for around EUR
The moderate rebound in the dollar put the recent sharp upside in EUR/USD to the test and sparked a moderate drop to the 1.0640 region, where decent contention appears to have emerged.
Despite the pair’s upside impulse, the broader outlook for the single currency remains negative for the time being. As usual, price action in spot should reflect dollar dynamics, geopolitical concerns and the Fed-ECB divergence.
Occasional pockets of strength in the single currency, however, should appear reinforced by speculation the ECB could raise rates at some point in the summer, while higher German yields, elevated inflation and a decent pace of the economic recovery in the region are also supportive of an improvement in the mood around the euro.
Eminent issues on the back boiler: Speculation of the start of the hiking cycle by the ECB as soon as this summer. Asymmetric economic recovery post-pandemic in the euro area. Impact of the war in Ukraine on the region’s growth prospects.
EUR/USD levels to watch
So far, spot is gaining 0.11% at 1.0688 and faces the immediate hurdle at 1.0748 (monthly high May 24) followed by 1.0773 (55-day SMA) and finally 1.0936 (weekly high April 21). On the other hand, a breach of 1.0459 (low May 18) would target 1.0348 (2022 low May 13) en route to 1.0340 (2017 low January 3 2017).
FX Strategists at UOB Group Lee Sue Ann and Quek Ser Leang noted USD/CNH is expected to keep its consolidative mood between 6.6500 and 6.7500 in the next weeks.
Key Quotes
24-hour view: “We expected USD to trade sideways yesterday. However, USD surged to a high of 6.7220 before pulling back. The rapid rise appears to be running ahead of itself and USD is unlikely to strengthen further. For today, USD is more likely to consolidate and trade between 6.6700 and 6.7200.”
Next 1-3 weeks: “USD soared and took out our ‘strong resistance’ level at 6.7100 yesterday (high of 6.7220). The break of the ‘strong resistance’ level indicates that the downward pressure that started about a week ago has eased. The current movement appears to be part of a consolidation phase and USD is likely to trade between 6.6500 and 6.7500.”
- DXY trades with light gains above the 102.00 mark.
- US yields extend the gradual move lower along the curve.
- Advanced Q1 GDP, Claims, Pending Home Sales next on tap.
The US Dollar Index (DXY), which gauges the greenback vs. a bundle of its main rival currencies, advances modestly above the102.00 mark on Thursday.
US Dollar Index looks to data, risk trends
The index posts gains for the second session in a row on Thursday and looks to consolidate the breakout of the 102.00 yardstick and put further distance from Monday’s new lows in the 101.65/60 band.
The dollar appears slightly bid in the wake of the opening bell in Euroland, as market participants continue to digest the release of the FOMC Minutes late on Wednesday. On the latter, there were no surprises following an upbeat assessment of the economy’s health by FOMC members, who also agreed that a 50 bps rate hike would be appropriate at the next couple of meetings.
In the US cash markets, yields extend the relentless corrective downside along the curve so far, in line with the performance in the rest of the global debt markets.
Later in the session, weekly Claims are due seconded by another revision of the Q1 GDP and Pending Home Sales.
What to look for around USD
The dollar extends the weekly rebound from monthly lows in the sub-102.00 region printed earlier in the week.
In the meantime, a tighter rate path by the Federal Reserve looks more and more priced in, while the elevated inflation narrative and the tight labour market seem to still support further upside in the dollar in the longer run.
On the negatives for the greenback, the incipient speculation of a “hard landing” of the US economy as a result of the Fed’s more aggressive normalization carries the potential to undermine the bullish prospects for the buck.
Key events in the US this week: Flash Q1 GDP, Initial Claims, Pending Home Sales (Thursday) – Core PCE, Personal Income/Spending, Final Consumer Sentiment (Friday).
Eminent issues on the back boiler: Speculation of a “hard landing” of the US economy. Escalating geopolitical effervescence vs. Russia and China. Fed’s more aggressive rate path this year and 2023. US-China trade conflict. Future of Biden’s Build Back Better plan.
US Dollar Index relevant levels
Now, the index is gaining 0.02% at 102.07 and a break above 105.00 (2022 high May 13) would open the door to 105.63 (high December 11 2002) and finally 106.00 (round level). On the other hand, the next contention emerges at 101.64 (monthly low May 24) followed by 101.03 (55-day SMA) and then 99.81 (weekly low April 21).
The US Dollar Index (DXY) fluctuates in a relatively tight range above 102.00. Economists at ING expect the dollar to stay bid and see the DXY returning to the 103.30 area.
Hawkish set of FOMC minutes should keep the dollar supported
“A hawkish set of FOMC minutes and ongoing concerns about Chinese growth prospects continue to provide the dollar with support and make for an uneasy environment for risk assets.”
“We prefer to see the recent DXY 3% dip as a bull market correction and favour a near-term recovery to the 103.30 area as the Fed cycle is re-priced higher again.”
“We doubt today's US data of the revised 1Q GDP number, initial jobless claims or pending home sales will have much say in dollar pricing.”
EUR/CHF’s recent advance failed to overcome the YTD high at 1.0615. A break under April’s 1.0189 lows and 1.0086 support should further expose downside risks, Benjamin Wong, Strategist at DBS Bank reports.
Maintain bearish stance
“The cross has merely touched a YTD high at 1.0615, and a break under April’s 1.0189 lows appears to be on the way, and onward to the next support down 1.0086.”
“The 78.6% Fibonacci retracement of the 1.1152-0.9972 range grip at 1.0898 remains a formidable level to take out should the bulls return since it sits nicely with the cloud fringe resistance level.”
“The eurozone is Switzerland’s largest trading partner, and its inflation profile is 4% higher vs that of the Swiss – this means the EUR/CHF can trade lower nominally.
Bank of Japan (BOJ) Haruhiko Kuroda said in a statement on Thursday, not to expect inflation to stay around 2% next year and the year after.
Additional quotes
BOJ must maintain easy policy for time being but when right time comes, it will debate exit strategy and lay out its plan to public.
When debating exit strategy, key will be how to raise rates and reduce BOJ’s balance sheet.
When exiting easy policy, BOJ will likely combine rate hike and balance sheet reduction though specific means, timing will depend on economic, price, financial developments at the time.
BOJ has ability to execute smooth exit from easy policy, though it won't be easy.
US rate hike may not necessarily lead to weaker yen via outflow of funds from Japan, if it affects American stock prices.
-
Forex Today: Markets turn cautious as focus shifts to key US data
The Central Bank of Russia (CBR) has announced an emergency monetary policy meeting for today. Economists at ING expect Russia to slash rates again. However, this move is not set to drag the rouble down for the moment, but USD/RUB is forecast at 75 by end-2022.
Russia to cut rates further today
“We look for a 200-300bp CBR rate cut today to take the base rate to 11-12%. This large cut should be aided by signs that inflation expectations are falling and in an effort to soften what Dmitry thinks will be a 10-15% fall in Russian GDP this year.”
“As to the rouble, we think USD/RUB will be ending the year around 75 as the partial or potential total EU embargo on Russian oil hits in 2H22, while at the same time Russian resident demand for FX and imports start to stabilise. Before then, however, and because USD/RUB is mainly being driven by Russian commercial flows, the large rate cut may not send the rouble too much lower in the near-term.”
- Some follow-through USD buying dragged gold prices lower for the second straight day on Thursday.
- Recession fears continued weighing on investors’ sentiment and could lend support to the XAU/USD.
- Traders look forward to the US GDP report and other macro releases for some meaningful impetus.
Gold extended the overnight retracement slide from over a two-week high and witnessed selling for the second successive day on Thursday. The XAUUSD remained depressed through the early European session and was last seen trading just above the very important 200-day SMA support near the $1,840 region.
Minutes from the May 3-4 FOMC meeting showed that most participants believed a 50 bps rate increase would likely be appropriate in June and July. Apart from this, the worsening global economic outlook benefitted the US dollar's status as the global reserve currency, which, in turn, undermined demand for the dollar-denominated gold.
The downside, however, seems cushioned amid a generally weaker tone around the equity markets, which tends to benefit the safe-haven gold. The prospects for a more aggressive move by major central banks to constrain inflation, along with the Russia-Ukraine war, have been fueling recession fears and continued weighing on investors' sentiment.
The anti-risk flow was reinforced by the recent decline in the US Treasury bond yields. This might hold back the USD bulls from placing aggressive bets and further lend some support to the non-yielding gold. Hence, it will be prudent to wait for strong follow-through selling before positioning for the resumption of the prior descending trend.
Market participants now look forward to the US economic docket - featuring the release of the Prelim Q1 GDP, the usual Weekly Initial Jobless Claims and Pending Home Sales. This, along with the US bond yields, will influence the USD price dynamics. Traders will further take cues from the broader market risk sentiment to grab short-term opportunities around gold.
Technical levels to watch
EUR/USD stays relatively quiet below 1.07 early Thursday. Economists at ING expect the world’s most popular currency pair to move back lower towards the 1.0550/00 area.
ECB seems to be using the prospect of aggressive tightening to support the EUR
“EUR/USD looks to have stalled at the top of a potential 1.02-1.08 trading range and we could quite easily see a near-term move back towards the 1.0500/1.0550 area as the Fed cycle is repriced higher.”
“We struggle to see the ECB 'out-Fedding' the Fed when it comes to tightening – even though the ECB seems to be using the prospect of aggressive tightening to support EUR/USD.”
- USD/RUB grinds higher after bouncing off multi-year low.
- Russian central bank calls for an emergency meeting on Thursday.
- Russian bondholders fear Moscow’s default on some foreign currency debts.
- US dollar reverses losses made after Fed Minutes amid fears of global recession.
USD/RUB fades bounce off the lowest levels since 2018 even as traders fear default of Russia's debt. The reason could be linked to the market’s anxiety ahead of the Russian central bank’s emergency meeting. That said, the Russian ruble (RUB) pair drops 1.30% around 59.52 heading into Thursday’s European session.
That said, the Central Bank of the Russian Federation (CBR) has called an emergency monetary policy meeting, for Thursday, to rein the ruble prices that rallied too far since early March. “An unscheduled policy meeting for Thursday has spurred expectations for a big reduction, and the possibility that capital restrictions may be loosened further,” said Bloomberg ahead of the meeting.
Also adding to the bullish bias for USD/RUB are the concerns over Russia’s debt default. “Russia could already be in default on some of its foreign currency debts, according to bondholders that claim they are still owed a small interest payment that Moscow didn’t send to them earlier this spring,” per the Wall Street Journal (WSJ).
Elsewhere, the US Dollar Index (DXY) picks up bids to refresh its daily top around 102.25. In doing so, the DXY reverses the previous day’s losses after the Fed Minutes raised doubts on the 50 bps rate hike trajectory post-September.
The underlying reasons could be linked to the escalating market fears of global recession, as well as growing pessimism surrounding China and Russia. The comments from US Trade Representative General Counsel Greta Peisch suggesting, “Review of US-Sino tariffs is likely to take ‘months’,” become a fresh threat to the US-China trade relations. Previously, Beijing criticized the US Draft Security Council resolution on North Korea and added strength to the Sino-American tensions. Also negative from China are the covid-led lockdowns that weigh on the world’s second-largest economy.
On the other hand, World Bank President David Malpass said, “Russia's war in Ukraine and its impact on food and energy prices, as well as the availability of fertilizer, could trigger a global recession."
Additionally, the second readings of the US Q1 2022 GDP, the annualized figure is expected to remain unchanged at -1.4%, will join the US Personal Consumption Expenditure (PCE) details for April and weekly jobless claims, which will also be important for USD/RUB traders.
Technical analysis
A 12-day-old descending trend line resistance, around 61.62 by the press time, guards immediate recovery of USD/RUB. On the contrary, a downward sloping support line from early April, close to 53.80, lures the bears. Overall, bears keep the reins but run out of steam of late.
The focus in the UK today is on the potential announcement from Chancellor Rishi Sunak of new fiscal support measures. Economists at ING expect this event to have a positive impact on the pound, dragging the EUR/GBP pair down to the 0.8450 area.
Fiscal stimulus could help the pound
“The potential announcement of a GBP10bn fiscal stimulus to address the cost of living crisis could be a means-targeted measure coming through energy bills. What could this mean for sterling? The positive could be that it allows the Bank of England (BoE) more freedom to hike. The negative could come through the equity channel where the windfall tax on oil, gas and electricity suppliers could deliver UK equity underperformance.”
“We prefer the positive factor dominating and EUR/GBP trading back towards the lower end of a new 0.8450-0.8600 trading range.”
Here is what you need to know on Thursday, May 26:
Markets seem to have turned cautious early Thursday ahead of key data releases from the US. The US Dollar Index fluctuates in a relatively tight range above 102.00 following Wednesday's rebound and US stock index futures are down between 0.3% and 0.7% in the early European session. The US Bureau of Economic Analysis will release its second estimate of the first-quarter GDP growth later in the session and the US Department of Labor will publish the weekly Initial Jobless Claims data. The Pending Home Sales change for April will be featured in the US economic docket as well.
The Federal Reserve's May policy meeting minutes reaffirmed that the Fed remains on track to hike its policy rate by 50 basis points in June and July. The publication further revealed that many participants judged that inflation risks were skewed to the upside and showed that a number of policymakers thought it would be appropriate to consider sales of mortgage-backed securities.
Meanwhile, the city of Beijing reported 45 new coronavirus cases on Wednesday, down slightly from 47 reported on Tuesday. On a positive note, ports in Shanghai are reportedly operating at 95% capacity. The Shanghai Composite Index closed the second straight day in positive territory, gaining more than 1% during that period.
NZD/USD lost its traction after jumping to a fresh three-week high above 0.6500 on Wednesday. Reserve Bank of New Zealand Governor Adrian Orr acknowledged on Thursday that they can't rule out a recession.
USD/CAD is moving sideways above 1.2800 early Thursday. Later in the session, Statistics Canada is expected to report a 1.4% increase in Retail Sales in March following February's increase of 0.1%.
EUR/USD stays relatively quiet below 1.0700 early Thursday. ECB Governing Council member Klaas Knot said on Wednesday that inflation expectations were well-anchored at the upper limit and a 50 basis points rate hike in July was on the table. These comments, however, failed to help the shared currency regather its strength. There won't be any high-impact macroeconomic data releases featured in the European economic docket on Thursday.
GBP/USD registered small gains on Wednesday as buyers continued to defend the 1.2500 level. The pair, however, stays on the back foot and trades near 1.2550 on Thursday amid risk aversion.
USD/JPY moves up and down in a narrow channel above 127.00. Japanese Prime Minister Fumio Kishida said earlier in the day that the Bank of Japan should make effort to achieve the 2% inflation target "stably and sustainably."
Gold snapped a five-day winning streak on Wednesday and extended its slide early Thursday. XAU/USD was last seen trading below $1,850. The benchmark 10-year US Treasury bond yield is down nearly 1% on the day, helping the pair limit its losses for the time being.
Bitcoin continues to have a difficult time making a decisive move in either direction and stays below the key $30,000 handle. Ethereum edges lower in the European morning and was last seen testing $1,900.
The Bank of Korea (BoK) hiked its policy rate by 25bps to 1.75%, as widely expected. USD/KRW held steady at around 1264 after the rate decision. Economists at Commerzbank expect the pair to retain a supportive tone in the short-term.
Fighting inflation when push comes to shove
“BoK raised rates by 25bp to 1.75% as widely expected. BoK made it explicitly clear that it will emphasize fighting inflation risks in the coming months, even at the expense of growth.”
“The money market is pricing in 3.05% for the benchmark rate in one year, suggesting another 125bp worth of rate hikes in the next twelve months. The newly appointed Governor Rhee said that inflation is expected to climb above 5% from May to July and more worryingly, it could stay elevated in 2023 at 3%-4% due to higher grain prices.”
“We would note that 2.7% growth is still not too weak. However, BoK expects growth to moderate further in 2023 to 2.4% but the risks are tilted to the downside given the tightening in monetary conditions.”
“A hawkish path for BoK rate policy could provide some support for KRW, but overall, we still look for a supportive tone in USD/KRW near term.”
Further decline in USD/JPY is likely and could retest the 125.60 region in the next weeks, noted FX Strategists at UOB Group Lee Sue Ann and Quek Ser Leang.
Key Quotes
24-hour view: “We highlighted yesterday that ‘the rapid drop appears to be overdone and USD is unlikely to weaken further’ and we expected USD consolidate and trade between 126.40 and 127.40. USD subsequently traded between 126.63 and 127.49. We continue to view the price actions as part of a consolidation even though the slightly firmed underlying tone suggests a higher range of 126.90/127.60.”
Next 1-3 weeks: “Our update from yesterday (25 May, spot at 126.95) still stands. As highlighted, the oversold decline in USD has room to extend to 126.00, possibly 125.60. On the upside, a breach of 127.90 (no change in ‘strong resistance’ level was from yesterday) would indicate that the weakness in USD that started about two weeks ago has run its course.”
In Mexico, Thursday’s publication of the minutes of the May meeting might provide further insights into the diverging views on future rate developments. In absence of hawkish arguments pointing towards accelerated rate hikes, the peso could come under pressure, economists at Commerzbank report.
How hawkish will the Banxico minutes sound today?
“The majority of the central bankers had voted in favour of a 50bp rate hike to now 7% with one member favouring a larger step. Banxico’s hawkish approach had further fuelled the market’s rate expectations, quite a few market participants seem to expect a larger rate step in June. That means a lot seems to have been priced in already, which is also reflected in the robust peso.”
“We see the risk of small peso losses if the minutes are not characterised by hawkish arguments which point towards accelerated rate hikes.”
Open interest in natural gas futures markets resumed the downtrend and shrank by nearly 8K contracts on Wednesday, according to advanced prints from CME Group. On the other hand, volume extended the choppy activity and went up by around 64.3K contracts.
Natural Gas now targets $10.00
Prices of natural gas climbed to fresh cycle tops past the $9.00 mark per MMBtu on Wednesday, levels last seen back in August 2008. The move, however, was on the back of shrinking open interest, opening the door to some corrective move in the short-term horizon.
Ahead of an expected announcement of new measures to aid households on Thursday, UK Cabinet Office Minister Steve Barclay said the Kingdom must pay for the increased support in a way that does not deter investment.
"In terms of paying for that, as we look at the balance between how much is done through debt, and how much is done through revenue raising, we need to do that in a way that doesn't deter investment," Barclay said.
UK Finance Minister Rishi Sunak is likely to announce measures, which will likely include a 10 billion pound ($12.6 billion) package of support, an energy industry source said.
Market reaction
GBP/USD is testing lows near 1.2550, uninspired by a likely announcement of fiscal measures, which could ease the cost-of-living pressures faced by households. The spot is down 0.09% on the day.
Today, Turkey’s central bank (CBT) will hold its routine monthly meeting. Despite the high inflation level, economists at Commerzbank expect the CBT to stand pat. Subsequently, they believe that the next big move in USD/TRY is around the corner.
CBT’s announcement to turn out to be a non-event
“CBT’s announcement is, once again, likely to turn out to be a non-event as it has been over the past couple of quarters: CBT is widely expected to keep its benchmark rate unchanged at 14% even as inflation touches 70% and inflation expectations touch 60%, simply because CBT is not really free to hike rates.”
“In fact, had it not been for constant depreciation pressure on the lira exchange rate, CBT probably might have even cut the rate.”
“We stick with our view that as Turkey’s real interest rate stays deeply negative, the next big move in USD/TRY is getting closer.”
Russia’s central bank (CBR) has called an emergency meeting today. The continued appreciation pressure on the rouble has become somewhat of a problem for policymakers. However, although economists at Commerzbank expect the CBR to lower interest rates, the impact on the rouble is set to be limited.
Few obstacles to bringing the interest rate down
“This rouble strength is more technical (rouble only driven by trade flows; within trade, imports have collapsed), than it is indicative of fundamental outlook (like a normal exchange rate would have been). For that, one would need the exchange rate to be fully convertible, and capital to flow freely – neither is the case.”
“FX-passthrough is no longer driving inflation higher. Inflation fundamentals in Russia are rapidly cooling off. This is why high-interest rates may not be required. High-interest rates are also not required to defend the currency because the rouble is protected by comprehensive capital controls.”
“There are few obstacles to bringing the interest rate down to lower levels and support an economy which is contracting by c.8%-10%. Exactly by how much CBR will lower the rate today is besides the point – a reduction from 14% to 9% or 10% would not surprise us – we anticipate no significant impact on the FX market.”
The Norwegian krone has recorded significant losses since early May. Nonetheless, economists at Commerzbank expect the EUR/NOK to reverse back lower towards the 10.00 level.
Do not give up NOK bulls!
“I consider the NOK losses to be overdone. First of all, Norway will remain an important energy provider for Europe, benefiting from steady strong export revenues. But in particular, since the April inflation data surprised clearly on the upside suggesting that in June Norges Bank will not only hike its key rate again but might also raise its rate path to signal a tighter cycle.”
“I remain optimistic that in the foreseeable future we will once again see levels around 10.00 and lower in EUR/NOK and would tend to buy NOK on dips.”
This Thursday, gold is seeing fresh selling pressure. As FXstreet’s Dhwani Mehta notes, the key $1,838 support could be at risk ahead of US GDP.
Gold is teasing a downside break from a symmetrical triangle
“The GDP revision could be closely eyed amid looming recession risks in the US. The data could have a significant impact on the dollar valuations and, in turn, on the yellow metal.”
“If bears yield a break below the rising trendline support at $1,842 on a four-hourly candlestick closing basis, then it would confirm a triangle breakdown. The immediate downside target is seen at the rising 50-Simple Moving Average (SMA) at $1,838. A sustained move below the latter is needed for sellers to resume the renewed downside towards $1,800.”
“Strong resistance is placed at $1,856, which is the horizontal 21-SMA, above which the falling trendline hurdle at $1,863 will get tested. After the relentless surge, gold bulls could see a minor pullback from two-week highs, with the immediate support of the 21-DMA likely to be tested.”
- USD/CAD takes the bids to renew intraday high, extends recovery from monthly low.
- US dollar consolidates post-FOMC Minutes losses amid fears of growth, inflation.
- Oil prices also struggle amid mixed sentiment, sluggish sessions and firmer USD.
- US GDP, Canada Retail Sales for March will be important for intraday moves.
USD/CAD renews intraday top around 1.2850, paring weekly losses, as the US dollar renews upside momentum heading into Thursday’s European session.
The greenback gauge, namely the US Dollar Index (DXY), picks up bids to refresh daily top around 102.25. In doing so, the DXY reverses the previous day’s losses after the Fed Minutes raised doubts on the 50 bps rate hike trajectory post-September.
The underlying reasons could be linked to the escalating market fears of global recession, as well as growing pessimism surrounding China and Russia. The comments from US Trade Representative General Counsel Greta Peisch suggesting, “Review of US-Sino tariffs is likely to take ‘months’,” become a fresh threat to the US-China trade relations. Previously, Beijing criticized the US Draft Security Council resolution on North Korea and added strength to the Sino-American tensions. Also negative from China are the covid-led lockdowns that weigh on the world’s second-largest economy.
Also, fears of global recession due to the Ukraine-Russia crisis, recently backed by World Bank President David Malpass fuel the USD/CAD prices. "Russia's war in Ukraine and its impact on food and energy prices, as well as the availability of fertilizer, could trigger a global recession," said World Bank's Malpass on Wednesday during an event hosted by the U.S. Chamber of Commerce.
Furthermore, the recently softer prices of WTI crude oil, Canada’s main export, add to the USD/CAD run-up. That said, the black gold drops 0.15% intraday to $109.80 by the press time.
Amid these plays, the S&P 500 Futures drops 0.35% intraday whereas the US 10-year Treasury also fail to bounce off the monthly low, after Wednesday’s failed attempt, while dropping back to 2.74% at the latest.
Moving on, the second readings of the US Q1 2022 GDP, the annualized figure is expected to remain unchanged at -1.4%, will join the US Personal Consumption Expenditure (PCE) details for April and weekly jobless claims to direct short-term Loonie moves. Also important will be Canada’s Retail Sales for March, expected at 1.4% versus 0.1% prior.
Technical analysis
A clear break of the 21-DMA, around 1.2870 by the press time, becomes necessary for the USD/CAD buyers to prosper. On the contrary, a monthly support line near 1.2770 restricts short-term declines. It’s worth noting that MACD and RSI hint at a further sideways grind.
- USD/JPY has slipped below 127.30 as the DXY has surrendered half of its intraday gains.
- The US PCE and GDP are seen unchanged.
- The BOJ should make efforts to push inflation to 2%.
The USD/JPY pair has slipped lower after oscillating in a narrow range of 127.30-127.44 as investors are awaiting the release of the crucial US economic events, which are due in the American session. Investors are uncertain about the release of the US Personal Consumption Expenditure (PCE) and Gross Domestic Product (GDP) numbers are expected to remain on the sidelines.
As per the market consensus, the US PCE is seen unchanged at 7%, which looks sufficient to keep the greenback in the grip of bulls. The sustainability of the PCE figure at elevated levels is going to soar inflationary pressures further. This will spare no other alternative for the Federal Reserve (Fed) than to keep the monetary policy restrictive. The US dollar index (DXY) is holding itself above 102.00 and may remain higher amid improvement in the safe-haven’s appeal.
Apart from the US PCE, investors will also focus on the GDP numbers. The annualized GDP is seen at -1.4% while the GDP Price Index is expected to land at 8%.
On the Japanese yen front, the yen bulls have not responded much to the comment from Japanese Prime Minister Fumio Kishida that the Bank of Japan (BOJ) should make some efforts to achieve the targeted inflation rate of 2%, as per Reuters. Lower price pressures in the Japanese economy have restricted the growth catalysts, which are hurting yen on a broader note.
A probable move to the 0.6540 region in NZD/USD seems to have lost some traction as of late, noted FX Strategists at UOB Group Lee Sue Ann and Quek Ser Leang.
Key Quotes
24-hour view: “Our expectations for NZD to ‘trade sideways within a range of 0.6420/0.6480’ were incorrect as it popped to a high of 0.6514 before easing off. Despite the advance, upward momentum has not improved by much. For today, NZD is likely to consolidate and trade within a range of 0.6435/0.6515.”
Next 1-3 weeks: “We have expected a stronger NZD since the start of the week. In our latest narrative from Tuesday (24 May, spot at 0.6445), we highlighted that overbought shorter-term conditions could lead to consolidation first but there is room for NZD to push higher to 0.6505. Yesterday (25 May), NZD popped above 0.6514 before retreating. Upward momentum has improved, albeit not by much. There is room still for NZD to strengthen but the prospect for an advance towards the next major resistance at 0.6540 is not high. On the downside, a break of 0.6420 (‘strong support’ level was at 0.6400 yesterday) would indicate that the current upward pressure has eased.”
Considering preliminary figures from CME Group for crude oil futures markets, open interest increased by around 11.2K contracts on Wednesday, reversing the previous daily drop. On the other hand, volume reversed two consecutive daily builds and shrank by around 80.2K contracts.
WTI remains side-lined around $110.00
WTI extended the range bound theme on Wednesday amidst rising open interest. That said, there is still scope for the continuation of the consolidative phase in the very near term, and always around the $110.00 region per barrel.
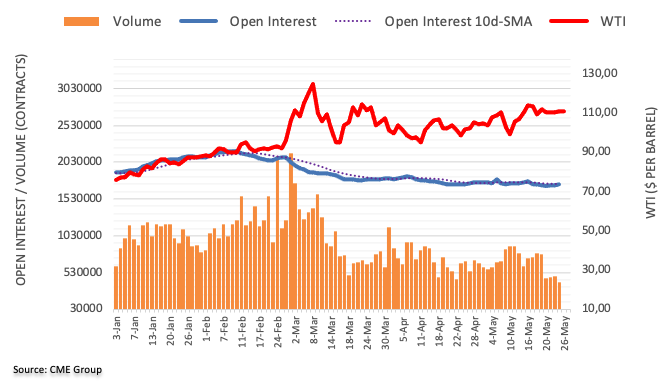
The kiwi gave back much of post-RBNZ gains amid broad USD strength. Economists at ANZ Bank expect the New Zealand dollar to struggle to outperform from here.
Market trepidation around the growth outlook in NZ
“After rallying sharply after Wednesday’s more hawkish RBNZ, the NZD gave back much of its gains. This likely reflects market trepidation around the growth outlook in NZ, offsetting the RBNZ’s upgraded inflation outlook. Given these concerns, the kiwi may struggle to outperform from here, especially with how much is already priced into the rates curve.”
“Support 0.6230/0.6410 Resistance 0.6545/0.6625/0.6840.”
- AUD/USD takes offers to renew intraday low, down for the third consecutive day.
- Break of two-week-old support line, steady RSI keep sellers hopeful.
- 10-DMA, 20-DMA and resistance-turned-support from early April together offer strong challenge to bears.
- Bulls need to cross weekly top before eyeing the monthly peak.
AUD/USD holds lower ground near 0.7065 as it prints a three-day downtrend heading into Thursday’s European session. In doing so, the Aussie pair breaks a fortnight-long support line.
In addition to the support break, the steady RSI and the recent pullback from a three-week high signal the AUD/USD pair’s further downside.
However, a confluence of the 10-DMA, 20-DMA and previous resistance line from early April, near 0.7035, appears a tough nut to crack for the bears.
Following that, the 0.6950 level may act as the last defense of the AUD/USD buyers before directing the quote towards the monthly low of 0.6828.
Alternatively, recovery moves need to refresh the weekly high, currently around 0.7130, to convince buyers.
Even so, the 0.7200 threshold and the monthly peak surrounding 0.7270 could challenge the AUD/USD bulls.
Overall, AUD/USD is likely to decline further but the downside room appears limited.
AUD/USD: Daily chart
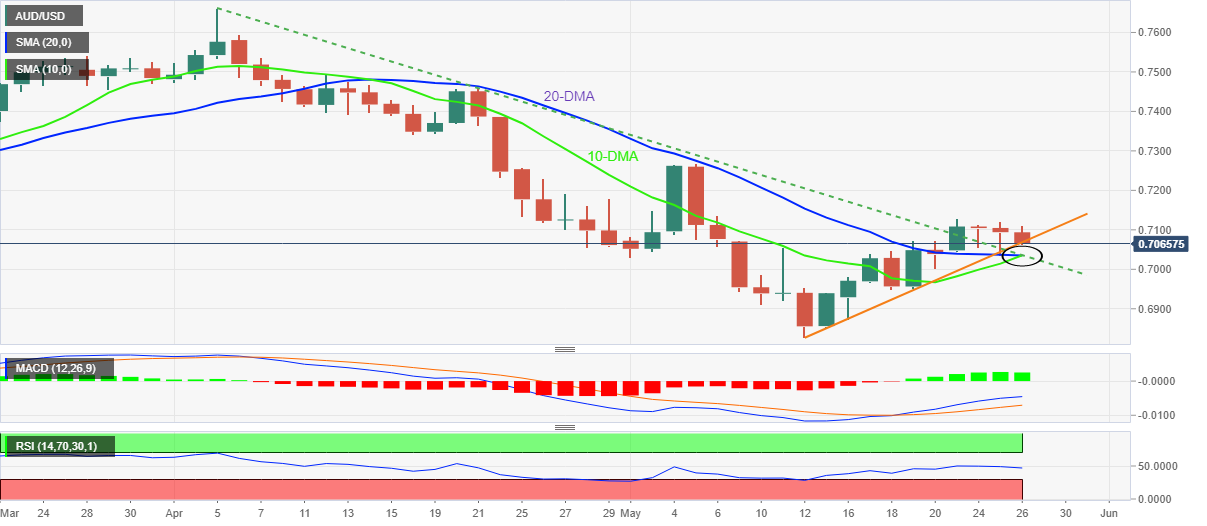
Trend: Further downside expected
- NZD/USD has attracted significant offers at 0.6500 on a firmer rebound in the DXY.
- Investors are getting risk-averse ahead of the US PCE.
- RBNZ’s warning signal for a potential recession has impacted the antipodean.
The NZD/USD pair has faced barricades around 0.6500 and has slipped to near 0.6460 in the early European session. Mounting uncertainty ahead of the US Personal Consumption Expenditure (PCE), which is due in the New York session, has diminished the risk appetite of the market participants.
The US PCE is expected to remain stable at 7% but stability in the catalyst at elevated levels is itself a cause of worry for the Federal Reserve (Fed). Higher PCE levels dictate higher spending on durable and non-durable goods from the households, which could let inflationary pressures anchored at higher levels. No wonder, this will compel Fed chair Jerome Powell to dictate a mega rate hike along with an extremely hawkish stance for the upcoming monetary policies.
On the dollar front, the US dollar index (DXY) has established above 102.00 and is expected to remain sustained higher amid a rebound in the negative market sentiment.
Meanwhile, the kiwi dollar is also facing the headwinds of renewed recession fears. The 50 basis points (bps) rate hike announcement by the Reserve Bank of New Zealand (RBNZ) on Wednesday has pressed the recession button while tackling the ramping up inflation. RBNZ Governor Adrian Orr, in his statement, has warned that recession cannot be ruled out however he is not predicting one. It is worth noting that this is a consecutive jumbo rate hike by the RBNZ.
Japanese Prime Minister Fumio Kishida said Thursday that he expects the Bank of Japan (BOJ) to make efforts to achieve the 2% inflation target stably and sustainably.
Kishida, however, said that specific monetary policy is up to the BOJ to decide.
On Wednesday, Japan's government called on the Bank of Japan (BOJ) to strive for achieving its 2% inflation target in a "sustainable and stable fashion,” Reuters reports, having seen a draft of its long-term policy outline.
Market reaction
USD/JPY is up 0.07% on the day, currently trading at 127.40, capitalizing on the renewed US dollar demand.
In the opinion of FX Strategists at UOB Group Lee Sue Ann and Quek Ser Leang, GBP/USD could extend the upside once it clears the 1.2600 barrier.
Key Quotes
24-hour view: “Yesterday, we expected GBP to ‘trade within a range of 1.2480/1.2580’. GBP subsequently traded within a wider range than expected (1.2482/1.2590). The underlying tone has improved and GBP could edge above the major resistance at 1.2600. The next resistance at 1.2640 is unlikely to come under threat. On the downside, a break of 1.2530 (minor support is at 1.2560) would indicate that the current mild upward pressure has eased.”
Next 1-3 weeks: “We highlighted yesterday (25 May, spot at 1.2540) that GBP is likely to consolidate and trade between 1.2430 and 1.2600. We added, ‘looking ahead, further GBP strength is not ruled out but it has to close above 1.2600 before a sustained advance is likely’. GBP subsequently rose to 1.2590 before closing at 1.2584 (+0.38%). Shorter-term upward momentum has improved somewhat but as indicated; GBP has to close above 1.2600 before a sustained advance is likely. The next resistance above 1.2600 is at 1.2640.”
- Copper remains on the back foot around weekly low, prints three-day downtrend.
- China’s covid conditions, geopolitical headlines raise concerns over global economic downturn.
- Improvement in supplies adds strength to the bearish bias.
- US GDP, China’s covid updates and risk catalysts are crucial for clear directions.
Prices of copper futures on COMEX take offers around $4.23 as sellers keep reins for the third consecutive day amid the market’s fears of global recession and a slump in the industrial demand for the red metal.
Reuters describe three-month LME copper prices as 0.1% down at $9,365 a tonne by 03:51 GMT whereas the most-traded July copper contract on the Shanghai bourse ended the morning trade 0.2% lower at 71,280 yuan ($10,614.25) a tone.
“Years of under-investment in the mining of metals essential to the energy transition, supply shocks, and high energy prices will continue to drive commodity prices higher, Eurasian Resources Group Chief Executive Benedikt Sobotka said,” per Reuters. The news also highlights increasing odds of an end to the protest that has halted operations at MMG Ltd's Las Bambas copper mine in Peru also weighing on prices.
Elsewhere, fears emanating from the Ukraine-Russia crisis and China’s covid conditions, as well as the fresh fears of the Sino-American tussles, weigh on the market sentiment and copper prices.
While portraying the mood, the S&P 500 Futures print mild losses around 3,965 whereas the US 10-year Treasury yields again bounce off monthly low, after Wednesday’s failed attempt, up 0.5 basis points (bps) to 2.75% at the latest.
Looking forward, copper traders will keep their eyes on the second readings of the US Q1 2022 GDP, the annualized figure is expected to remain unchanged at -1.4%, to determine short-term prices. However, major attention will be given to the risk catalysts surrounding inflation, growth and covid.
Technical analysis
Unless crossing a short-term hurdle surrounding $4.45, COMEX Copper prices are on the way to $4.00.
CME Group’s flash data for gold futures markets saw traders trim their open interest positions for yet another session on Wednesday, this time by around 2.2K contracts. Volume, instead, went up for the third session in a row, now by around 30.8K contracts.
Gold looks supported by the 200-day SMA
Wednesday’s downtick in gold prices was accompanied by shrinking open interest, which is indicative that a deeper retracement could be out of favour in the very near term. Against this, the key 200-day SMA at $1,839 should hold the initial test for the time being.
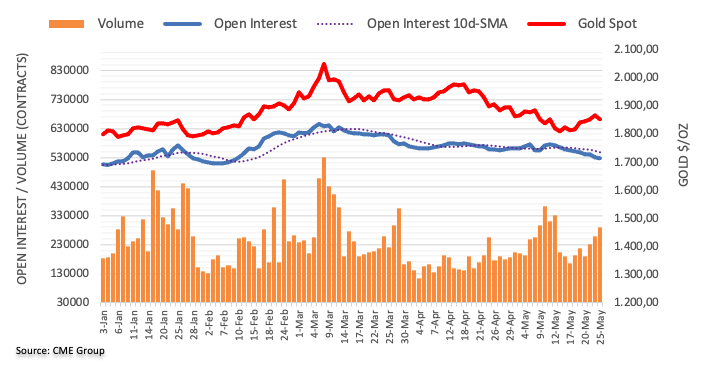
EUR/USD should clear 1.0720 to allow for a potential test of the 1.0750 in the next weeks, suggested FX Strategists at UOB Group Lee Sue Ann and Quek Ser Leang.
Key Quotes
24-hour view: “We highlighted yesterday that ‘faltering upward momentum coupled with overbought conditions suggests that EUR is unlikely to strengthen further’ and we expected EUR to ‘consolidate and trade between 1.0670 and 1.0750’. However, EUR dropped to 1.0641 before rebounding. The price actions still appear to be part of a consolidation and EUR is likely to trade within a range of 1.0645/1.0720 for today.”
Next 1-3 weeks: “We highlighted yesterday (25 May, spot at 1.0730) that a break of the major resistance at 1.0750 would not be surprising. We did not expect the sharp pullback that came within one pip of our ‘strong support’ level at 1.0640 (low of 1.0641). Upward momentum is beginning to wane and EUR has to move and stay above 1.0720 within these 1 to 2 days or the chance for a break of 1.0750 would diminish quickly. Conversely, a break of 1.0640 (no change in ‘strong support’ level) would indicate that the upward pressure that started earlier this week has eased.”
- WTI grinds higher past 50-SMA, stays sidelined in the last three weeks.
- Higher-low on prices and RSI keep buyers hopeful until the quote stays beyond two-week-long support line.
- Bulls need a clear break of weekly horizontal hurdle to register dominance.
WTI crude oil prices keep the previous two week’s inaction forward as it flirts with $110.00 heading into Thursday’s European session.
Even so, the black gold buyers remain hopeful as an upward sloping support line from May 10 joins bullish RSI divergence, as the quote prints higher-low together with the indirection.
This suggests the energy benchmark’s ability to cross the weekly hurdle surrounding $111.30.
Following that, the monthly high near $113.20 and late March’s high near $116.60 can entertain oil buyers before directing them to the yearly peak surrounding $129.50.
Meanwhile, the 50-SMA level near $109.50 restricts the commodity’s immediate downside ahead of the aforementioned support line, at $109.15 by the press time.
Should the WTI bears manage to conquer the aforementioned support line, also break the $109.00 threshold, the odds of the quote’s south-run towards the previous week’s low near $103.00 can’t be ruled out.
WTI: Four-hour chart

Trend: Further upside expected
- Gold prices have established below $1,850.00 amid uncertainty over the US PCE.
- The DXY has recorded a fresh day’s high at 102.16 a risk-on impulse fade.
- A higher US PCE number could compel the Fed to sound extremely hawkish.
Gold price (XAU/USD) has witnessed a steep fall in the early European session after failing to cross the round-level resistance of $1,850.00. The precious metal looks set for a downside move as the US dollar index (DXY) has refreshed its day’s high at 102.16, at the press time. Investors are pouring money into the DXY as the US Personal Consumption Expenditure (PCE) is expected to remain stable at 7%.
Sustainability of the PCE at elevated levels is going to bolster the odds of a 50 basis point (bps) interest rate hike by the Federal Reserve (Fed) in its June monetary policy. Higher PCE by the households advocates higher aggregate demand and eventually mounting inflationary pressures, which could worsen the situation for Fed policymakers.
Apart from that, investors are also awaiting the release of the US Gross Domestic Product (GDP) numbers. The annual US GDP is seen at -1.4% while the GDP Price Index is expected to land at 8%. A higher-than-expected figure could bring more bids to the DXY counter and eventually a sell-off in the gold prices.
Gold technical analysis
A Bearish Divergence formation on an hourly scale has weakened the gold prices. The precious metal formed a higher high while the momentum oscillator, Relative Strength Index (RSI) (14), formed a lower high, which signaled a loss of momentum. The RSI (14) has slipped below 40.00, which adds to the downside filters. The 20-period Exponential Moving Average (EMA) at $1,852.58 is acting as a major resistance for the gold prices.
Gold hourly chart
-637891382481099557.png)
FX option expiries for May 26 NY cut at 10:00 Eastern Time, via DTCC, can be found below.
- EUR/USD: EUR amounts
- 1.0600 851m
- 1.0680 379m
- 1.0700 526m
- GBP/USD: GBP amounts
- 1.2400 200m
- 1.2475 242m
- USD/JPY: USD amounts
- 127.50 940m
- 128.00 516m
- AUD/USD: AUD amounts
- 0.7125 473m
- USD/CAD: USD amounts
- 1.2600 325m
- 1.2795 680m
- 1.2815 411m
- 1.3000 372m
- EUR/GBP: EUR amounts
- 0.8500 433m
- USD/TRY prints five-day uptrend, seesaws around the highest levels since December 2022.
- Fears of FX reserve depletion at CBRT recently favored bulls.
- CBRT is expected to keep benchmark rates unchanged at 14%, the fifth consecutive inaction.
- Second reading of the US Q1 2022 GDP will also decorate the calendar.
USD/TRY extends the run-up towards a record high ahead of the CBRT Interest Rate decision, sidelined around the yearly peak heading into Thursday’s European session. That said, the quote takes rounds to 16.35-40 by the press time, after refreshing the 2022 top with 16.46 the previous day.
The Turkish lira has been on the back foot since the early days of 2022 as markets lose confidence in the Turkish government’s efforts to stabilize the beleaguered currency while keeping the interest rates unchanged. The moves were also doubted on the recently depleting FX reserves of the Central Bank of the Republic of Turkey (CBRT).
“Data last Friday showed the central bank's net international reserves dropped some $3.5 billion to $11.53 billion in the week to May 13. Bankers calculate that they fell to $10 billion or less in the following week,” said Reuters.
Reuters also mentions, “Economists say rate hikes could help relieve both the lira and reserves. But President Tayyip Erdogan's opposition to policy tightening has left few expecting a turnaround any time soon, including when the bank meets on Thursday.”
Elsewhere, fears emanating from the Ukraine-Russia crisis and China’s covid conditions, as well as the fresh fears of the Sino-American tussles, weigh on the market sentiment and favor the US dollar’s safe-haven demand. However, the latest Federal Open Market Committee (FOMC) Minutes raised doubts about the 50 bps rate hike after September and probed the greenback bulls.
Looking forward, the CBRT is expected to keep the benchmark rate unchanged near 14%, which in turn could offer another push towards the north to the USD/TRY pair. However, any surprise rate hikes won’t be taken lightly and will be interesting to watch.
Technical analysis
A daily closing beyond an upward sloping resistance line from early January 2022, around 16.35 by the press time, keeps USD/TRY bulls hopeful of challenging the record high marked in 2021, close to 18.35.
- Asian indices are following the footprints of the positive closing of Wall Street.
- The DXY is trading subdued ahead of the US GDP, which is seen stabled at -1.4%.
- Oil prices are expected to scale higher amid rising uncertainty over Europe’s embargo on Russian oil.
Markets in the Asian domain are auctioning positively, following the positive cues from Wall Street on Wednesday. The US indices recovered sharply in the previous trading session as uncertainty over the release of the Federal Open Market Committee (FOMC) faded. FOMC minutes were extremely hawkish as all Federal Reserve (Fed) policymakers were advocating for a 50 basis point (bps) interest rate hike along with hawkish guidance. However, investors ignored the hawkish tone and pumped liquidity into the US equities.
At the press time, Japan’s Nikkie225 added 0.16%, SZSE Component gained 0.90%, and India’s Nifty50 added 0.26%, however, Hang Sang eased 0.16%.
Meanwhile, the US dollar index (DXY) is displaying back and forth moves in the Asian session. The DXY is trading in a narrow range of 101.94-102.24 and is expected to deliver a downside break amid positive market sentiment. In today’s session, investors are awaiting the release of the US Gross Domestic Product (GDP). A preliminary estimate for the annual GDP is -1.4%, similar to the previous figure.
On the oil front, the oil prices are consolidating in a minor range but are expected to move upside down sharply as supply worries could worsen further on an embargo on Russian oil by the European Union (EU). The EU is still considering the prohibition of the Russian oil imports as Hungary is opposing the decision amid its higher dependency on oil imports from Moscow. However, the odds are still favoring a ban on oil from Russia.
- GBP/USD pares gains around three-week high, holds lower ground of late.
- Brexit woes, BOESpeak and subdued sentiment weigh on prices.
- Fed Minutes underpinned recovery moves ahead of preliminary US Q1 GDP.
GBP/USD bulls take a breather around a three-week top as buyers struggle for clear direction s amid mixed catalysts and a sluggish session during early Thursday in Europe. That said, the cable pair refreshed multi-day high with 1.2612 level before easing to 1.2575, taking rounds to 1.2585 by the press time.
Talking about the recent positives, headlines from the recent Federal Open Market Committee (FOMC) Minutes join the firmer odds of the Bank of England’s (BOE) faster rate hikes to keep the GBP/USD prices strong. As per the latest Fed minutes, the policymakers endorsed the idea of 50 basis points (bps) rate hikes for only the next couple of meetings, also raising doubts on the rate-lift trajectory past September, to favor sentiment. The Minutes rather highlighted inflation concerns and mentioned, “It would be appropriate to consider sales of mortgage-backed securities.”
It’s worth noting that such statements renewed concerns of limited monetary policy tightening and helped Wall Street to post the biggest daily gains in a week.
On the other hand, Bank of England (BOE) Chief Economist Huw Pill said, in an interview with the Western Mail newspaper, that he believes that more interest rate hikes are needed, adding that he is aware that could trigger an economic recession.
Alternatively, fears emanating from the Ukraine-Russia crisis and China’s covid conditions, as well as the fresh fears of the Sino-American tussles, weigh on the market sentiment and favor the US dollar’s safe-haven demand. Furthermore, Brexit jitters over the Northern Ireland Protocol (NIP) are an extra burden on the GBP/USD prices.
Against this backdrop, the S&P 500 Futures print mild losses around 3,970 whereas the US 10-year Treasury yields again bounce off monthly low, after Wednesday’s failed attempt, up 2.5 basis points (bps) to 2.77% at the latest.
That said, GBP/USD prices may remain mildly bid amid an off in major European bourses and a light calendar. Though, the second readings of the US Q1 2022 GDP, the annualized figure is expected to remain unchanged at -1.4%, will join the US Personal Consumption Expenditure (PCE) details for April and weekly jobless claims to direct short-term cable moves.
Technical analysis
GBP/USD remains directed towards the monthly high near 1.2640 unless breaking a two-week-old support line near 1.2530.
- USD/INR picks up bids to snap three-day downtrend, bounces off weekly low.
- FOMC Minutes, RBI’s assurance to limit “runaway” INR slump challenge pair buyers.
- Firmer oil prices, subdued sentiment and exodus of funds from Indian equities bar gate for bears.
- US GDP, Fed’s preferred inflation gauge will be important this week, risk catalysts should be watched too.
USD/INR consolidates weekly losses around 77.55, staying inside a fortnight-long trading range surrounding 77.30-80 as traders struggle with diverse catalysts during Thursday’s Asian session.
Among them, the latest Federal Open Market Committee (FOMC) Minutes and the recently active Reserve Bank of India (RBI) seem to restrict the pair’s upside momentum. However, pessimism surrounding the Indian stock market, strong oil prices and sluggish risk appetite keep the USD/INR bulls hopeful.
That said, the recent Fed minutes mentioned that the policymakers endorsed the idea of 50 basis points (bps) rate hikes for only the next couple of meetings and raised doubts on the rate-lift trajectory past September, which in turn favored sentiment. On the other hand, the RBI recently assured investors of not allowing "runaway" INR depreciation limits USD upside, per Reuters.
On the other hand, Indian equities are on the way to posting the first yearly loss in seven as broad fears of growth and inflation push foreign investors to flee, marking the record outflow of foreign funds during the first five months of 2022.
Further, WTI crude oil prices also print mild gains around $111.00 by the press time and brace for the sixth monthly run-up. Considering India’s record deficit and heavy reliance on oil imports, firmer energy prices drown the Indian rupee (INR).
Elsewhere, comments from US Trade Representative General Counsel Greta Peisch suggesting, “Review of US-Sino tariffs is likely to take ‘months’,” becomes a fresh threat to the US-China trade relations. Previously, Beijing criticizes the US Draft Security Council resolution on North Korea and added strength to the Sino-American tensions. Also negative from China are the covid-led lockdowns that weigh on the world’s second-largest economy, also Australia’s biggest trading partner.
It’s worth noting that fears of global recession due to the Ukraine-Russia crisis, recently backed by World Bank President David Malpass also favor USD/INR prices. "Russia's war in Ukraine and its impact on food and energy prices, as well as the availability of fertilizer, could trigger a global recession," said World Bank's Malpass on Wednesday during an event hosted by the U.S. Chamber of Commerce.
Moving on, off in major European bourses join a light calendar to restrict USD/INR moves but the second reading of the US Q1 2022 GDP, the annualized figure is expected to remain unchanged at -1.4%, will be important to watch. Also crucial will be Personal Consumption Expenditure (PCE) details for April and weekly jobless claims.
Technical analysis
Even if a choppy trading range between 77.30 and 77.80 restricts short-term USD/INR moves, RSI conditions hint at the receding bullish momentum. However, sellers need to wait for a clear break below 77.30 for fresh entries. On the contrary, the 10-DMA level of 77.56 guards immediate recovery moves ahead of 77.80.
- EUR/USD is struggling to sustain above 1.0700 as a rate hike expectation by the ECB has strengthened.
- The DXY is continued with a subdued performance despite the hawkish FOMC minutes.
- The US GDP and PCE are seen stabled at -1.4% and 7% respectively.
The EUR/USD pair is hovering around 1.0700 and is expected to establish above the same comfortable amid subdued performance from the US dollar index (DXY). The shared currency bulls are swiftly scaling higher after sensing a cushion from its crucial support at around 1.0640.
Bolstered rate hike expectations by the European Central Bank (ECB) have underpinned the euro against the greenback. Inflation is affecting the real income of the households in the eurozone and the ECB has yet not paddled up its interest rates unlike the other Western leaders, which are featuring 50 basis points (bps) rate hikes. The eurozone inflation has reached 7.5% and the ECB needs to tighten its sleeves and announce quantitative restrictions.
Meanwhile, Dutch Central Bank head and ECB Governing Council member Klass Knot stated on Wednesday that inflation expectations will remain well-anchored at its upper limit and a rate hike by 50 bps is not off the table.
On the dollar front, the DXY is underperforming broadly despite the release of the extremely hawkish Federal Open Market Committee (FOMC) minutes. As per the minutes, all Fed policymakers were in favor of a jumbo rate hike announcement. Also, they believe that the benchmark rates should be sent close to the neutral rates quickly. Inflation will remain anchored at elevated levels and the labor market is extremely tight.
Going forward, investors will respond to the US Gross Domestic Product (GDP) and Personal Consumption Expenditure (PCE) numbers. The US GDP is seen unchanged at -1.4% on annual basis. Also, the US PCE is expected to remain stable at 7%.
Analysts at Morgan Stanley offer their bearish outlook on the British pound, expecting the Bank of England (BOE) to shift towards a dovish pivot in the coming months.
Key quotes
"We continue to think risks are skewed to the downside for GBP/USD as the UK faces a sharp, consumer-led growth slowdown, with consumer confidence at a five-decade low. Markets are still pricing in too much policy tightening from the BoE in our view, and our economists continue to expect a dovish pivot by the BoE (in August).”
"Brexit uncertainty is another factor that is likely to put further downward pressure on GBP, seeing as our idiosyncratic risk premium model is still suggesting little to no risk premium priced in at the moment. Equities and the broader risk sentiment have been important drivers of GBP performance in recent months.”
- A double test of the 38.2% Fibo retracement strengthens a bullish reversal.
- The RSI (14) is expected to overstep 60.00, which will delight the greenback bulls.
- An establishment above 20- and 50-period EMAs add to the upside filters.
The USD/CNH pair has witnessed a minor correction after a former upside move to near 6.7300. The minor corrective move is expected to convert into an initiative buying action, which will drive the asset higher.
On the four-hour scale, the USD/CNH pair has bounced back sharply after re-testing the 38.2% Fibonacci retracement (which is placed from April 8 low 6.3583 to May’s high 6.8385) at 6.6554. The downward sloping trendline placed from May’s high at 6.8365, adjoining May 16 high at 6.8206 and May 19 high at 6.7883 respectively will act as major resistance for the counter.
A range shift move from 20.00-40.00 to 40.00-60.00 by the Relative Strength Index (RSI) (14) signals that the asset is not bearish anymore. Also, the range shift action by the RSI (14) indicates that the oscillator will breach 60.00, which will delight the greenback bulls.
The asset has overstepped the 20- and 50-period Exponential Moving Averages (EMAs) at 6.6964 and 6.7112 respectively, which confirms an establishment of short-term upside momentum.
A decisive breach of the downward sloping trendline at 6.7340 will send the major towards May 18 high at 6.7882. Breach of the latter will drive the asset to May’s high at 6.8365.
On the flip side, the Chinese yuan bulls could dominate if the asset drops below 38.2% Fibo retracement at 6.6554. An occurrence of the same will drag the asset towards May 4 low at 6.6116, followed by April 27 low at 6.5757.
USD/CNH four-hour chart
- AUD/USD stays around intraday low, down for the third consecutive day after challenging three-week high.
- Recent headlines from China, Ukraine join downbeat Australia Private Capital Expenditure for Q1 to weigh on prices.
- FOMC minutes, light calendar and off in Europe put a floor under the prices.
AUD/USD struggles to rebound from intraday low, down for the third consecutive day, as risk-negative headlines from China and Ukraine join downbeat Aussie data. That said, the quote remains pressured at around 0.7080 during Thursday’s Asian session.
Australia’s Private Capital Expenditure (Private Capex) data for the first quarter (Q1) of 2022 slumped to -0.3% versus 1.5% expected and 1.1% prior.
Elsewhere, comments from US Trade Representative General Counsel Greta Peisch suggesting, “Review of US-Sino tariffs is likely to take ‘months’,” becomes a fresh threat to the US-China trade relations. Previously, Beijing criticizes the US Draft Security Council resolution on North Korea and added strength to the Sino-American tensions. Also negative from China are the covid-led lockdowns that weigh on the world’s second-largest economy, also Australia’s biggest trading partner.
It’s worth noting that fears of global recession due to the Ukraine-Russia crisis, recently backed by World Bank President David Malpass also drag AUD/USD prices. "Russia's war in Ukraine and its impact on food and energy prices, as well as the availability of fertilizer, could trigger a global recession," said World Bank's Malpass on Wednesday during an event hosted by the U.S. Chamber of Commerce.
On Wednesday, the Federal Open Market Committee (FOMC) Minutes mentioned that the policymakers endorsed the idea of 50 basis points (bps) rate hikes for only the next couple of meetings and raised doubts on the rate-lift trajectory past September, which in turn favored sentiment.
Against this backdrop, the S&P 500 Futures print mild losses around 3,970 whereas the US 10-year Treasury yields again bounce off monthly low, after Wednesday’s failed attempt, up 2.5 basis points (bps) to 2.77% at the latest.
Looking forward, an off in major European bourses join a light calendar to restrict AUD/USD moves ahead of the second readings of the US Q1 2022 GDP, the annualized figure is expected to remain unchanged at -1.4%. Also important will be Personal Consumption Expenditure (PCE) details for April and weekly jobless claims.
Technical Analysis
AUD/USD sellers attack a two-week-old ascending trend line, around 0.7070, before targeting the 21-DMA level near 0.7040. Meanwhile, the recent swing high surrounding 0.7125-30 challenges the bulls.
It’s worth noting that the firmer MACD and steady RSI join the Aussie pair’s rebound from short-term key supports to keep buyers hopeful.
South Korea's new central bank governor Rhee Chang-yong said that the rate hike decision at its monetary policy meeting on Thursday was unanimous.
Rhee added that the policy focus will remain on stabilizing prices for few months.
Bank of Korea (BOK) raised the base rate by 25 bps from 1.5% to 1.75% earlier this Thursday, as widely expected.
developing story ....
- AUD/JPY extends pullback from daily top, reverses the previous day’s bounce off weekly low.
- Australia’s Q1 Private Capital Expenditure disappoints, cautious optimism in the market puts a floor under the prices.
- Fed Minutes renew market’s optimism but headlines from China, Ukraine test the bulls.
AUD/JPY takes offers to renew intraday low around 90.10, reversing the bounce off a one-week low during Thursday’s Asian session.
The cross-currency pair’s latest declines could be linked to Australia’s Private Capital Expenditure (Private Capex) data for the first quarter (Q1) of 2022. As per the latest figures, the Private Capex slumped to -0.3% versus 1.5% expected and 1.1% prior.
Also challenging the AUD/JPY prices could be the latest risk-negative headlines from China and Ukraine.
That said, “Ukrainian President Volodymyr Zelensky on Wednesday savaged suggestions that Kyiv gives up territory and make concessions to end the war with Russia, saying the idea smacked of attempts to appease Nazi Germany in 1938,” per Reuters. On the same line, China criticizes the US Draft Security Council resolution on North Korea and adds to the recently alive Sino-American tensions.
Also likely to escalate the US-China tussles could be the latest comments from US Trade Representative General Counsel Greta Peisch suggesting, “Review of US-Sino tariffs is likely to take ‘months’.”
On the positive side, the latest Federal Open Market Committee (FOMC) Minutes mentioned that the policymakers endorsed the idea of 50 basis points (bps) rate hikes for only the next couple of meetings, also raised doubts on the rate-lift trajectory past September and favored sentiment. The Minutes rather highlighted inflation concerns and mentioned, “It would be appropriate to consider sales of mortgage-backed securities.”
It’s worth noting that such statements renewed concerns of limited monetary policy tightening and helped Wall Street to post the biggest daily gains in a week.
While portraying the mood, the S&P 500 Futures print mild gains around 3,980 whereas the US 10-year Treasury yields again bounce off monthly low, after Wednesday’s failed attempt, up 2.5 basis points (bps) to 2.77% at the latest.
Moving on, holidays in Europe and a light calendar in Asia could keep AUD/JPY moves depended on the risk catalysts ahead of Friday’s Australia Retail Sales for April, expected 0.9% versus 1.6% prior.
Technical analysis
AUD/JPY remains pressured towards a two-week-old ascending support line near 89.70 unless crossing the 21-DMA hurdle, at 90.85 by the press time.
The People's Bank of China is out with a statement now, via Reuters, urging banks to increase lending to SMEs.
In a notice issued on Thursday, the PBOC further said it will boost financial institutions' confidence to lend to small firms.
Separately, Global Times reported that “China's State Council, the cabinet, on Wednesday held what has been seen as an unprecedented national video teleconference on stabilizing the economy with reportedly upwards of 100,000 participants, including officials of various levels, stressing the need to better implement measures to safeguard market entities, employment, people's livelihood and keep the economy operating in a reasonable range.”
Market reaction
USD/CNY was last seen trading at 6.7101, adding 0.27% on the day.
- Gold is correcting back towards the W-formation's neckline which would be expected to hold the initial tests.
- Bulls could be encouraged to move in to target the prior resistance near $1,870.
The price of gold is under a little bit of pressure in Asia as the US dollar attempts to stabilise. At $1,851.94, the gold price is down 0.07% and is sticking to a range of between 41,851.63/$1,854.43 so far. The US dollar, as measured by the DXY index, edged lower following the Federal Reserve minutes that failed to send a message that large rate hikes were being considered. Therefore, the move lower in the greenback was making bullion less expensive for buyers holding other currencies and limiting losses.
''Gold struggled to find a bid amid the weak economic backdrop,'' analysts at ANZ Bank said in a note on Thursday. ''Gold was under pressure from the opening of the session as the USD gained but pared some of those losses after Federal Reserve minutes showed little appetite for more aggressive rate hikes. Fed officials agreed the bank needed to tighten in half-point steps over the next couple of meetings.''
Gold technical analysis
In the New York session analysis, below, it is seen that the price had moved in on the support in a 38.2% Fibonacci retracement:
It was stated that ''the lower time frames can be monitored for signs of a deceleration of the bearish correction.''
Gold, H1 charts
This chart, from the New York session, shows the bulls were moving in to slow down the correction on the daily chart.
Gold live market
As we can see here, the bulls had been moving in but the price is correcting back towards the W-formation's neckline, as forecasted in the previous analysis above. The neckline would be expected to hold the initial tests and on repeated failures to break below, then bulls will more than likely be encouraged to move in to target the prior resistance near $1,870.
US Trade Representative General Counsel Greta Peisch expressed the urge to undertake a review of the Trump-era tariffs on Chinese goods at the earliest, at an event hosted by Georgetown University’s law school on Wednesday.
Peisch, however, acknowledged that such a review could likely take “months,” per Bloomberg.
Key quotes
“We want to undertake a review as soon as we can.”
“In part, it will be driven by the volume of responses that we are receiving -- going through those, ensuring we have a really good process to consider them. Given that, it’s likely to be months, but again, we want to complete it as quickly as we can.”
“The US’s review of tariffs on more than $300 billion in Chinese imports that’s required as the duties reach their four-year anniversary will likely take months.”
Market reaction
AUD/USD is losing ground on a downside surprise in the Australian Q1 Private Capex data. The pair is trading at 0.7079, down 0.19% on the day.
- EUR/USD retreats from a three-day-old descending trend line.
- Sustained trading beyond the key HMAs, firmer oscillators keep buyers hopeful.
- 61.8% Fibonacci Expansion lures the bulls, sellers need validation from 200-HMA.
EUR/USD pares intraday gains around 1.0700 while stepping back from an immediate resistance line. In doing so, the major currency pair reverses the previous day’s pullback from the monthly high during Thursday’s Asian session.
Although a downward sloping trend line from Tuesday restricts the nearby EUR/USD upside around 1.0710, the quote’s ability to stay firmer past the 100-HMA and the 200-HMA keeps the buyers hopeful of overcoming the nearby hurdle.
Also favoring the upside bias is a one-week-old ascending trend line and the bullish MACD signals, not to forget firmer RSI (14).
That said, the 61.8% Fibonacci Expansion (FE) of May 20-25 moves, around 1.0770, gains the EUR/USD pair buyer’s attention until the quote stays beyond the weekly support line and the 100-HMA level, respectively around 1.0660 and 1.0650.
Even if the quote drops past 1.0650, the 200-HMA level of 1.0568 will test the bears before giving them control.
On the contrary, sustained trading beyond 1.0770 will help the EUR/USD buyers to aim for a late April swing high surrounding 1.0935.
EUR/USD: Hourly chart
Trend: Further upside expected
China's COVID-hit capital Beijing further tightened its dragnet on the virus with zero community transmission the target, punishing workplaces that flout rules or circumvent curbs and imploring residents to police their own movements.
Since late April, the city of 22 million has wrestled with dozens of new cases a day. While these have been mostly in quarantine areas, a handful have been found in the community at large, illustrating the challenge the high transmissibility of the Omicron variant poses even to the world's most stringent pandemic containment policies.
Beijing reported 45 new cases for Wednesday, compared with 47 on Tuesday.
In recent trade today, the People’s Bank of China (PBOC) set the yuan (CNY) at 6.6766 vs. the estimate of 6.6742 and the previous 6.6550.
About the fix
China maintains strict control of the yuan’s rate on the mainland.
The onshore yuan (CNY) differs from the offshore one (CNH) in trading restrictions, this last one is not as tightly controlled.
Each morning, the People’s Bank of China (PBOC) sets a so-called daily midpoint fix, based on the yuan’s previous day's closing level and quotations taken from the inter-bank dealer.
- Market sentiment remains mildly positive amid mixed headlines from FOMC Minutes, China and Ukraine.
- S&P 500 Futures track Wall Street’s gains, Treasury yields rebound from monthly low.
- Light calendar, holidays in Europe may restrict market moves ahead of second-tier US data.
After a sluggish start to the week, risk appetite improves during the mid-Asian session on Thursday as Fed minutes underpinned cautious optimism. Even so, headlines from China and Ukraine test the market sentiment amid a mostly quiet Asian session.
While portraying the mood, the S&P 500 Futures print mild gains around 3,980 whereas the US 10-year Treasury yields again bounce off monthly low, after Wednesday’s failed attempt, up 2.5 basis points (bps) to 2.77% at the latest.
As per the latest Federal Open Market Committee (FOMC) Minutes, the policymakers endorsed the idea of 50 basis points (bps) rate hikes for only the next couple of meetings, raising doubts on the rate-lift trajectory past September. The Minutes rather highlighted inflation concerns and mentioned, “It would be appropriate to consider sales of mortgage-backed securities.”
It’s worth noting that such statements renewed concerns of limited monetary policy tightening and helped Wall Street to post the biggest daily gains in a week.
Also favoring the trading sentiment is the downbeat US data that backs the need for easy money. Other than the Fed Minutes, downbeat prints of the Durable Goods Orders for April also weighed on the US Dollar. As per the latest US Durable Goods Orders, the growth slowed down to 0.4% MoM versus market forecasts and revised down prior readings of 0.6%. Also, the Core Durable Goods Orders rose 0.3% MoM versus 0.6% expected and 1.1% prior (revised).
On the flip side, the latest headlines from China and Ukraine seem to challenge the market sentiment. That said, “Ukrainian President Volodymyr Zelensky on Wednesday savaged suggestions that Kyiv gives up territory and make concessions to end the war with Russia, saying the idea smacked of attempts to appease Nazi Germany in 1938,” per Reuters. On the same line, China criticizes the US Draft Security Council resolution on North Korea and adds to the recently alive Sino-American tensions.
Moving on, an off in Europe may restrict market moves and let the post-FOMC Minutes move to extend ahead of the US session. However, the second-tier US data, like preliminary GDP for Q1 2022 and Personal Consumption Expenditure (PCE) details for April, may entertain traders.
Read: Post FOMC: Market shift from catch-down camp to short covering mode
- Bulls are testing the neckline near the current levels at 0.71 the figure. A break here will leave the bulls in good stead for a break of resistance around 0.7135.
- A break of 0.7150 could open the way towards 0.7200 and then the 0.7260s and prior highs.
There is a battle going on between the bulls and bears surrounding the Aussie and the US dollar. As per the prior analysis, AUD/USD Price Analysis: Bulls take the high road but bears emerge from critical H4 resistance, ''the Aussie has a habit of defying gravity.''
The US dollar rose on Wednesday, holding most of its earlier gains after minutes from the Federal Reserve's May meeting showed that most participants believed a half-percentage-point rate increase would likely be appropriate in June and July.
However, the Aussie bulls have stayed the course and the price continues to stick within the vicinity of the rising wedge formation.
AUD/USD H4 charts, prior analysis
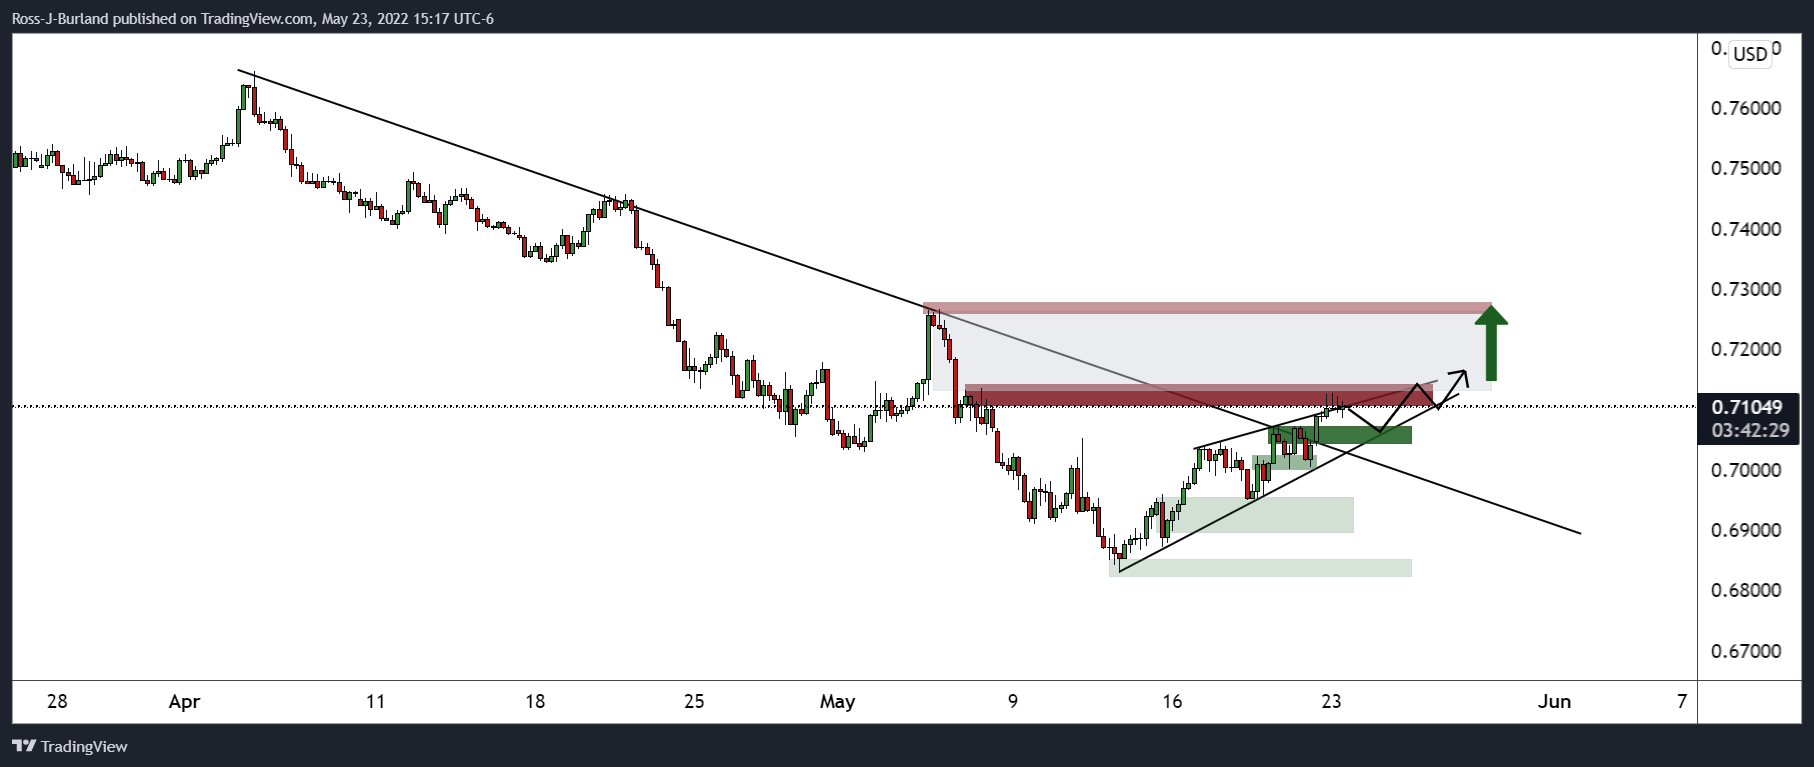
It was stated that ''a break of the current resistance would be a significant development. There is a void between there and the 0.73 figure and the price imbalance could well be mitigated.''
On the flip side, it was explained that the bears were ''moving in and repeated failures at this resistance level would be expected to leave the ball in their court. A subsequent break of the next term support would be expected to encourage the bears back to the table and a snowball effect gathering momentum could result in a downside continuation and restest of the counter trendline.''
It was then stated that ''a break of the trendline and a run on sell stops would be expected to result in supply that could push the bulls back to the edge of an abyss at 0.6950,'' as per the following daily chart's analysis:
AUD/USD live market
As illustrated, the bears tried to take control below the rising wedge, but the bulls firmed at horizontal support and have taken the bears back into the channel. The pull of the M-formation was too much for the bears and the bulls are testing the neckline near the current levels at 0.71 the figure. A break here will leave the bulls in good stead for a break of resistance around 0.7135 and a run of 0.7150 could open the way towards 0.7200 and then the 0.7260s and prior highs.
- USD/CAD has slipped at around 1.2800 as the DXY has weakened in a positive market mood.
- Oil prices have surged higher as demand worries have diminished in China.
- All Fed policymakers were in favor of featuring the jumbo rate hike.
The USD/CAD pair has witnessed a steep fall after failing to cross 1.2820 in the Asian session. The pair is eyeing a slippage below 1.2800 as the US dollar index (DXY) has been dumped by the market participants despite the release of an extremely hawkish Federal Open Market Committee (FOMC) minutes on Wednesday.
The FOMC minutes revealed that all FOMC members were in favor of stepping up the policy rates by 50 basis points (bps), which hints that a prolonged policy tightening environment is certain. Fed policymakers believe that the US economy needs more jumbo rate hikes as inflation is at the rooftop and the labor market is extremely tight. Therefore, the need to move back to the neutral rates is really strong. Also, the Fed sees neutral rates near 2.9%.
Meanwhile, oil prices have surpassed the crucial resistance of $110.00 as investors are expecting a recovery in the aggregate demand. A two-month-long lockdown period in Shanghai, China will be over soon and restrictions on the movement of men, materials, and machines will be withdrawn by the Chinese administration. It is worth noting that China is the largest importer of oil and demand recovery in China is sufficient to charge oil bulls.
Traders should be aware of the fact Canada is the largest exporter of oil to the US and higher oil prices will bring more fund inflows to the loonie region.
- Silver takes offers to renew daily low, extends the previous day’s pullback from two-week top.
- Three-day-old descending trend line restricts immediate upside inside one-week-old rising channel.
- 200-HMA, absence of downbeat RSI also challenge sellers.
Silver (XAG/USD) remains on the back foot for the second consecutive day, taking offers of around $21.93 during Thursday’s Asian session.
In doing so, the bright metal retreats from a three-day-old downward sloping resistance line amid descending RSI.
However, a one-week-old bullish channel’s support, around $21.75, will challenge the XAG/USD’s immediate downside.
Even if the quote drops below $21.75, the 200-HMA level of $21.71 and a near 50 level of RSI can keep silver buyers hopeful.
On the contrary, an upside break of the immediate resistance line, at $22.05, becomes necessary for buyers to retake control.
Following that, the upper line of the aforementioned channel, near $22.30, will gain the market’s attention.
Should the XAG/USD bulls dominate past $22.30, the $23.00 threshold and the monthly high near $23.30 will be in focus.
Silver: Hourly chart
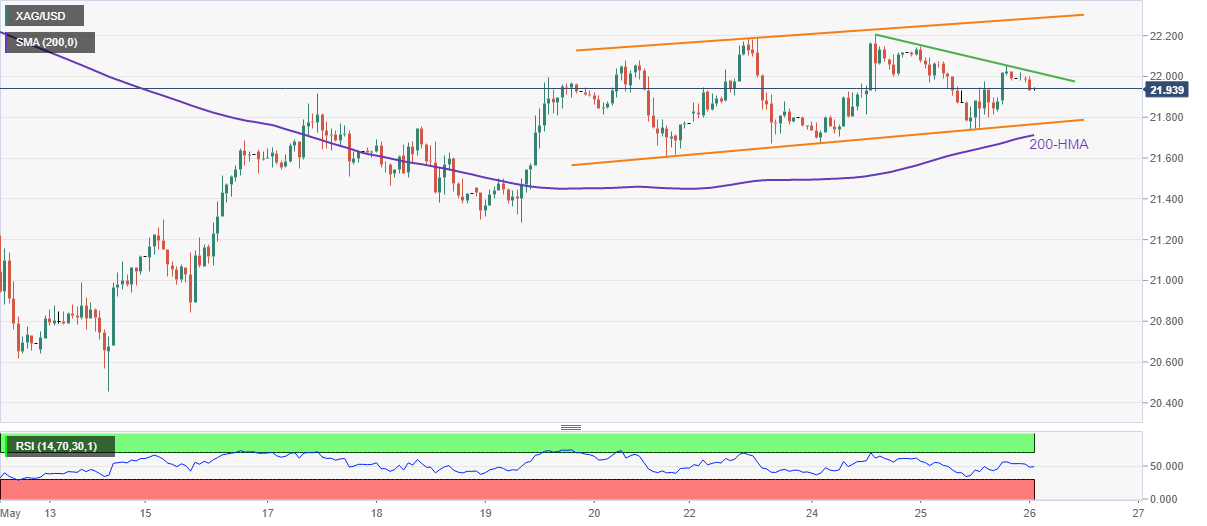
Trend: Short-term weakness expected
- GBP/USD has overstepped 1.2600 as DXY weakens ahead of US GDP numbers.
- The DXY has failed to capitalize upon the hawkish FOMC minutes.
- Risk-on impulse is underpinning the risk-perceived currencies.
The GBP/USD pair has managed to surpass the weekly resistance of 1.2600. A firmer upside move in the opening trade by the US dollar index (DXY) has weakened the pound bulls. The pair has remained stronger this week as the greenback was underperforming against the pound amid a risk-on market mood.
The risk appetite of the market participants has improved significantly as the global economy has discounted two more 50 basis points (bps) interest rate hikes, which is likely to be announced by the Federal Reserve (Fed) this year. The DXY has tumbled below 102.00 after printing a 19-year high of 105.00 on May 13. The asset has erased more than 3.20% from its recent high.
On Wednesday, the DXY witnessed some gains after the release of an extremely hawkish Federal Open Market Committee (FOMC) minutes. The minutes from the FOMC dictated that all members were in favor of a 50 bps interest rate hike and they believe that a couple of more similar hikes are appropriate to bring price stability.
In today’s session, investors will focus on the release of the US Gross Domestic Product (GDP). The annual GDP numbers are expected to remain stable at -1.4%.
In the pound zone, the UK delivered a poor show on the PMI front. The Services PMI landed at 51.8 vs. 57.3 as expected while the Manufacturing PMI was recorded lower at 54.6 vs. 55.1 forecasts.
- DXY fades bounce off monthly low, pressured around daily bottom of late.
- FOMC Minutes raised doubts on rate hikes after September, marked upside risks to inflation.
- Headlines from China, Ukraine test sentiment but US stock futures, Treasury yields print mild gains.
- Second readings of US Q1 GDP, Weekly Jobless Claims and PCE data will be important for fresh impulse.
US Dollar Index (DXY) remains depressed at around 102.00, reversing the previous day’s corrective pullback from the monthly low, as traders struggle for fresh during the aftermath of the Federal Open Market Committee (FOMC) Minutes. In doing so, the quote takes clues from firmer risk appetite amid lackluster markets.
While portraying the mood, the S&P 500 Futures print mild gains around 3,980 whereas the US 10-year Treasury yields again bounce off monthly low, after Wednesday’s failed attempt, up 2.5 basis points (bps) to 2.77% at the latest.
The latest Federal Open Market Committee (FOMC) Minutes endorsed the idea of 50 basis points (bps) rate hikes for only the next couple of meetings, raising doubts on the rate-lift trajectory past September. The Minutes rather highlighted inflation concerns and mentioned, “It would be appropriate to consider sales of mortgage-backed securities.”
Wall Street posted the biggest daily gains in a week following the event, which in turn drowned the DXY.
Other than the Fed Minutes, downbeat prints of the Durable Goods Orders for April also weighed on the US Dollar. As per the latest US Durable Goods Orders, the growth slowed down to 0.4% MoM versus market forecasts and revised down prior readings of 0.6%. Also, the Core Durable Goods Orders rose 0.3% MoM versus 0.6% expected and 1.1% prior (revised).
Alternatively, the latest headlines from China and Ukraine seem to challenge the market sentiment and keep the greenback on the bull’s radar. That said, “Ukrainian President Volodymyr Zelensky on Wednesday savaged suggestions that Kyiv gives up territory and make concessions to end the war with Russia, saying the idea smacked of attempts to appease Nazi Germany in 1938,” per Reuters. On the same line, China criticizes the US Draft Security Council resolution on North Korea and adds to the recently alive Sino-American tensions.
Looking forward, an off in Europe mat restrict market moves and let the post-FOMC Minutes move to extend. However, the second-tier US data, like preliminary GDP for Q1 2022 and Personal Consumption Expenditure (PCE) details for April, may entertain traders.
Technical analysis
Failures to cross a two-week-old descending trend line, around 102.71 by the press time, redirects the US Dollar Index towards a 61.8% Fibonacci retracement of mid-April to early May’s upside, near 101.65.
- WTI edges higher in the Asian session as inventories fall.
- OPEC production continues to underperform benchmarks materially.
At 110.93, West Texas Intermediate (WTI) crude oil is higher by some 0.22% and has drifted up from a low of $110.65 in the Asian session so far. Futures closed higher on Wednesday following a report showing US gasoline inventories fell last week, ahead of the start of the summer driving season on the Memorial Day weekend. WTI crude for July delivery closed up US$0.56 to US$110.33 per barrel.
Inventories continue to draw down and US stockpiles fell by 1,019kbbl last week, according to Energy Information Administration data. Gasoline inventories fell by 0.5 million barrels, less than the 4.22-million drop reported Tuesday by the American Petroleum Institute but still a drop ahead of high summer demand for the fuel.
Analysts at ANZ Bank explained that the fall was even greater than Cushing, the pricing point for WTI futures. ''At the same time, exports soared, and throughput at Gulf Coast refiners hit its highest level since January 2020. This helped slow down the drawdown in fuel inventories, providing some relief for tight markets. The EIA report also showed sales from the strategic reserve remain strong, with the stockpile falling 5,971kbbls last week. This takes the SPR to its lowest level since September 1987.''
The analysts also explained that the market remains on edge about the pending European sanctions on Russian oil. At the same time, while lockdowns in China weighed on growth expectations, mobility in the Middle Kingdom has been on an upward trend, suggesting oil markets have moved beyond peak demand concerns, analysts at TD Securities argued.
''Most importantly, the persistent supply risks in the complex continue to drive tighter fundamentals, and remain the most dominant driver for energy markets.''
Meanwhile, OPEC production continues to underperform benchmarks materially. ''In this context, despite macroeconomic angst, crude oil markets may be shaping up for another move higher this summer,'' the analysts at TD Securities said.
- USD/CHF fades bounce off monthly low, sidelined of late.
- Bearish MACD signals, clear downside break of previous support keeps sellers hopeful.
- One-month-old horizontal area, 21-DMA adds to the upside filters.
USD/CHF struggles to defend the previous day’s bounce off a one-month low, floating around 0.9615 during Thursday’s quiet Asian session after snapping a two-day downtrend the previous day.
The Swiss currency (CHF) pair’s inability to cross the 50% Fibonacci retracement (Fibo.) level of March-May upside, around 0.9630, joins bearish MACD signals to challenge short-term buyers.
Also keeping the bears hopeful is the existence of the support-turned-resistance line from March 31 and a monthly horizontal area, respectively near 0.9665 and 0.9700.
Meanwhile, pullback moves could aim for the 50-DMA retest, at 0.9565 by the press time, ahead of challenging the 61.8% Fibo. near 0.9525.
Should the USD/CHF prices drop below 0.9525, the pair sellers won’t hesitate to conquer the 0.9500 threshold while targeting the latest April swing low surrounding 0.9455.
USD/CHF: Daily chart
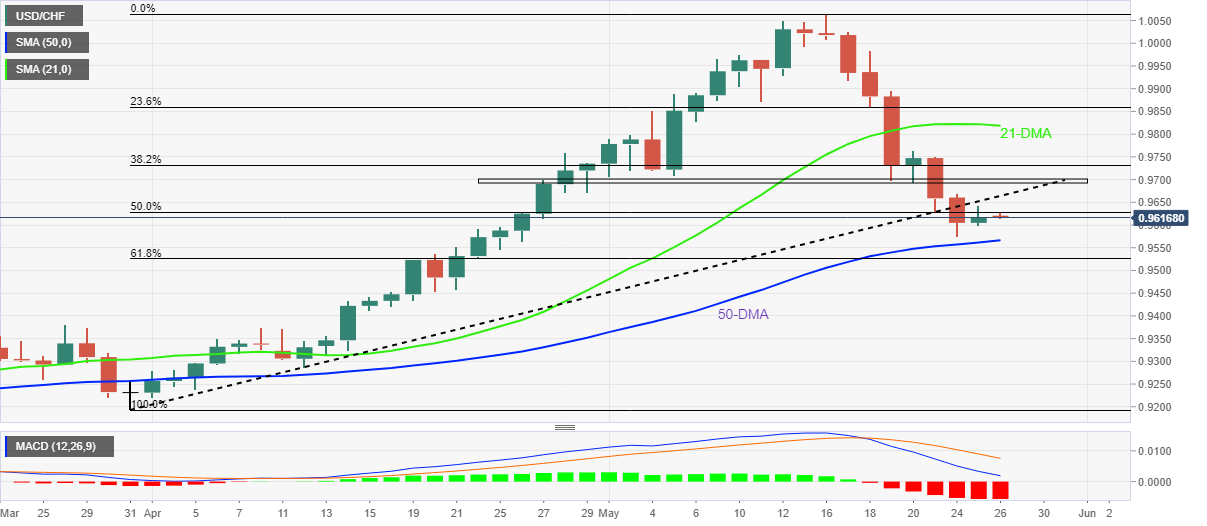
Trend: Further weakness expected
| Pare | Closed | Change, % |
|---|---|---|
| AUDUSD | 0.70849 | -0.32 |
| EURJPY | 135.899 | -0.22 |
| EURUSD | 1.06815 | -0.5 |
| GBPJPY | 160.034 | 0.64 |
| GBPUSD | 1.25776 | 0.35 |
| NZDUSD | 0.6475 | 0.26 |
| USDCAD | 1.28163 | -0.01 |
| USDCHF | 0.96135 | 0.08 |
| USDJPY | 127.241 | 0.28 |


© 2000-2026. All rights reserved.
This site is managed by Teletrade D.J. LLC 2351 LLC 2022 (Euro House, Richmond Hill Road, Kingstown, VC0100, St. Vincent and the Grenadines).
The information on this website is for informational purposes only and does not constitute any investment advice.
The company does not serve or provide services to customers who are residents of the US, Canada, Iran, The Democratic People's Republic of Korea, Yemen and FATF blacklisted countries.
Making transactions on financial markets with marginal financial instruments opens up wide possibilities and allows investors who are willing to take risks to earn high profits, carrying a potentially high risk of losses at the same time. Therefore you should responsibly approach the issue of choosing the appropriate investment strategy, taking the available resources into account, before starting trading.
Use of the information: full or partial use of materials from this website must always be referenced to TeleTrade as the source of information. Use of the materials on the Internet must be accompanied by a hyperlink to teletrade.org. Automatic import of materials and information from this website is prohibited.
Please contact our PR department if you have any questions or need assistance at pr@teletrade.global.
transfers