- Analytics
- News and Tools
- Market News
Analytics, News, and Forecasts for CFD Markets: currency news — 30-05-2022.
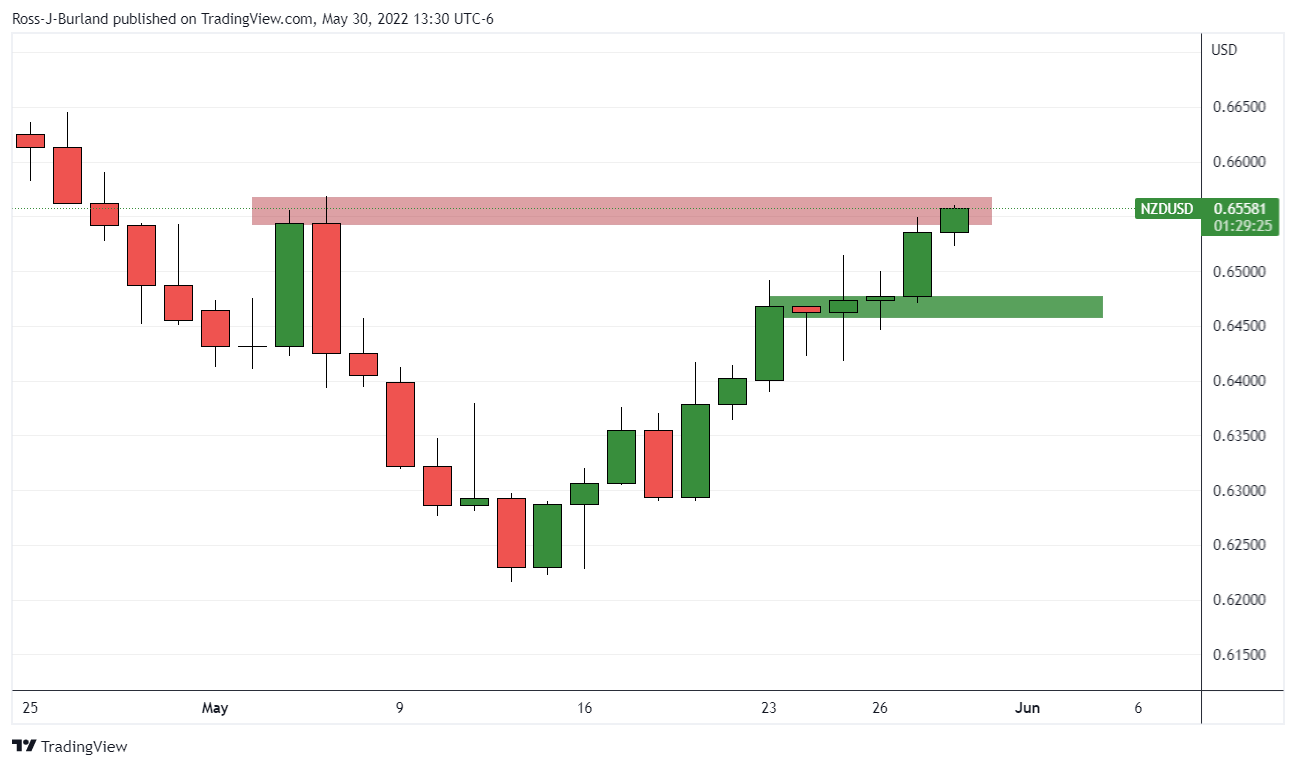
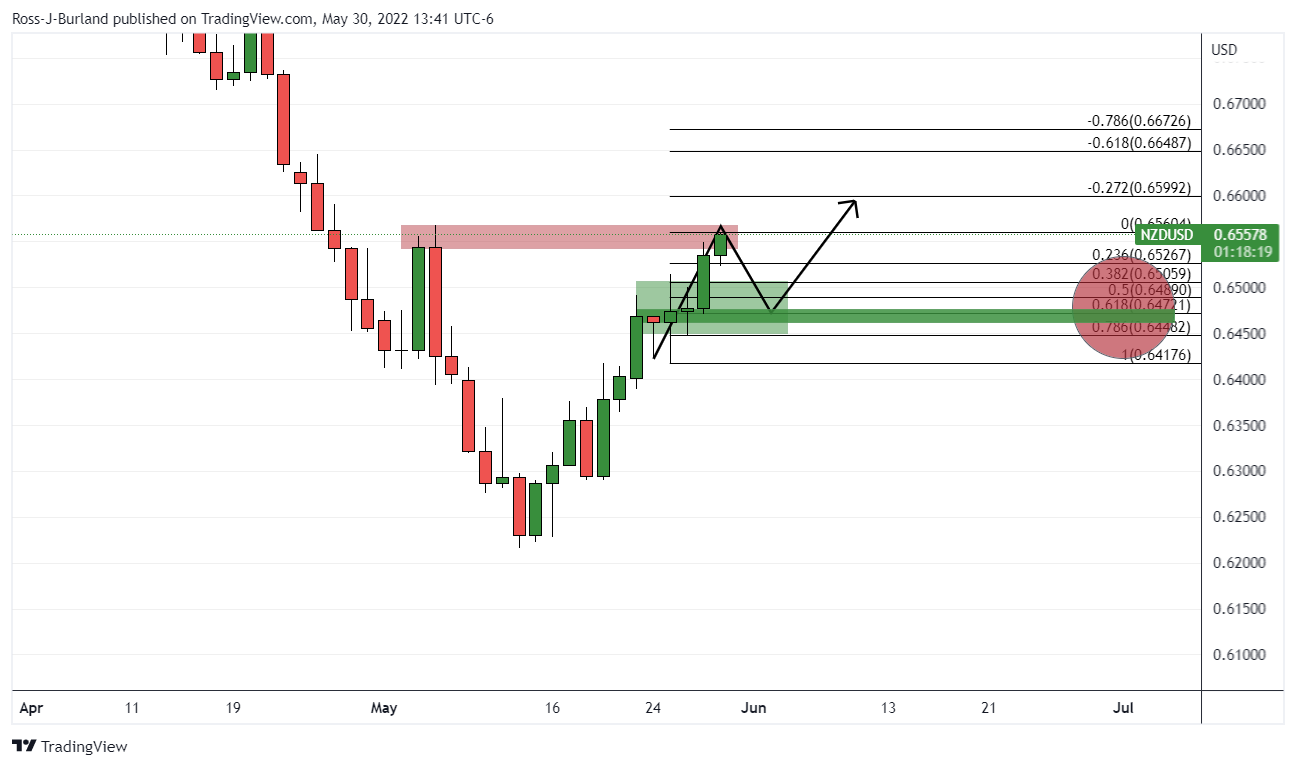
- The unavailability of any potential trigger in the kiwi docket has forced NZD/USD to struggle around 0.6560.
- The DXY is displaying a vulnerable performance on lower US NFP forecasts.
- RBNZ Adrian Orr hiked the OCR by 50 basis points in its last monetary policy meeting.
The NZD/USD pair is attempting to break the critical resistance of 0.6560 from the early New York session. A light economic calendar on the kiwi front has failed to provide any potential trigger to the antipodean. The asset has recorded a four-day winning streak and is expected to continue further, which looks possible after overstepping Monday’s high at 0.6560.
Broader weakness in the US dollar index (DXY) is driving the risk-sensitive dominating currencies higher. The DXY has remained vulnerable for the past two weeks as a rebound in the positive market sentiment trimmed the safe-haven's appeal. The DXY has printed a fresh monthly low at 101.30 however, a minor rebound has been witnessed in the early Tokyo, which will meet the responsive sellers.
This week, the entire investing community will focus on the US Nonfarm Payrolls (NFP). A preliminary estimate for the jobs additions in the nonfarm labor force is 320k in the month of May against the prior print of 428k. This will dampen the greenback further as the figure looks significantly lower. Also, the 12-month average of the US NFP has been recorded at 551.6k.
On the kiwi front, investors are still having the hangover of the hawkish monetary policy by the Reserve Bank of New Zealand (RBNZ). In order to tame the galloping inflation, RBNZ Governor Adrian Orr features a rate hike by 50 basis points (bps). Officially, the Official Cash Rate (OCR) has reached 2%. Going forward, the Caixin Manufacturing PMI data will be crucial for the kiwi dollar as the antipodean is a leading exporter to China. The economic data is seen at 47, higher than the prior print of 46.
- Silver takes offers to renew intraday low, extends Friday’s pullback from three-week high.
- Short-term support line, 200-HMA tests bears as RSI (14) approaches oversold territory.
- Recovery remains elusive unless crossing a two-day-old resistance line.
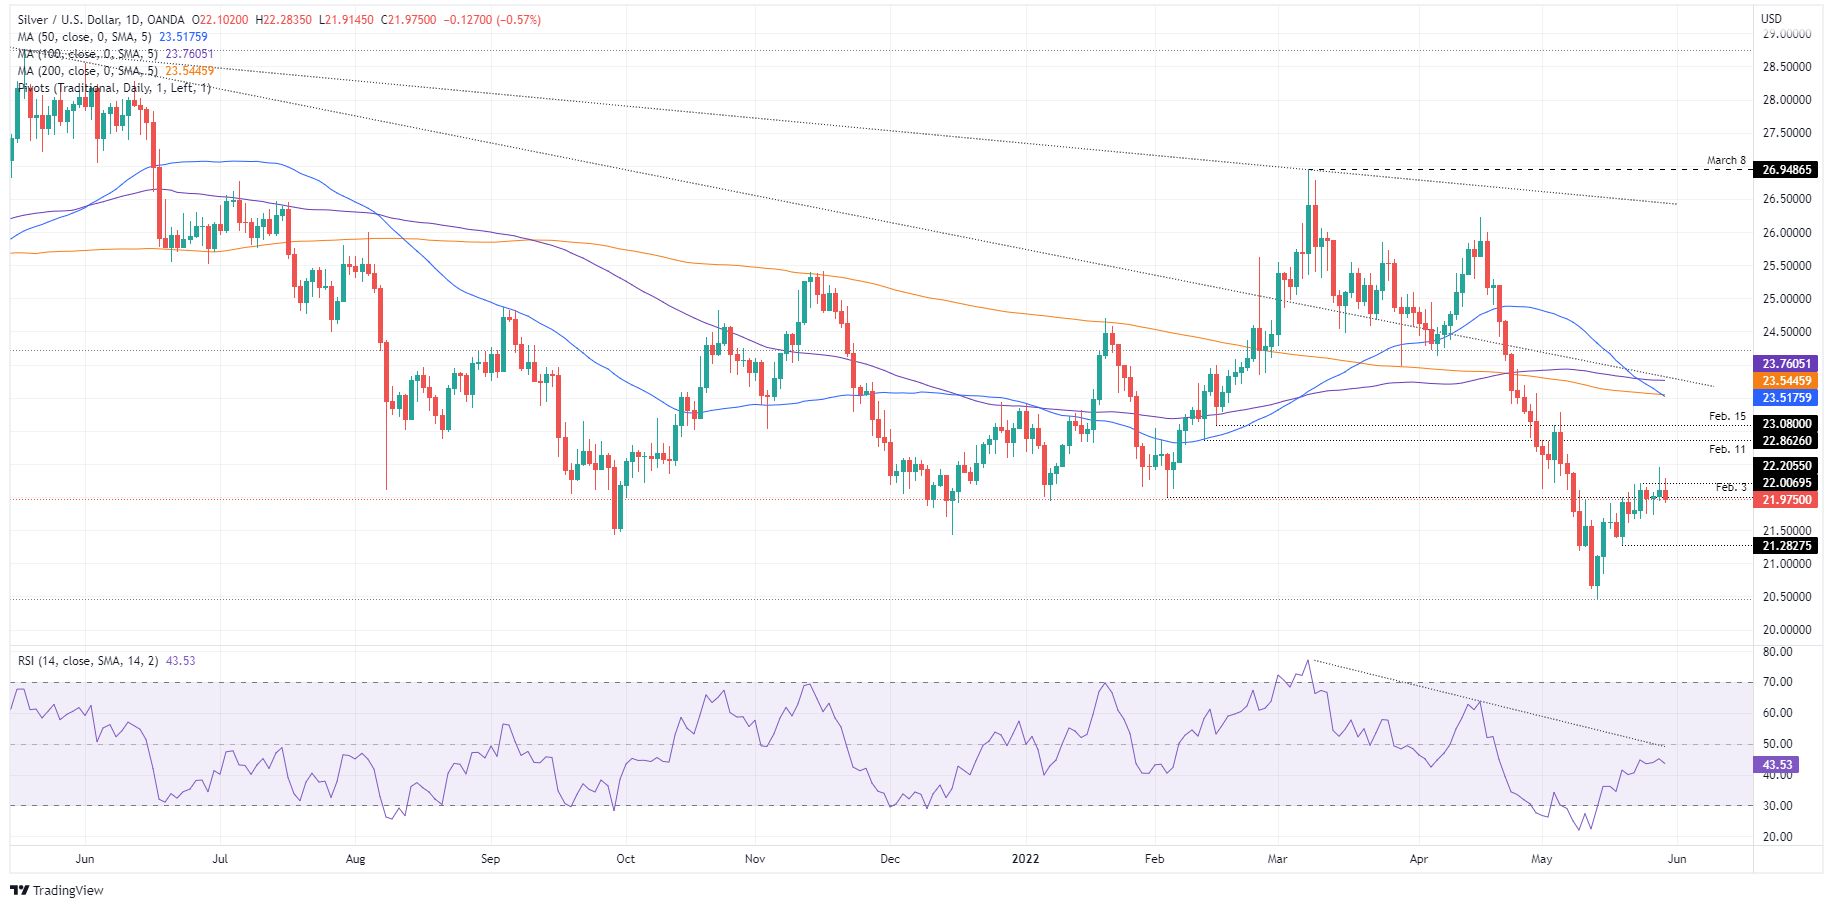
Silver (XAG/USD) prices keep the week-start pullback as bears attack short-term key support during Tuesday’s Asian session. That said, the bright metal drops to $21.92 by the press time.
An upward sloping trend line from May 19 precedes the 200-HMA to restrict XAG/USD weakness around $21.90-85.
It’s worth noting that the RSI (14) is speedily approaching the oversold region and hence tease the corrective pullback before further downside.
The same highlights the aforementioned $21.90-85 support, which if failed to trigger silver’s rebound could direct the metal towards $21.60.
Following that, the 61.8% Fibonacci retracement (Fibo.) of May 13-27, around $21.20, could challenge the XAG/USD bears.
Alternatively, recovery moves will need to cross a downward sloping resistance line from Friday, near $22.00, to convince buyers.
In a case where the silver bulls keep reins past $22.00, the recent high surrounding $22.45 and weekly resistance line around $22.50 may gain the market’s attention.
Silver: Hourly chart

Trend: Limited downside expected
- WTI stays on the front foot around the highest levels in 12 weeks, up for the fifth consecutive day.
- EU Leaders release fresh sanctions for Russian oil imports, EC President Von der Leyen said oil coming through pipelines exempted.
- Risk-on mood, softer US dollar adds to the bullish momentum.
- China PMI and full markets eyed for fresh impulse.
WTI rises to the fresh high in three months, also printing a five-day uptrend, as the European Union (EU) leaders release details of sanctions on Russian oil imports during Tuesday’s Asian session. In doing so, the black gold rises to $116.41 before easing to around $116.20.
“EU agrees to ban 90% of Russian oil imports by end of 2022,” announced EU Council President Charles Michel. The EU, he says, ''agrees to de-swifting the largest Russian bank Sberbank, banning 3 more Russian state-owned broadcasters, and sanctioning individuals responsible for war crimes in Ukraine.''
It should be noted, however, that European Commission President Ursula von der Leyen mentioned that a ban on Russian oil exempts oil that comes through pipelines, which in turn triggered a pullback in oil prices after an initial rise.
Even so, the energy benchmark remains on the front foot as a softer US dollar and risk-on mood underpin the commodity’s run-up ahead of the key official PMI data from China. Also important to watch will be the return of full markets after Monday’s US Memorial Day holiday.
That said, the US Dollar Index (DXY) refreshed its monthly low to 101.29, before bouncing off to 101.34, on Monday as the latest PCE Core Price Index data, the Fed’s preferred gauge of inflation, came in softer and failed to favor some of the hawkish Fed members.
In addition to the EU sanctions and softer US dollar, China’s gradual opening up of the economy from the covid-led activity restrictions also underpin the risk-on mood and propel the WTI crude oil prices. While portraying the mood, the S&P 500 Futures rise 0.40% intraday by the press time.
Technical analysis
A clear upside break of the late March high surrounding $115.90 enables WTI bulls to aim for the $120.00 threshold ahead of challenging the yearly top surrounding $126.50.
- The AUD/JPY begins the week on the right foot, gaining 0.97%.
- Risk-on market mood and China’s possible lockdowns lifting, cheered by investors.
- AUD/JPY Price Forecast: To remain upward biased, but struggling around 92.00, might open the door for a pullback towards 90.00.
The Australian dollar is extending its rally for the third consecutive day as the Asian begins, after Monday’s thin liquidity trading session in the FX market, courtesy of US holidays, keeping the New York session closed. At the time of writing, the AUD/JPY is trading at 91.84, up by a minimal 0.10%.
Market players’ mood boosted the Aussie, weighed on safe-havens
Improvement in risk appetite is one of the factors that boosted the appeal of the Aussie dollar. It advanced against most G7 currencies as news of China’s reopening and support for Beijing business was cheered by investors. European bourses closed in the green, while US equity futures point to a higher open on Tuesday’s cash market session.
Diggin a little deep into China’s news, Shanghai port is now reported to be operating at a 95% capacity, which is upbeat news for supply chains.
Regarding the Japanese yen, the Bank of Japan (BoJ) Governor Kuroda repeated the commitment to monetary policy easing to help the economy recover from the Covid-19 slump while adding that rapid JPY moves are undesirable. However, Kuroda said that the FX market is regaining stability.
The Australian economic calendar would feature the ANZ-Roy Morgan Australian Consumer Confidence data, followed by Q1 GDP. Linked to the Australian data, China’s Caixin PMI will also be revealed. On the Japanese front, the docket would feature employment data, the Unemployment Rate, Retail Sales and Industrial Production.
AUD/JPY Price Forecast: Technical outlook
The AUD/JPY rallied in the last three trading days, almost 200 pips. Monday’s price action witnessed an AUD/JPY test of the 50-day moving average (DMA) at 91.84, but so far, AUD/JPY bulls struggled and failed to deliver a daily close above it, which would have opened the door for further gains.
AUD/JPY traders need to be aware that technical indicators aim higher, except for the RSI, which is almost horizontal, at 54.53, indicating the cross-currency pair could consolidate before resuming the uptrend.
The AUD/JPY’s first resistance would be the 50-DMA. Break above would expose the 93.00 mark before reaching the May 5 swing high at 94.02. On the flip side, the AUD/JPY first support would be May 30 low at 90.88. A breach of the latter to send the pair towards May 24 swing low at 89.23, followed by the 89.00 mark.

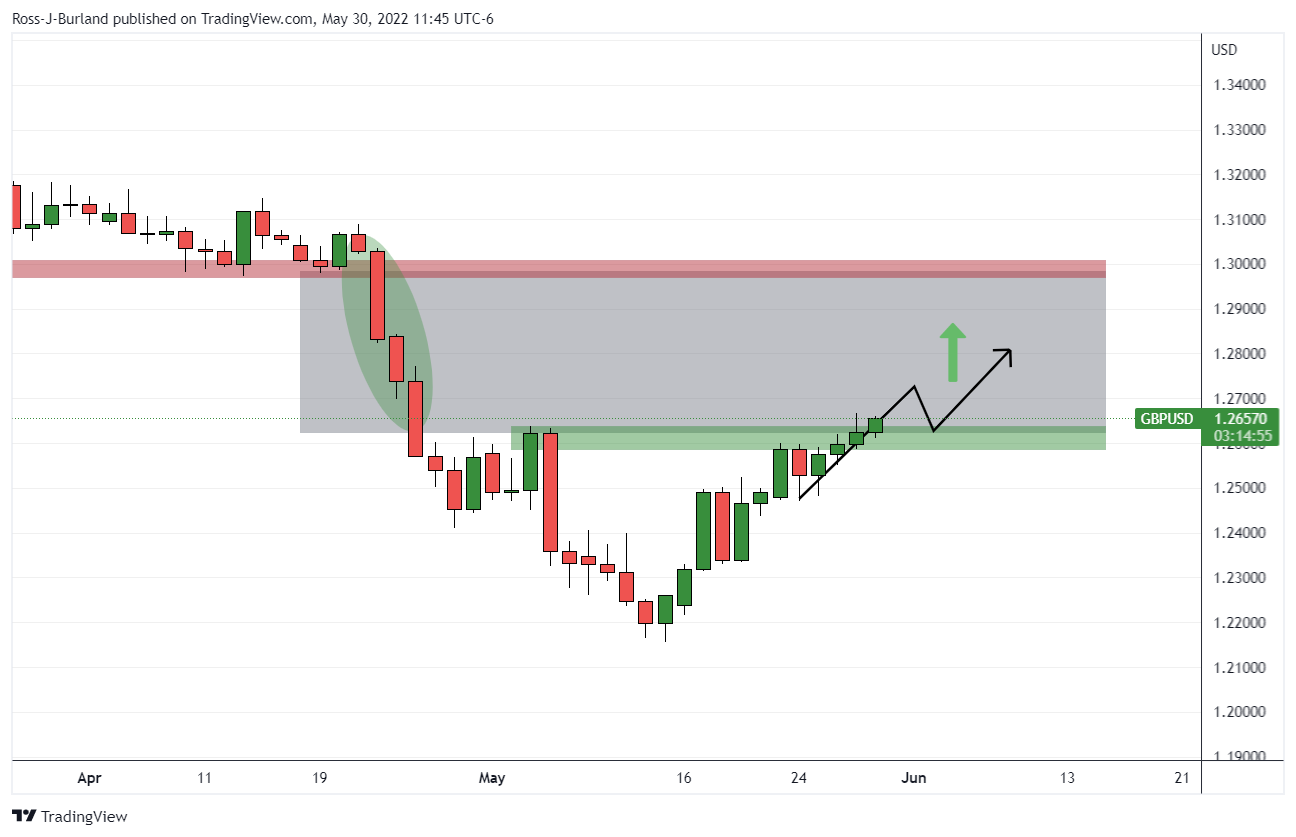
- The formation of a Rising Channel is advocating pound bulls.
- A break above the 200-EMA for the first time in the past three months adds to the upside filters.
- The RSI (14) is established in a 60.00-80.00 range, which signals more gains ahead.
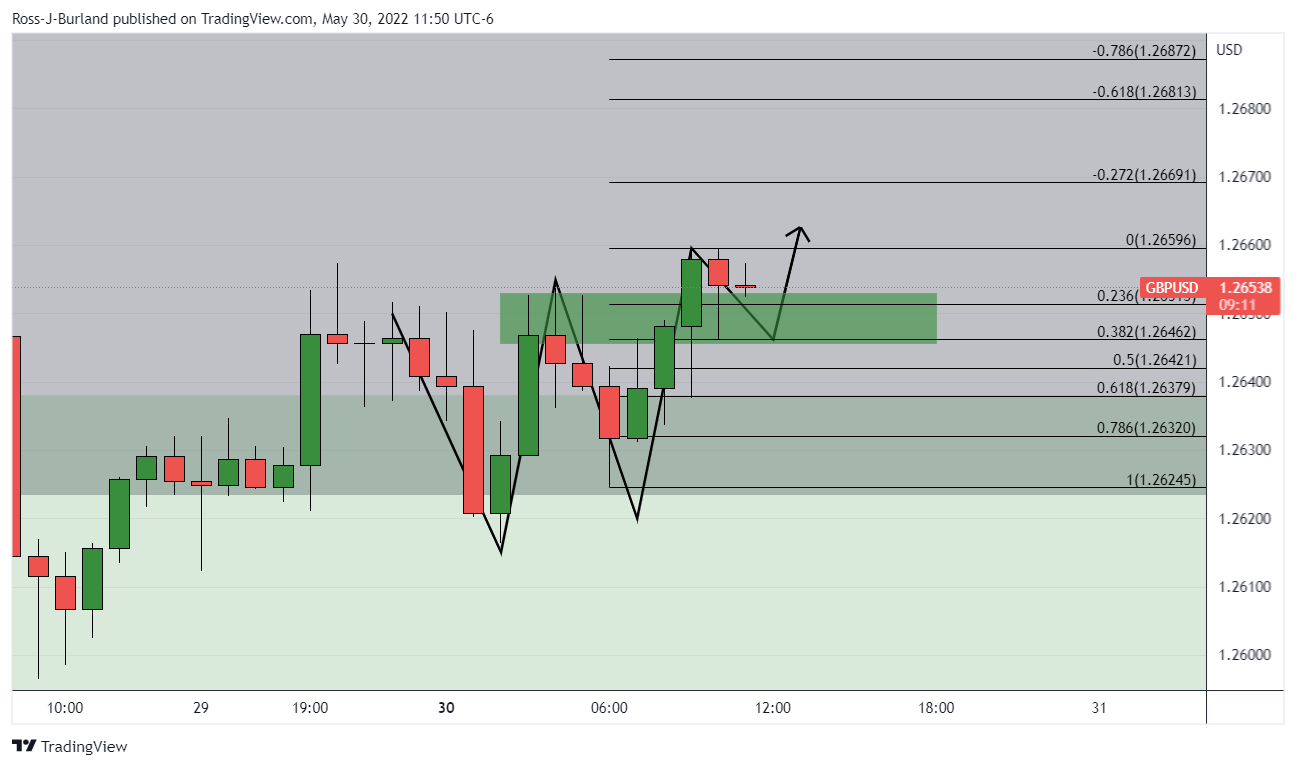
The GBP/USD pair is witnessing topsy-turvy moves in a narrow range of 1.2649-1.2655 in the early Tokyo session. A four-day winning streak has been displayed by cable and its continuation is expected once it will overstep Monday’s high at 1.2660.
The formation of a Rising Channel on a four-hour scale has underpinned the pound bulls against the greenback. The lower boundary of the above-mentioned chart pattern is placed from May 13 low at 1.2155 while the upper boundary is plotted from May 11 high at 1.2400.
The asset has climbed above the 200-period Exponential Moving Average (EMA) for the first time in the past three months. The 200-EMA is hovering a little above 1.2600. Also, the 50-EMA at 1.2552 is advancing sharply higher, which adds to the upside filters.
Meanwhile, the Relative Strength Index (RSI) (14) is oscillating in a bullish range of 60.00-80.00, which signals a continuation of bullish momentum, however, a slight pullback cannot be ruled out.
A minor pullback move towards the round-level support of 1.2600 will call for a responsive buying action by the market participants, which will send the asset towards Monday’s high at 1.2659. A breach of the latter will drive the asset towards the round-level resistance at 1.2700.
On the flip side, the pound bulls could lose their grip if the asset drops below the psychological support of 1.2500. This will drag the asset towards May 24 low at 1.2471, followed by May 11 high at 1.2400.
GBP/USD four-hour chart
-637895486419297270.png)
- USD/CAD dribbles around five-week low, probes four-day downtrend.
- 61.8% Fibonacci retracement level, 200-DMA tests bearish commitments.
- RSI, MACD signals hint at the further downside, 100-DMA guards recovery moves.
USD/CAD seesaw around the key 1.2660-55 support confluence as bears take a breather after refreshing the multi-day low. In doing so, the Loonie pair tests the bears ahead of the key Q1 2022 Canada GDP, pausing the consecutive declines for the last four days.
Not only the pre-data consolidation but a convergence of the 200-DMA and 61.8% Fibonacci retracement (Fibo.) of April-May upside, around 1.2660-55, also challenge the USD/CAD bears.
Should the quote conquer the 1.2655 support, the odds of witnessing a gradual south-run towards the 1.2600 and 1.2500 thresholds appear more lucrative.
However, April’s low surrounding 1.2400 could tests the USD/CAD sellers afterward.
Meanwhile, the 100-DMA level of 1.2700 tests the USD/CAD buyers ahead of a downward sloping trend line from early May, close to 1.2800 by the press time.
Even if the USD/CAD crosses the 1.2800 hurdle, bulls remain skeptical until witnessing a clear break of the 23.6% Fibo. level surrounding 1.2920.
USD/CAD: Daily chart
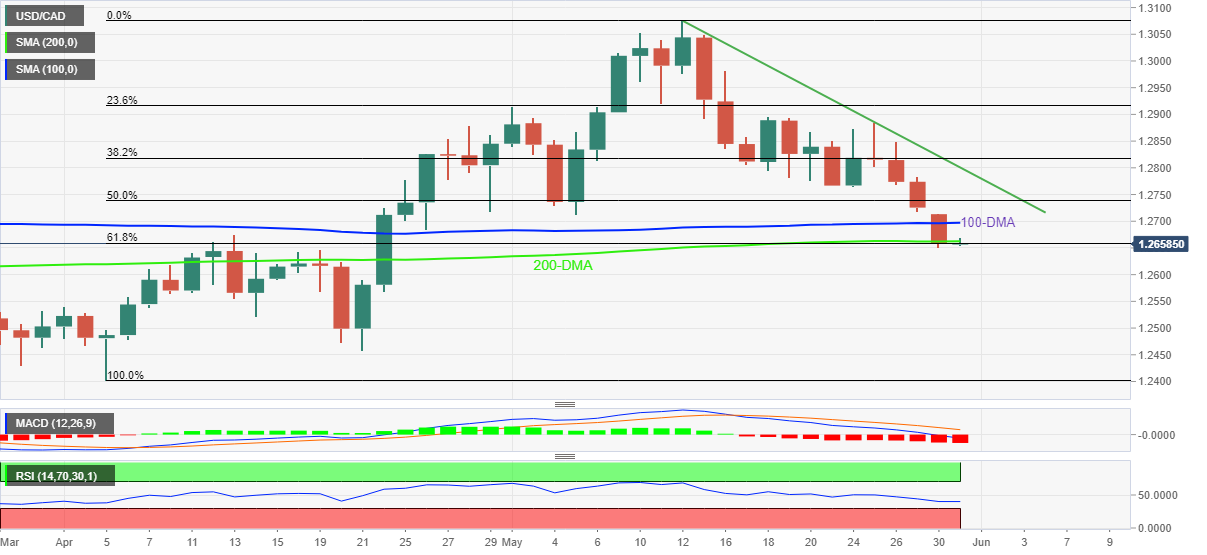
Trend: Further weakness expected
- EUR/USD retreats from monthly top, probes three-day uptrend.
- Market sentiment improved on China news, easing bets on Fed’s aggressive rate hikes.
- Germany’s inflation gauge refreshed multi-year high in April, EU Consumer Confidence edged up in May.
- Strong inflation numbers can add strength to hawkish ECBSpeak, supporting further upside of the pair.
EUR/USD bulls appear to turn cautious at a monthly high, pausing a three-day uptrend, as traders await the Eurozone inflation data, as well as full markets. That said, the major currency pair eases from the multi-day peak of 1.0786 to 1.0777 by the press time of the early Asian session on Tuesday. Even so, the quote remains on the bull’s radar amid broadly softer US dollar and upbeat concerns surrounding the bloc.
While the market’s anxiety ahead of the key data and the US traders’ return probes the EUR/USD bulls of late, the currency pair is far from welcoming bears. The rose to the highest levels since April 25 the previous day, also rising for the third consecutive day, as the US dollar weakness joined optimism surrounding the European Central Bank’s (ECB) rush toward a rate hike in July.
The US Dollar Index (DXY) refreshed its monthly low to 101.29, before bouncing off to 101.34, during the US Memorial Day Holiday. The greenback’s fall could be linked to the recently easing odds of the Federal Reserve’s (Fed) aggressive rate hikes, considering the downbeat inflation and growth numbers.
On the other hand, the first readings of Germany’s annual inflation, per the Harmonised Index of Consumer Prices (HICP), rose to 8.7% in May versus 8.0% expected and 7.8% prior. It’s worth noting that the Eurozone Consumer Confidence also increased to 105.0 in May from a revised down 104.9 figures for April.
It’s worth noting that firmer inflation data from the bloc back the recently hawkish comments suggesting a July rate hike from the ECB policymakers. The same contradicts the US conditions where the latest PCE Core Price Index data, the Fed’s preferred gauge of inflation, came in softer and failed to favor some of the hawkish Fed members. On Monday, Fed Board of Governors member Christopher Waller said that he supports lifting interest rates by another 50 bps at the next several Fed meetings and that the policy rate should be above neutral by the end of the year to reduce demand, reported Reuters.
Other than the US dollar weakness and upbeat concerns for the Euro, China’s gradual opening up of the economy from the covid-led activity restrictions also underpin the risk-on mood and propel the EUR/USD prices.
Moving on, Eurozone HICP YoY is expected to refresh multi-year high with 7.7% figures versus 7.4% prior whereas the HICP-X F, E, A, T, also known as core inflation, bears the consensus of reprinting 3.5% YoY figures. Additionally, Chicago Purchasing Managers’ Index and Dallas Fed Manufacturing Business Index for May could also entertain EUR/USD traders.
Given the upbeat expectations from the Eurozone data, the major currency pair may witness further upside. However, the US traders’ reaction to the latest market sentiment should be observed.
Technical analysis
A daily closing beyond the 50-DMA, around 1.0740 by the press time, directs EUR/USD towards a downward sloping trend line from February 10, close to 1.0800.
- USD/CHF has attracted some bids near 0.9564, investors should brace for a responsive selling action.
- A preliminary estimate for the annual GDP is 4.4% against the prior print of 3.7%.
- The US NFP may slip to 320k, significantly lower than the 12-month average of 551.6k.
The USD/CHF pair has bounced back from 0.9564 after consolidating in a narrow range of 0.9568-0.9580 in the late New York session. A V-shape downfall after failing to sustain above 1.0000 has pushed the asset lower to 0.9545. On Monday, the asset displayed reluctance while attempting an upside move above 0.9600, which indicates that the party of the Swiss franc bulls is yet not over and more downside would be recorded by the market participants.
The greenback is underperforming against the Swiss franc as investors are expecting an outperformance in the Swiss Gross Domestic Product (GDP) numbers. The quarterly GDP is likely to land at 0.4% vs. 0.3% the former figure. While the preliminary estimate for the yearly figure is 4.4% against the prior print of 3.7%. Later this week, the Swiss Federal Statistical Office may report the Consumer Price Index (CPI) figure at 2.6%, an elevation from the prior print of 2.5%.
Meanwhile, the US dollar front (DXY) has refreshed it's monthly low at 101.30. A minor bounce has been witnessed in the asset, although it looks less confident and will invite a responsive selling action by the market participants ahead. The DXY is going through an intense selling pressure as a lower forecast of the US Nonfarm payrolls (NFP) at 320k is expected to compel the Federal Reserve (Fed) to trim its extreme hawkish tone for June monetary policy.
“I welcome the EUCO agreement tonight on oil sanctions against Russia. This will effectively cut around 90% of oil imports from Russia to the EU by the end of the year,” tweeted European Commission President Ursula von der Leyen after sanctions on Russia were unveiled.
Also read: EU diplomat: EU agrees to ban 90% of Russian oil imports by end of 2022
Key quotes
Ban on Russian oil exempts oil that comes through pipelines.
This allows dependent states, which is Hungary almost exclusively, to continue importing.
Shipped (sea-borne oil imports) Russian oil, accounting for 2/3 of EU imports, will be banned.
Germany and Poland will stop oil imports via the Druzhba pipeline by the end of the year.
Market reaction
After the news, WTI reverses the recent uptick to the highest levels since early March by declining to $115.90. Even so, the black gold remains 0.18% up intraday during the early hours of Tuesday’s Asian session.
- The British pound appreciates vs. the Japanese yen, spurred by an upbeat sentiment.
- The mood improved as China’s Covid-19 Covid-19 restrictions might ease as cases dropped.
- GBP/JPY Price Analysis: To aim upward, unless bulls battle at around 161.50, which would send the pair tumbling towards 160.00.
The British pound extends its gains against the low-yielder Japanese yen for four days, courtesy of a positive market sentiment that witnessed flows towards the equity markets. At the time of writing, the GBP/JPY is trading at 161.46, up by some 0.63%.
Asian and European stocks recorded gains, while US equities rose. Safe-haven peers remain downward pressured, particularly the Japanese yen and the greenback, a tailwind for the GBP/JPY. Meanwhile, at the Euro area summit, the EU Commission failed to deliver the sixth tranche of sanctions to Russia on disagreements regarding the Russian oil embargo.
Elsewhere, it is worth noticing that the week began in a positive mood due to China’s Covid-19 improvements. A Beijing city official said they would no longer require working from home, while Shanghai is set to remove restrictions on Wednesday, June 1.
GBP/JPY Price Analysis: Technical outlook
GBP/JPY Monday’s price action lifted the pair towards the May 17 high at 161.85 but failed to conquer that level. However, it’s worth noting that the Relative Strength Index (RSI,) albeit in the bullish territory, is directionless, and if the cross-currency pair is aiming for a break above May 9, swing high at 162.18, it would need to overcome some hurdles on its way north.
With that said, the GBP/JPY’s first resistance is the 161.50 mark. Break above would expose the May 17high at 161.85, followed by 162.00, and then the May 9 swing high at 162.18.
Otherwise, the GBP/JPY’s failure at 161.50 would open the door for further downside action. The GBP/JPY first support would be the 161.00 mark. A breach of the latter would expose the May 30 low at 160.25, followed by May 20 low at 158.72.
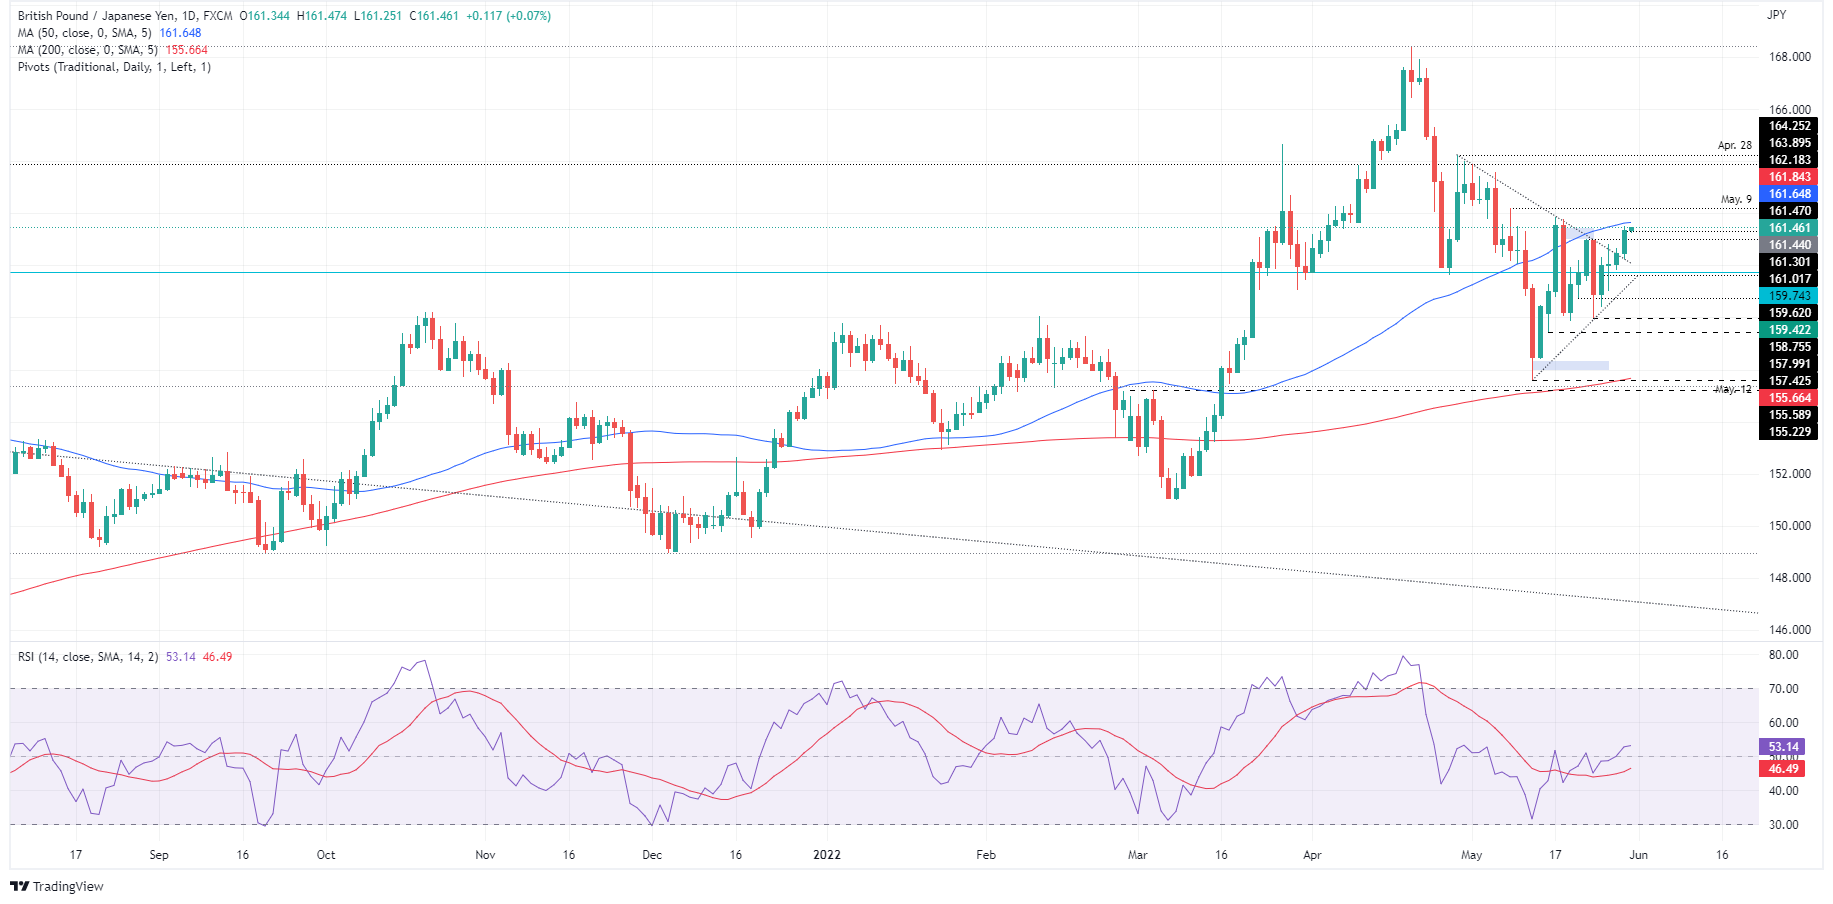
Key Technical Levels
EU leaders are meeting for an off-schedule summit and some progress with regard to Russian sanctions is being made. The EU Council President Michel says they have an agreement to ban the export of Russian oil to the EU. The EU, he says, ''agrees to de-swifting the largest Russian bank Sberbank, banning 3 more Russian state-owned broadcasters, and sanctioning individuals responsible for war crimes in Ukraine.''
To date, Hungary has blocked EU-wide energy sanctions, but this meeting may have provided a platform for a breakthrough. The New York Times said the embargo was in draft agreement leaders were set to adopt Monday.
The Times said the measure will ban all Russian oil transported to the European Union by tankers, but permit crude arriving by pipeline. That would still outright ban two-thirds of all oil imported into the bloc from Russia, based on a draft seen by the Times.
In March, leaders asked the Commission to present proposals at this meeting on how to deal with rising food prices, defence gaps, decoupling electricity and gas prices, as well as reducing Russian energy dependence.
Oil prices were unchanged in early Asian trade despite the prospects of an agreement.
- Gold price is oscillating in a $1,850-1,864.23 range ahead of the US NFP.
- An estimation of the US NFP is significantly lower than the 12-month average figure.
- The momentum oscillator RSI (14) is indicating more consolidation ahead.
Gold price (XAU/USD) is consolidating below the critical resistance of $1,860.00 after a sheer upside move from the low of $1,786.78, recorded on May 16. The precious metal has turned sideways as investors are awaiting the release of the US Nonfarm Payrolls (NFP), which are due on Friday. The US NFP is a major catalyst that guides the preparation of the monetary policy statement, which is dictated by the Federal Reserve (Fed).
As per the market consensus, the US NFP is expected to land at 320k against the prior print of 428k. The labor market in the US economy is extremely tight and continuous additions of jobs are indicating the healthy progress of the economy. On an average basis, the US economy has been adding 551.6k jobs to its labor force over the past year. This time, the forecast of 320k is significantly lower than the average additions, which signals that the employment curve is advancing but at a diminishing rate.
On the dollar front, the US dollar index (DXY) has comfortably established below 102.00. The asset has registered a fresh monthly low at 101.30. This week, ISM Manufacturing PMI data also holds significant importance. The economic catalyst is seen at 54.5 against the prior print of 55.4.
Gold technical analysis
On an hourly scale, the gold price is forming a Symmetrical Triangle that signals a slippage in the volatility followed by a breakout in the same. Considering the price action, an upside break of the above-mentioned chart pattern looks likely. The 20-period Exponential Moving Average (EMA) at $1,856.90 is overlapping with the gold prices, which signals an ongoing consolidation phase. Apart from that, the Relative Strength Index (RSI) (14) is oscillating in a 40.00-60.00 range, which signals the continuation of a rangebound move.
Gold hourly chart
-637895444042424121.png)
- AUD/USD bulls stay in the driver's seat and eye a strong move through the 0.72s.
- Bulls are now in the clear and target 0.7260.
At 0.71944, AUD/USD is testing through a key resistance area on the daily chart following a solid start to the week so far. The Aussie has been underpinned by risk assets that have been in demand as investors get incentivised by the gradual easing of the lockdown in China. Moreover, the pricing of a Fed pause allows interest to return to FX carry trades which is supporting the antipodeans. The greenback has dipped in reflection of speculation that the Fed may take a pause in its rate hiking cycle in September.
Equity markets trended up overnight but gains, particularly in Europe, which too was supportive of the high beta AUD. However, it was a slow day in New York with the Memorial Day holiday in the US which meant no new data was released from there.
With a focus on the Chinese easing of lockdowns, analysts at ANZ Bank explained in a note that they are starting to ease as COVID-19 cases fall. ''This will help boost economic activity, not only in China, but also in the countries which rely on China for trade. China is expected to release additional fuel into the global market to help clear its stockpiles,'' the analysts said.
''Beijing has also announced measures to try to stimulate economic activity through additional government spending on infrastructure, speeding up approvals for property purchases, making it cheaper for consumers to purchase cars, subsiding wages in certain industries, and reducing taxes.''
Meanwhile, there will be attention paid to today's data release in PMIs from China. ''Both PMIs are likely to remain in contraction,'' analysts at TD Securities said. ''Partial easing in lockdown measures will help reduce some negative sentiment in manufacturing. However, weaker export trends, lacklustre demand for loans, and soft infrastructure spending suggest manufacturing will not move back to expansion quickly. Services recovery is likely to be even slower amid constrained consumer activity.''
AUD/USD technical analysis
As per the pre-open analysis at the start of this week, AUD/USD Price Analysis: Bulls move into a critical area on H4 charts, eye a run to the 0.7250/60s the bulls stay with the course as illustrated:
AUD/USD pre-open analysis
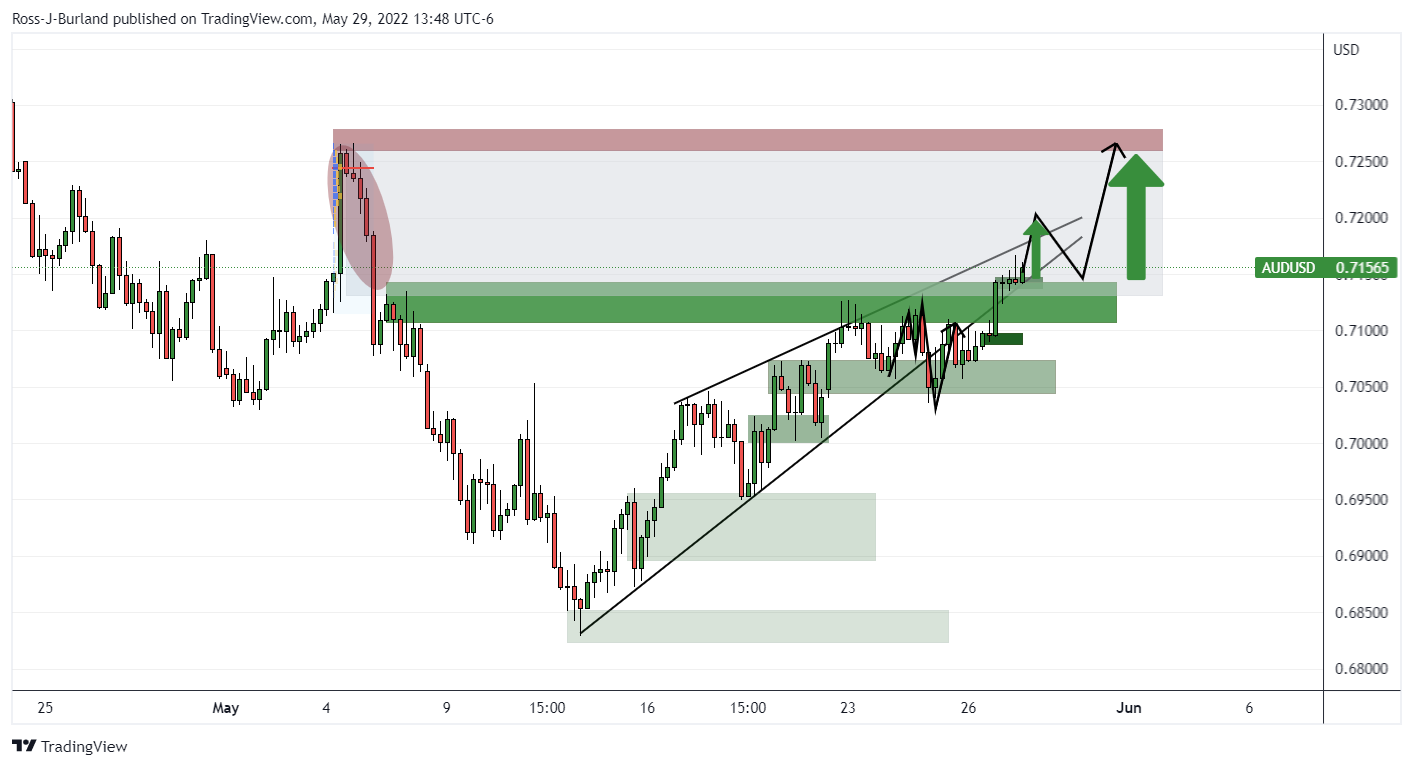
It was explained that the price had been respecting the support structures ''in its pursuit of the price imbalance between recent highs and the May 4 highs at 0.7266. The price would be expected to mitigate this area of imbalance with relative ease.''
AUD/USD live update
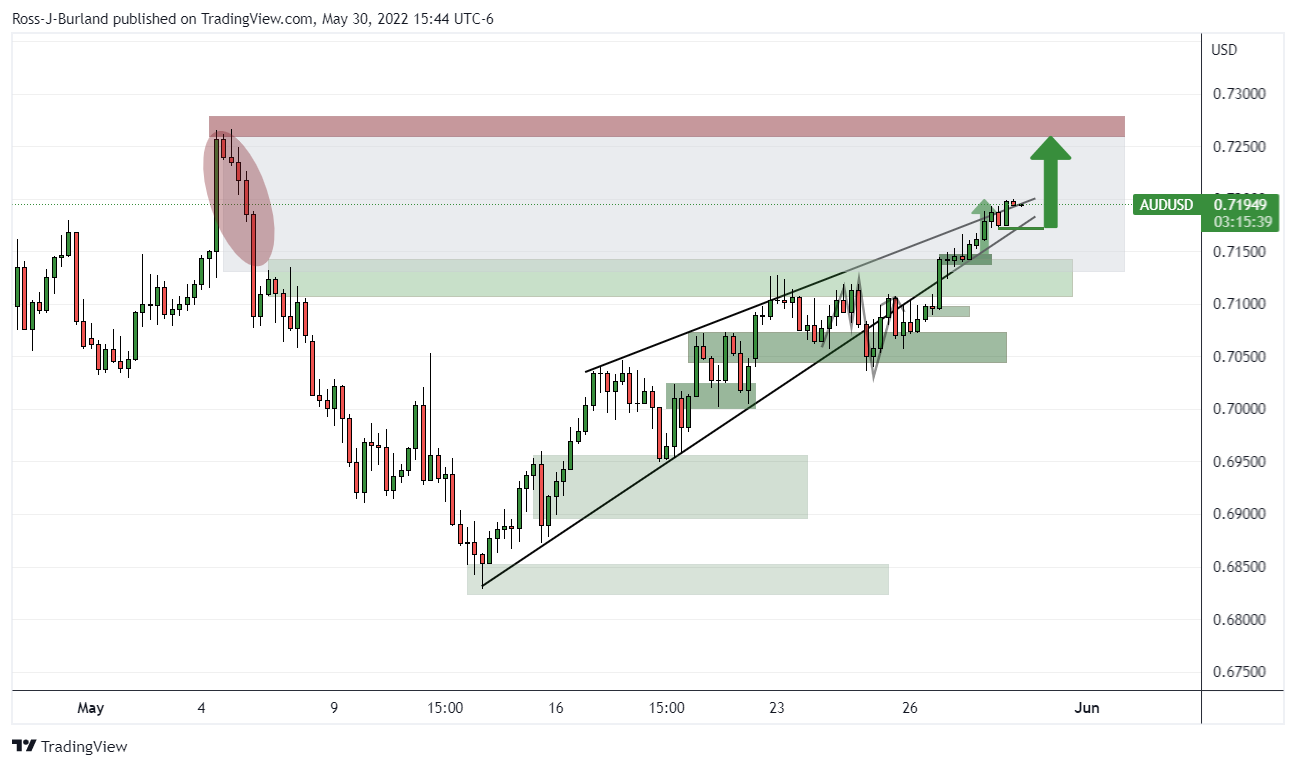
- The price is in the hands of the bulls, but potentially only momentarily.
- The W-formation is being printed, a reversion pattern that could prove to be the determining factor.
As per the prior series of analyses, USD/JPY Price Analysis: Bulls meeting tough resistance from bears despite bull flag, and, USD/JPY Price Analysis: Bears have taken control, eye weekly 38.2% Fibo near 125.00, the price has continued on its southerly trajectory. There are a few hurdles left to cross until the bears reach the 38.2% target, with 127.30 and 126.80 key in this regard.
USD/JPY weekly chart, prior analysis
USD/JPY live market
The bears are giving some ground back to the bulls at this juncture. However, the daily chart's structure leans bearish still, as follows:
The price is in the hands of the bulls, but potentially only momentarily according to the current W-formation that is being printed. This is a reversion pattern and while a move into resistance is on the cards, the pull of the neckline could prove to be the determining factor that results in a downside continuation for the days ahead.
Reserve Bank of New Zealand Deputy Governor/General Manager Financial Stability Hawkesby has crossed the wires stating that the central bank needs to tighten conditions past neutral of 2% and reduce stimulus. He forecasts a period of subdued consumption. He also said the risk of a recession is a possibility.
Meanwhile, the NZD was boosted by the RBNZ's hawkish Statement when it raised rates by 50bp to 2%, indicating more hikes to come.
''The Kiwi is a touch stronger this morning, but it looks more like currency at the upper end of trading ranges than a currency on the verge of a major breakout, the analysts at ANZ Bank argued,'' in line with the following analysis:
-
NZD/USD Price Analysis: Bulls need to break a key weekly level at this juncture
- The weekly correction into the 38.2% Fibonacci has a confluence with the May swing lows.
- A firm break through the resistance will be needed if the bulls are going to stay in control towards 0.6720.
The NZ dollar is attracting a bid as the US dollar nurses last week's losses and continues to bleed out on Monday. As measured by the DXY index vs. a basket of major currency rivals, the greenback is headed for its first monthly drop in five months. Investors have scaled back bets that rising US rates will send the greenback higher within the bull cycle as fears of a global recession have receded a little.
On the charts, this gives the kiwi bulls an opportunity to take on the prior daily resistance as follows:
However, the bulls need a clean break of the resistance or they will risk facing a firm move by the bears:
The prior resistance on the daily and 4-hour charts that have a confluence with the daily Fibonacci scale would be expected to act as a support structure for the coming sessions.
From a weekly perspective, however, the bulls will be cautious around such a key weekly level as this:
The correction into the 38.2% Fibonacci that has a confluence with the May swing lows could offer a firm area of resistance and consequently push the bulls back. In doing so, this could embolden the bears and lead to a downside continuation for the forthcoming weeks.
On the other hand, a firm break through the resistance will leave the bulls in good stead for a deeper correction towards 0.6720 and the prior support structure that has a confluence with the 61.8% golden ratio.
What you need to take care of on Tuesday, May 31:
The greenback remained under pressure in the first trading day of the week, falling against most major rivals. The USD/JPY pair, however, edged higher amid the better tone of stocks markets.
The better mood was triggered by China, as Shanghai announced it would start lifting covid-related restrictions this week as planned. Businesses will return to normal after over a month of lockdown. Asian and European indexes advanced, while US markets were closed due to the celebration of Memorial Day.
EU representatives are still discussing the sixth package of sanctions on Russia, with rumours hinting at a potential announcement this week, that would not include banning oil imports coming from pipelines.
The EUR/USD pair managed to reach a fresh May high of 1.0786, despite German inflation reaching fresh multi-decade highs in May, according to preliminary estimates. The EU will publish its own estimates on Tuesday. GBP/USD settled around 1.2650.
The Canadian dollar was among the top performers. USD/CAD trades around 1.2660, helped by higher oil prices, as WTI futures trade at $117.00 a barrel. AUD/USD is near 0.7200, despite gold remained lifeless. The bright metal currently changes hands at $1,855 a troy ounce.
Little happened during US trading hours amid the aforementioned holiday. However, the week will be fulfilled with growth, employment and inflation data from major economies. EU inflation, AUS GDP and the US Nonfarm Payrolls report are among the most relevant.
Dogecoin price is positioned for a charge back to $0.11
Like this article? Help us with some feedback by answering this survey:
- Silver begins the week on the wrong foot, down 0.57%.
- Sentiment-wise, the market is positive, as reflected by global equities up.
- Silver Price Forecast (XAG/USD): Fluctuating around $21.50-22.50.
Silver (XAG/USD) grinds lower during Monday’s North American session, albeit the US Dollar trading softer in a shorter than usual trading session, as US markets remain closed in the observance the Memorial Day. At the time of writing, the XAG/USD is trading at $21.97, off the $22.00 mark.
A risk-on market mood keeps flowing towards stocks, thus weighing on safe-haven assets like silver. Asian and European equities finished with gains, while US futures rose. The greenback is softer during the day, as illustrated by the US Dollar Index, down 0.31%, sitting at 101.323.
Fed speaking crossed the wires. In Frankfurt, Federal Reserve Governor Christopher Waller said that he advocates 50 bps rate hikes on the table “until we see substantial reductions in inflation. Until we get that, I don’t see the point of stopping.” He added that he supports 50 bps at “several” meetings.
Silver traders need to be aware that on Tuesday, US President Joe Biden and Federal Reserve Chair Jerome Powell will meet for discussions in the White House on the state of the American and global economy.
Monday’s absent US economic calendar would keep traders leaning towards market sentiment. In the week ahead, the US docket would feature May’s ISM Manufacturing and Non-Manufacturing PMIs, the CB Consumer Confidence, and US employment data, led by the Nonfarm Payrolls, ADP report, and Initial Jobless Claims.
Silver Price Forecast (XAG/USD): Technical outlook
On Friday, Silver (XAG/USD) reached a two-week high at around $22.46, and since then, XAG/USD bulls have failed to keep prices above $22.00. That said, the white metal remains to trade in the $21.50-22.50 range, unable to register a successful upward/downward break beyond the boundaries.
Upwards, the XAGU/USD’s first resistance would be $22.00. A breach of the latter would send XAG/USD towards May 27 high at $22.46. Once cleared, the following supply zone would be February 11 low-turned-resistance at $22.86, followed by February 15 low at $23.08.
On the flip side, the xAG/USD first support would be May 26 low at $21.72. Break below would expose May 13 swing low at $21.28, followed b the YTD low at $20.45.
Key Technical Levels
- A soft US dollar at the start of the week is keeping the euro bulls in charge.
- EUR/USD bulls are looking for 1.0760 to hold as critical support in order to target the 1.08 territories.
As per the prior analysis, EUR/USD Price Analysis: Bulls are up against pressures in a key support zone, the price had been testing a key support area on the four-hour charts within what could have been the makings of a fresh daily bullish impulse. The prospects have played out at the start of the week as the US dollar continues to slide. The following illustrates the bullish bias the price moves into a key area on the daily chart as the bulls penetrate critical resistance.
EUR/USD, before and after analysis, daily and H4 charts

(Before)
It was stated that ''the price broke the horizontal resistance that is now responding as a support zone on the retest. The bulls have committed to the course and a run into prior support and resistance between 1.0761 and 1.0936 could be in order with the 1.08 figure a key target.''

(After)
The price has indeed moved higher and is now up against a potentially firmer layer of resistance.
Meanwhile, in the following four-hour prior analysis, the W-formation was identified and the price has moved in accordance with this reversion pattern as follows:


(Before)

(After)
The price moved higher, respecting the W-formation's neckline support and printed another W-formation, again respecting the neckline support before extending into the target area with 1.08 eyed for the sessions ahead. The bulls could be encouraged should 1.0760 hold as the next level of support.
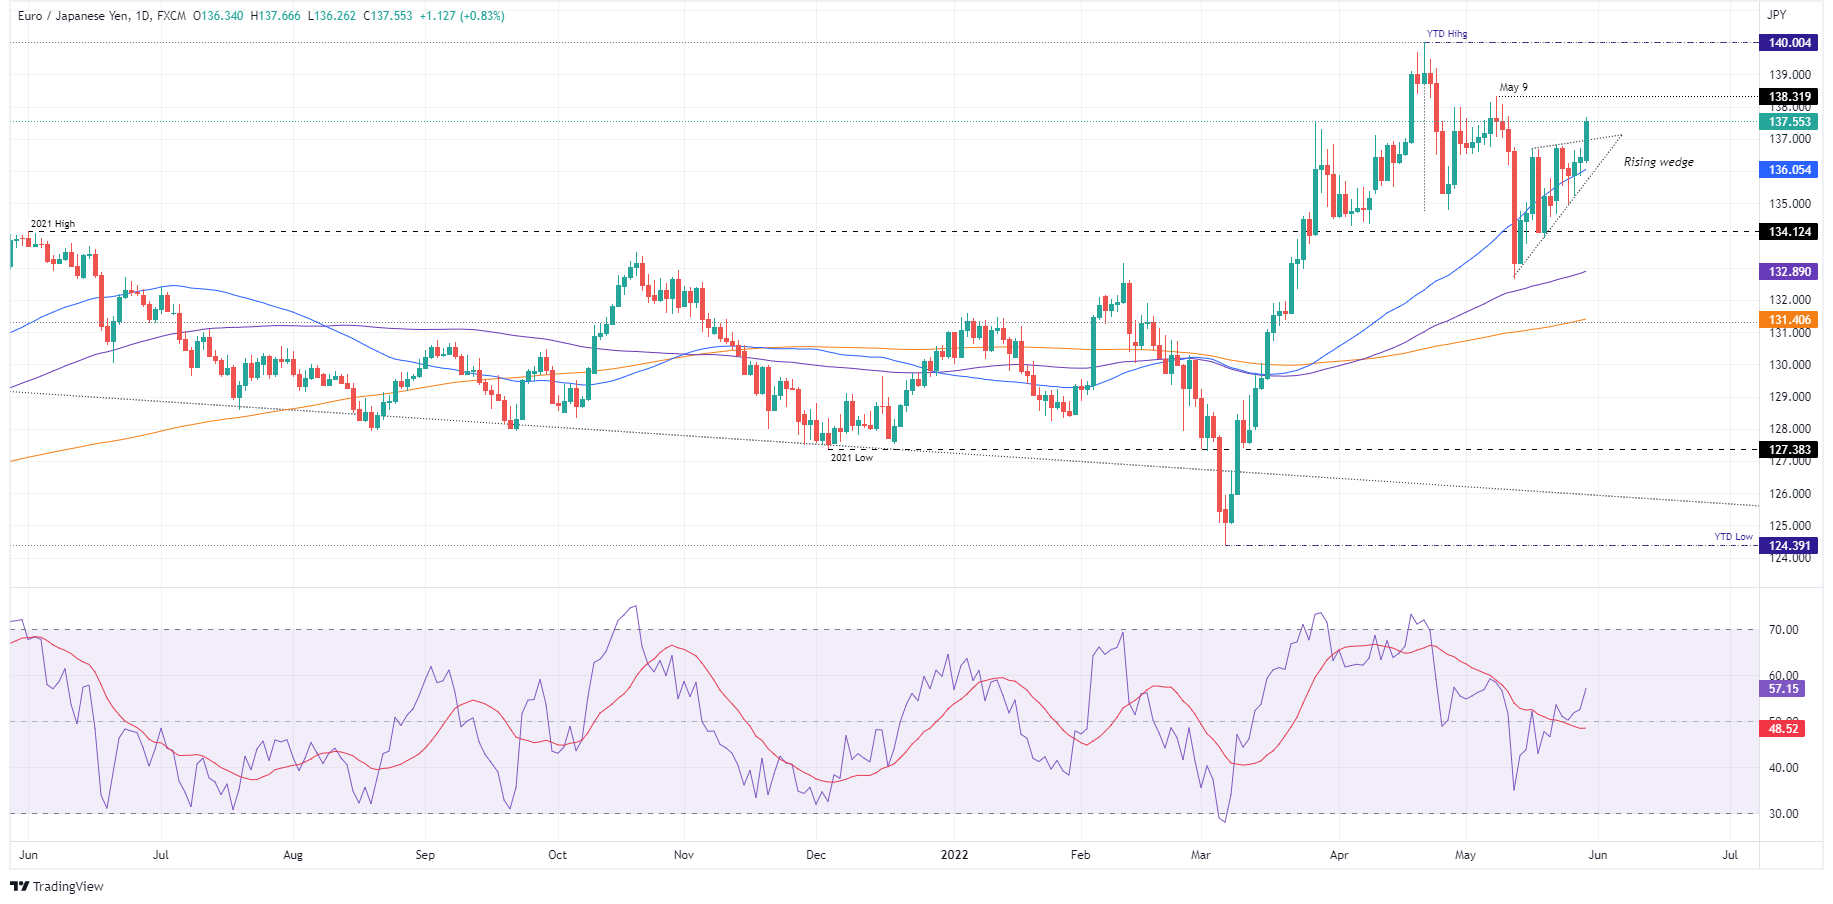
- EUR/JPY bulls regain control and get ready to aim towards 138.00.
- Sentiment has improved as China is about to ease some Covid-19 restrictions in Beijing and Shanghai.
- EUR/JPY Price Analysis: The upside break of the rising wedge and the RSI in bullish territory exerts upward pressure on the cross-currency pair.
The EUR/JPY breaks above the top of a rising wedge, invalidate the chart pattern, and records a three-week high, around the 137.50s area, courtesy of an improved market mood and weaker safe-haven currencies. At 137.55, the EUR/JPY trades near-daily highs in the North American session.
The EUR/JPY lifts on positive mood, expectations of a less aggressive US Fed
Asian and European equities closed in the green. As Wall Street is closed, US stock futures trade in the green. Worries about China’s coronavirus outbreak ease as Beijing and Shanghai get ready to relax some restrictions on Wednesday, aiming to boost the economic activity in the second-largest economy. Alongside the previously-mentioned expectations, some central banks, particularly the US Federal Reserve, might slow the rate hikes as investors scaled back aggressive bets on the Fed’s tightening.
Elsewhere, the EUR/JPY Monday’s price action opened near the daily lows around 136.30s and rallied near 100 pips, breaking on its way north the rising’s wedge top-trendline, around 137.00, as EUR/JPY bulls aim towards 138.00 and beyond.
EUR/JPY Price Analysis: Technical outlook
The EUR/JPY registered an upside break of the rising wedge, exposing the cross-currency for further gains. EUR/JPY bulls regained control, as shown by the daily moving averages (DMAs), sitting beneath the exchange rate, and the Relative Strength Index (RSI), which was aiming lower, when the EUR/USD retraced from the May 9 high at 138.32 towards May 12 low at 132.89, is now in a bullish territory at 57.13.
With that said, the EUR/JPY’s first resistance would be the 138.00 mark. Break above would expose the May 9 high at 138.32. Once cleared, the EUR/JPY following supply zone would be the YTD high at 140.00.
- GBP/USD is attempting to move higher into a bullish area on the daily chart.
- The softness in the US dollar at the start of the week is underpinning the upside bias.
At 1.2655, GBP/USD is 0.18% higher having risen from a low of 1.2616 to score a high of 1.2660 so far on the day. It is a holiday-shortened week and Monday's ranges are narrow making for a slow start to the week for G10 FX.
That being said, risk assets remain in demand as investors continue to cheer the gradual easing of the lockdown in China. Additionally, the pricing of a Fed pause allows interest to return to FX carry trades which is weighing on the greenback and enabling the pound to move higher. USD has dipped in reflection of speculation that the Fed may take a pause in its rate hiking cycle in September.
Last week's £15bn fiscal stimulus provided some support to sterling which is lingering at the start of the week also. Equally, the backbone of a strong UK labour and inflation data has switched the focus of the market back to price pressures from growth concerns. The Bank of England meets this month and there is speculation of a more hawkish reaction from the Old Lady. Nevertheless, ''signs of weakness in the UK April Gross Domestic Product data, due in the middle of June, or a softening in consumer sentiment surveys are likely to undermine the pound,'' analysts at Rabobank said.
''Simultaneously, fears about slowing growth in China and energy security risks in Europe could bolster safe-haven demand for the USD. In an environment in which the Fed and other central banks are removing liquidity, we expect higher levels of volatility in FX market. We see risk that GBP/USD could again re-visit its recent lows in the coming months.''
GBP/USD technical analysis
The price is breaking to the upside and moving in on an area of price imbalance for which mitigation thereof leaves the 1.30 figure vulnerable for the foreseeable future so long as 1.2600 holds on any forthcoming retests.
GBP/USD H1 chart
From a 1-hour perspective, the W-formation is a reversion pattern. The price has already retraced to retest the neckline in a 38.2% Fibonacci correction which has mitigated the price imbalance and therefore puts the ball back into the bull's court. However, a more complete correction over the coming candles could be in order but an interruption in a bullish close at the top of this hour would be reinforcing the upside bias.
- The AUD/USD begins the week on the right foot, gaining some 0.57%.
- An upbeat market mood, a weaker greenback, and expectations of a less aggressive Fed, propelled the major near the 0.7200 mark.
- AUD/USD Price Forecast: Once cleared 0.7200, the major would face a raft of supply zone; otherwise, a fall towards the 20-DMA is on the cards.
The Australian dollar marches firmly in the day, despite a thin liquidity trading session, as the US equities and bond markets remain close in the observation of the Memorial Day and would resume operations on Tuesday. At the time of writing, the AUD/USD is trading at around 0.7196, shy of the 0.7200 mark.
Positive sentiment and a weaker USD lift the AUD/USD
A risk-on mood trading session keeps the greenback on the defensive. China’s positive news regarding the Covid-19 outbreak seems to be controlled as Beijing and Shanghai get ready to ease some restrictions, aiming to propel the Chinese economy, battered by lockdowns that halted factory operations.
Alongside being boosted by market sentiment, the AUD/USD benefitted from a weaker US Dollar. Last week, the Core PCE, the Fed’s favorite gauge of inflation, although it came higher, easied from 5.1% YoY highs to 4.9%. Market players took advantage and lifted high-beta currencies and riskier assets as they began to price in a less “aggressive” approach by the US Federal Reserve.
Earlier in the day, US Federal Reserve Governor Christopher Waller said that he supports 50 bps for “several meetings,” and he’s not taking 50 bps off the table until inflation closes to the 2% target. Waller added that the balance sheet reduction it’s equivalent to a couple of 25 bps rate hikes.
Furthermore, Waller added that inflation is “stubbornly high,” and the Fed would need to be prepared to do more.
Events in the week ahead
The Australian economic calendar would feature S&P Global Manufacturing PMI, the GDP, and the Retail Sales Final.
Regarding the GDP report, analysts at Westpac noted, “We anticipate that the Australian economy will experience a robust expansion in 2022 as it reopens from the delta lockdowns of 2021, with most of the growth concentrated in Q2 & Q3. Output growth for the year is a forecast 4.5%. Growth will be centered on, but not confined to, the consumer, with consumption increasing in the order of 6% over the year – which directly adds 3.3ppts to activity.”
On the US front, the economic docket would unveil the US ISM Manufacturing and Non-Manufacturing PMIs, US employment data, led by the Nonfarm Payrolls, and the ADP and JOLTs openings report.
AUD/USD Price Forecast: Technical outlook
The AUD/USD is neutral-upward biased in the near term, distancing from the 20-day moving average (DMA) at 0.7046 and aiming toward the 0.7200 mark. However, once cleared, the major would face a wall of resistance levels, led by the 100, 50, and 200-DMAs, each at 0.7229, 0.7249, and 0.7257, reséctively.
Upwards, the AUD/USD first resistance would be 0.7200. Once cleared, the following supply zone would be the first of the above-mentioned DMAs. Once all those supply zones are removed, the next resistance would be 0.7300.
On the other hand, the AUD/USD's first support would be May 27 daily low at 0.7089. A breach of the latter would expose May 26 low at 0.7057, followed by the 20-DMA at 0.7046.
- Canadian dollar among top performers during the American session.
- USD/CAD drops below the 200-day Simple Moving Average.
- Canadian Q1 GDP on Tuesday, BOC on Wednesday, and NPF on Friday.
The USD/CAD continued to decline during the American session and printed a fresh one-month low at 1.2649. It is hovering near the lows, holding onto daily losses, about to post the fourth consecutive decline.
The combination of an improvement in market sentiment, higher crude oil prices and a weaker dollar during Memorial Day, pushed USD/CAD further to the downside ahead of the Canadian Q1 GDP reading on Tuesday. The dollar continues to correct lower amid easing expectation about Federal Reserve’s monetary tightening.
The pair fell under the 200-day Simple Moving Average (1.2660) for the first time since April 22. The short-term outlook remains bearish with technical indicators at oversold territory.
GDP, BoC and NFP
On Tuesday, Canada's Q1 GDP is due. Analysts at Wells Fargo expect the report to confirm a solid start for the economy in 2022. “The consensus anticipates Q1 growth of 5.5% quarter-over-quarter annualized, which would be only a modest slowing from the 6.7% pace of growth in Q4, and also stronger than the 3% pace of growth forecast by the Bank of Canada in its latest economic projections. Given sturdy activity trends, and with inflation also moving higher, the Q1 GDP report will almost certainly leave the Bank of Canada on course to raise its policy rate another 50 bps to 1.50% its monetary policy announcement” on Wednesday.
In the US, the key report will be the official employment report on Friday. Market consensus is for an increase in payrolls of 320K and a decline in the unemployment rate from 7% to 6.9%.
Technical levels
- Gold begins the week on a positive tone, up by some 0.20%.
- Holiday in the US to keep prices within a tighter range amid a busy US economic calendar week.
- Fed’s Waller support 50 bps hikes for “several meetings.”
- Gold Price Forecast (XAU/USD): Steady above the 50-DMA, but it needs a break above $1871 to aim towards $1889.91.
Gold spot (XAU/USD) advances during the New York session amid thin liquidity conditions, courtesy of the observation of the Memorial Day in the US, meaning stocks and bonds would not trade until Tuesday. At $1856.05, XAU/USD reflects decent demand for the non-yielding metal at the time of writing.
Sentiment has improved since Monday’s Asian open. China reported the fewest coronavirus cases in almost three months. Shanghai and Beijing are preparing to ease some strict measures, moving to stimulate the economy, which has been hit severely by the Covid-19 zero-tolerance restrictions. Meanwhile, inflation worries are back, as Germany reported high inflationary readings at all-time-highs, at 8.7% YoY, sparking renewed fears of elevated prices and an aggressive approach of the ECB.
In the meantime, the US Dollar Index, a gauge of the greenback’s value vs. a basket of peers, is losing traction and aims towards April’s 21 low at 99.818, down 0.24% in the day. Meanwhile, the US 10-year T-note rate remains parked at Friday’s close of 2.743%.
Of late, Fed’s Governor Christopher Waller crossed wires. He said he supports 50 bps for “several meetings,” and he’s not taking 50 bps off the table until inflation closes to the 2% target. Furthermore, inflation is “stubbornly high,” and the Fed would need to be prepared to do more, Waller said. It’s worth noting that regarding the balance sheet reduction, he noted that it’s equivalent to a couple of 25 bps rate hikes.
An absent US economic docket would keep Gold traders leaning on market sentiment and the economic data revealed in the week ahead. The US economic calendar would feature the US ISM Manufacturing and Non-Manufacturing PMIs, US employment data, led by the Nonfarm Payrolls, and the ADP and JOLTs openings report.
Gold Price Forecast (XAU/USD): Technical outlook
The bright metal has an upward bias, taking advantage of recent US Dollar weakness in the last couple of weeks. Once gold traders reclaimed the 20-day moving average (DMA) last Friday, the XAU/USD fluctuated in the $1840-67 range, unable to break above $1870. Break above the latter would send gold for a re-test of March’s lows at around 1889.91, which also intersects with the bottom Bollinger’s band, followed by $1900.

Key Technical Levels
- Mexican peso accelerates versus the US dollar at the beginning of the week.
- USD/MXN breaks 19.70 and then 19.50, two critical support areas.
- Improvement in risk sentiment boosts demand for emerging market currencies.
The USD/MXN is falling for the fifth consecutive day on Monday. It reached 19.41, the lowest level since March 2020. It is hovering slightly below 19.50, trimming losses.
Global equity markets are rising on Monday, extending last week’s rally. The fact that major Chinese cities began to relax COVID controls over the weekend helped risk sentiment. Commodity and crude oil prices are higher on Monday.
Emerging market currencies are up versus the dollar, also supported by higher interest rates. The best performer on Monday are the Russian ruble (USD/RUB down 6.15%) and the Korean won (USD/KRW falls 1.75%).
Key data ahead
Activity in the US is limited on Monday due to Memorial Day. The key report of the week will be on Friday with the Non-farm payroll report.
In Mexico, the most important event will be Banxico’s quarterly inflation report on Wednesday. “Given recent comments and decisions, we expect the report to tilt hawkish. At the May meeting, it hiked rates 50 bp to 7.0% by a 4-1 vote, with Deputy Governor Espinosa dissenting in favor of a 75 bp hike. However, the minutes showed that two more policymakers were open to a larger move”, explained analysts at Brown Brother Harriman. They point out the next meeting “will be a very close call between 50 and 75 bp and will depend on how the data come in.”
Technical levels
Fed Board of Governors member Christopher Waller said on Monday that he supports lifting interest rates by another 50 bps at the next several Fed meetings and that the policy rate should be above neutral by the end of the year to reduce demand, reported Reuters.
Waller said he is not taking 50 bps rate hikes off of the table until inflation comes down closer to the Fed's 2.0% target and that, if inflation is stubbornly high, he is prepared to do more. Reductions in the size of the Fed's balance sheet are equivalent to a couple of additional 25 bps rate hikes, he noted.
Additional Remarks:
"I am optimistic that the strong US labor market can handle higher rates without a significant increase in unemployment."
"I don't know how soon supply constraints will ease."
Inflation remains alarmingly high.
Longer-run inflation expectations have moved up to a level consistent with underlying inflation a little above 2%.
Core inflation is not coming down enough to the Fed's 2% goal anytime soon.
The economy continues to power along at a healthy pace.
I don't expect the Q1 drop in output to be repeated.
- EUR/USD hit fresh monthly highs in the 1.0770s on Monday as the buck continued to ease.
- Spicey German and Spanish HICP numbers also helped to underpin the euro by shoring up ECB tightening expectations.
- More Eurozone inflation data is out on Tuesday ahead of a busy week of tier one US data releases.
Whilst spicey German and Spanish HICP inflation numbers helping things for the euro, a positive tone to risk appetite and a subsequent continued broad weakening of the US dollar saw EUR/USD push convincingly above its 50-Day Moving Average for the first time since mid-February on Monday. The pair was last trading in the 1.0760s, up about 0.3% on the day in US holiday-thinned trade and at monthly highs.
Indeed, the pair looks set to close the month about 2.2% higher, which would mark its best one-month performance in over a year. EUR/USD’s rebound is even more impressive when viewed in the context of where it started – at rock bottom mid-month lows in the mid-1.0300s. The pair has bounced over 4.0% since May 13, driven by a combination of USD long-position squaring and a closing of the divergence in Fed/ECB policy tightening expectations.
In the past few weeks, US inflation data (both CPI and Core PCE) has added fuel to the idea that US inflation has now peaked, which eases the pressure on the Fed to tighten so aggressively in H2 2022 and 2023. Meanwhile, communication from the ECB has continued to get more hawkish, and in the wake of Monday’s hot inflation data, some are even talking about a hike being brought forward to next week’s meeting.
Focus remains on Eurozone inflation on Tuesday with the preliminary May numbers being released out of France and the Eurozone as a whole. Then there is a barrage of tier one US data scheduled for the rest of the week, culminating in the official May labour market report on Friday.
If the wage growth component of the labour market report shows signs of easing, this could further contribute to the peak inflation narrative and underpin further upside in EUR/USD. But the pair has run into an important area of resistance, with the March low around 1.0800 notable.
The eurozone will release its May Harmonised Index of Consumer Prices (HICP) report on Tuesday, May 31 at 09:00 GMT and as we get closer to the release time, here are the expectations forecast by the economists and researchers of four major banks regarding the upcoming EU inflation print.
Expectations are for HICP to rise further to 7.7% YoY in April (prev. 7.4%), with the core metric (ex-food and energy) seen rising to 3.5% YoY.
Commerzbank
“The rate is likely to have jumped from 7.4% to 8.0% in May. The decline in energy prices in April did not continue. More had to be paid again for all types of energy in May. The YoY rate of change is likely to have risen from 37.5% to 39%. This alone increases the inflation rate in May by 0.15 percentage points. The inflation rate excluding energy, food, alcohol and tobacco is likely to have risen further from 3.5% in April to 3.8% in May. The jump in food prices is even greater. Here, the YoY rate is likely to have climbed from 6.3% to 7.3%, which in itself pushes up the inflation rate by 0.2 percentage points.”
SocGen
“We expect euro area HICP to have increased by 0.5 pp to 7.9% YoY in May, with core inflation remaining at 3.5% YoY.”
Wells Fargo
“For May, headline inflation is expected to quicken further to a new record high of 7.7% year-over-year. Meanwhile, core CPI inflation is expected to remain steady at 3.5% YoY. We believe these inflation trends will leave the European Central Bank on course to begin raising interest rates at the July announcement, and we anticipate a 25 bps increase in the Deposit Rate to -0.25% at that meeting.”
TDS
“Euro area headline HICP inflation will likely reach new serie high in May (7.8%), with a rebound in fuel prices and continued acceleration in food inflation likely being the main drivers. However, we look for EZ core inflation to soften 0.1ppts to 3.4% YoY due to weakness in the non-energy industrial goods component.”
- USD/TRY fades Friday’s downtick and retests 16.40.
- Turkey 10y bond yields hover around 23.00%.
- Markets’ attention shifts to the CPI release on Friday.
The Turkish currency gives away part of Friday’s gains and pushes USD/TRY to the upper end of the range around 16.40 on Monday.
USD/TRY now looks to CPI
USD/TRY resumes the upside and leaves the May’s rally well on track to challenge the so far 2022 highs near 16.50 recorded on May 26. It is worth recalling that the pair closed with losses in just four sessions since the beginning of the month and the lira has so far shed nearly 24% in that same period.
The lira, in the meantime, remains well under pressure on the back of the deteriorated geopolitical background, elevated energy prices and high domestic inflation. On the latter, investors are expected to shift their attention to the publication of inflation figures for the month of May due later in the week.
What to look for around TRY
Despite Friday’s daily pullback, USD/TRY keeps the underlying upside bias well and sound and looks to consolidate the recent surpass of the 16.00 yardstick for the first time since late December 2021.
So far, price action in the Turkish currency is expected to gyrate around the performance of energy prices, the broad risk appetite trends, the Fed’s rate path and the developments from the war in Ukraine.
Extra risks facing TRY also come from the domestic backyard, as inflation gives no signs of abating, real interest rates remain entrenched in negative figures and the political pressure to keep the CBRT biased towards low interest rates remain omnipresent.
Key events in Turkey this week: Q1 GDP, Trade Balance (Tuesday) – Manufacturing PMI (Wednesday) – Inflation Rate, Producer Prices (Friday).
Eminent issues on the back boiler: FX intervention by the CBRT. Progress (or lack of it) of the government’s new scheme oriented to support the lira via protected time deposits. Constant government pressure on the CBRT vs. bank’s credibility/independence. Bouts of geopolitical concerns. Structural reforms. Upcoming Presidential/Parliamentary elections.
USD/TRY key levels
So far, the pair is gaining 1.33% at 16.3837 and faces the next up barrier at 16.4554 (2022 high May 26) seconded by 18.2582 (all-time high December 20) and then 19.00 (round level). On the flip side, a breach of 14.6836 (monthly low May 4) would expose 14.5458 (monthly low April 12) and finally 14.5136 (weekly low March 29).
- Gold traded with upside on Monday as the US dollar continued to fade despite holiday-thinned trading conditions.
- XAU/USD was last changing hands near $1860 and eyeing recent highs having found decent support at its 21 and 200DMAs.
- Should market participants continue to pare Fed tightening bets, gold could reclaim $1900, even if risk appetite also rebounds.
Spot gold (XAU/USD) prices are trading with an upside bias in quiet, US holiday-thinned trade and eyeing a test of last week’s highs around $1870 per troy ounce. At current levels around $1860, XAU/USD is about 0.4% higher, having found support earlier in the session at the 21-Day Moving Average (at $1849.25) and amid continued technical buying after spot prices found solid support at the 200DMA (at $1840) last week.
Gold’s advances on Monday come despite a positive tone to global macro trade and are being driven by a continued weakening to fresh monthly lows in the US dollar. In wake of US Consumer Price Inflation data released earlier in the month and Core PCE inflation data released last week, market participants have become less worried about inflation in the US and, as a result, Fed tightening bets have seen a modest pullback (i.e. for H2 2022 and 2023).
US bond markets are closed on Monday, but price action in gold and USD markets suggests that yields will probably open the week lower, a continuation of the weakening trend that has, in tandem with the recent weakening of the US dollar, boosted XAU/USD by over 4.0% from sub-$1790 mid-month lows. US data will be in focus this week with various tier one releases including the May ISM Manufacturing PMI survey and official May labour market report all out later in the week.
Analysts argued that should the trends of easing US inflation fears, easing Fed tightening bets and subsequently, more downside in US yields and the buck continue, that could be a bullish medium-term driver for gold, even if it also boosts risk appetite (i.e. US equities). With XAU/USD having found such strong support at its 21 and 200DMAs, the outlook for further upside towards the 50DMA near $1900 looks good.
- The risk-on mood undermined the safe-haven JPY and assisted USD/JPY to gain positive traction.
- The upside seems limited amid the prevalent USD selling bias, warranting some caution for bulls.
- The Fed’s expected rate hike path and the recent slump in the US bond yields weighed on the USD.
The USD/JPY pair gained some positive traction on Monday and broke out of a multi-day-old trading range amid the risk-on mood, which tends to undermine the safe-haven Japanese yen. The intraday buying interest picked up pace during the early North American session and lifted spot prices to a four-day high, around the 127.80-127.85 region.
Investors turned optimistic amid hopes that the easing of COVID-19 lockdowns in China could boost the global economy, which was evident from a generally positive tone around the equity markets. Apart from this, a big divergence in the monetary policy stance adopted by the Fed and the Bank of Japan weighed on the JPY and lifted the USD/JPY pair.
That said, the prevalent US dollar selling bias might hold back traders from placing aggressive bullish bets and keep a lid on any further gains for the USD/JPY pair. Traders continue to cut their long US dollar positions amid speculations that the Fed Fed could pause the rate hike cycle after two 50 bps hikes each in June and July.
The prospects for an eventual slowdown of the Fed's policy tightening was evident from the recent slump in the US Treasury bond yields to a multi-week high. This might act as a headwind for the greenback and cap any meaningful upside for the USD/JPY pair amid relatively lighter trading volumes on the back of the Memorial Day holiday in the US.
Investors might also prefer to wait on the sidelines ahead of important US macro releases scheduled at the beginning of a new month, including the closely watched US monthly jobs report (NFP) on Friday. Hence, it will be prudent to wait for strong follow-through buying before confirming that the USD/JPY pair has formed a strong near-term base.
Technical levels to watch
- EUR/USD pushes higher and reaches new May tops at 1.0780.
- Next on the upside comes the 3-month resistance line near 1.0800.
EUR/USD keeps the upside well and sound and prints new monthly highs around 1.0780 on Monday.
Considering the ongoing pair’s performance, the continuation of the rebound looks likely in the very near term at least. That said, the next up barrier now appears at the 3-month resistance line near 1.0800.
The breakout of this area should mitigate the selling pressure and allow for a probable move to the weekly high at 1.0936 (April 21).
EUR/USD daily chart
Hungarian Prime Minister Viktor Orban on Monday said that things are not looking good with respect to the EU's proposed ban on Russian oil imports, reported Reuters. The exemption of oil pipeline shipments would be a good solution, he stated, adding that Hungary also needs some guarantees in case of any potential halt to Russian oil shipments by pipeline. 4
There is no compromise at the moment at all, Orban said, adding that "we" are in a difficult situation given the "irresponsible behaviour of the (European) Commission". The Hungarian position remains that solutions are needed before sanctions, Orban added, noting that now is the time to come up with the solution.
Orban's remarks come after European Commission President Ursula von der Leyen earlier said that EU 27 nations are not yet there an agreement on a new Russia sanctions package. All issues regarding the sanctions have been solved except the issue of crude oil via pipelines, she added.
- NZD/USD came within a whisker of monthly highs in the mid-0.6500s in US holiday-thinned trade.
- USD long position squaring has continued to weigh on the buck, as NZD/USD traders brace for a busy data week.
NZD/USD came within a whisker of printing fresh highs for the month as recent downside in the US dollar extended on Monday, reaching into the upper 0.6550s before backing off to current levels in the 0.6530s. That means the pair is back to trading roughly flat on the day, which isn’t too surprising given a lack of trading volumes amid US market closures for the Memorial Day public holiday. Comments from the chief economist at the RBNZ on Monday, who cautioned that the bank’s recently unveiled hawkish rate guidance could be tempered if the economy underperforms expectations, were largely ignored.
Data released by the US Commodity Futures & Exchange Commission last Friday revealed that in the week ending last Tuesday, investors had continued to pare back on USD long positions and recent price action suggests this trend has continued, to the benefit of NZD/USD. The pair is now trading an impressive more than 5.0% above mid-month lows in the low 0.6200 area, with some traders citing an easing of expectations for Fed tightening in the latter part of 2022 and 2023 as inflation data increasingly shows signs of moderation (such as last week’s Core PCE numbers).
The rest of the week is set to be a busy one for NZD/USD traders given a barrage of upcoming tier one US data releases. May Conference Board Consumer Confidence survey data is out on Tuesday, May ISM Manufacturing PMI survey data and April JOLTs Job Openings data is out on Wednesday, May ADP Private Employment Change data is out on Thursday, while the official May labor market report is out on Friday.
NZD/USD is testing the price high at 0.6556/68. As analysts at Credit Suisse note, this area has to hold to avoid a lengthier reversion back higher.
Break below 0.6421/15, then 0.6310/6288 to shift risk back lower again
“With the daily and weekly MACD still negative and with the moving averages still falling, we retain our bearish view and look for a turn back lower again, with immediate support now seen at 0.6522/21.”
“A break below 0.6421/15 and then below 0.6310/6288 is needed to shift the short-term risk back lower again and pave the way for a move to the YTD low and major retracement support at 0.6231/13.”
“A sustained break above 0.6556/68 would signal another lengthy reversion within the 2021/22 downtrend, similar to the July/Oct 2021 and Jan/April 2022 recoveries, with next key resistance seen at the 55-day moving average at 0.6656/93. However, this is not our base case.”
USD/CHF has reached major support at 0.9576/44. Economists at Credit Suisse look for the market to turn back higher from here, ahead of the development of a broader range.
0.9472/60 expected to hold additional weakness
“Our view remains that the USD/CHF should see some stabilization around the 0.9576/44 area, setting it to trade in a ~9500 to parity range. We look for an eventual turn back higher toward the top of the highlighted range and see resistance at 0.9633/45 initially.”
“A close above the price high at 0.9766 is needed to relieve the immediate weakness and to confirm our view of a swing higher within our anticipated range, although we think that it is unlikely that market will break the YTD high at 1.0061/64.”
“Should weakness extend below 0.9517, we would look for the breakout point to the April/May surge at 0.9472/60 to serve as a floor to maintain our base case of broader trading range.”
EUR/GBP stays trapped below key resistance at 0.8616/21. Nevertheless, trend-following indicators are turning higher and analysts at Credit Suisse stay firmly bullish.
Support at 0.8393 set to hold
“EUR/GBP maintains a large ‘diamond bottom’ base and whilst weekly MACD did not confirm a positive cross last week, this remains very close, with medium-term moving averages also close to a bullish cross higher.”
“Our bias remains for an eventual closing break above 0.8618/21, with next resistance at 0.8654/59 and beyond.”
“First support is seen at 0.8434/32, then the 55-day average just below 0.8416/0.8393, with fresh buyers expected here if reached.”
- A combination of factors dragged USD/CAD to over a one-month-low on Monday.
- Bullish oil prices underpinned the loonie and exerted pressure amid a weaker USD.
- The Fed’s expected rate hike path, the risk-on mood weighed heavily on the buck.
The USD/CAD pair witnessed heavy selling for the third successive day on Monday and continued losing ground through the mid-European session. The downward trajectory dragged spot prices to the 1.2675 region, or its lowest level since April 22 and was sponsored by a combination of factors.
Expectations of demand recovery in China, along with global supply concerns amid the impending European Union embargo on Russian oil imports pushed the black liquid to over a two-month high. This, in turn, underpinned the commodity-linked loonie and dragged the USD/CAD pair lower for the third successive day amid sustained US dollar selling bias.
Expectations that the Fed Fed could pause the rate hike cycle after two 50 bps hikes each in June and July forced traders to continue cutting their long US dollar positions. The prospects for an eventual slowdown of the Fed's policy tightening was evident from the recent slump in the US Treasury bond yields to a multi-week high, which weighed on the buck.
Apart from this, the prevalent risk-on environment further dented demand for the safe-haven greenback and exerted additional downward pressure on the USD/CAD pair. Investors turned optimistic amid hopes that the easing of COVID-19 lockdowns in China could boost the global economy, which was evident from a generally positive tone around the equity markets.
With the latest leg down, the USD/CAD pair broke through the 1.2700 confluence support comprising 100-day SMA and the 61.8% Fibonacci retracement level of the 1.2459-1.3077 strong move up. The subsequent slide could be seen as a fresh trigger for bearish traders and supports prospects for an extension of the recent pullback from the YTD peak touched earlier this month.
That said, relatively lighter trading volumes on the back of the Memorial Day holiday in the US warrant some caution before placing aggressive bearish bets. Hence, any further downfall is more likely to find decent support near a technically significant 200-day SMA, currently around the 1.2660-1.2655 region, which should now act as a pivotal point.
Technical levels to watch
EUR/USD has reached the resistance zone at 1.0770/0835. Analysts at Credit Suisse look for a turn back lower from here, for a move to 1.0608/0599 initially, then 1.0350/41 and eventually beyond.
Resistance at 1.0835 expected to cap
“EUR/USD is still capped at 1.0770/0835. With five different resistances in this zone, we expect this area to act as a very tough barrier and we look for the medium-term downtrend to reassert itself from here.”
“Support stays at 1.0642, below which would now confirm a very small intraday ‘wedge top’ to confirm that the risks have turned lower again, with next support at 1.0608/0599, with scope then for a retest of 1.0350/41. Ultimately, we look for an eventual fall to parity/0.99, with the market still in a clear medium-term downtrend.”
“Above 1.0835 is not our base case, however, it would trigger a deeper-than-expected recovery, with the next level at 1.0923/37.”
Canada's Current Account for Q1 rose to C$5.0B from -C$0.1B in Q4 2021, bigger than the expected jump to C$3.2B, data released by Statistics Canada on Monday revealed. Positive moves in global commodity markets helped boost Canadian exports last quarter, and will likely do the same in Q2.
AUD/USD continues to recover. Nonetheless, analysts at Credit Suisse still anticipate that resistance at 0.7258/67 will cap the advance.
Bearish whilst below 0.7258/67
“We remain with our view that the recent recovery is corrective, with a major resistance zone at 0.7258/67 still set to cap the market.”
“We look for an eventual turn back lower again, with support seen at 0.7088/70 initially and further below at 0.6956/48, a break below which is needed to shift the short-term risk lower again and open the door to retest the YTD low at 0.6827, ahead of our medium-term objective at 0.6758.”
“Should the level at 0.7258/67 break, this would neutralize our bearish medium-term view and confirm a mean-reversion back in the broader range. However, this is not our base case.”
- AUD/USD gained follow-through traction on Monday and climbed to a fresh multi-week top.
- Sustained move beyond the 0.7145 confluence hurdle supports prospects for further gains.
- Weakness below the 0.7100 mark could be seen as a buying opportunity and remain limited.
The AUD/USD pair prolonged its strong recovery momentum from the YTD low and kicked off the new week on a positive note amid the prevalent US dollar selling. Expectations that the Fed could pause the current rate hike cycle later this year dragged the USD Index to a fresh monthly low.
Apart from this, the ongoing risk-on rally across the global equity markets further undermined the safe-haven buck. This, along with the Reserve Bank of Australia's hawkish signal that a bigger interest rate hike is still possible in June, offered additional support to the risk-sensitive aussie.
The combination of factors assisted the AUD/USD pair to capitalize on Friday's move beyond the 0.7145 confluence hurdle. The said barrier comprised the 200-period SMA on the 4-hour chart and the 38.2% Fibonacci retracement level of the 0.7662-0.6829 fall, which should now act as a pivotal point.
Looking at the broader picture, the recent appreciating move witnessed over the past two and half weeks or so has been along an upward sloping channel. This points to a well-established short-term bullish trend and should allow the AUD/USD pair to climb further beyond the 0.7200 round figure.
The subsequent strength, however, is likely to confront resistance near the 100-day SMA, around the 0.7235-0.7245 region. The said barrier coincides with the 50% Fibo. level and is followed by the 200-day SMA, near the 0.7260 zone, which if cleared would be seen as a fresh trigger for bulls.
On the flip side, the 0.7145 confluence resistance breakpoint now seems to protect the immediate downside ahead of the 0.7100 mark. Any further decline might still be seen as a buying opportunity and remain limited near the 23.6% Fibo. level support, near the 0.7025-0.7020 region.
Some follow-through selling, leading to a subsequent break through the 0.7000 psychological mark, will shift the bias in favour of bearish traders. The AUD/USD pair could then fall to the 0.6940 area en-route the 0.6900 mark and the 0.6830-0.6825 region, or the YTD low touched earlier this month.
AUD/USD 4-hour chart
-637895091387266217.png)
Key levels to watch
Leaders of EU 27 nations aim to reach a political agreement on an oil ban on Monday, an EU official said according to Bloomberg. The official added that there is agreement on the two phases of implementation of the import ban, but that implementation dates remain under discussion.
The more optimistic (on the chances of a deal being reached) remarks from an EU official comes after more pessimistic remarks from the Estonian PM, who said that it is not realistic to expect an agreement on a sixth package of sanctions against Russia today.
Economist at UOB Group Ho Woei Chen, CFA, reviews the latest interest rate decision by the BoK.
Key Takeaways
“Bank of Korea (BOK) raised its benchmark base rate by 25 bps to 1.75% at its scheduled meeting today (26 May). All analysts polled by Bloomberg including UOB had expected the hike.”
“The key takeaway from the revisions to the growth and inflation forecasts as well as comments from BOK is that inflation is a much bigger concern than growth risks in the near-term. Governor Rhee was explicit on the need to tighten monetary policy further and to get real interest rates to a neutral level.”
“Given the persistent upside risks to inflation, we are raising our call for BOK’s tightening as we now expect the central bank to hike by 25 bps at each of the three subsequent meetings in Jul, Aug and Oct before stopping at its last meeting this year in Nov. This will bring the benchmark rate to 2.50% by end-2022 (vs. our previous forecast of 2.00%). We believe the BOK will stay on hold thereafter as inflation starts to moderate.”
- DXY remains under pressure well below 102.00.
- Immediately to the downside comes the 55-day SMA.
The index accelerates losses and clinches new multi-week lows in the 101.30 region on Monday.
DXY remains under pressure and extra losses should not be ruled out for the time being. That said, further decline is expected to target the temporary 55-day SMA, today at 101.10, ahead of the 3-month line around 100.60.
Looking at the longer run, the outlook for the dollar is seen constructive while above the 200-day SMA at 96.80.
DXY daily chart
Dollar Index Spot
- GBP/USD is consolidating in fairly quiet trade close to one-month highs in the mid-1.2600s.
- Volumes this week are set to be dampened by US (Monday) and UK (Thursday & Friday) public holidays.
- But a barrage of upcoming US data means the prospect for volatility remains elevated.
Trading conditions are quiet on Monday amid a lack of US market participants given market closures there for the Memorial Day public holiday. GBP/USD is nonetheless trading close to the one-month highs it printed last Friday in the 1.2670 area at just below 1.2650 amid an upbeat tone to risk appetite at the start of the week. The pair is on course to have rallied around 4.0% from mid-month lows in the mid-1.2100s, a move which analysts are mostly putting down to the weakening of the US dollar, which has continued this Monday.
That means the pair is on course to post a monthly gain of about 0.6%, it's first monthly gain of the year. Still, analysts remain cautious on the prospects for a more meaningful rebound in the pair given the divergence between the outlooks for the US and UK economies and associated divergence between the outlook for Fed and BoE policy. Both remain in the US dollar’s favour, analysts argue, suggesting that a return to recent lows is perhaps more likely that a move back above the 1.30 mark.
Indeed, data released by the US Commodity Futures Trading Commission (CFTC) last Friday showed that, as of last Tuesday, investors continued to add to net sterling short positions, despite the rebound from mid-month lows. That suggests a continued appetite to sell the rally.
GBP/USD trading volumes are expected to pick up on Tuesday with the return of US market participants, but will likely then die down again from Thursday into the end of the week, given the closure of UK markets for a long public holiday weekend for the British Queen’s Platinum Jubilee celebration. That doesn’t mean there won’t be volatility. Indeed, traders are bracing for a barrage of US data set to be released this week.
May Conference Board Consumer Confidence survey data is out on Tuesday, May ISM Manufacturing PMI survey data and April JOLTs Job Openings data is out on Wednesday, May ADP Private Employment Change data is out on Thursday, while the official May labor market report is out on Friday. After its prolonged recent decline, USD bulls may be looking for an opportunity to reload on long positions
.
Sellers could push USD/IDR below the 14,500 region in the near term, suggested FX Strategist Quek Ser Leang at UOB Group’s Global Economics & Markets Research.
Key Quotes
“Our expectations for USD/IDR to ‘trade sideways’ last week were incorrect as it took out the rising trend-line support and plummeted last Friday. USD/IDR extended its decline today and USD/IDR is likely to break the major support near 14,500.”
“For this week, the next support at 14,448 is unlikely to come into the picture.”
- EUR/JPY adds to recent gains and trespasses the 137.00 hurdle.
- While above the 2-month support line, further gains are likely.
EUR/JPY extends the march north for the third session in a row beyond the 137.00 barrier at the beginning of the week.
The cross surpassed the 136.80 region and in doing so it opened the door to extra gains to, initially, the May high at 138.31 (May 9) prior to the 2022 high at 140.00 (April 21).
In the meantime, while above the 2-month support line around 134.65, the short-term outlook for the cross should remain bullish.
EUR/JPY daily chart
Estonian Prime Minister Kaja Kallas said on Monday that it is not realistic to expect an agreement on a sixth package of sanctions against Russia today, reported Reuters.
The EU has been struggling to agree on a sixth package that would largely target Russian oil imports amid opposition from land-locked EU countries such as Hungary, who have been pushing for pipeline-delivered crude to be exempt from any ban.
EU leaders are currently convening at a meeting of the EU Council Summit, which is set to last until Tuesday. The hope had been that, but by the end of the summit, a deal on a Russian oil import embargo could be reached.
- Headline German HICP showed prices rising 8.7% YoY, well above the 8.0% expected.
- The euro didn't react, even though the data will make ECB policymakers even more uncomfortable.
The preliminary estimate of annual inflation in Germany according to the Harmonised Index of Consumer Prices (HICP) rose to 8.7% in May, data released by Statistisches Bundesamt Deutschland revealed on Monday. That was above the expected rise to 8.0% from 7.8% in April. MoM, prices rose 1.1%, the HICP revealed, well above the expected drop to 0.5% from 0.7% in April. The HICP is the ECB's preferred gauge of Eurozone price pressures.
The alternate Consumer Price Index (CPI) showed prices in Germany rising at a YoY pace of 7.9% in May, up from 7.4% a month earlier and above the expected rise to 7.6%. MoM, prices were up 0.9%, well above the expected drop to 0.5% from a 0.8% increase in April.
Market Reaction
Regional inflation figures released by various German states earlier in the day suggested the likelihood of an upside surprise and so the euro has not reacted to the latest data. Nonetheless, the latest figures will not sit comfortably with the ECB, and may strengthen the argument for a 50 bps rate hike in July.
In the view of FX Strategist Quek Ser Leang at UOB Group’s Global Economics & Markets Research, USD/MYR could slip back to the 4.3400 region.
Key Quotes
“When USD/MYR was trading at 4.3860 last Monday (09 May), we highlighted that ‘upward momentum has waned further and USD/MYR is unlikely to strengthen’ and we expected USD/MYR to ‘trade sideways between 4.3670 and 4.4010’. USD/MYR subsequently traded between 4.3770 and 4.3990.”
“USD/MYR opened on a week note today and at the time of writing, it has edged slightly below the 4.3670 support. The price actions suggest that USD/MYR is likely to trade with a downward bias this week. Support is at 4.3550 followed by 4.3400. The major support at 4.3330 is not expected to come into the picture. On the upside, a break of 4.3870 (minor resistance is at 4.3800) would indicate that the current downward pressure has eased.”
- The risk-on mood undermined the safe-haven JPY and extended support to USD/JPY on Monday.
- The prevalent selling bias around the USD held back bulls from placing fresh bets and capped gains.
- Expectations that the Fed would pause the rate hike cycle later this year weighed on the greenback.
The USD/JPY pair gained some positive traction on Monday and held on to its modest intraday gains through the first half of the European session. The pair was last seen trading around the 127.25-127.30 area, up 0.15% for the day.
Investors turned optimistic amid hopes that the easing of COVID-19 restrictions in China would boost the global economy, which was evident from the ongoing risk-on rally in the equity markets. This, in turn, undermined demand for the safe-haven Japanese yen and acted as a tailwind for the USD/JPY pair, though the prevalent US dollar selling bias kept a lid on any meaningful gains.
The markets now expect that the Fed could pause the rate hike cycle after two 50 bps hikes each in June and July. The bets were reaffirmed by Friday's release of the US Personal Consumption Expenditure (PCE) data for April, which suggested that inflationary pressures in the US could be easing. This was seen as a key factor behind the recent slump in the US Treasury bond yields to a multi-week low.
Hence, it will be prudent to wait for strong follow-through buying before positioning for any further upside amid relatively lighter trading volumes on the back of the Memorial Day holiday in the US. Investors might also prefer to wait on the sidelines ahead of this week's important US macro releases scheduled at the beginning of a new month, including the closely watched NFP report on Friday.
In the meantime, the broader market risk sentiment might continue to play a key role in driving haven flows and influencing the JPY. Traders will further take cues from the USD price dynamics to grab short-term opportunities around the USD/JPY pair.
Technical levels to watch
FX Strategist Quek Ser Leang at UOB Group’s Global Economics & Markets Research suggested USD/THB could attempt a move to 33.81 once 34.00 is cleared.
Key Quotes
“Last Monday (23 May, spot at 34.31), we highlighted that ‘risk for USD/THB is still on the downside but the solid support at 34.00 may not yield so easily’. Our view was not wrong as USD/THB dropped to 34.07, rebounded before easing off. At the time of writing, USD/THB is trading at 34.05, not far above 34.00.”
“Shorter-term downward momentum has improved and a break of 34.00 would not be surprising and could potentially trigger a rapid decline to 33.81. Overall, only a breach of 34.26 would indicate that the current downward pressure in USD/THB has eased.”
UK Public Inflation Expectations For 12 Months Ahead 6.1% vs. 6% previous, according to a survey conducted by Citi/YouGov.
Meanwhile, the poll suggested that the inflation expectations for 5-10 year ahead are seen at 4.2% vs. 4.2% prior.
Citi economist Benjamin Nabarro said, “data, especially the level of long-term expectations, still suggest a heightened risk that expectations could become de-anchored.”
“We see little in today's data that should provide a further impetus for an outsized 50bp move by the BOE,” Nabarro added.
Market reaction
GBP/USD is moving back and forth in a narrow range below 1.2650, at the mercy of the USD price action. The pair is trading at 1.2635, up 0.17% so far, at the press time.
- EUR/USD pokes the 55-day SMA around 1.0770.
- The greenback extends the bearish note on Monday.
- Flash German CPI next of note in the docket.
The optimism around the European currency remains well and sound and now lifts EUR/USD to fresh highs in the boundaries of 1.0770 on Monday.
EUR/USD focuses on 1.0800
EUR/USD therefore advances for the third session in a row and extends the 4-cent rebound to the vicinity of the interim hurdle at the 55-day SMA, slowly approaching the 3-month resistance line in the 1.0800 neighbourhood.
As usual in past sessions, the persistent weakness surrounding the greenback has been behind the pair’s renewed and strong upside, helped at the same time by the shift to a more hawkish tone from ECB’s policymakers.
In the domestic calendar, EMU’s final figures saw the European Commission’s Consumer Confidence ease a tad to -21.1 in May while the Economic Sentiment improved slightly to 105 in the same month. Later in the session, all the attention will be on the release of the advanced inflation figures in Germany for the month of May.
There are no data releases across the pond, as US markets are closed due to the Memorial Day holiday.
What to look for around EUR
EUR/USD’s bounce off 2022 lows near 1.0350 (May 13) has been so far underpinned by unusual hawkish ECB-speak leaning towards an initial rate hike as soon as in July, while the consensus view that the bond-purchase programme should end at some point in early Q3 has also lent legs to the European currency.
In addition, the renewed selling bias in the greenback has also collaborated with the multi-cent upside in the pair, as investors appear to have already pencilled in a couple of 50 bps rate hikes at the June and July gatherings.
However, EUR/USD is still far away from exiting the woods and it is expected to remain at the mercy of dollar dynamics, geopolitical concerns and the Fed-ECB divergence, while higher German yields, elevated inflation and a decent pace of the economic recovery in the euro bloc are also supportive of an improvement in the mood around the euro.
Key events in the euro area this week: EMU Final EC Consumer Confidence, Economic Sentiment, Germany Flash Inflation (Monday) – Germany Unemployment Change, Unemployment Rate, EMU Flash Inflation Rate (Tuesday) – Germany Retail Sales, Final Manufacturing PMI, EMU Final Manufacturing PMI, ECB Lagarde (Wednesday) – Germany Balance of Trade, Final Services PMI, EMU Retail Sales, Final Services PMI (Friday).
Eminent issues on the back boiler: Speculation of the start of the hiking cycle by the ECB as soon as this summer. Asymmetric economic recovery post-pandemic in the euro area. Impact of the war in Ukraine on the region’s growth prospects.
EUR/USD levels to watch
So far, spot is gaining 0.29% at 1.0766 and faces the immediate hurdle at 1.0800 (round level) followed by 1.0936 (weekly high April 21) and finally 1.0987 (100-day SMA). On the other hand, a breach of 1.0641 (low May 25) would target 1.0532 (low May 20) en route to 1.0348 (2022 low May 13).
- Gold Price is supported above $1,850 amid holiday-thinned trading.
- US dollar remains on the defensive amid a risk-on market mood.
- XAUUSD is struggling amid a bunch of healthy resistance and support levels.
Gold Price is giving a part of its early gains but appears supported amid holiday-thinned market conditions. The US dollar is seeing a dip-buying demand, despite the risk-on trading on global stocks. Investors continue assessing the China covid easing optimism and subsiding aggressive Fed’s tightening bets against signs of slowing in the US economy. Therefore, gold price is seen fluctuating between gains and losses while defending the $1,850 barrier. The EU Summit on Ukraine crisis is closely followed, as Russia’s oil embargo is likely to be part of EU sanctions package. These developments could affect the broader market sentiment, significantly impacting the dollar and XAUUSD price.
Also read: Gold Price Forecast: XAUUSD buyers seize control in the NFP week, $1,870 in sight
Gold Price: Key levels to watch
The Technical Confluences Detector shows that the Gold Price is battling strong resistance at $1,860, which is the meeting point of the Fibonacci 23.6% one-day and Fibonacci 38.2% one-week.
The previous high four-hour and the Fibonacci 23.6% one-week at $1,864 will be tested next by gold buyers.
A sustained move above the latter will see a fresh advance towards the previous week’s high of $1,870. At that point, the pivot point one-week R1 and pivot point one-day R2 align.
The previous month’s low of $1,872 will be the level to beat for XAU bulls.
Alternatively, a firm break below the SMA5 one-day at $1,855 will put the Fibonacci 61.8% one-week at $1,852 to test.
The next critical support zone is seen at around $1,848, which is the confluence of the previous day’s low, pivot point one-month S1 and SMA50 four-hour.
The line in the sand for gold bulls is seen at $1,840, the intersection of the pivot point one-day S2, SMA200 one-day and the previous week’s low.
Here is how it looks on the tool
About Technical Confluences Detector
The TCD (Technical Confluences Detector) is a tool to locate and point out those price levels where there is a congestion of indicators, moving averages, Fibonacci levels, Pivot Points, etc. If you are a short-term trader, you will find entry points for counter-trend strategies and hunt a few points at a time. If you are a medium-to-long-term trader, this tool will allow you to know in advance the price levels where a medium-to-long-term trend may stop and rest, where to unwind positions, or where to increase your position size.
Eurozone's Final Consumer Confidence Index arrives at -21.1 in May vs. -22.0 recorded previously, according to the latest data release from the European Commission. The data matched the consensus forecast of 21.1.
The Business Climate Index slipped to 1.26 in May vs. 1.59 booked in April.
Meanwhile, the bloc’s Economic Sentiment Indicator for May rose to 105.0 vs. 104.9 expected and previous.
Market reaction
EUR/USD is picking up bids, as the US dollar sees a fresh leg lower in the European session. The spot is trading at 1.00763, up 0.35% on the day.
USD/CNH is still seen within the 6.5000-6.8000 range in the next weeks, commented FX Strategists at UOB Group Lee Sue Ann and Quek Ser Leang.
Key Quotes
24-hour view: “USD soared to a high of 6.7849 last before dropping sharply to end the day lower by 0.69% (6.7220). The rapid loss in upward momentum suggests that 6.7879 is a short-term top. In other words, the risk is not on the upside. Overall, USD is likely to consolidate and trade between 6.6900 and 6.7500.”
Next 1-3 weeks: “In our latest update form last Thursday (26 May, spot at 6.7050), we held the view that USD has moved into a consolidation phase and is likely to trade between 6.6500 and 6.7500. We did not expect the surge in volatility as USD spiked to a high of 6.7849 last Friday before dropping sharply. The choppy price actions have resulted in a mixed outlook and USD could trade within a broad range of 6.6500/6.8000 for now.”
Silver (XAG/USD) is climbing today in tandem with gold and is priced at over $22. Although silver is not in demand among speculators, economists at Commerzbank believe that the precious has the potential to recover now.
Speculative financial investors remain sceptical towards silver
“Whereas speculative financial investors are viewing gold positively again, they remain sceptical towards silver: the CFTC’s statistics show that positioning was net short for the first time in almost three years in the week to 24 May.”
“Speculative financial investors have sold around 6,680 tons of silver via the futures market in the last six CFTC reporting weeks. This headwind clearly proved too much for silver, with the result that the price plunged by 13% during this period. We believe it has the potential to recover now, however.”
Gold has risen slightly to a good $1,860 at the start of the new week of trading. Economists at Commerzbank expect the yellow metal to remain resilient as eurozone inflation is set to hit a new record.
Gold to be lent buoyancy amid renewed interest from speculative financial investors
“After four consecutive weeks of outflows from the gold ETFs tracked by Bloomberg, inflows (of just short of four tons) were registered on balance again last week. Speculative financial investors have also seemed more open to gold of late, expanding their net long positions by 40% to 61,000 contracts in the week to 24 May, according to the CFTC’s statistics. If this turns out to be more than just a flash in the pan, gold is likely to be lent buoyancy from this side.”
“Gold should be in demand as a store of value given that the Eurozone inflation data due to be published tomorrow are likely to show a renewed surge in the inflation rate to a record high.”
- DXY drops and bounces off fresh lows near 101.40.
- US markets remain closed due to the Memorial Day holiday.
- FOMC’s Waller speaks later in the session.
The greenback, when tracked by the US Dollar Index (DXY), remains on the defensive although it manages to rebound from earlier lows in the 102.40/35 band on Monday.
US Dollar Index in multi-week lows
The index sheds ground for the third consecutive session at the beginning of the week, always below the 102.00 mark and amidst the broad-based investors’ preference for the riskier assets.
No activity in the US markets should leave the price action to the mercy of the broader risk appetite trends on Monday, while market participants continue to assess the potential steps from the Federal Reserve on its way to normalize the monetary conditions, particularly via interest rate hikes.
The US docket is empty on Monday, with only FOMC’s C.Waller (permanent voter, hawk) due to speak later in the NA session.
What to look for around USD
The dollar slipped back to multi-week lows at the end of last week mainly in response to the investors’ shift to the risk-associated assets.
Also weighing on the greenback appeared the rising perception that inflation might have peaked in April, which in turn supports the idea that the Fed may not need to be as aggressive as market participants expect when it comes to raising the Fed Funds rates.
In the meantime, the Fed’s divergence vs. most of its G10 peers coupled with bouts of geopolitical effervescence, higher US yields and a potential “hard landing” of the US economy are all factors still supportive of a stronger dollar in the next months.
Key events in the US this week: House Price Index, CB Consumer Confidence (Tuesday) – MBA Mortgage Applications, Final Manufacturing PMI, ISM Manufacturing, Construction Spending, Fed Beige Book (Wednesday) – ADP Employment Change, Initial Claims, Factory Orders (Thursday) – Nonfarm Payrolls, Unemployment Rate, Final Services PMI, ISM Non-Manufacturing (Friday).
Eminent issues on the back boiler: Powell’s “softish” landing… what does that mean? Escalating geopolitical effervescence vs. Russia and China. Fed’s more aggressive rate path this year and 2023. US-China trade conflict. Future of Biden’s Build Back Better plan.
US Dollar Index relevant levels
Now, the index is retreating 0.08% at 101.55 and faces the next support at 101.38 (monthly low May 30) followed by 101.11 (55-day SMA) and then 99.81 (weekly low April 21). On the other hand, the breakout of 105.00 (2022 high May 13) would open the door to 105.63 (high December 11 2002) and finally 106.00 (round level).
- EUR/GBP gained some positive traction on Monday, through lacked follow-through buying.
- The recent hawkish remarks by the ECB policymakers continued lending support to the euro.
- Rising bets for a jumbo BoE rate hike, a weaker USD benefitted sterling and capped the upside.
The EUR/GBP cross attracted some dip-buying near the 0.8485 region on the first day of a new week and reversed its modest losses recorded on Friday. The cross maintained its bid tone through the early European session and was last seen trading near the daily high, around the 0.8515 region.
The shared currency continued drawing support from the recent hawkish comments by the European Central Bank policymakers, hinting at a probable rate hike in July. On the other hand, the UK-EU impasse over the Northern Ireland protocol acted as a headwind for the British pound and offered additional support to the EUR/GBP cross.
That said, rising bets for a jumbo interest rate hike by the Bank of England, along with the prevalent US dollar selling bias, underpinned sterling and kept a lid on any further gains for the EUR/GBP cross. Investors also seemed reluctant to place aggressive directional bets ahead of the key European Union summit starting this Monday.
Apart from this, traders will take cues from the flash German consumer inflation figures, which might influence the euro and provide some meaningful impetus to the EUR/GBP cross. This makes it prudent to wait for strong follow-through buying before positioning for any further intraday appreciating move for the EUR/GBP cross.
Technical levels to watch
Bank of Japan (BOJ) Governor Haruhiko Kuroda is now making some comments on the recent depreciation of the Japanese yen.
Key quotes
Rapid yen weakening not due to the central bank policy.
Yen regaining stability after rapid weakening.
Weakness driven by abnormal situation where oil prices topped $130 per barrel.
Pledges to maintain powerful monetary easing to aid the economic recovery.
Inflation surge stems mostly from rise in commodity prices.
Yen weakness only contributed a little to recent jump in inflation.
Market reaction
USD/JPY was last seen trading at 127.23, up 0.11% on the day.
GBP/USD is clinging to the early gains while trading below 1.2650. Economists at ING expect the cable to advance nicely towards 1.2730/2770 in the week ahead.
EUR/GBP to gravitate around 0.85 for a while
“The GBP/USD bounce has certainly been slightly stronger than we thought (we had thought 1.2600/2650 would be the corrective top) and a slightly negative dollar environment at the start of this week could see GBP/USD extend to 1.2730/2770.”
“Long-term, we can still see GBP/USD heading back to the low 1.20s later this summer.”
“EUR/GBP looks set to gravitate around 0.8500 for a while.”
Gold is advancing above $1,860, eyeing a retest of the two-week highs of $1,870. But in the view of economists at TD Securities, selling rallies may be prudent for now.
Positioning is still tilted to the long end of exposure
“Higher wages and the drawing on savings are is helping to keep spending high, which suggests that since the Fed has little impact on the supply side, aggressive rate hikes may still be in order to tame inflation. As such, it may be much too early to get bullish on gold.”
“Given that positioning is still tilted to the long end of exposure, any signs that inflation will remain stubbornly high, or data pointing to a steadfast economy due to higher wages and the spending of savings, as seen today, Fed Funds estimates could easily move back to the highs seen at the start of May or even higher. This, along with modest liquidity which may decrease further with QT, volatility and repositioning could easily force gold to trend down to $1,840 and then to just below $1,800.”
The UK government announced another GBP15bn of measures for households, partially funded by a windfall tax. Until it becomes clearer how the new fiscal policy interacts with the monetary policy, the GBP may struggle for direction, economists at HSBC report.
Lacking energy, despite new fiscal measures
“The GBP is being pushed and pulled by the latest UK fiscal announcement on 26 May, with potentially positive cyclical signals battling against contrastingly negative structural ones. Until it is clear how this new fiscal policy interacts with the Bank of England’s (BoE) monetary policy, the GBP may struggle for direction.”
“The extra help being offered to a range of consumers suggests upside risks for inflation, demand and interest rates.”
“As only GBP5bn will be raised through the windfall tax, with the other GBP10bn presumably being added to borrowing, markets might see the increase in the budget deficit implied by the latest plan as a longer-term structural concern for the UK and for the GBP.”
The dollar is now about 3% off its highs in early May. As a holiday-shortened week starts, the dollar could hand back a little more of its recent strength, although strong US data later in the week should limit the extent of the greenback's downside, economists at ING report.
DXY can continue to drift down to the 101.00 area
“US holiday-thinned trading should keep FX subdued today, but some modest reopening in China and some healthy equity gains should maintain the slightly softer dollar bias for the next few days.”
“DXY is undertaking a slightly deeper correction than we thought and can continue to drift down to the 101.00 area.”
“Friday's release of May Nonfarm Payrolls will have an important say for the Fed. We look for another strong set of numbers, which should prove supportive for both US yields and the dollar.”
Here is what you need to know on Monday, May 30:
Risk-flows extend into a fresh week this Monday, as investors cheer news that Shanghai authorities will cancel many conditions for businesses to resume work from Wednesday, easing a city-wide lockdown.
The upbeat market mood helps the safe-haven US dollar to continue with its downward correction from two-decade peaks. Fading hopes for aggressive tightening by the Fed after the expected 50 bps rate hikes in June and July also adds to the weakness in the greenback while weighing on the Treasury yields across the curve. The benchmark 10-year Treasury yields wallow near the lowest level since mid-April.
Undermining the sentiment around the dollar, traders assess the recent series of discouraging US macro data, which have signaled an economic slowdown in the world’s largest economy.
Meanwhile, the Asian stocks are trading firmer and the S&P 500 futures are gaining 0.90% so far, reflecting the positive risk tone. Looking ahead, the German inflation, Eurozone’s consumer sentiment data and European Union (EU) leaders’ meeting to discuss the additional support for Ukraine and new sanctions against Russia will be closely followed.
Ahead of the summit, EU’s Foreign Policy Chief Josep Borrell said, “we won't fail on oil embargo in next sanctions package against Russia.”
The Memorial Day holiday in the US is likely to keep the forex trading activity limited.
EUR/USD is consolidating around 1.0750 in early Europe, digesting dovish comments from the ECB Chief Economist Philip Lane, as he favors a 25-bps rate hike. The upcoming EU Summit is also keeping the euro on the edge.
GBP/USD is clinging to the early gains while trading below 1.2650. The upside in cable appears capped amid the UK growth concerns, despite the fiscal support to households offered last week.
Among other fx majors, USD/JPY is at the mercy of the dollar and the yields price action, shrugging off comments from BOJ Governor Haruhiko Kuroda on inflation. The pair is currently trading on the defensive at around 127.00. AUD/USD is re-approaching 0.7200, capitalizing on the Shanghai reopening news.
Gold is advancing above $1,860, eyeing a retest of the two-week highs of $1,.870 amid the persistent weakness in the dollar, as well as the yields.
- USD/RUB retreats from 13-day high as bets on aggressive Fed actions recede.
- Risk-on mood, firmer oil prices also helps to consolidate CBR-inspired gains.
- Eurogroup meetings eyed amid fears of more sanctions on Russia.
USD/RUB takes offers to refresh the intraday low around 65.50, consolidating the post-CBR move amid broad US dollar weakness. In doing so, the Russian ruble (RUB) pair prints the first daily loss in four while reversing from the 13-day high, marked the previous day.
The US Dollar Index (DXY) renews its monthly low around 101.40 amid receding bets on the Fed’s aggressive rate hikes, especially after the recent softer inflation and growth numbers from the US. On Friday, the US Personal Consumption Expenditure (PCE) data came in mixed for April, mostly downbeat, as the Core PCE Price Index matched 4.9% YoY forecasts versus 5.2% prior. Further, Personal Income rose less than expected but the Personal Spending improved.
The upbeat headlines from China, suggesting a faster easing of the covid-impressed activity restrictions, also help markets to remain positive, which in turn weigh on USD/RUB prices. “Shanghai said on Sunday ‘unreasonable’ curbs on businesses will be removed from June 1, as it looks to lift its COVID-19 lockdown, while Beijing reopened parts of its public transport as well as some malls and other venues as infections stabilized,” said Reuters.
It’s worth noting that firmer oil prices help trigger the RUB’s recovery moves due to Moscow’s reliance on oil exports as the key export income. That said, WTI crude oil rises for the fourth consecutive day to challenge a two-month high surrounding $116.60, around $116.00 by the press time.
Looking forward, USD/RUB traders will pay attention to the qualitative catalysts amid bank holidays in the US. Among the key catalysts to watch is the Eurogroup meeting that is likely to unveil more sanctions on Russia. Also important are the Moscow-Kyiv tussles as the Russian Foreign Minister Sergey Lavrov said, “Liberation of Ukraine's Donbas is an unconditional priority for Moscow, and other areas should decide their own fate.”
On the other hand, the early draft of the Eurogroup discussions, read by Reuters, signaled the bloc’s resistance to more sanctions, the European Union (EU) Foreign Policy Chief Josep Borrell mentioned that they won't fail on the oil embargo in the next sanctions package against Russia. "There will be an agreement in the end, we will have deal on next sanctions package by Monday afternoon,” the policymaker adds.
Hence, the USD/RUB prices seem to have more downside to track. However, a light calendar limits immediate moves.
Technical analysis
USD/RUB rebound needs validation from the previous swing high, around 71.00, to challenge the 200-DMA level of 78.00, failing to do so could drag the quote towards the previous resistance line from late April, near 58.40 by the press time.
EUR/USD continues to nudge higher. However, economists at ING expect the rally to run out of steam at 1.08 and would be surprised if the pair manages to climb toward 1.10.
External environment to keep EUR/USD supported in the near-term
“We do not think there are strong arguments for EUR/USD to move back to and above 1.10.”
“Our preference would be for this EUR/USD correction to top out near 1.08. But for the short-term, the external environment will keep EUR/USD supported.”
Gold Price looks to extend the previous weeks’ upbeat momentum. XAUUSD is supported at the 21-Daily Moving Average (DMA) at $1,849 amid light trading, will it retest $1,870? FXStreet’s Dhwani Mehta reports.
XAUUSD buyers seize control, $1,870 in sight
“Gold is looking for a retest of the previous week’s high of $1,870. The next upside target awaits at the mildly bullish 100-DMA at $1,890, above which the $1,900 will act as powerful resistance.”
“A firm break below the 21-DMA will challenge the bullish commitments at the critical 200-DMA, currently pegged at $1,842. Failure to resist the latter will reinforce the selling interest, opening floors for a fresh downswing towards the May 18 low of $1,807.”
The likeliness of USD/JPY to test the 126.00 region in the next weeks now appears diminished, according to FX Strategists at UOB Group Lee Sue Ann and Quek Ser Leang.
Key Quotes
24-hour view: “Last Friday, USD traded in a relatively quiet manner between 126.66 and 127.25 before closing largely unchanged at 127.11 (-0.02%). The movement is likely part of a consolidation phase and USD is likely to trade sideways even though the slightly firmed underlying tone suggests a higher range of 126.70/127.30.”
Next 1-3 weeks: “In our latest narrative from last Wednesday (25 May, spot at 126.95), we highlighted that the oversold decline in USD has room to extend to 126.00, possibly 125.60. Since then, USD has not been able to make any headway on the downside as it traded sideways. Downward momentum has waned considerably and the chance for USD to decline to 126.00 has diminished. However, only a breach of 127.60 (‘strong resistance’ level previously at 127.90) would indicate that the downward pressure that started more than two weeks ago has run its course.”
Considering advanced prints from CME Group for natural gas futures markets, open interest rose for the second session in a row on Friday, now by nearly 6K contracts. Volume, instead, reversed two consecutive daily pullbacks and went up by around 237.5K contracts.
Natural Gas remains focused on $9.50
Natural gas prices briefly dropped to multi-day lows near $8.30 just to end the day with modest losses on Friday. The rebound was on the back of rising open interest, which should expose the continuation of the uptrend in the very near term and with the next target at the 2022 peak near $9.50 per MMBtu (May 26).
The kiwi has surged to around 0.6550. The USD is on the skids, NZD price action is upbeat, but NZ hard landing fears have not gone away, economists at ANZ Bank report.
USD may re-emerge supreme
“We can cite reasons why the USD may re-emerge supreme (growing global recession fears, high energy prices, scope for a return of volatility) but for now, risk and commodity currencies are being well supported.”
“Higher rates are helping the Kiwi (that’s evident in NZD/AUD) but it’s likely that the May MPS marked peak RBNZ ‘hawkish surprise’. It’s hard to see future MPSs being so hawkish relative to market expectations; that makes us more cautious than otherwise on the NZD’s prospects.”
“Fears of a hard landing here also continue to percolate; that’s another potential NZD headwind”
- A combination of supporting factors lifted NZD/USD back closer to the monthly peak.
- Reduced bets for a more aggressive Fed, the risk-on mood undermined the greenback.
- The RBNZ’s hawkish signal benefitted kiwi and contributed to the intraday move up.
The NZD/USD pair kicked off the new week on a positive note and built on its recent strong recovery move from the YTD low, around the 0.6215 region touched on May 12. This marked the fourth successive day of an uptick - also the seventh in the previous eight sessions - and pushed spot prices back closer to the monthly high. The pair now seems to have entered a bullish consolidation phase and was last seen trading just a few pips above the mid-0.6500s.
The US dollar languished near a one-month low and was pressured by a combination of factors. This, in turn, was seen as a key factor that acted as a tailwind for the NZD/USD pair. The markets now expect that the Fed could pause the rate hike cycle after two 50 bps hikes each in June and July. This, in turn, had led to the recent slump in the US Treasury bond yields to a multi-week low, which, along with the risk-on mood undermined the safe-haven buck and benefitted the risk-sensitive kiwi.
The prospects for an eventual slowdown of the Fed's policy tightening, along with the easing of COVID-19 restrictions in China, boosted investors' appetite for perceived riskier assets. Apart from this, the Reserve Bank of New Zealand's hint toward even higher interest rates offered additional support to the domestic currency and the NZD/USD pair. The fundamental backdrop seems tilted firmly in favour of bullish traders and supports prospects for an extension of over a two-week-old uptrend.
In the absence of any major market-moving economic data and the Memorial Day holiday in the US, the broader market risk sentiment will continue to influence the USD price dynamics. This, in turn, might provide some impetus to the NZD/USD pair as traders start positioning for important US macro releases scheduled at the beginning of a new month. This week's US economic docket highlights the ISM Manufacturing PMI on Wednesday, the ADP report on Thursday and the monthly jobs report (NFP) on Friday.
Technical levels to watch
Could the dollar lose its status as the dominant reserve currency? Analysts at Natixis explain why there is no substitute for the dollar that is safe, large and designed to store a large quantity of savings.
Public cryptocurrencies are not reserve currencies
“In the event of a conflict, any OECD country, not just the United States, may freeze the foreign exchange reserves of a country that enters into conflict with the West.”
“Few countries want to have their foreign exchange reserves in China’s renminbi, given the political situation in that country.”
“Alternative assets (gold, cryptocurrencies) are too small to be substitutes for the dollar.”
“As for public cryptocurrencies (CBDCs), they may facilitate trade, but they are not different reserve currencies from public currencies (we fail to see why the existence of a crypto-renminbi would increase the reserve currency role of the renminbi).”
In the opinion of FX Strategists at UOB Group Lee Sue Ann and Quek Ser Leang, further upside momentum in AUD/USD opens the door to a probable visit of the 0.7200 zone.
Key Quotes
24-hour view: “Last Friday, AUD soared to a high of 0.7168 before closing on a strong note at 0.7160 (+0.85). Further AUD strength would not be surprising but in view of the overbought conditions, AUD may not be able to maintain a foothold above 0.7180 (next resistance is at 0.7200). Support is at 0.7140 but only a break of 0.7120 would indicate that the current upward pressure has eased.”
Next 1-3 weeks: “We highlighted last Monday (23 May, spot at 0.7070) that upward momentum is beginning to build and the risk is tilted to the upside towards 0.7135. We added, ‘AUD has to close above the major resistance at 0.7135 before a sustained advance is likely’. After trading sideways for several days, AUD rose above 0.7168 last Friday before closing at 0.7160. Upward momentum has improved and AUD could advance to 0.7200. Overall, only a breach of 0.7090 (‘strong support’ level previously at 0.7025) would indicate that upward momentum has eased.”
Gold closed the week above the 200-day SMA and the Fibonacci 23.6% retracement of the latest downtrend. As FXStreet’s Eren Sengezer notes, the technical outlook suggests XAU/USD remains slightly bullish.
$1,870 aligns as next resistance
“On the upside, $1,870 (Fibonacci 38.2% retracement) aligns as next resistance. In case XAUUSD rises above that level and starts using it as support, it could target $1,890 (100-day SMA and Fibonacci 50% retracement) and $1,900 (psychological level, 50-day SMA) afterwards.”
“$1,850 (Fibonacci 23.6% retracement) forms first support ahead of $1,840 (200-day SMA). Only a daily close above the latter could attract sellers and cause the near-term technical outlook to turn bearish. In such a scenario, $1,830 (static level) could act as the next line of defence.”
CME Group’s flash data for crude oil futures markets saw traders increase their open interest positions by more than 16K contracts at the end of last week. Volume, on the other hand, dropped by around 122.4K contracts.
WTI: Next on the upside comes $116.60
The rebound in prices of the WTI remained well and sound on Friday amidst rising open interest, which is supportive of the continuation of the bounce in the very near term at least. That said, the $116.61 level now emerges as the next target followed by the 2022 high past the $129.00 mark (March 8).
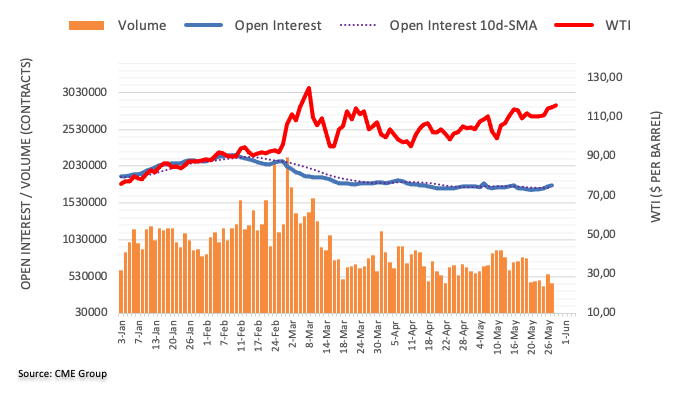
Even though there are signs that the Fed may be having some success in slowing demand in the US, economists at Rabobank expect safe-haven demand to keep the USD underpinned in the months ahead.
EUR/USD to see another move towards 1.03
“Even though we see risk that the Fed’s determination to win back its inflation-fighting credibility will sink the US economy into recession next year, we expect the USD to find support.”
“It is likely that any sense of crisis is likely to boost demand for the USD, even if a trigger for a deterioration in market sentiment were to stem from a worsening in US fundamentals.”
“Reflecting the fragile nature of market sentiment, we expect high levels of volatility in FX market in the coming months. We expect bouts of USD selling to be short-lived and continue to see risk of another move towards EUR/USD 1.03 on a 1 to 3-month view.”
- GBP/USD pares intraday gains as buyers struggle to keep reins at monthly high.
- 200-SMA, rising wedge’s support challenge bears amid market’s indecision.
- Firmer RSI, not overbought, hints at further upside towards recent top.
GBP/USD retreats from daily high as bulls take a breather around one-month top heading into Monday’s London open. Even so, the cable pair dribbles around 1.2650 of late.
The quote remains inside a 13-day-old rising wedge bearish chart pattern. However, the firmer RSI (14) line, not overbought, hints at the pair’s further upside towards the stated bearish formation’s resistance line, at 1.2715.
That said, the recent peak of 1.2666 may also challenge the GBP/USD prices during the fresh run-up.
In a case where the quote rises past 1.2715, a downward sloping resistance line from late March, close to 1.2840, will be in focus.
Alternatively, pullback moves remain elusive until staying beyond the 1.2590 support confluence, including the 200-SMA and lower line of the stated wedge.
It’s worth noting, however, that a clear downside past 1.2590 theoretically opens the door for the GBP/USD fall towards refreshing the monthly low, currently around 1.2155.
During the anticipated slump, April’s low near 1.2410 may offer an intermediate halt.
GBP/USD: Four-hour chart
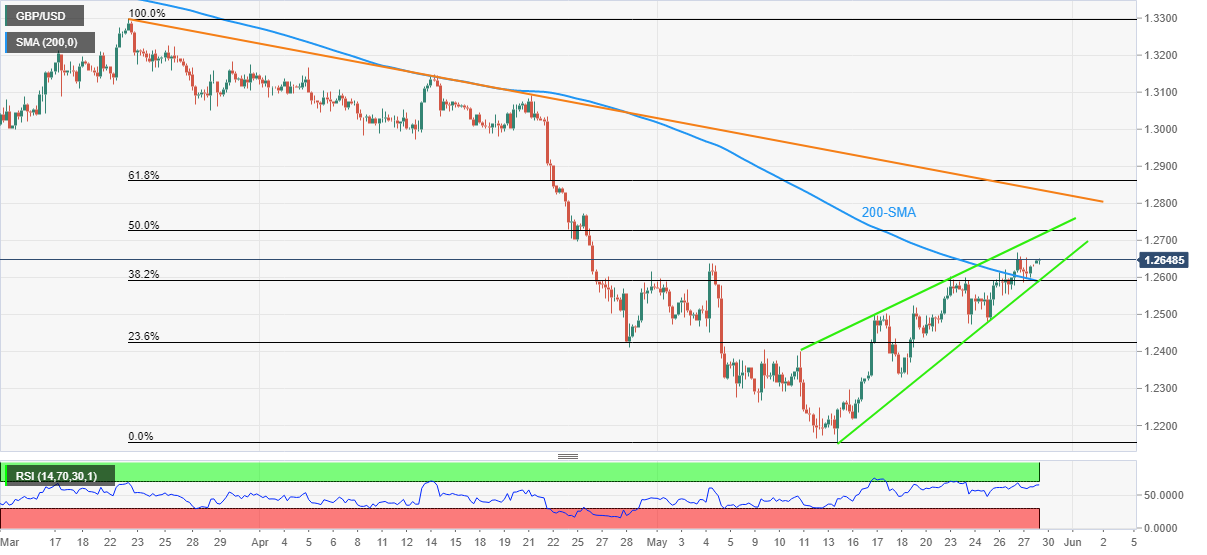
Trend: Limited upside expected
Gold registered gains for the second straight week. Sellers are set to stay on the sidelines as focus shifts to US data, FXStreet’s Eren Sengezer reports.
US yields' reaction to key US data could impact gold's action
“On Wednesday, the ISM Manufacturing PMI from the US will be watched closely by market participants, who are growing increasingly concerned over a possible recession in the US. If this data suggests that the business activity in the manufacturing sector continued to expand at a robust pace in May, the greenback could stage a rebound and limit XAUUSD’s upside.”
“Nonfarm Payrolls (NFP) are expected to rise by 310,000 following April’s increase of 428,000. Unless the NFP print offers a big surprise in either direction, the wage inflation component of the report should impact the market action. The Average Hourly Earnings are forecast to rise by 5.6% on a yearly basis in May. Strong wage inflation could be seen as a factor that can cause consumer inflation to remain high for longer-than-expected and remind investors of the Fed’s willingness to tighten its policy aggressively. In that scenario, gold could turn south amid a rebound in US T-bond yields.”
“2.7%, which is the Fibonacci 23.6% retracement of the uptrend that started in December, aligns as a key technical level for the 10-year US T-bond yield. If that support fails, a steep decline in US yields could open the door for a gold rally.”
Further upside could now push GBP/USD to the 1.2700 region in the next weeks, noted FX Strategists at UOB Group Lee Sue Ann and Quek Ser Leang.
Key Quotes
24-hour view: “GBP popped to a high of 1.2667 during Asian hours last Friday before trading sideways for the rest of the session. There is barely any improvement in upward momentum and GBP is likely to trade sideways for today, expected to be within a range of 1.2580/1.2665.”
Next 1-3 weeks: “In our latest update from last Thursday (27 May, spot at 1.2580), we held the view that GBP has to close above 1.2600 before a sustained advance is likely. We indicated the next resistance above 1.2600 is at 1.2640. GBP rose to 1.2667 last Friday before closing at 1.2628 (+0.16%). Despite the advance, upward momentum has not improved by much. That said, the risk is on the upside towards 1.2700. Overall, only a break of 1.2540 (‘strong support’ level) would indicate that the upside risk has dissipated.”
Open interest in gold futures markets extended the downtrend on Friday, now by around 1.2K contracts according to preliminary figures from CME Group. Volume followed suit and shrank for the second session in a row, this time by around 62.8K contracts.
Gold remains supported by the 200-day SMA
Friday’s small uptick in gold prices was amidst shrinking open interest and volume, leaving the prospects for extra gains somewhat diminished in the very near term. In the meantime, the precious metal appears well supported by the 200-day SMA around $1,840.
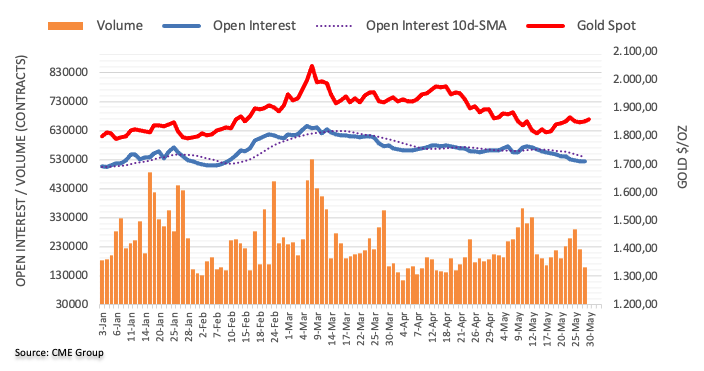
- AUD/USD is sustaining above 0.7180 amid selling pressure in the DXY.
- Positive market sentiment has underpinned the risk-perceived currencies.
- The US NFP could tumble to 310k while the annual aussie GDP may plunge to 1.6%.
The AUD/USD pair is holding itself strong near the previous week’s high at 0.7189 as a risk-on impulse has been preferred by the market participants on expectations of a slippage in the US Nonfarm Payrolls (NFP). Risk-sensitive currencies are gaining a lot of traction and the greenback has been dumped by investors. The major is advancing sharply to re-test its monthly highs at 0.7266 ahead of the Gross Domestic Product (GDP) numbers from aussie and NFP from the US.
The US dollar index (DXY) has tumbled in the early trade to its monthly lows at 101.43. A lower forecast of the US NFP has compelled the market participants to dump the safe-haven asset. A preliminary estimate for the US NFP is 310k against the prior print of 428k. Lower US NFP may trim the extent of hawkishness by the Federal Reserve (Fed). This might result in only one more 50 basis points (bps) interest rate hike by the Fed this year rather than the expectations of three jumbo rate hikes.
On the aussie front, investors are awaiting the release of the GDP numbers on Wednesday. The annual GDP is expected to plunge to 1.6% against the prior print of 4.2%. While the quarterly figure may slip to 0.6% vs. 3.4% prior print. A dismal performance from the antipodean could weaken the pair going forward.
- Gold regained positive traction on the first day of a new week amid sustained USD selling.
- Expectations that the Fed could pause the rate hike cycle later this year weighed on the USD.
- The risk-on rally could undermine the safe-haven XAUUSD and cap any meaningful upside.
Gold attracted fresh buying on the first day of a new week and climbed to a fresh daily high, above the $1,860 level during the early European session. The US dollar languished near the monthly low, which, in turn, was seen as a key factor that provided a goodish lift to the dollar-denominated commodity. That said, the risk-on rally in the equity markets might hold back traders from placing aggressive bullish bets around the safe-haven XAUUSD.
The markets now expect that the Fed could pause the rate hike cycle after two 50 bps hikes each in June and July. The bets were reaffirmed by Friday's release of the US Personal Consumption Expenditure (PCE) data for April, which suggested that inflationary pressures in the US could be easing. Apart from this, the recent slump in the US Treasury bond yields to a multi-week low weighed on the buck and further benefitted the non-yielding gold, though any meaningful upside still seems elusive.
The prospects for an eventual slowdown of the Fed's policy tightening, along with the easing of COVID-19 restrictions in China, boosted investors' appetite for perceived riskier assets. This, in turn, might keep a lid on any further gains for gold amid absent relevant market-moving economic releases and the Memorial Day holiday in the US. This, in turn, suggests that any subsequent move up might attract fresh selling at higher levels and fizzle out rather quickly near the $1,869-$1,870 supply zone.
Technical levels to watch
- WTI pares intraday gains at the highest levels since late March, up for the fourth consecutive day.
- USD weakness, risk-on mood add strength to the bullish bias.
- EU’s likely resistance for new Russian sanctions, OPEC meeting may weigh on prices.
WTI dribbles around a two-month high during the four-day uptrend ahead of Monday’s European session. That said, the energy benchmark eases from the multi-day to $114.80 by the press time.
Despite the latest pullback from the intraday high, the black gold gained around 0.70% on a day as upbeat markets sentiment and a softer US dollar underpin the commodity prices. However, cautious sentiment ahead of today’s Eurogroup meeting seems to challenge the WTI bulls.
That said, the US Dollar Index (DXY) renews its monthly low around 101.40 amid receding bets on the Fed’s aggressive rate hikes, especially after the recent softer inflation and growth numbers from the US.
Other than the softer yields and easing bets on the Fed’s aggression, upbeat headlines from China, suggesting a faster easing of the covid-impressed activity restrictions, also help markets to remain positive, which in turn propel WTI crude oil prices. “Shanghai said on Sunday ‘unreasonable’ curbs on businesses will be removed from June 1, as it looks to lift its COVID-19 lockdown, while Beijing reopened parts of its public transport as well as some malls and other venues as infections stabilized,” said Reuters.
Moving on, the energy buyers will pay attention to the bloc’s meeting and Thursday’s OPEC decision on the oil output. While the early draft, read by Reuters, signaled the bloc’s resistance to more sanctions, the European Union (EU) Foreign Policy Chief Josep Borrell mentioned that they won't fail on the oil embargo in the next sanctions package against Russia. "There will be an agreement in the end, we will have deal on next sanctions package by Monday afternoon,” the policymaker adds.
Technical analysis
WTI crude oil buyers need to cross the late March swing high surrounding $115.90, also stay beyond the $116.00 round figure, to aim for the yearly peak of $126.51. Meanwhile, May 13 top around $113.15 and the $113.00 restricts the immediate downside of the black gold.
European Union (EU) Foreign Policy Chief Josep Borrell said on Monday, “we won't fail on oil embargo in next sanctions package against Russia.”
Additional quotes
"There will be an agreement in the end.”
“We will have a deal on the next sanctions package by Monday afternoon.”
Related reads
- EU to pledge support for Ukraine but not discuss new Russia sanctions – Reuters
- EUR/USD: 50-DMA probes bulls around 1.0750 ahead of German inflation, EU Summit
In an interview with Cinco Días, a Spanish business and finance newspaper, European Central Bank (ECB) Chief Economist Philip Lane said that the central bank remains committed to preventing financial fragmentation.
No further comments are reported, thus far.
Market reaction
EUR/USD is trading 0.27% higher on the day, currently hovering around 1.0750 amid a broadly weaker US dollar.
FX Strategists at UOB Group Lee Sue Ann and Quek Ser Leang suggested EUR/USD could now head towards the 1.0800 region.
Key Quotes
24-hour view: “EUR edged to a fresh 1-month high of 1.0764 last Friday before easing off to close little changed at 1.0727 (+0.03%). Upward momentum has barely improved and EUR is unlikely to advance much further. For today, EUR is more likely to consolidate and trade between 1.0690 and 1.0765.”
Next 1-3 weeks: “We have held a positive EUR view since early last week. Our view was not wrong but as EUR struggled to extend its gains, we highlighted last Thursday (26 May, spot at 1.0690) that EUR has to move and stay above 1.0720 or the chance for a break of 1.0750 would diminish quickly. On Friday, EUR rose above 1.0750 but retreated quickly from a high of 1.0764. The risk is still on the upside but in view of the lackluster upward momentum, it is left to be seen if EUR could extend its advance to 1.0800. The upside risk is intact as long as EUR does not move below 1.0655 (‘strong support’ level previously at 1.0640).”
Bank of Japan (BOJ) Governor Haruhiko Kuroda is back on the wires now, via Reuters, noting that the central bank doesn’t expect cost-push inflation to lead to sustainable and stable price hikes.
Additional comments
“Employment, income conditions in Japan are rather weak now.”
“Aiming to create virtuous growth of price hikes entailing wage gains.“
“CPI to maintain around 2% growth over 12 months but will lower thereafter.”
Market reaction
USD/JPY remains at the mercy of the dynamics of the US dollar and the yields, currently trading at 127.00, down 0.09% on the day.
- Offers at the upper boundary of the Rising Channel favor a short-term correction.
- The formation of Doji candlestick pattern adds to the downside filters.
- The RSI (14) is indicating an extremely overbought situation.
The USD/TRY pair is oscillating around 16.30 in the early European session. The asset has faced barricades around 16.45 last week after a firmer upside move from May 5 low at 14.68.
The Turkish lira bulls have defended the upper boundary of the Rising Channel. The upper ascending trendline of the chart pattern is placed from January 3 high at 13.94 while the lower boundary is plotted from Fed low at 13.27. The presence of barricades around the boundary of a Rising Channel chart formation indicates a correction in the counter. An expectation of a correction has been bolstered on activation of the Doji candlestick pattern formed on Thursday. However, the formation of a Doji doesn’t work in isolation.
Advancing 20- and 50- period Exponential Moving Averages (EMAs) at 15.77 and 15.18 add to the upside filters.
Meanwhile, the Relative Strength Index (RSI) (14) is oscillating in a 60.00-80.00 range that supports the bullish momentum. However, an overbought situation cannot be ruled out.
A drop below Friday’s low at 16.19 will drag the greenback bulls towards the round-level support at 16.00, followed by the 20-EMA at 15.77.
On the flip side, the greenback bulls could extend their gains to the 12 December 2021 opening price and the round-level resistance at 16.60 and 17.00 after overstepping Thursday’s high at 16.47.
USD/TRY daily chart
-637894857417941204.png)
- USD/CAD takes offers to refresh monthly low, down for fourth consecutive day.
- Six-week-old horizontal support, oversold RSI conditions test sellers.
- Bulls need validation from 200-SMA for fresh entry.
USD/CAD stands on the slippery ground as it renews a one-month low near the 1.2700 heading into Monday’s European session.
In doing so, the Loonie pair drops for the fourth consecutive day while extending the previous week’s downside break of the 200-SMA.
However, a horizontal area comprising levels marked since mid-April could join the oversold RSI conditions to challenge USD/CAD bears around 1.2680.
Following that, a two-month-old upward sloping support line near 1.2585 will challenge the pair sellers.
Alternatively, corrective pullback needs to cross the 200-SMA level near 1.2800 to recall the buyers.
Even so, May 11 swing low around 1.2920 may challenge the USD/CAD upside before the monthly high of 1.3076.
USD/CAD: Four-hour chart
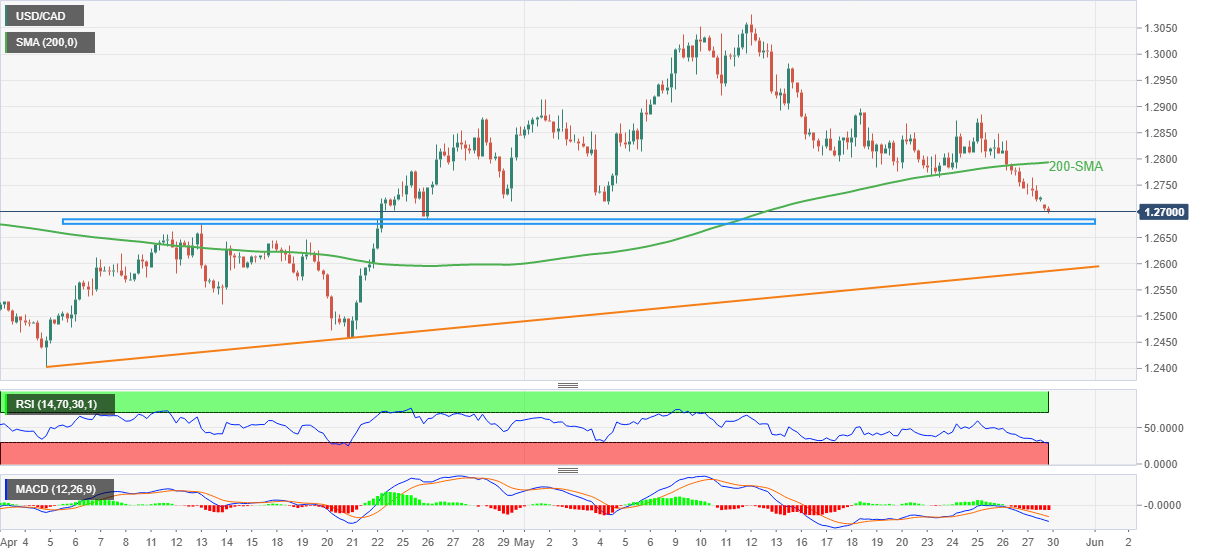
Trend: Limited downside expected
Moody's lowers China 2022 GDP growth forecast from 5.2% to 4.5%
more to come ....
- USD/JPY reverses early-day gains, prints three-day downtrend of late.
- Receding bets on Fed’s aggression weigh on USD but risk-on mood appears challenging the pair bears.
- BOJ’s Kuroda reiterates support for easy money policies, Japan PM Kishida seems hopeful of reaching inflation target.
- US bank holiday, light calendar restricted initial moves, risk catalysts, US NFP is the key moving forward.
USD/JPY not only reverses the day-start rally that probed a two-day downtrend but also renews the intraday low heading into Monday’s European session. That said, the yen pair seems to struggle with multiple mixed catalysts while recently easing to 127.00.
Among them, the market’s indecision and the US bank holiday restrict the pair’s latest moves while the broad US dollar weakness contrasts the risk-on mood to trouble the USD/JPY traders. Above all, the Bank of Japan (BOJ) Governor Haruhiko Kuroda’s readiness for powerful monetary easing keeps the pair buyers hopeful.
BOJ’s Kuroda recently mentioned that the central bank will continue powerful monetary easing to help the economy recover from a covid-induced slump. On the same line, Japanese Prime Minister Fumio Kishida said on Monday, that his government expects the Bank of Japan (BOJ) to strive to achieve the inflation target.
Elsewhere, softer yields and receding bets on the Fed’s aggressive rate hikes, mainly after the latest growth and inflation figures from the US, seem to weigh on the USD/JPY prices. Even so, risk-on mood and headlines from China, signaling a further drawdown on activity restrictions in China, help the USD/JPY pair buyers due to the pair’s risk-barometer status.
While portraying the mood, the S&P 500 Futures refresh a three-week high while the S&P 500 benchmark posted the biggest weekly gain in 18 months.
Moving on, USD/JPY traders seek clear directions from yields and risk catalysts, which in turn highlights Tuesday’s employment data for Japan and qualitative factors surrounding China, covid and Russia.
Technical analysis
Even if the 50-DMA defends USD/JPY buyers around 126.70, a downward sloping trend line from May 09, near 127.60, restricts the pair’s short-term upside.
- GBP/JPY is sensing offers above 160.50 amid a higher forecast of Japan’s labor data.
- Japan’s officials are worried over the rock-bottom inflation rate in the economy.
- The UK’s S&P Global Manufacturing PMI may remain stable at 54.6.
The GBP/JPY pair is witnessing selling pressure after re-testing Thursday’s high at 160.83 in the Asian session. A sense of exhaustion has been observed while making an attempt to kiss weekly highs around 161.00. The cross is likely to display weakness going forward on the expectation of a mild improvement in Japan’s Jobs/Applicants ratio.
The Statistics Bureau of Japan is expected to display an improvement in the above-discussed economic catalyst to 1.23 against the prior print of 1.22. Also, the Unemployment Rate is expected to remain unchanged at 2.6%. This indicates a tight labor market in Japan, which will strengthen the Japanese yen against pound ahead.
Meanwhile, Bank of Japan (BOJ)’s policymakers are worried about the lower inflationary pressures. Last week, Japan’s Prime Minister Fumio Kishida urged to the Bank of Japan (BOJ) that it should make some efforts to achieve the targeted inflation rate of 2%. In response to that BOJ Governor Harihuko Kuroda stated that the price rise should be accompanied by a wage hike if stable inflation is required at desired levels.
On the pound front, investors will focus on the S&P Global Manufacturing PMI, which is expected to remain stable at 54.6. A light economic calendar on pound front this week will focus more on the comments from the Bank of England (BOE). A lightning spark in the Consumer Price Index (CPI), recorded for April at 9.1% is advocating a jumbo rate hike by the BOE. The UK inflation is mounting higher, which propels the BOE Governor Andrew Bailey to dictate a 50 basis point (bps) rate hike.
- USD/CNH remains on the back foot around one-week low, sellers attack short-term key support.
- Downbeat RSI, clear break of 21-DMA signal further downside.
- Bulls need successful rise past 7.7850 to retake control.
USD/CNH extends the previous day’s losses around a one-week low, following a gap-down opening. However, an upward sloping support line from late April restricts the quote’s immediate downside near 6.6600.
Given the sustained break of the 21-DMA and downbeat RSI line, not oversold, USD/CNH prices are likely to conquer the immediate support line surrounding 6.6570.
Following that, the monthly bottom and late April swing low close to 6.6100 will gain the market’s attention.
In a case where USD/CNH prices fail to bounce off 6.6100, the odds of the pair’s further fall towards the 61.8% Fibonacci retracement level of late March to early May upside, near 6.5300 can’t be ruled out.
Meanwhile, an upside gap of nearly 150 pips below 6.7200 gets filled should the USD/CNH buyers return to the table.
Even so, a horizontal area comprising multiple levels marked since May 13, around 6.7850, appears a tough nut to crack for the bulls.
Overall, USD/CNH is likely to extend the latest weakness towards revisiting the monthly low.
USD/CNH: Daily chart
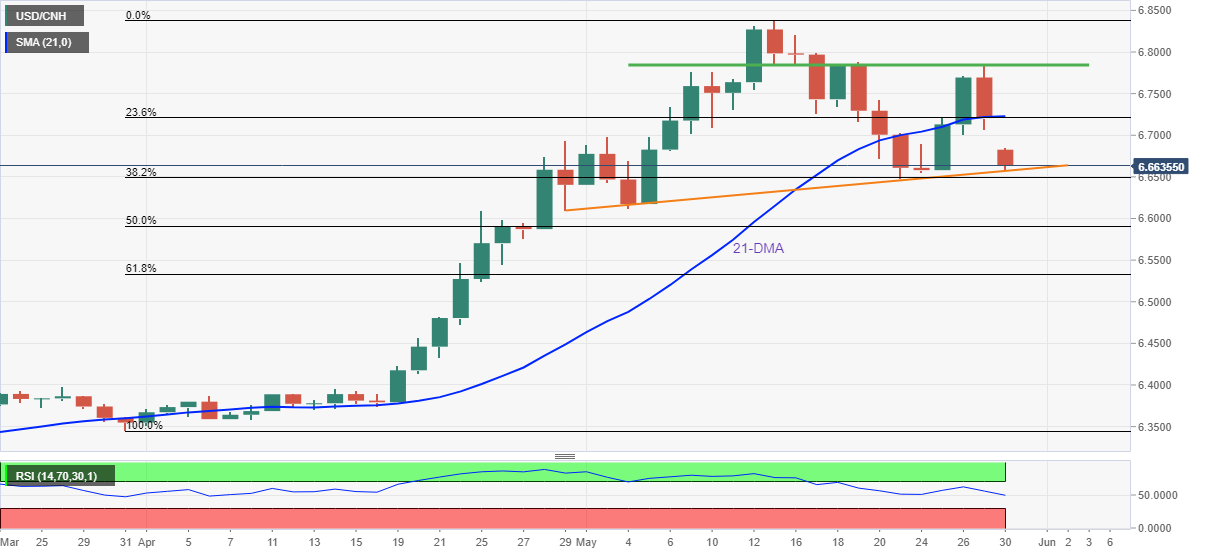
Trend: Further weakness expected
- A decent slippage in the DXY has strengthened the Asian equities.
- The US NFP is seen lower at 310k against the prior print of 428k.
- No announcement on banning Russian oil at the EU Leaders summit is good news for the oil bulls.
Markets in the Asian domain are advancing strongly higher as the improved risk appetite of investors has underpinned the Asian equities. The indices in the Asian region have carry-forwarded their last week’s positive mood on Monday and extremely oversold equities are indicating the continuation of the bullish momentum.
At the press time, Japan’s Nikkie225 added 2.01%, China A50 jumped 0.68%, Hang Seng gained 2.10% and Nifty50 jumped 1.40%.
A significant rebound in the Asian equities is backed by a plunge in the US dollar index (DXY). The DXY has eased in early Tokyo after a mild up move. The asset has tumbled to near its monthly lows at 101.45 and more losses are expected from the DXY on the lower forecast of the US Nonfarm Payrolls (NFP). As per the market consensus, the US economy will report an addition of 310k jobs in the labor force. In the month of April, the US economy added 428k jobs. Therefore an underperformance on the employment front is forcing the market participants to dump the safe-haven asset.
On the oil front, the black gold is struggling to sustain above $116.00 as an embargo on Russian oil imports is not the outcome of the European Union (EU) Leaders summit. This has postponed the context of supply worries. However, the re-opening of Shanghai has bolstered the odds of a rebound in the aggregate demand. The withdrawal of restrictions on the movement of men, materials, and, machines by the Chinese administration has supported the oil prices.
- EUR/USD retreats from monthly high during three-day uptrend.
- Aggressive Fed rate hike bets scaled back on softer US inflation, growth figures.
- S&P 500’s best week in 1.5 years also favor buyers amid US bank holiday.
- German HICP, Eurogroup meeting eyed for fresh impulse.
EUR/USD struggles to extend the three-day uptrend around the monthly peak, retreating of late, as traders seek fresh clues amid a quiet Asian session. That said, the major currency pair dribbles around 1.0750 as the buyers jostle with the 50-DMA hurdle amid broad US dollar weakness, as well as anxiety ahead of the key data/events from the bloc.
Even if the market’s indecision and the US bank holiday restrict EUR/USD moves, the pair prints mild gains around 1.0750 amid the broad US dollar weakness. However, cautious sentiment ahead of preliminary readings of Germany’s headlines inflation gauge and the Eurogroup meeting seems to test the buyers.
That said, the US Dollar Index (DXY) remains depressed at around a one-month low close to 101.50 as mostly downbeat figures of the US consumption, income and inflation, as well as GDP, seem to have recently doubted the Fed’s 0.50% rate hikes post-September. The traders’ indecision also probed the US Treasury yields of late, which in turn weighed on the US dollar index and allowed markets to remain positive.
On Friday, the US Personal Consumption Expenditure (PCE) data came in mixed for April, mostly downbeat, as the Core PCE Price Index matched 4.9% YoY forecasts versus 5.2% prior. Further, Personal Income rose less than expected but the Personal Spending improved.
Other than the softer yields and easing bets on the Fed’s aggression, upbeat headlines from China, suggesting a faster easing of the covid-impressed activity restrictions, also help markets to remain positive, which in turn propel EUR/USD prices. “Shanghai said on Sunday ‘unreasonable’ curbs on businesses will be removed from June 1, as it looks to lift its COVID-19 lockdown, while Beijing reopened parts of its public transport as well as some malls and other venues as infections stabilized,” said Reuters.
At home, traders remain worried over the Eurozone’s oil embargo on Russian imports as well as the first readings of Germany’s Harmonized Index of Consumer Price (HICP) figures for May, expected 8.0% versus 7.8%.
Reuters already published a draft report suggesting no major sanctions for Russia during today’s Eurogroup meeting. However, the bloc is likely to remain supportive of Ukraine after Moscow’s recent attack.
It’s worth noting that an anticipated rally in German inflation numbers will offer additional strength to the European Central Bank (ECB) policymakers to back the 0.50% rate hike concerns, not to forget suggesting an interest rate lift in July. The same can help EUR/USD to refresh its monthly high. However, risk catalysts and the US market moves will act as extra filters to watch.
Technical analysis
Bearish RSI divergence suggests that the EUR/USD bulls are running out of steam, suggesting a pullback towards the early month peak near 1.0640. However, a daily closing beyond the 50-DMA hurdle, surrounding 1.0745 by the press time, won’t hesitate to challenge the late April high around 1.0940.
In a written address to a meeting of China-Pacific foreign ministers, Chinese president Xu Jinping said that “no matter how the international situation may change, China will always be a good friend of pacific island countries.”
President Xi said that “China is willing to work with pacific island nations to build community with a shared future.”
Market reaction
USD/CNY is currently trading at 6.6502, down 0.68% on the day. The Shanghai reopening optimism is boding well for the Chinese yuan.
Reports are doing the round that US President Joe Biden is likely to meet Fed Chair Jerome Powell on May 31, Tuesday.
There are no further details out on the same. Meanwhile, there is no official confirmation from either side.
Market reaction
The US dollar remains in the red around 101.50 against its main competitors on the above report. The spot is down 0.11% on the day.
- USD/INR remains pressured around intraday low, extends Friday’s pullback.
- Sellers attack ascending triangle’s support to retake control.
- RSI, MACD suggests further weakness but the key SMAs may offer an intermediate halt.
USD/INR stays depressed around the intraday low of 77.52 inside a three-week-old ascending triangle. In doing so, the Indian rupee (INR) pair stretches the previous day’s weakness as bears battle with the stated bearish chart pattern’s support line during early Monday.
Given the downbeat RSI and MACD conditions, as well as the pair’s lower-high formation in the last two days, the USD/INR prices are likely to witness further downside.
However, a clear downside break of the 77.50 support becomes necessary to convince sellers.
Even so, the 100-SMA and the 200-SMA will challenge the INR pair’s further downside around 77.40 and 76.90.
Meanwhile, recovery moves remain elusive until the quote defies the recent lower-high formation by crossing the 77.70 hurdle.
Following that, the stated triangle’s resistance around 77.85, followed by the 78.00 threshold, will please the USD/INR bulls.
Overall, USD/INR prices are likely to consolidate recent gains but the downtrend appears less convincing.
USD/INR: Four-hour chart
Trend: Further weakness expected
- Gold price is oscillating around $1,860.00 amid broader weakness in the DXY.
- The market participants are dumping the DXY on lower US NFP forecasts.
- A formation of a Symmetrical Triangle is indicating a consolidation move going forward.
Gold price (XAU/USD) has witnessed a strong rebound after failing to sustain below the round level support of $1,850.00 in early Tokyo. The precious metal has touched an intraday high of $1,860.25 and is expected to refresh the day’s high as an improvement in the risk appetite of the market participants has diminished the US dollar index (DXY)’s appeal.
A slippage in the DXY could be tagged to lower forecasts of the US Nonfarm Payrolls (NFP), which are due later this week. A preliminary estimate for the US NFP is 310k against the prior print of 428k last month. This dictates an expectation of a more than 27% fall in the number of job additions by the US economy. A slippage in the additional jobs creation data could trim the extent of hawkishness in the stance of the Federal Reserve (Fed) in its June monetary policy. And, eventually, it will underpin the gold prices.
Also, the US economic calendar is offering the release of the ISM Manufacturing PMI data, which may slip to 54.5 against the prior print of 55.4.
Gold technical analysis
A formation of a Symmetrical Triangle on an hourly scale is indicating a slippage in the volatility, which will be followed by a breakout in the same. The gold prices are expected to break on the upside amid a golden cross of 50- and 200-period Exponential Moving Averages (EMAs) at $1,837.42. The Relative Strength Index (RSI) (14) is oscillating in a 40.00-60.00 range, which indicates a consolidation ahead.
Gold hourly chart
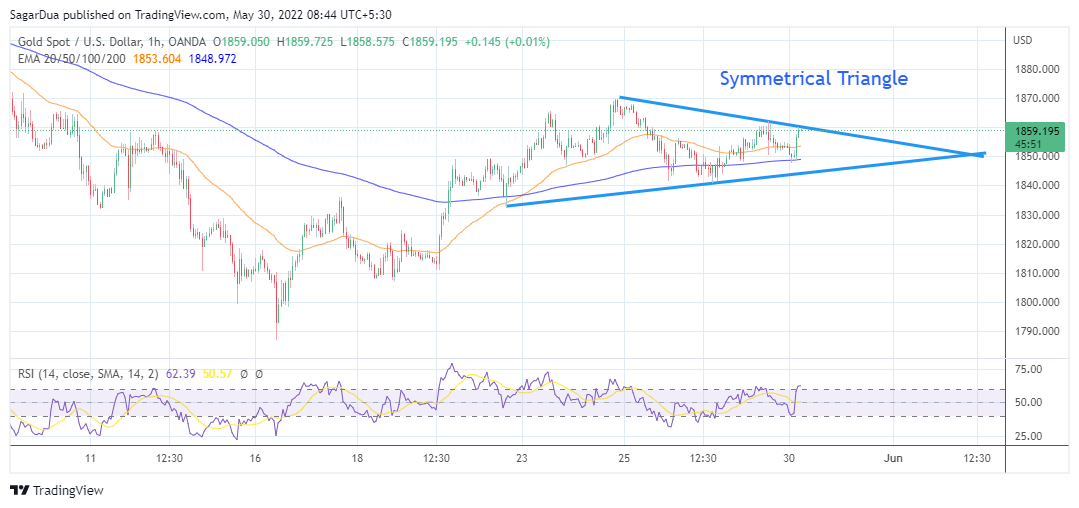
Goldman Sachs said in its latest note that "the UK chancellor announced a new round of fiscal stimulus aimed at alleviating cost-of-living pressures. This marks a notable shift in stance from the government, and on the margin should help ease the BOE's dilemma.”
Additional quotes
“But the macro impact is likely to be fairly small (our economists estimate a 0.1% boost to growth and a marginal boost to inflation) and arguably pales in comparison to the significant downside surprise in the UK services PMI, which was the biggest on record.”
“Taken together, we think it is unlikely to significantly alter the BoE's measured approach, which we have argued is de facto a low real rate, weaker currency policy.“
“We therefore maintain our outlook for relative GBP underperformance. However, we acknowledge that the balance of risks has shifted slightly, particularly if the announcement snowballs into a bigger fiscal policy shift."
- GBP/USD is holding above 1.2650 amid an improvement in the risk appetite of investors.
- The US economy may have added 310k jobs in the labor market last month.
- The odds of a bumper rate hike by the BOE are scaling higher.
The GBP/USD pair is advancing sharply higher in the Asian session as investors have underpinned the risk-on market impulse, which has diminished the safe-haven appeal. The pound bulls have pushed the asset above 1.2650. The asset is hovering around the previous week’s high at 1.2667 and a decisive move beyond the same will unleash the sterling bulls to an upside of 1.2700.
Mounting price pressures in the US economy are clearing the obscurity over the interest rate decision by the Federal Reserve (Fed) in its June monetary policy. The US Consumer Price Index (CPI) is sustaining above 8% and a whopping inflation rate is not healthy for the growth prospects of an economy. It always keeps alive the odds of a recession in the economy. This week, the market participants will keep an eye over the release of the US Nonfarm Payrolls (NFP). As per the market consensus, the US economy may have added 310k jobs in the labor market vs. the former figure of 428k. The US economy is continuously outperforming the consensus on the job data. The Unemployment Rate is seen unchanged at 3.6%.
On the pound front, recession fears are alarming amid the heated inflationary pressures. The display of the UK inflation above 9% has left no other choice for the Bank of England than to announce a 50 basis point (bps) rate hike. It is worth noting the BOE elevated its interest rates by 25 basis points (bps) in its May monetary policy.
Japanese Prime Minister Fumio Kishida said on Monday, his government expects the Bank of Japan (BOJ) to strive to achieve the inflation target.
Additional comments
“Price hikes caused by global crude oil, raw materials price increase stemming from Russia’s invasion of Ukraine.”
“Not considering changing government-BOJ joint statement.”
Related reads
- BoJ's Kuroda: Will continue powerful monetary easing to help economy recover from covid-induced slump
- S&P 500 Futures renew three-week high on Fed, China chatters, yields dribble on US bank holiday
Markets in Asia cheer news that China will essentially end the Shanghai lockdown on Wednesday.
Beijing, however, remains restricted, despite the no. of covid cases declining and officials indicating on the weekend, they are ready to ease restrictions in parts of the capital.
Capital Beijing eased mobility curbs in several districts after authorities said its outbreak was under control. The city reported 21 new cases on Sunday, declining for the seventh straight day.
Over the weekend, the Shanghai municipal government issued a plan issued to revitalize an economy impacted by covid lockdowns.
Key takeaways
Delaying collection of social insurance fees for food service, retail, tourism, civil aviation, land, water and rail transportation businesses.
Delaying tax filing deadline for qualified individuals and companies.
6-month rent reduction for small businesses that rent from state-owned properties.
30% subsidy for private-owned properties that reduce rent for tenants.
Property and land tax waivers for Q2,3 for qualified businesses.
600/head subsidy for hardest-hit businesses that didn't lay off workers.
2000/head subsidy for companies that employ graduating students in 2022 or those who've been unemployed for 3 months or longer.
Market reaction
S&P 500 futures are adding 0.50% on the day while the US dollar index drops 0.20% to trade at 101.48, as of writing.
- Market sentiment remains firmer amid easing Fed bets, receding covid-led controls in China.
- S&P 500 Futures track Wall Street’s gains to print four-day uptrend.
- US Treasury yields remain inactive amid Memorial Day bank holiday.
- Light calendar, fewer macros may restrict market moves.
Global markets remain mildly positive during Monday’s Asian session as traders anticipate a softening of the rate hikes amid concerns over inflation and growth. However, a holiday in the US and a light calendar seem to restrict short-term market moves.
While portraying the mood, the S&P 500 Futures rise 0.35% intraday around 4,170, the highest level in three weeks. It’s worth observing that the US 10-year Treasury yields remain pressured around a monthly low near 2.74%. inactive by the press time.
Mostly downbeat figures of the US concerning consumption, income and inflation seem to have recently doubted the Fed’s 0.50% rate hikes post-September. The traders’ indecision also probed the US Treasury yields of late, which in turn weighed on the US dollar index and allowed markets to remain positive.
That said, the US Personal Consumption Expenditure (PCE) data came in mixed for April, mostly downbeat, as the Core PCE Price Index matched 4.9% YoY forecasts versus 5.2% prior. Further, Personal Income rose less than expected but the Personal Spending improved. Following the data, traders propelled the Wall Street benchmarks but kept the bond yields intact.
Other than the Fed-linked chatters, headlines from China, suggesting a faster easing of the covid-impressed activity restrictions, also help markets to remain positive.
“Shanghai said on Sunday ‘unreasonable’ curbs on businesses will be removed from June 1, as it looks to lift its COVID-19 lockdown, while Beijing reopened parts of its public transport as well as some malls and other venues as infections stabilized,” said Reuters.
Moving on, this week’s US jobs report becomes the key catalyst for the markets and can help the US dollar to recover some of its latest losses should the headline Nonfarm Payrolls (NFP) rise past 310K forecast, versus 428K prior.
Also read: Risk sentiment has regained some of its zeal( Markets, Forex, Oil)
- Silver takes the bids to refresh daily top, up for the third consecutive day.
- Bull cross, firmer RSI directs buyers towards 200-SMA hurdle.
- Sellers need validation from $21.30 to retake control.
Silver (XAG/USD) renews intraday top past $22.00, extending the previous two-day uptrend, as buyers cheer softer US dollar and technical signals to keep the reins during Monday’s sluggish session.
That said, the US Dollar Index (DXY) remains pressured around the monthly low as traders expect a softening in the Fed’s rate hike trajectory due to the latest US inflation gauge. That said, The US Personal Consumption Expenditure (PCE) data came in mixed for April, mostly downbeat, as the Core PCE Price Index matched 4.9% YoY forecasts versus 5.2% prior.
Additionally, the 50-SMA’s piercing off the 100-SMA from below suggests the short-term bullish outlook for the bright metal.
As the RSI and MACD conditions also support the bull cross, XAG/USD is likely heading towards the 200-SMA and the monthly high, respectively near $22.95 and $23.30.
Should the quote fails to stay firmer and witnesses a pullback, the 100-SMA around $21.75 can put a floor under the XAG/USD prices.
Following that, the May 19 swing low near $21.30 will act as the last defense of silver buyers before directing the quote towards the monthly low close to $20.45.
Silver: Four-hour chart
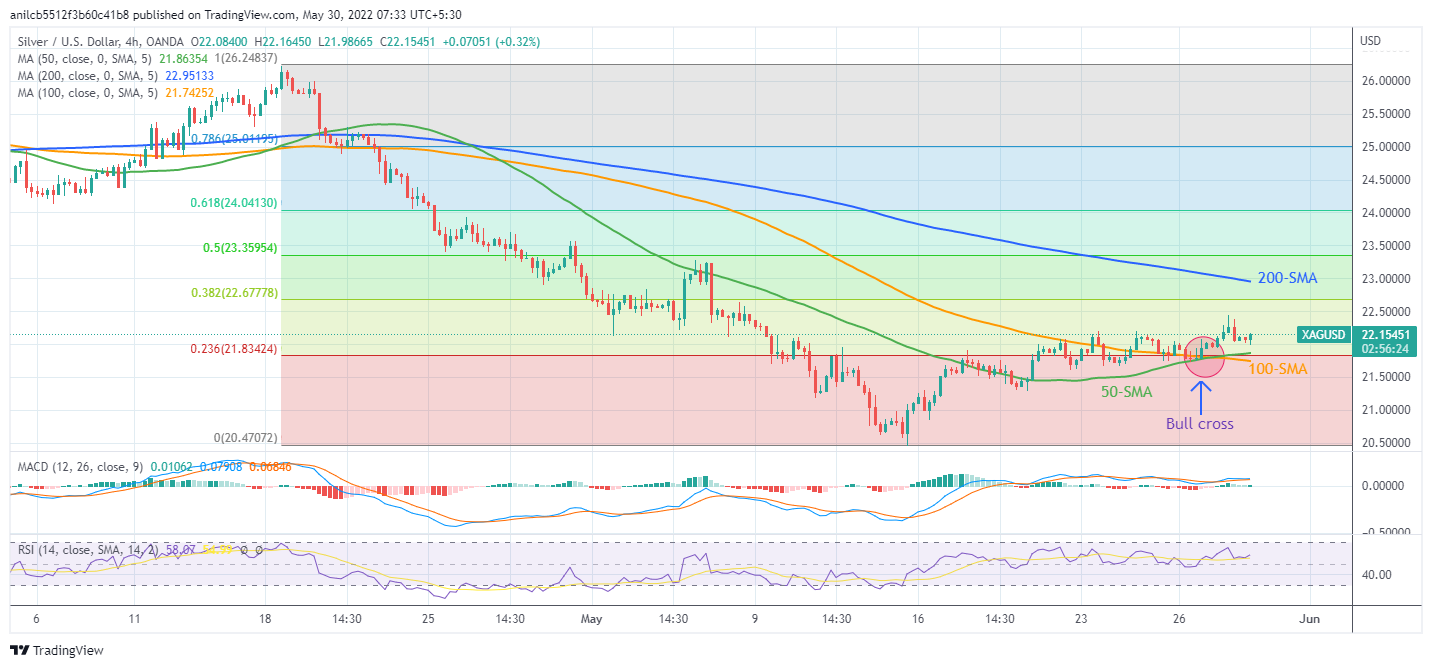
Trend: Further upside expected
Ahead of the summit between European Union (EU) leaders on Monday to discuss the Russia-Ukraine crisis, draft conclusions of the meeting, seen by Reuters, showed that the bloc’s leaders are set to discuss how best to aid Ukraine four months into Russia’s invasion and how to deal with the conflict’s impacts.
Key takeaways
“The most tangible will be the leaders’ political backing for a 9-billion-euro package of EU loans, with a small grants component to cover part of the interest, so that Ukraine can keep its government going and pay wages for around two months.”
“The draft summit conclusions showed EU leaders will back the creation of an international fund to rebuild Ukraine after the war, with no details, and want to look into the possibility of confiscating frozen Russian assets for that purpose.”
“The draft showed leaders are ready to explore ways to curb rising energy prices but there will be little in terms of new decisions on any of the main topics.”
Separately, German Economy Minister Robert Habeck said on Sunday, “After Russia’s attack on Ukraine, we saw what can happen when Europe stands united. With a view to the summit tomorrow, let’s hope it continues like this. But it is already starting to crumble and crumble again.”
Market reaction
EUR/USD is trading 0.22% higher on the day, at 1.0747, as of writing. The US dollar correction extends into a fresh week, as risk sentiment remains upbeat.
- NZD/USD picks up bids to refresh daily tops, edges higher around monthly top.
- RBNZ’s Convay sees softer inflation in H2 2022, shows readiness to pull back the rates if needed.
- US dollar pause previous south-run around monthly low as market sentiment dwindles amid US bank holiday, light calendar.
NZD/USD remains on the front foot near the monthly top, grinding higher surrounding 0.6550 by paying a little heed to comments from the Reserve Bank’s new Chief Economist Paul Conway early during Monday’s Asian session.
RBNZ’s Convay saw lower domestic inflation during the second half of 2022 while saying, “If economic indicators change can revisit cash rate track.” The newly arrived policymaker, however, showed confidence that New Zealand’s central bank could guide the economy to a “soft landing” despite raising rates.
It’s worth noting that the US bank holiday and a light calendar, as well as a sluggish US dollar, seem to help the NZD/USD prices remain firmer despite mixed comments from the RBNZ official.
Also supporting the Kiwi pair could be the cautious optimism in the markets amid hopes of softer Fed rate hikes due to the recently downside US data relating to inflation.
That said, the risk-on mood portrayed by the 0.40% intraday gains of S&P 500 Futures also underpin the NZD/USD pair’s upside momentum. A steady decline in China’s covid numbers seemed to have helped keep the market’s risk-appetite intact of late.
Considering the firmer sentiment and softer USD, not to forget the light calendar and the US bank holiday, NZD/USD prices may extend the previous upside momentum. However, any rally in the Kiwi pair prices becomes less anticipated amid fears of growth and inflation.
Technical analysis
The monthly high surrounding 0.6570 appears important resistance for the NZD/USD buyers to cross to keep reins. Failing to do so can trigger a pullback towards a fortnight-old rising trend line, around 0.6420 by the press time.
The Bank of Japan's governor Haruhiko Kuroda said that the central bank will continue powerful monetary easing to help the economy recover from a covid-induced slump.
Key quotes
- Rapid yen moves seen until recently undesirable.
- FX market regaining stability.
- A quarter of import price gains in April was caused by yen weakening s caused by yen weakening.
These comments follow those from Friday when Kuroda said Japan's core consumer inflation will likely remain around the central bank's 2% target for 12 months unless energy prices drop sharply.
However, he is of the mind that prices likely would not rise "sustainably and stably" unless accompanied by wage hikes, suggesting the recent increase in inflation alone would not lead to an immediate withdrawal of monetary stimulus.
Market implications
Kuroda's warnings about FX market volatility are not regarded as the signal for BoJ forex market intervention at this stage. "Excess volatility in a short term as seen recently is undesirable," Kuroda told Japan's upper house of parliament last week. He would keep close watch on the impact of currency moves on Japan's economy and prices, he said.
The yen has been carving out its comeback vs. the greenback since the late April highs and Japanese fundamentals have had little to do with the moves. The greenback has been the driver and investors have started to look elsewhere for economic growth and fire rates as a chorus of central banks turn less dovish and set out a road map for higher interest rates.
Reuters reported that the Reserve Bank of New Zealand's chief economist Paul Conway said on Monday the central bank's current rate track was their "best foot forward on their current view" but it could change depending on economic indicators.
"If we get six weeks or 12 weeks down the track and the place is cooling a bit more quickly than anticipated... we get to play the game again," he said in an interview with Reuters.
''He added, however, the monetary policy committee was really cognizant of the risks around inflation expectations getting away from them.''
Meanwhile, Bloomberg reports that New Zealand’s central bank is confident it can guide the economy to a “soft landing” even as it raises interest rates aggressively to tame inflation.
“It’s difficult to engineer a soft landing, typically a significant reduction in inflation is accompanied by negative economic growth, but there’s reasons to believe New Zealand is well placed to pull it off this time around,” Paul Conway, the Reserve Bank’s new chief economist, said in an interview Monday in Wellington.''
''The labor market is strong and that’s the underlying reason why the New Zealand economy is well placed to weather the storm.”
At 0.6540, the kiwi is flat on the day vs. the US dollar in a quiet start to the week.
''Higher rates are helping the Kiwi (that’s evident in NZD/AUD) but it’s likely that the May MPS marked peak RBNZ ‘hawkish surprise’. It’s hard to see future MPSs being so hawkish relative to market expectations; that makes us more cautious than otherwise on the NZD’s prospects,'' analysts at ANZ Bank argued, and said to the contrary, ''fears of a hard landing here also continue to percolate; that’s another potential NZD headwind.''
In recent trade today, the People’s Bank of China (PBOC) set the yuan (CNY) at 6.7048 vs. the last close of 6.6980.
About the fix
China maintains strict control of the yuan’s rate on the mainland.
The onshore yuan (CNY) differs from the offshore one (CNH) in trading restrictions, this last one is not as tightly controlled.
Each morning, the People’s Bank of China (PBOC) sets a so-called daily midpoint fix, based on the yuan’s previous day's closing level and quotations taken from the inter-bank dealer.
- EUR/USD bulls need to commit at a key juncture on the lower time frame charts.
- Bears are focussed on a break of critical support.
EUR/USD is testing a key support area on the four-hour charts within what could be the makings of a fresh daily bullish impulse. The following analysis identifies the key market structures on a multi time frame basis.
EUR/USD prior analysis daily chart
It was stated that ''the price broke the horizontal resistance that is now responding as a support zone on the retest. The bulls have committed to the course and a run into prior support and resistance between 1.0761 and 1.0936 could be in order with the 1.08 figure a key target.''
EUR/USD, prior analysis H4 chart
The W-formation's neckline near 1.0705 was eyed as a potential base from which bulls could engage in order to target the 1.08 areas.
EUR/USD live charts
The price has moved in a W-formation and retested the pattern's neckline and has treated it as support. The bulls need to commit at this juncture if the daily extension is going to take place.
EUR/USD H1 charts

If the price is going to respect support and continue higher, the outcome could look something like the above on the hourly chart. However, there is the possibility that the bears will take control and send the price lower to restest 1.07 the figure as follows:
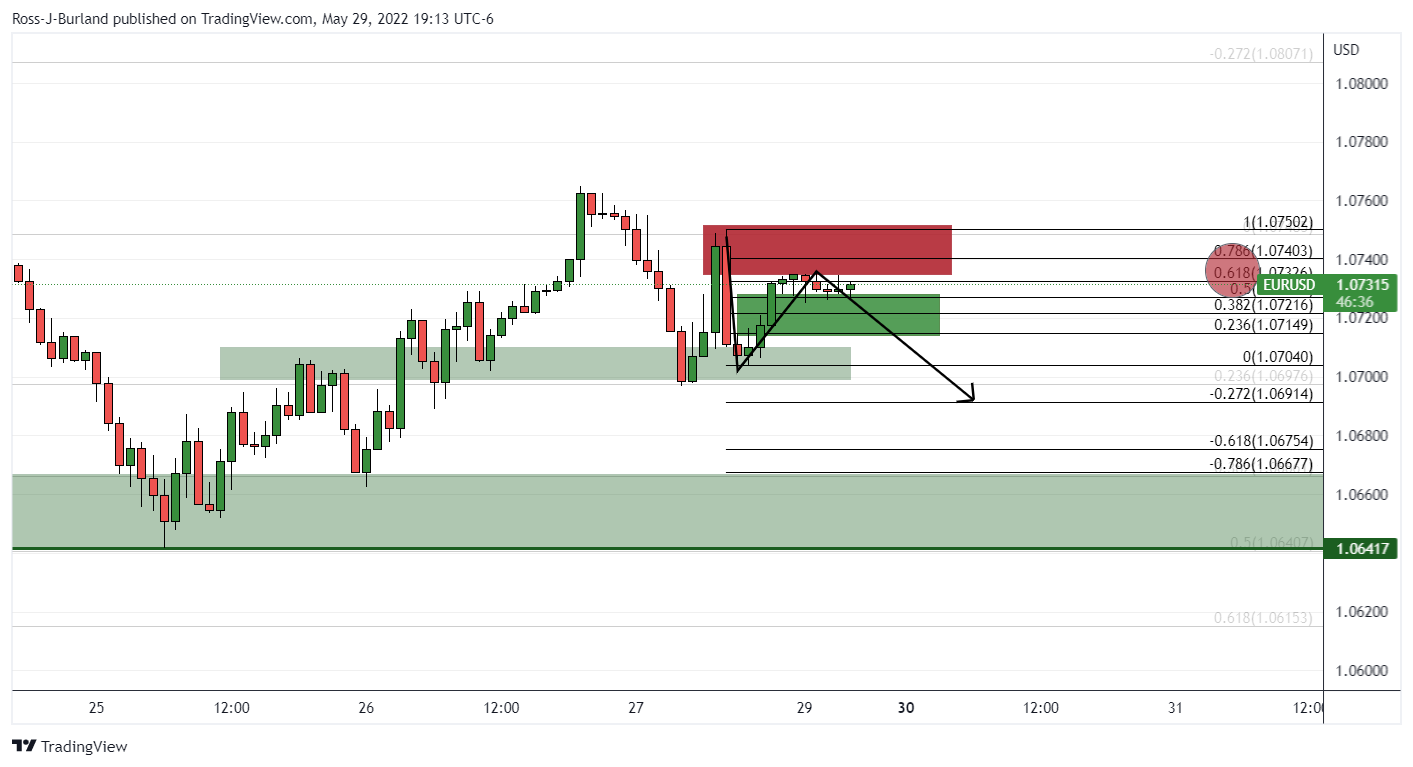
As illustrated, the price is being resisted at a 61.8% golden ratio and should the bears commit and break support, then a downside continuation will be on the cards. This will leave the pair in no man's land and trapped between longer-term support and resistance on the daily chart:
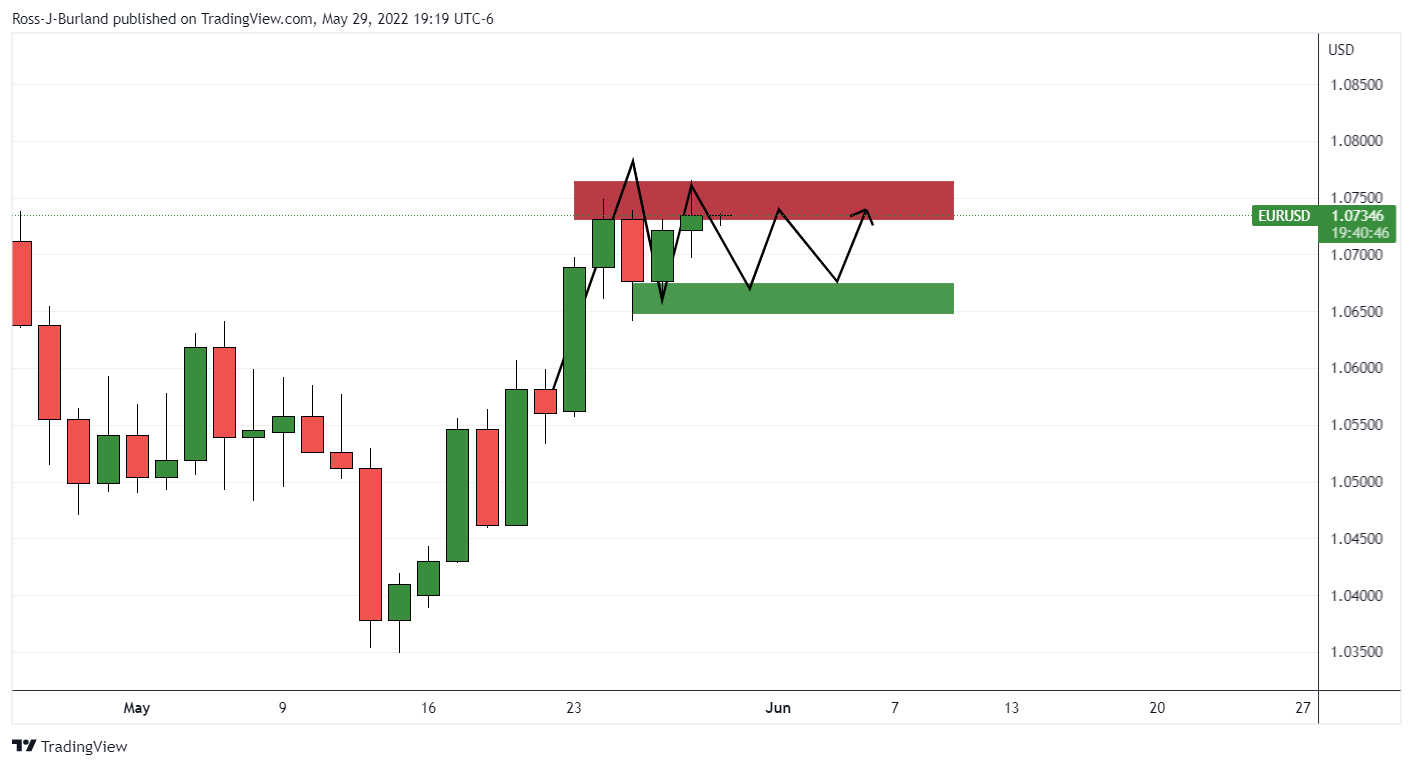
- AUD/USD remains firmer around monthly top, indecisive of late.
- 200-SMA breakout favors buyers but 13-day-old rising wedge tests buyers.
- Nearly oversold RSI, sluggish MACD challenge the pair buyers.
AUD/USD struggles to extend the latest gains around 0.7160-65, the highest level in three weeks, as bulls struggle with short-term key hurdles during Monday’s sluggish session.
In doing so, the Aussie pair remains inside a two-week-long rising wedge bearish chart pattern, recently poking the resistance line.
Other than the stated wedge’s resistance line, the nearly overbought RSI line and the sluggish MACD signals also challenge AUD/USD buyers around a multi-day high.
However, the pair sellers need validation from the 200-SMA level of 0.7140 to take entry. Even so, the support line of the bearish formation, close to 0.7100 by the press time, will be a tough nut to crack for the bears.
Should the quote drops below 0.7100, the odds of its south run towards the early month’s swing low near 0.7030 and the 0.7000 threshold may probe the south-run towards the monthly low near 0.6830.
Meanwhile, a clear upside break of the immediate resistance near 0.7170, comprising the wedge’s upper line, won’t hesitate to challenge the monthly peak of 0.7266.
Following that, the 0.7300 and the 0.7400 round figure may entertain AUD/USD buyers ahead of directing them to a late April swing high close to 0.7460.
AUD/USD: Four-hour chart
Trend: Pullback expected
- EUR/JPY has slipped to near 136.27 amid the ongoing EU Leaders Summit.
- Higher inflation forecasts in Germany and Spain are bolstering the odds of a rate hike by the ECB.
- Japan’s Unemployment Rate may remain unchanged at 2.6%.
The EUR/JPY pair has witnessed some selling pressure after failing to sustain above 136.60 in the Asian session. The cross advanced higher initially to an intraday high of 136.64 but found barricades and slipped lower. An ongoing European Union (EU) Leaders Summit in Brussels is deploying a heavy load on the shared currency bulls.
The major agenda of the summit is expected to remain on the war situation in Ukraine. It’s been a long three-month time period and Kyiv is still facing military attacks from Russia. Apart from that, Europe is going through the burden of mounting price pressures due to higher energy, food, and other commodity prices. Also, the members will force Hungary to withdraw its opposition to an embargo on oil from Russia.
In the European session, the release of Germany’s Harmonized Index of Consumer Prices (HICP) data will get the traction. An improvement is seen in the annual figure as the forecasts dictate a figure of 8% against the prior print of 7.8%. Also, the Spain HICP may elevate to 8.3% against the prior print of 8.2%. This will bolster the odds of a jumbo rate hike by the European Central Bank (ECB) going forward.
Meanwhile, the Japanese yen is awaiting the release of the Employment data. The Jobs/Applicants ratio may improve to 1.23 in comparison with the former figure of 1.22. Also, the Unemployment Rate is seen flat at 2.6%.
- US Dollar Index licks its wounds around monthly low, sidelined of late.
- Reassessment of Friday’s US inflation data joins bank holiday to trigger corrective pullback.
- US employment figures, ISM PMIs can allow buyers to return.
US Dollar Index (DXY) remains pauses a fortnight-old downward trajectory, bounces off a monthly low, during Monday’s sluggish Asian session. That said, the greenback gauge seesaws around 101.70, after renewing the monthly low around 101.43 the previous day.
The DXY rebound could be linked to the market’s inaction amid the US bank holiday, as well as fresh chatters of the need for faster rate hikes by the Fed, considering the latest inflation data. Following the Fed’s preferred inflation gauge, namely the Core PCE Price Index, The Times came out with an analysis suggesting inflation puts further pressure on the Fed to lift interest rates.
The greenback gauge refreshed its monthly low on Friday after the US data concerning consumption, income and inflation came in mixed for April. The US Personal Consumption Expenditure (PCE) data came in mixed for April, mostly downbeat, as the Core PCE Price Index matched 4.9% YoY forecasts versus 5.2% prior. Further, Personal Income rose less than expected but the Personal Spending improved.
Traders previously cheered the risk-on mood by fueling the Wall Street benchmarks but kept the bond yields intact. It’s worth noting that the S&P 500 Future print mild gains but the US 10-year Treasury yields stay unchanged at 2.74% amid the US Memorial Day.
Moving on, a light calendar and bank holiday in the US will restrict the market moves but the risk catalysts may entertain traders. Above all, this week’s US jobs report for April may also help the greenback gauge to pare the latest losses, amid hopes of firmer prints.
Technical analysis
Although a clear downside break of the monthly low, around 102.35, directs DXY bears towards the 50-DMA level near 101.40, any further downside remains doubtful as the RSI has speedily dropped towards the oversold territory on the shorter timeframes.
- USD/CHF is looking to establish above 0.9580 as risk-off impulse rebounds.
- Investors will focus on the release of the US NFP and Swiss GDP.
- A significant improvement is expected in the Swiss GDP numbers by the market participants.
The USD/CHF pair is scaling firmly higher in early Tokyo as a minor rebound in the negative market sentiment is annoying the risk-perceived currencies. The pair has touched an intraday high of 0.9583 in the Asian session after a minor fall in the first trading hour.
A two-week fall in an asset is generally expected to be followed by a minor rebound. The US dollar index (DXY) is following the same rationale and is attracting bids near its monthly lows at 101.43. The odds of a 50 basis point (bps) interest rate hike by the Federal Reserve (Fed) in its June monetary policy are rising each trading session. Rising price pressures accompanied with tight labor market is impacting the households’ paychecks.
This week investors will focus on the release of the US Nonfarm Payrolls (NFP), which are due on Friday. An addition of 310k jobs in the labor market is expected to be reported by the US Bureau of Labor Statistics. Last month, the US NFP figure remained at 428k.
On the Swiss franc front, the market participants are awaiting the Tuesday’s Gross Domestic Product (GDP). The quarterly GDP is expected to improve to 0.4% from the prior print of 0.3%. While the yearly GDP figure may significantly improve to 4.4% vs. the former figure of 3.7%. Expectations seem much more lucrative than the previous figures and good God what will happen if the print outperforms the expectations.
- Gold prices consolidate recent gains amid a quiet Asian session.
- Inflation fears underpin the US dollar’s corrective pullback from monthly low after two-week downtrend.
- Hopes of firmer US employment figures, technical barriers also challenge bulls.
- Gold Weekly Forecast: Sellers stay on the sidelines as focus shifts to US data
Gold (XAU/USD) licks its wounds around $1,850, following a two-week rebound, as the US Dollar Index (DXY) pauses the latest pullback amid a sluggish Asian session on Monday.
That said, the US Dollar Index (DXY) prints 0.05% intraday gains around 101.68, bouncing off the monthly low of 101.43 flashed on Friday, as markets reassert Friday’s US data to forecast the Fed’s next moves.
On Friday, the US Personal Consumption Expenditure (PCE) data came in mixed for April, mostly downbeat, as the Core PCE Price Index, the Fed’s preferred measure of inflation, matched 4.9% YoY forecasts versus 5.2% prior. Further, Personal Income rose less than expected but the Personal Spending improved.
Following the data, traders cheered mixed data with a rush towards riskier assets and propelled the Wall Street benchmarks but kept the bond yields intact. It’s worth noting that the S&P 500 Future print mild gains but the US 10-year Treasury yields stay unchanged at 2.74% amid the US bank holiday.
Moving on, a light calendar and a bank holiday in the US may restrict gold’s immediate moves. However, risk catalysts will be important to watch for fresh impulse, which in turn highlight headlines from Russia and China.
Above all, this week’s US jobs report for April may also help the greenback gauge to pare the latest losses, amid hopes of firmer prints, which in turn could weigh on gold prices.
Technical analysis
Gold’s pullback from a two-week-old previous support line, around $1,865 by the press time, needs validation from the $1,845 support confluence, including the 50-SMA and 100-SMA. That said, the MACD flashes the bearish signals while the RSI remains downwardly sloped, not oversold, which in turn suggests room for further downside.
Gold: Four-hour chart

Trend: Further weakness expected
| Pare | Closed | Change, % |
|---|---|---|
| AUDUSD | 0.71585 | 0.87 |
| EURJPY | 136.418 | 0.01 |
| EURUSD | 1.07313 | 0.01 |
| GBPJPY | 160.55 | 0.21 |
| GBPUSD | 1.263 | 0.21 |
| NZDUSD | 0.65344 | 0.86 |
| USDCAD | 1.27201 | -0.41 |
| USDCHF | 0.95722 | -0.18 |
| USDJPY | 127.12 | 0 |
- WTI is bullish at the start of the week but the market structure is compelling for the downside.
- The bears are looking for a correction of the daily bullish impulse.
At $115.74, the price of West Texas Intermediate (WTI) crude oil is higher by 0.57% after rising from a low of $114.88 to a high of $115.78. The black gold was rising on Friday as the US is poised to begin the summer driving season on the Memorial Day weekend.
Oil price of oil got a boost last Wednesday when the Energy Information Administration announced that US gasoline inventories fell by 0.5-million barrels in the prior week, leaving them 8% under the five-year average despite higher refinery output. This comes at a time when the driving season in the US is starting and there are few indications that the cost of the fuel is deterring drivers. This enabled crude oil prices to post their fifth weekly gain to close at their highest level since early March amid signs of strong demand.
Additionally, prices jumped late on Friday on reports that Iran’s paramilitary Revolutionary Guard said its navy had seized two Greek oil tankers in the Persian Gulf because of unspecified “violations”, analysts at ANZ Bank explained.
''This raises the spectre of further disruptions to oil flows through the Strait of Hormuz, which carries a third of the world’s trade.''
''The market has been on edge as the EU tries to negotiate a sanction package which includes a ban on Russian oil. However, it failed to reach an agreement in discussions over the weekend, with Hungary still holding out on a better deal. Further meetings are planned on Monday and a deal is still possible.''
Meanwhile, ''the OPEC+ group of producers is also contributing to higher supply risk as the group materially underproduces against its quotas, following a decade of underinvestment which has raised operational risks in West Africa,'' analysts at TD Securities explained.
WTI technical analysis

The price has left a daily W-formation on the chart and would be expected to revert to test the neckline of the pattern near 111.95.


© 2000-2026. All rights reserved.
This site is managed by Teletrade D.J. LLC 2351 LLC 2022 (Euro House, Richmond Hill Road, Kingstown, VC0100, St. Vincent and the Grenadines).
The information on this website is for informational purposes only and does not constitute any investment advice.
The company does not serve or provide services to customers who are residents of the US, Canada, Iran, The Democratic People's Republic of Korea, Yemen and FATF blacklisted countries.
Making transactions on financial markets with marginal financial instruments opens up wide possibilities and allows investors who are willing to take risks to earn high profits, carrying a potentially high risk of losses at the same time. Therefore you should responsibly approach the issue of choosing the appropriate investment strategy, taking the available resources into account, before starting trading.
Use of the information: full or partial use of materials from this website must always be referenced to TeleTrade as the source of information. Use of the materials on the Internet must be accompanied by a hyperlink to teletrade.org. Automatic import of materials and information from this website is prohibited.
Please contact our PR department if you have any questions or need assistance at pr@teletrade.global.
transfers