- Analytics
- News and Tools
- Market News
Analytics, News, and Forecasts for CFD Markets: currency news — 02-06-2022.
- GBP/JPY picks up bids near one-month top, grinds higher after printing five-day uptrend.
- Market sentiment improves on softer data, preparations for NFP.
- Hawkish calls from the BOE, versus BOJ’s favor of easy money, underpin upside momentum.
- Off in the UK, a light calendar restricts moves but risk catalysts are the key to track for fresh impulses.
GBP/JPY picks up bids to refresh one-month top during Friday’s Asian session, rising for the sixth consecutive day despite grinding higher of late.
In doing so, the cross-currency pair struggles to justify upbeat sentiment and hawkish expectations from the Bank of England (BOE) amid the pre-NFP anxiety. It’s worth noting that a light calendar and holiday in the UK also restrict the GBP/JPY pair’s immediate moves.
Softer US data and downbeat Treasury yields previously favored the pair buyers. On the same line were the odds favoring more monetary policy divergence between the Bank of England (BOE) and the Bank of Japan (BOJ).
On Thursday, the US ADP Employment Change eased to 128K for May, versus 300K forecasts and a downwardly revised 202K previous reading. The Weekly US Initial Jobless Claims, on the other hand, dropped to 200K compared to 210K anticipated and 211K prior. Further, Nonfarm Productivity and Unit Labor Costs both improved in Q1, to -7.3% and 12.6% respectively, compared to -7.5% and 11.6% figures for market consensus. Furthermore, US Factory Orders for April softened to 0.3%, from a revised 1.8% in March and 0.7% forecast.
It’s worth noting that the Australia and New Zealand Banking Group (ANZ) highlights the difference between the currency BOE rate and the one per Taylor rule to suggest more work for the “Old Lady”. On the other hand, BOJ policymakers have been defending the easy money practices for a long with the recent tone shifting a bit but staying mostly in favor of no immediate change in policies.
Elsewhere, Tory critics, a UK Member of Parliament’s (MP), suggestion to rejoin the bloc and chatters over a no-confidence vote for UK Prime Minister (PM) Boris Johnson tried to weigh on the GBP/JPY prices.
Against this backdrop, the Wall Street benchmarks rose the most in a week whereas US Treasury yields remained pressured. At the latest, the S&P 500 Futures print mild gains while the US Treasury yields struggle around 2.92%, suggesting the market’s cautious optimism.
Technical analysis
Despite crossing the 200-SMA, around 161.50 by the press time, GBP/JPY buyers jostle with the 61.8% Fibonacci retracement of April-May downside, around 163.50, amid overbought RSI conditions.
Even if the quote rises past 163.50 immediate hurdle, highs marked during late April and March, respectively near 164.25 and 164.65, will challenge the pair’s further upside.
Hence, GBP/JPY runs out of steam despite the latest advances, suggesting a pullback from a multi-day high.
- The DXY has slipped sharply to near 101.70 as the risk-on impulse has diminished the DXY’s appeal.
- The US economy may have generated lower employment in May.
- A preliminary estimate of the ISM Services PMI is hinting at underperformance.
The US dollar index (DXY) surrendered its entire gains recorded on Wednesday as investors were expecting an aggressive stance on the monetary policy announcement by the Federal Reserve (Fed), which is scheduled in the third week of June. The DXY faced sufficient barricades around 102.50, therefore bears dragged the asset lower to near 101.70. A slippage in the DXY is indicating a rebound in the positive market sentiment, which will keep the DXY on the tenterhooks.
US NFP in focus
The investing community is entirely focused on the release of the US Nonfarm Payrolls (NFP). The downbeat disclosure of the US Employment Change by Automatic Data Processing (ADP) on Thursday, is advocating dismal NFP figures. The ADP reported the Employment Change at 128k, which displays sluggishness in employment generation by the US economy. It is highly expected that the NFP will showcase the similar pattern displayed by the ADP. The NFP is forecasted at 325k vs. 428k reported earlier.
Also, the Unemployment Rate is expected to diminish to 3.5% from the prior print of 3.6%.
US ISM Services PMI
In today’s session, investors’ focus will remain on the release of the ISM Services Purchase Managers Index (PMI). A preliminary estimate of the ISM Services PMI is hinting at underperformance. The economic catalyst is expected to land at 56.4 against the prior print of 57.1.
Key events next week: Goods and Services Trade Balance, Initial Jobless Claims, Consumer Price Index (CPI), Michigan Consumer Sentiment Index (CSI).
Major events next week: Reserve Bank of Australia (RBA) interest rate decision, European Central Bank (ECB) monetary policy announcement.
- GBP/USD remains sidelined after bouncing off the 21-DMA support.
- 10-DMA restricts immediate upside amid receding bullish bias of MACD signals.
- Descending trend line from February, 50-DMA stand tall to challenge further advances.
GBP/USD portrays the typical pre-NFP trading lull as buyers and sellers jostle around 1.2580 during Friday’s Asian session.
The cable pair reversed from a fortnight low the previous day while posting the biggest daily jump in two weeks. The recovery moves gained support from the 21-DMA, as well as bullish MACD signals.
However, recently smaller green bars on the MACD, the difference between the MACD line and signal line, join the 10-DMA level surrounding 1.2580 to challenge the GBP/USD pair’s immediate upside.
Even if the quote manages to cross the 1.2580 immediate hurdle, the latest swing high around 1.2670 precedes a convergence of the descending trend line from February 18 and 50-DMA, close to 1.2700-15, to challenge the pair buyers.
Meanwhile, the pair’s downside past 21-DMA support of 1.2460 will need validation from the 1.2410-2400 region, comprising levels marked since April 28, to recall GBP/USD bears.
Following that, the area surrounding the mid-1.2200s can act as the last defense for bulls before directing the prices down to May’s low of 1.2155.
GBP/USD: Daily chart
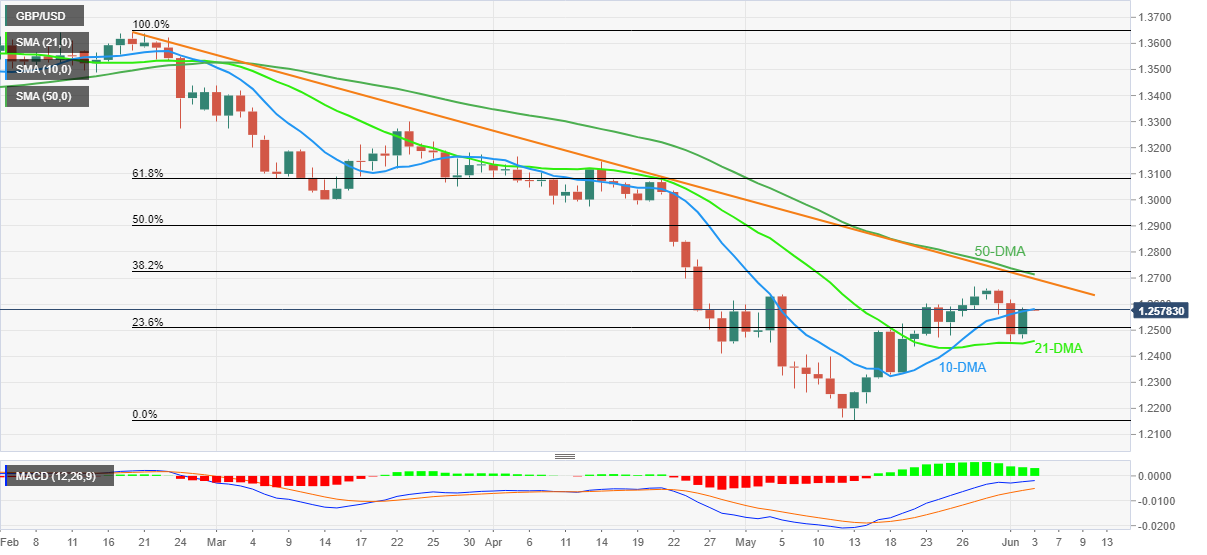
Trend: Pullback expected
- Silver (XAG/USD) shed some weekly losses and is rallying almost 2.80% in the last couple of days.
- A risk-on market mood weighed on US Treasury yields and the US Dollar, lifting precious metals.
- Silver Price Forecast (XAG/USD): To extend its gains towards $23.00.
Silver (XAG/USD) is surging to fresh weekly highs above $22.00 amidst an upbeat market sentiment that weighed on the safe-haven US Dollar, also undermined by US Treasury yields, particularly the 10-year benchmark note rate, almost flat at 2.911%. At the time of writing, XAG/USD is trading at 22.38.
The market mood improved, as shown by US equities registering gains, while Asian stocks are set for a higher open. Investors set aside concerns about a possible US recession, spurred by the US Federal Reserve’s aggressive tightening path, while also assessing ongoing China’s coronavirus crisis, which has eased some restrictions, as it battles to fulfill the 5% growth target by the end of 2022.
Additionally to the abovementioned, the conflict between Ukraine-Russia, which has lasted for three months, has begun to weigh on food and commodity prices.
Elsewhere, the Fed speakers parade continued. Cleveland’s Fed President Loretta Mester said that she supports 50 bps increases in the next couple of meetings and added that the Fed is well-positioned to consider the appropriate pace for further rate hikes.
Mester added that she is unsure how high rates need to go, and a pause on the tightening cycle would depend on data. Nevertheless, she emphasized that the Fed would slam the brakes if inflation remains stubbornly high, and she still keeps 25 or 50 bps rate hikes, contrarily to a pause in September.
Earlier on Thursday, the Fed’s Vice-Chair Lael Brainard said that the central bank is getting mixed signals on the economy and that the number one challenge is bringing inflation down. When asked about a Fed pause, she said it is harder to say because the policy is not on a pre-set course via CNBC.
In the meantime, the US calendar would release the May Nonfarm Payrolls report, ISM Non-Manufacturing, and Composite PMIs, alongside additional Fed speakers, ahead of the blackout of the June Federal Reserve Open Market Committee meeting.
Silver Price Forecast (XAG/USD): Technical outlook
XAG/USD surged sharply and broke on its way up the $22.00 mark. Additionally, the Relative Strength Index (RSI) entered positive territory due to the size of the move, meaning that the rally has some legs to go before turning south. Also, it’s worth noting that the XAG/USD’s first resistance level is the confluence of the 50-DMA and the May 5 high, up at $23.26-28, respectively. A breach of the latter could pave the way for further gains. XAG/USD’s next supply zone would be the 200-DMA at $23.51, followed by the 100-DMA above all the DMAs at $23.72.
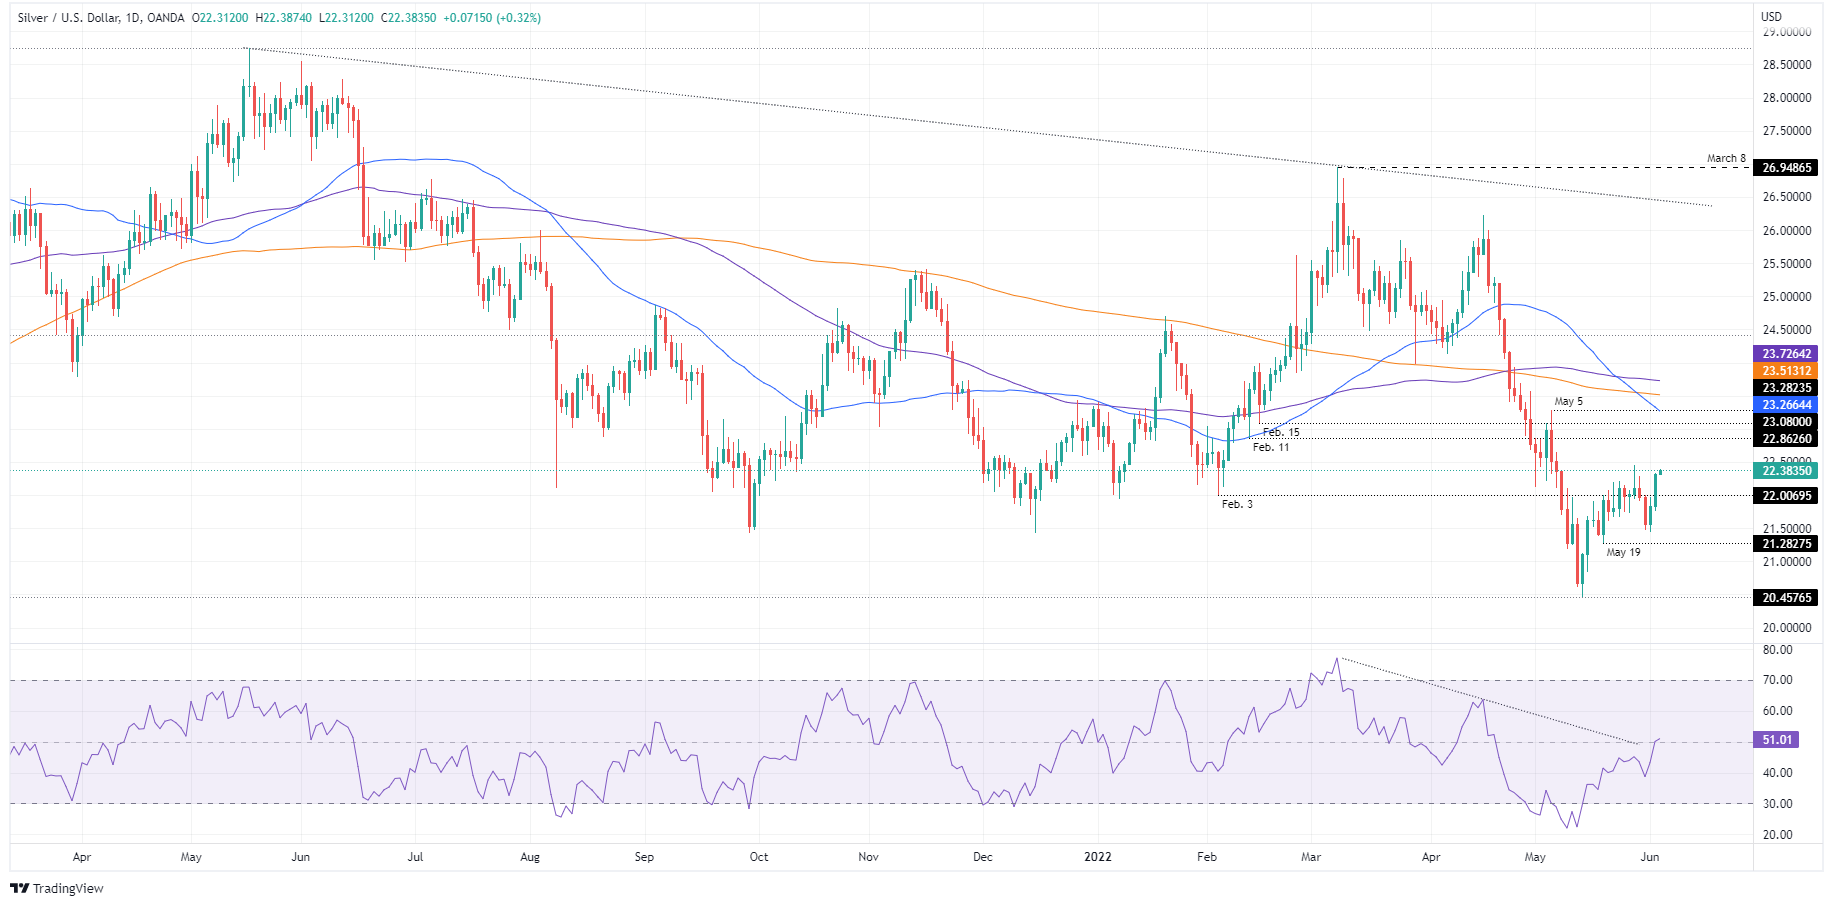
Key Technical Levels
EUR/USD remains sidelined near 1.0750, after rising the most in a fortnight while bouncing off a two-week low.
In doing so, the major currency pair repeats the typical pre-NFP trading behavior amid a lack of major data/events. Also increasing the importance of Friday’s economic calendar is the US ISM Services PMI for May.
Also read: Nonfarm Payrolls Preview: It is all about the money, three scenarios for wage growth and the dollar
That said, one-month risk reversal (RR) for the EUR/USD, a gauge of calls to puts, rises the most in three days, by the end of Thursday’s North American trading session, per the latest options market data on Reuters.
The daily RR figures for June 02 jumped to +0.035 while snapping the previous two-day downtrend. However, the weekly figures print a bearish bias with a -0.175 level after rising for the two consecutive weeks the last.
Also read: EUR/USD Price Analysis: Bulls move in on a critical H4 resistanvce
- USD/JPY has climbed to near 130.00 despite weaker DXY.
- A poor US ADP Employment Change is advocating a dismal show from the US NFP.
- The Japanese docket will report its GDP numbers next week.
The USD/JPY pair is oscillating in a narrow range of 129.70-130.05 in the early Asian session. The asset has turned rangebound after a sheer upside move from the crucial support of 127.00. The asset ended its four-day winning streak on Thursday however, a minute downside closing doesn’t advocate any reversal. The upside momentum is still intact and is expected to accelerate at a quick pace.
Despite the underperformance by the US dollar index (DXY) on Thursday after the release of the US Automatic Data Processing (ADP) Employment Change, the greenback bulls managed to outperform the Japanese yen. This indicates a compelling weakness in the Japanese yen.
The DXY slipped to near 101.70 after failing to sustain above 102.50 on poor ADP Employment Change numbers. The additional employment numbers landed at 128k, vigorously lower than the estimates of 300k. The release of the dismal ADP Employment Change numbers is indicating a disclosure of poor show from the US Nonfarm Payrolls (NFP). As per the market consensus, the US NFP is expected to report 325k job additions in the labor market. The consensus is already lower than the prior print of 428k and the 12-month average job additions of 551.6k. This may bring more offers into the DXY.
On the Japanese yen front, investors will keep an eye on the release of the Gross Domestic Product (GDP) numbers, which are due on Tuesday. The quarterly and annual GDP figures are expected to remain constant at -0.2% and -1% respectively.
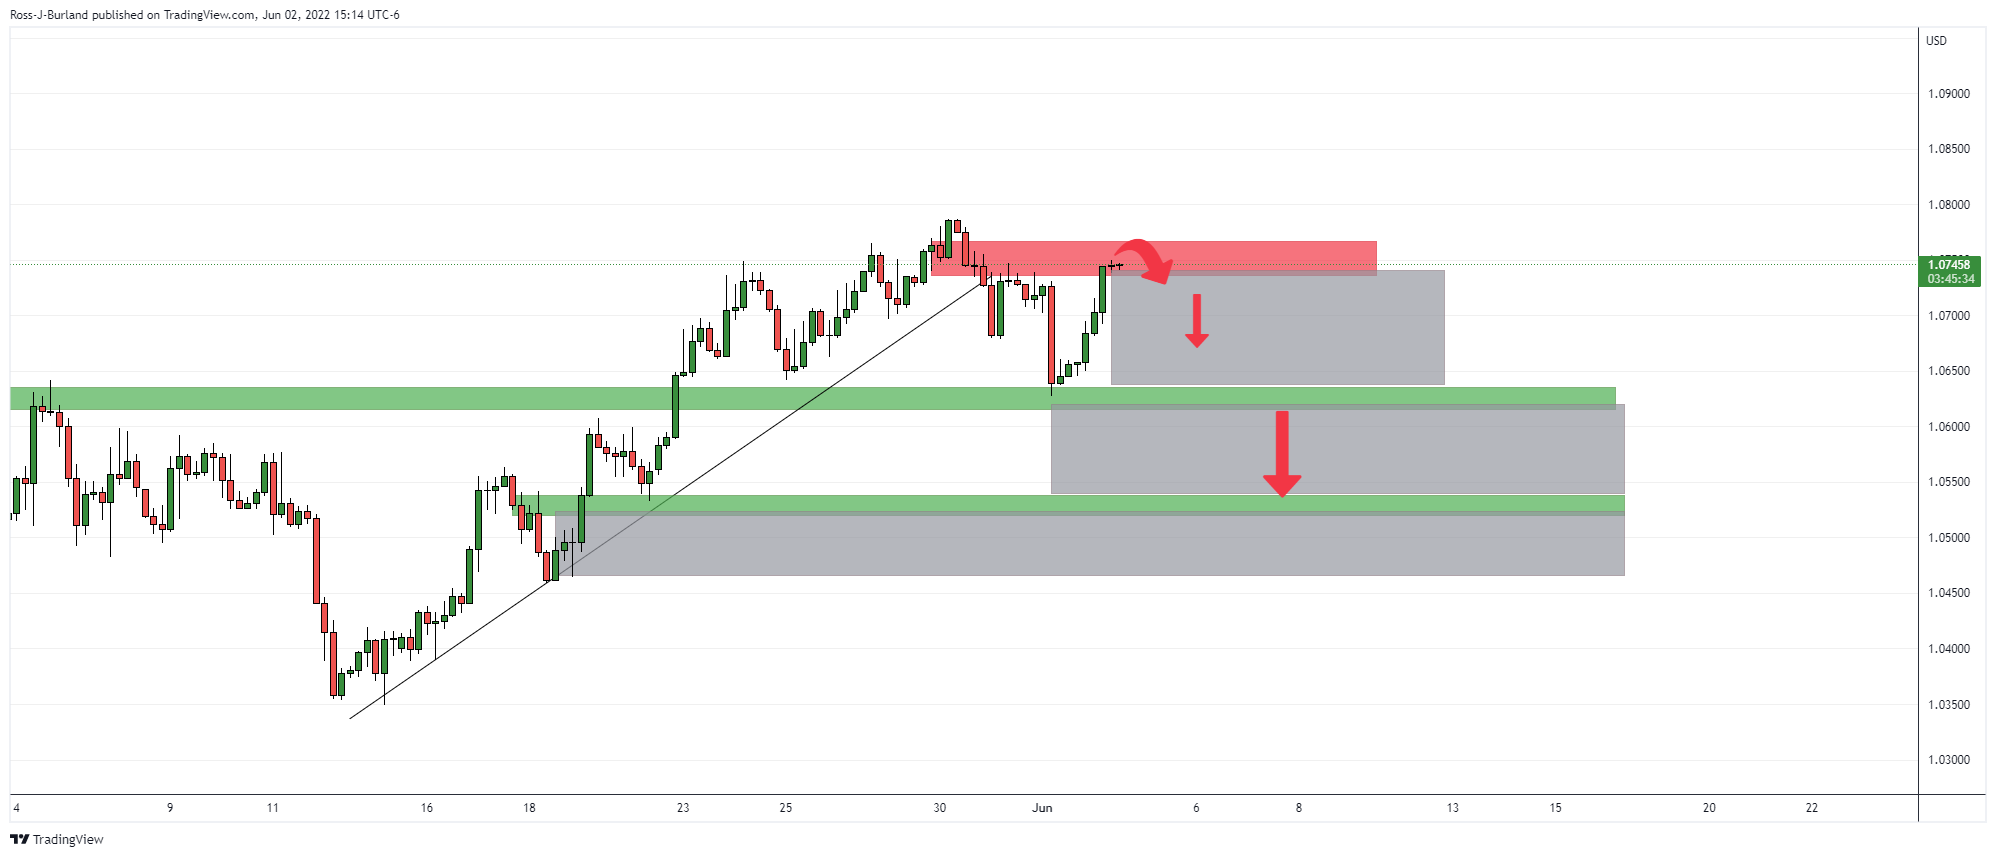
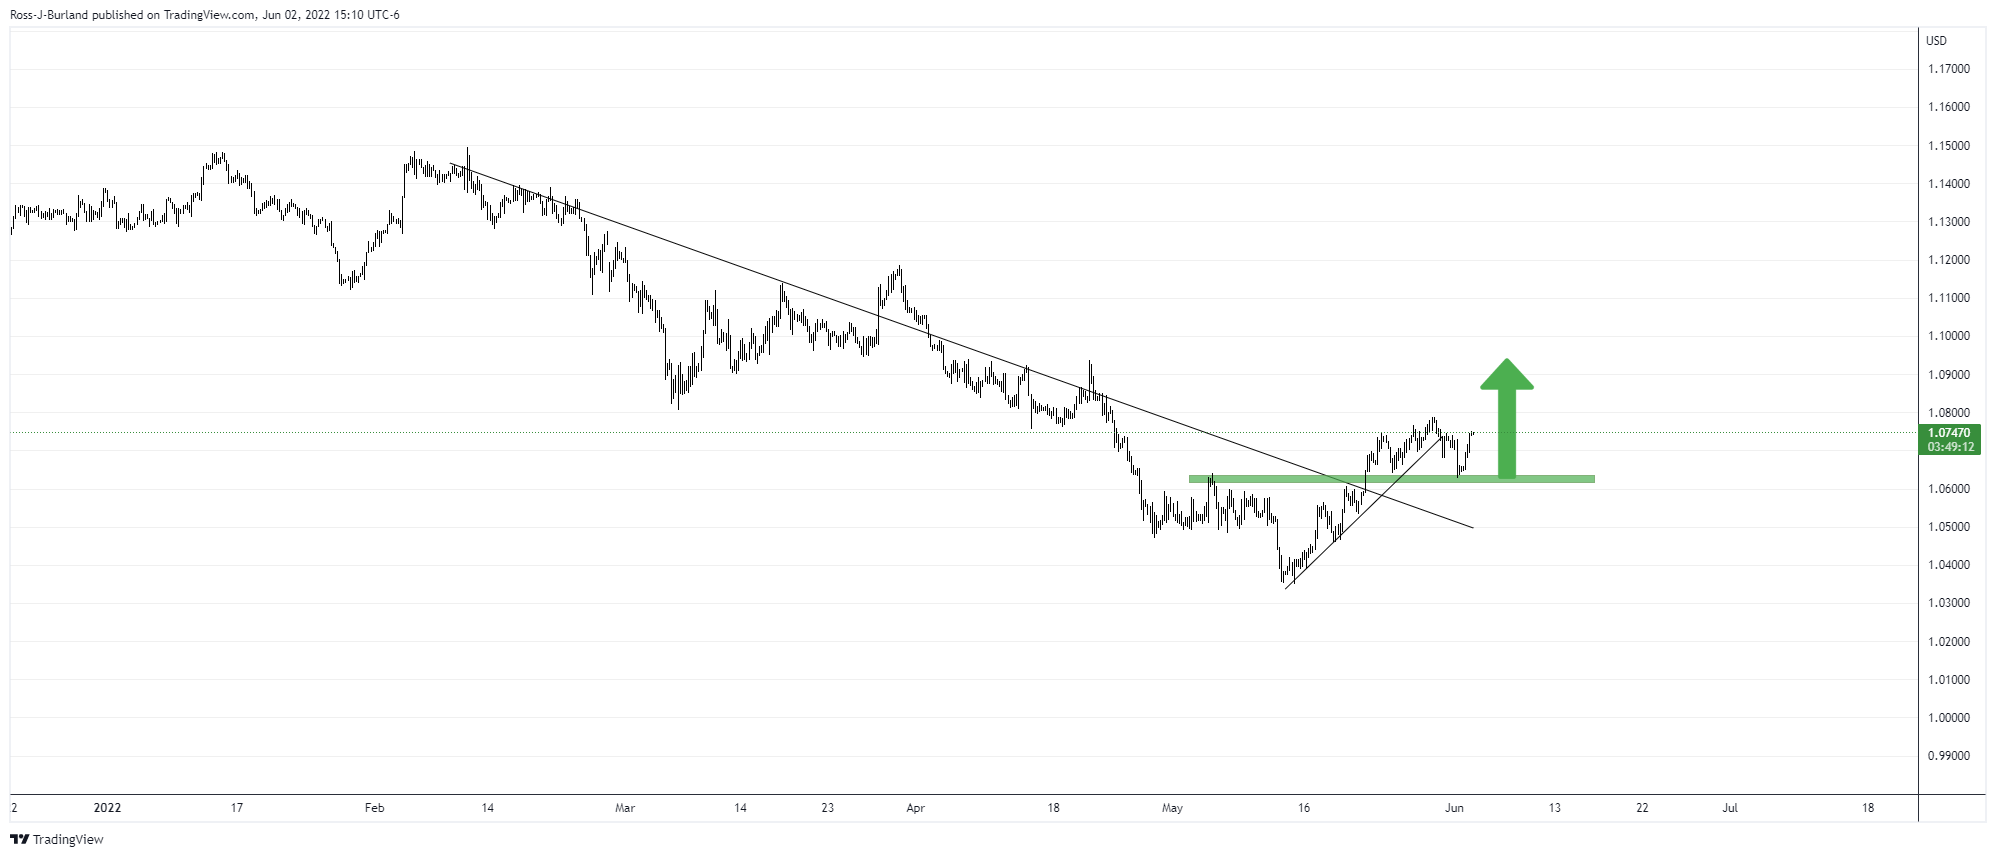
- NZD/USD grinds higher around one-month high after rising the most in a fortnight.
- 50-EMA, bearish RSI divergence test buyers on their way to crossing May’s top.
- Convergence of 21-EMA and three-week-old rising trend line restricts immediate downside.
NZD/USD sits comfortably at its monthly peak, after taking the seat the previous day, as challenges to further upside emerge during Friday’s Asian session. That said, the Kiwi pair takes rounds to 0.6550-60 by the press time, following the run-up to 0.6565.
A sustained bounce off the 0.6480 confluence, comprising the 21-EMA and an upward sloping trend line from mid-May, joined bullish MACD signals to underpin the NZD/USD pair’s latest run-up.
However, the 50-EMA level surrounding 0.6570 and the RSI’s failures to march with the higher high, known as bearish divergence, challenge the pair’s latest upside moves.
In a case where the NZD/USD rises past the 0.6570 hurdle, it can extend the rally towards the 50% Fibonacci retracement (Fibo.) of April-May upside, near 0.6625, ahead of challenging the 100-EMA level surrounding 0.6655.
Alternatively, pullback moves may retest the 0.6500 round figure before the 0.6480 support convergence could challenge the bears.
It’s worth noting, however, that a clear downside break of 0.6480 won’t hesitate to drag the NZD/USD prices towards the 23.6% Fibo. level surrounding 0.6410.
NZD/USD: Daily chart
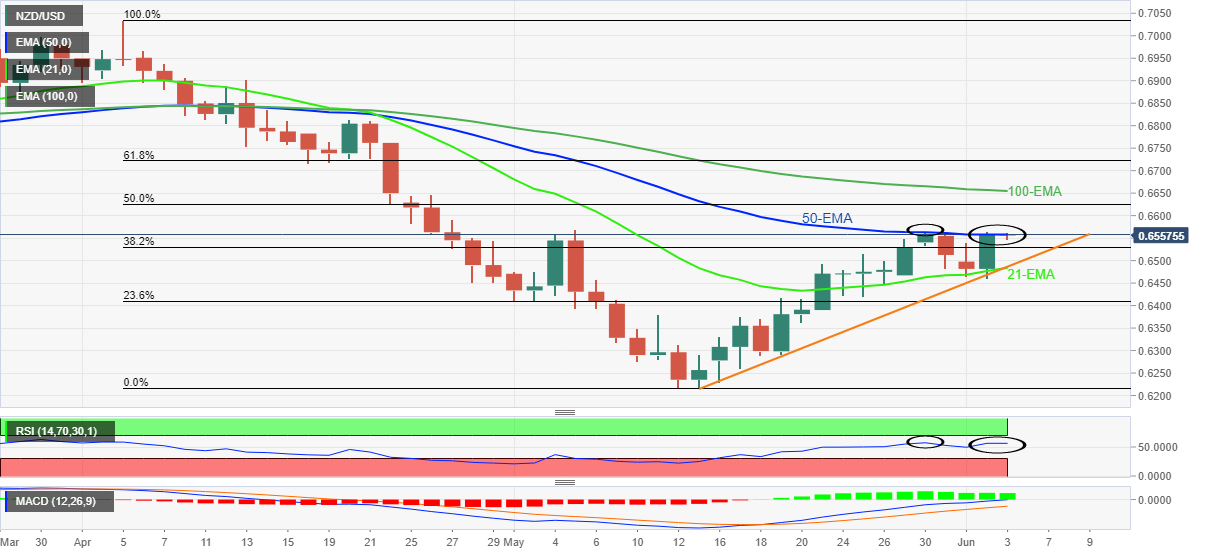
Trend: Pullback expected
- USD/CAD remains pressured around six-week low after the biggest daily fall since early May.
- Upbeat oil prices, softer US dollar and risk-on mood weighed on the Loonie prices.
- Hawkish BoC Speak adds to the bearish bias, Fed speakers couldn’t lift the USD.
- Monthly prints of US employment, services activity gauge will be important to watch amid firmer sentiment, softer USD.
USD/CAD holds lower ground near the lowest levels in six weeks, recently pressured near 1.2570 after posting the biggest daily fall in three weeks. That said, firmer prices of oil and hawkish comments from the Bank of Canada (BOC) policymaker join broad US dollar weakness to underpin the Loonie pair’s latest weakness ahead of the key US employment numbers for May. The quote, however, portrayed the pre-NFP trading lull during the early hours of Friday.
Bank of Canada (BoC) Deputy Governor Paul Beaudry on Thursday said that the BoC sees an increasing likelihood that it may need to raise its policy rate to 3% or higher, reported Reuters. It’s worth noting that the BOC raised interest rates by 50 basis points (bps) to 1.5% last Wednesday.
WTI crude oil, Canada’s biggest export item, rose the most in a week even as the oil ministers from OPEC+ nations agreed on Thursday to lift output by 648K barrels per day (BPD) in both July and August, versus 432BPD expected, according to sources speaking to Reuters. The reason for the black gold’s jump could be linked to the market’s doubts over OPEC+ ability to deliver the output, as well as the “sell the rumor, buy the fact” attitude.
Elsewhere, the US Dollar Index (DXY) dropped the most in a fortnight as market players took relief from softer US data, after two consecutive days of hawkish Fed scenario. On Thursday, the US ADP Employment Change eased to 128K for May, versus 300K forecasts and a downwardly revised 202K previous reading. The Weekly US Initial Jobless Claims, on the other hand, dropped to 200K compared to 210K anticipated and 211K prior. Further, Nonfarm Productivity and Unit Labor Costs both improved in Q1, to -7.3% and 12.6% respectively, compared to -7.5% and 11.6% figures for market consensus. Furthermore, US Factory Orders for April softened to 0.3%, from a revised 1.8% in March and 0.7% forecast.
Amid these plays, the Wall Street benchmarks rose the most in a week whereas US Treasury yields remained pressured.
Looking forward, USD/CAD traders need to pay attention to the risk catalysts ahead of the key US jobs report and ISM Services PMI for May. That being said, the latest comments from Canadian Prime Minister Justin Trudeau, disliking Chinese behavior with Canadian patrol planes, and joining the USTR statements over China trade, gain the attention of late.
Read: Nonfarm Payrolls Preview: It is all about the money, three scenarios for wage growth and the dollar
Technical analysis
A clear downside break of the two-month-old support line, now resistance around 1.2600, joins successful trading below the 200-DMA level of 1.2660 to keep USD/CAD bears hopeful of visiting the 78.6% Fibonacci retracement of October 2021 to May 2022 upside, near 1.2450.
- AUD/USD is marching towards 0.7300 on expectations of poor US NFP and hawkish RBA.
- The US economy is expected to display dismal performance in employment generation.
- Investors should brace for a hawkish commentary from the RBA next week.
The AUD/USD pair is advancing firmly towards the round-level resistance of 0.7300 amid positive market sentiment. The aussie bulls have been a star performer on Thursday after scaling the asset comfortably above the critical resistance of 0.7200.
Sickness in the greenback bulls resulted in funds channelization into the risk-sensitive assets as investors dumped the US dollar on poor Automatic Data Processing (ADP) Employment Change numbers. The ADP Employment Change landed at 128k, significantly lower than the consensus of 300k. Poor employment additions renewed concerns of an imbalance in the US labor market, which may worsen the already complex situation for the Federal Reserve (Fed).
Taking into account, the negative cues from the ADP Employment Change, it will be justified to claim that the market participants could find an extreme deviation in the actual and expected figures of the US Nonfarm Payrolls (NFP). The US NFP is already seen lower at 325k, however, any below-expectations figure would insert more pressure on the US dollar index (DXY). The DXY has plunged to near 101.70 after failing to sustain above 102.50.
On the aussie front, investors are awaiting the announcement of the interest rate decision by the Reserve Bank of Australia (RBA). Inflationary pressures in the aussie zone are advancing further and to tame the soaring prices, the RBA is expected to dictate a tight stance along with a hawkish commentary.
Deputy USTR Bianchi: "All options are on the table" regarding tariff decisions on Chinese imports.
More to come
- The USD/CHF remains almost flat in the week, up by a minimal 0.06%.
- Sentiment remains positive as Asian equities prepare for a higher open, as shown by the futures market.
- USD/CHF Price Forecast: To extend its losses towards the 100-DMA at 0.9419.
On Thursday, the USD/CHF slashed Wednesday’s gains and some more, down 0.50%, and breaching on its way south, the 50-day moving average (DMA) at 0.9594. At 0.9577, the USD/CHF reflects the US Dollar’s weakness amidst a positive market mood throughout the day.
During the New York session, stocks ended with gains. Despite the market’s rhetoric of investors’ fears about a US recession, China’s Covid-19 lockdowns, and Russia’s invasion of Ukraine, Asian equity futures are poised for a higher open. Also, a weaker than expected US Dollar, following Wednesday’s price action, when the greenback recaptured 102.000, gave back its gains, retracing 0.77%, sitting at 101.754.
That said, a headwind for the USD/CHF boosted the low-yielder Swiss franc. Furthermore, a stationary US 10-year Treasury yield at 2.911% fueled selling pressure on the USD/CHF, which fell below the 0.9600 mark.
USD/CHF Price Forecast: Technical outlook
From the daily chart perspective, the USD/CHF is consolidating with the short-term daily moving averages (DMAs), the 20 and 50 above the exchange rate, while the 100 and the 200-DMA remain below. Nevertheless, due to Wednesday’s rally towards 0.9652 and the Relative Strength Index (RSI) pushing lower, well within negative readings, a move towards the 100-DMA might be on the cards.
Therefore, the USD/CHF first support would be the April 20 high-turned-support at 0.9526. A breach of the latter would expose April 1, 2021, at 0.9472 high, followed by the 100-DMA at 0.9419.
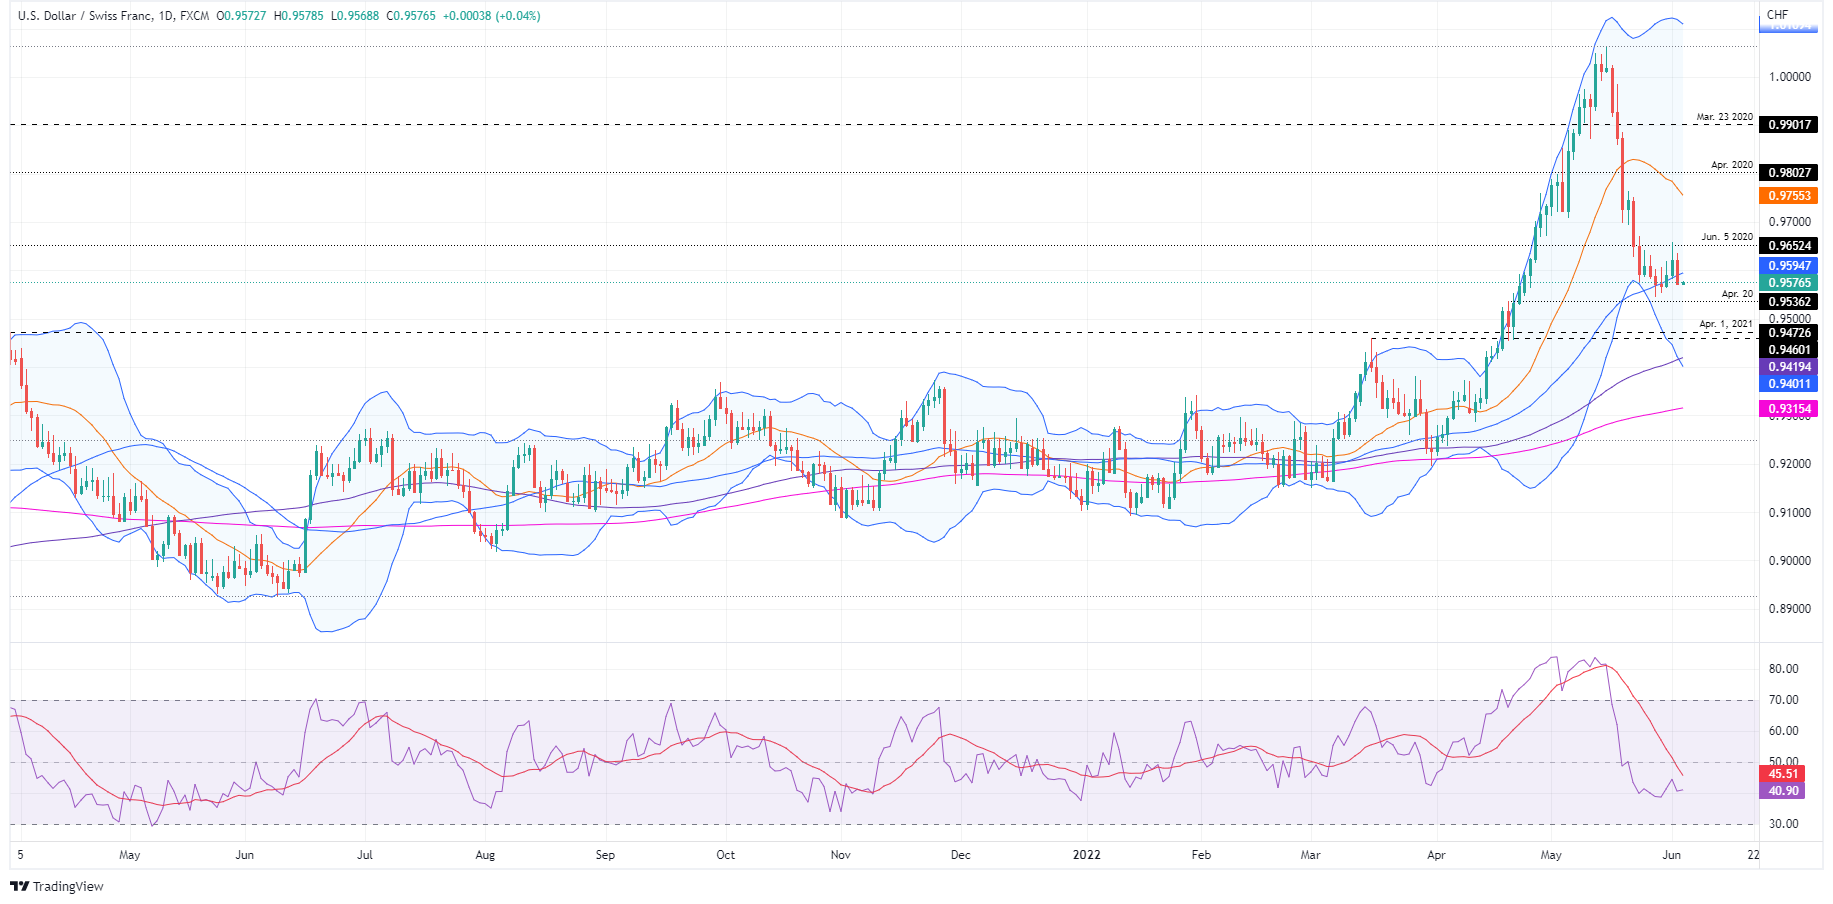
Key Technical Levels
- WTI pushes higher on Thursday asOPEC+ agrees to increase its monthly oil quotas.
- US oil inventories fell by 5.1-million barrels last week, well above the 1.3-million-barrel fall.
At $117.53, West Texas Intermediate (WTI) crude is 2.37% higher on Thursday as US oil inventories fell more than expected last week. Traders were also taking into account that OPEC+ agreed to increase its monthly oil quotas that most of its members cannot meet.
Bulls moved in again when the Energy Information Administration reported US oil inventories fell by 5.1-million barrels last week, well above the 1.3-million-barrel fall that markets are positioning for ahead of the announcement. Meanwhile, analysts at TD Securities explained that the ''rumours that OPEC members are considering to exempt Russia from a production deal, which would open the door for the spare capacity 'Haves' to pump more oil to compensate for the 'Have-Nots', are a distraction from the insurance ban on Russian oil.''
OPEC+ on Thursday said it is raising quotas in July and August by 648,000 barrels per day, up from the 432,000 bpd in previous monthly hikes, to make up for lower Russian supply.
''While negotiations between Saudi Arabia and the Biden Administration would ultimately determine this course of action, it would represent a swift change in the geopolitical landscape in the Middle East, placing Riyadh at odds with Moscow. Ultimately, this is unlikely to occur in the immediate term, which suggests these rumours will prove to be a distraction from the EU's proposed insurance ban on shipping Russian oil to third countries,'' the analysts explained.
''We have reiterated that this could create a significant logistical bottleneck for Russian crude exports. This view fits with our return decomposition model, which highlights that energy supply risk continues to soar higher. In this context, we remain long Dec23 Brent crude in anticipation of a continued rise in supply risk premia.''
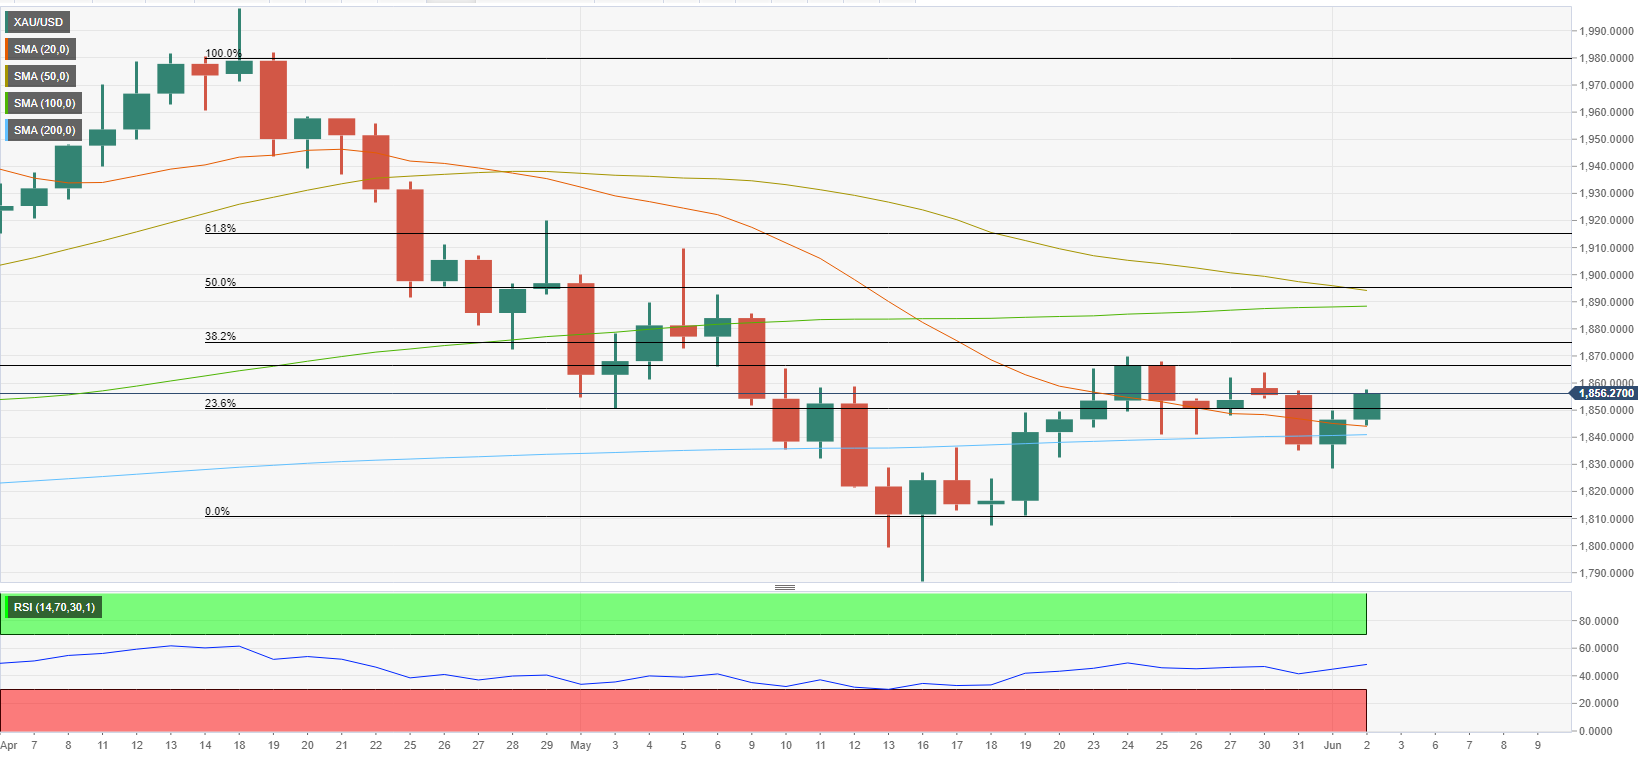
- Gold price has surpassed $1,870.00 on lower consensus for the US NFP.
- The US NFP is seen lower at 325k against the former print of 428k.
- The downbeat US ADP Employment Change has diminished the DXY’s appeal.
Gold price (XAU/USD) is balancing around $1,870.00 after a juggernaut rally on Thursday. Wednesday’s rebound from the low of $1,828.57 turned into a power-pack rally, which drove the gold prices firmly and refreshes three-week's high at $1,870.45. The precious metal is bided by the market participants on lower employment generation by the US economy in May.
The US Automatic Data Processing (ADP) Employment Change reported an addition of 128k jobs in May, less than half the expectations of 300k and lower than the prior print of 202k. Considering the downbeat ADP numbers, a downward shift in the US Nonfarm Payrolls (NFP) cannot be ruled out. As per the market consensus, the US NFP is seen at 325k, lower than the prior print of 428k. After the release of the downbeat ADP numbers, investors should brace for extreme volatility in the US dollar index (DXY), which will underpin the gold prices.
The US dollar index (DXY) has witnessed a steep fall after failing to sustain above the crucial resistance of 102.50. A sheer downside move has dragged the asset to near 101.70. Investors should be aware of the fact that and meaningful plunge in the US NFP will result in fresh monthly lows in the asset.
Gold technical analysis
An upside break of the 38.2% Fibonacci retracement at $1,867.65, which is placed from April 18 high at $1,998.43 to May 16 low at $1,786.94. The formation of the golden cross represented by the bullish crossover of the 50- and 200-period Exponential Moving Averages (EMAs) at $1,847.90, adds to the upside filters. The Relative Strength Index (RSI) (14) has shifted into a bullish range of 60.00-80.00, which signals more gains ahead.
Gold hourly chart
-637898034240387500.png)
- The AUD/JPY extends its weekly rally, up by 3.71%.
- Sentiment improved in the session, despite the economic backdrop, with investors’ fears about a possible global economic recession and a food crisis.
- AUD/JPY Price Forecast: Consolidates in the 94.00-40 range before pressuring the YTD high above 95.00.
The AUD/JPY advances nicely after reaching a daily low below the 93.00 mark, popping up to fresh six-week highs above the 94.00 figure, a level last seen on April 22, preparing for a re-test of the YTD highs. At 94.33, the AUD/JPY reflects an upbeat sentiment, with US equities finishing Thursday’s session with gains of 0.81% and 2.75%.
During the day, investors set aside the market’s actual narrative. Fears about a possible US recession, triggered by the US Federal Reserve tightening conditions, China’s coronavirus outbreak and factory halts, slowing supply chains, and the war between Ukraine – Russia remain as a backdrop in the global economic outlook.
Elsewhere, the Japanese yen remained under heavy selling pressure, posting substantial losses vs. its fellow counterparts. The AUD/JPY is refreshing two-month highs, and with the Relative Strength Index (RSI) in bullish territory and accelerating to the upside, the AUD/JPY threatens to break above the previous YTD high at 95.74.
AUD/JPY Price Forecast: Technical outlook
Therefore, the AUD/JPY bulls regained control after a cross-currency correction to 87.30 and, at the time of writing, are headed towards reaching a daily close near the 94.50 area. That’s from the daily chart perspective.
Zooming into the 4-hour chart, the AUD/JPY appears to lose steam. The Relative Strength Index (RSI) is well within the overbought territory at 83.35, so the cross-currency might consolidate in the 94.00-40 area as AUD/JPY takes a breather.
Upwards, the AUD/JPY ceiling level would be 95.00. Break above would expose the YTD high at 95.74, followed by the psychological 96.00 mark. On the downside, the AUD/JPY's first support would be the May 4 high at 94.02. Latter’s breach would send the AUD/JPY correcting towards 93.56, followed by 92.84.

Key Technical Levels
- EUR/USD bulls run into the bear's lair, but a break of resistance will be highly positive.
- The bears will need to break the prior layer of H4 support.
EUR/USD was bid on the day as the greenback against six major currencies, was falling like a stone to 107.74 and lowing around 0.8% on the day, on pace to snap a two-day streak of gains. The dollar found no support from data showing US private payrolls increased far less than expected in May ahead of today's Nonfarm Payrolls. This leaves the technical outlook for the euro leaning bullish on a break of current resistance, but the bears could be lurking and the following illustrates both sides of the equation.
EUR/USD H4 chart
The price is moving in on a critical area of resistance and should this hold, then there will be significant bearish prospects for the foreseeable future the support structure gives out. Failing that, then the bullish scenario is as follows:
What you need to take care of on Friday, June 3:
The greenback changed course on Thursday and gave up all of its Wednesday gains and more. Easing government bond yields and tepid US employment-related figures put pressure on the American currency, later weighed by the positive tone of Wall Street.
Concerns related to economic growth and inflation remain the same, moreover after the EU Producer Price Index hit 37.2% in April, above the market’s expectations. Government bonds were up, with yields giving up some of their recent gains.
US indexes edged higher, even despite comments from Federal Reserve Vice-Chair Lael Brainard said that the central bank would hardly pause its current rate-hiking cycle amid record inflation levels. Cleveland Loretta Mester said that inflation has not yet peaked and that it’s too early to discuss a potential pause in the tightening path.
The EUR/USD pair trades near 1.0750, and not far from its weekly high at 1.0786. The GBP/USD pair is also up, trading at around 1.2560. Commodity-linked currencies soared. The AUD/USD pair is now hovering at around 0.7250, while USD/CAD trades at around 1.2570.
Gold soared, trading at its highest in near a month. It is currently changing hands at around $1,870 a troy ounce. Crude oil prices were also up, with WTI trading at $117.10 a barrel. The OPEC+ announce it would increase production by 648,000 barrels per day in July and August amid disruptions caused by Russia’s invasion of Ukraine.
The focus is now on the US Nonfarm Payrolls report.
Like this article? Help us with some feedback by answering this survey:
- GBP/USD bears are moving in for the kill at what could be the end of the line for the bulls.
- The markets will now be looking at the US NFP data on Friday.
At 1.2570, GBP/USD is moving lower and way from the highs of the day near 1.2585. The pair is otherwise up by some 0.68% and had rallied from a low of 1.2469 as the US dollar retraced some of its Wednesday gains ahead of and during another busy data schedule.
The highlights on Thursday were the decline in weekly initial jobless claims, a small upward revision to Q1 productivity, and a smaller-than-expected 128,000 gain in ADP private payrolls, all of which, however, failed to support the greenback.
ADP said small businesses are struggling to keep up with larger businesses when competing for workers. The services sectors added 104,000 jobs, led by a 46,000 increase in education and health services workers. Initial jobless claims decreased by 11,000 to 200,000 in the week ended May 28, lowering the four-week moving average for the first time in nearly two months.
This data comes ahead of tomorrow's Nonfarm Payrolls where analysts at TD Securities explained they see Employment likely continuing to advance firmly in May but at a more moderate pace after consecutive job gains at +428k in March and April. ''Employment in the household survey likely rebounded after printing negative in April. We expect this to lead to a drop in the unemployment rate to a post-COVID low of 3.5%. We also look for wage growth to remain steady at 0.3% m/m (5.2% YoY).''
Recent comments from Federal Reserve officials point to an extremely high probability of a rate hike of 50 basis points at the June 14-15 Federal Open Market Committee meeting, so markets are pricing this in and it is unlikely to be swayed by the data.
There were no UK data on Thursday's schedule and markets were closed for both Thursday and Friday for the Queen's Jubilee. A further rate increase is expected at the Bank of England's next monetary policy meeting on June 16. In line with expectations, the BoE hiked the Bank Rate by another 25bp to 1.00%. at the start of last month. Attention was on forward guidance and not the rate hike itself which came in slightly dovish.
Analysts at Danske Bank, consequently, changed their Bank of England call now expecting three additional 25bp rate hikes (June, August and November vs. 25bp in August and November previously) ''recognising that the Bank of England is probably not ready to slow the rate hike pace just yet.''
''We still see risks skewed towards more rate hikes, as risk is that inflation continues to surprise to the upside.''
On Wednesday, the Bank of England Deputy Governor Jon Cunliffe said that the central bank was seeing evidence of a slowdown in the housing market.
"We see evidence of a slowdown in the housing market. There are some straws in the wind that show the market is starting to turn," Cunliffe said in an interview with ITV News.
"The Bank expects the economy, that’s already slowing, and we expect it to slow further, to slow quite a lot over next year or so. And I think that will have an impact on the housing market."
GBP/USD technical analysis

From a four hour perspective, the price is stalling on the bid into the remaining two hours of the candle. The price would be expected to be resisted by the opposing bearish structure and result in a near term correction towards prior lows that meets the 50% mean reversion level. Should the bears clear this support structure, then the downside is open toward the recent lows in the 1.2450s ahead of the 1.2370s and the 1.2220s.
This is inline with the daily chart's bearish bias as follows:

- The NZD/USD shifts to positive in the week, up by 0.34%.
- An upbeat market mood weighs on the greenback and boosts the NZD.
- Fed officials support 0.50% hikes in June and July but remain unsure about September.
- NZD/USD Price Forecast: A break above 0.6568 to open the door for further gains.
The NZD/USD soars in the New York session, pairing two days of consecutive losses, and is testing four-week highs, around 0.6560s, amidst an upbeat market sentiment session, as reflected by US equities registering gains. The NZD/USD is trading at 0.6555, near the daily highs, after reaching 0.6460 daily lows earlier in the European session.
On Thursday, sentiment improved, and equities recovered. The financial markets narrative stays the same. Worries about the US Federal Reserve tightening monetary policy and threatening to spur a recession in the US looms. JP Morgan’s CEO Jamie Dimon warned investors to prepare for an economic “hurricane” as the economy faces a combination of unprecedented challenges, according to Bloomberg.
Additionally to the abovementioned, the conflict between Ukraine-Russia, which has lasted for three months, has begun to weigh on food prices. Also, the latest China coronavirus outbreak, which triggered lockdowns for one month in Shanghai, now seemed controlled, could reappear on the scene.
Given the backdrop, the greenback remains on the defensive as the US Dollar Index shows, falling 0.77%, reversing Wednesday’s gains, sitting at 101.760. A tailwind for the NZD/USD, which fell for two consecutive days before retracing those losses, prepares to end the week on a higher note.
In the meantime, Fed officials continue to cross wires. Cleveland’s Fed President Loretta Mester supports 50 bps increases in the next couple of meetings and added that the Fed is well-positioned to consider the appropriate pace for further rate hikes.
Mester added that she is unsure how high rates need to go, and a pause on the tightening cycle would depend on data. Nevertheless, she emphasized that the Fed would slam the brakes if inflation remains stubbornly high, and she still keeps 25 or 50 bps rate hikes, contrarily to a pause in September.
Earlier on Thursday, the Fed’s Vice-Chairwoman Lael Brainard said that the central bank is getting mixed signals on the economy and that the number one challenge is bringing inflation down. When asked about a Fed pause, she said it is harder to say because the policy is not on a pre-set course via CNBC.
An absent New Zealand economic docket would leave NZD/USD traders leaning on US economic data.
In the meantime, the US calendar would release the May Nonfarm Payrolls report, ISM Non-Manufacturing, and Composite PMIs, alongside additional Fed speakers, ahead of the blackout of the June Federal Reserve Open Market Committee meeting.
NZD/USD Price Forecast: Technical outlook
The NZD/USD is surging higher and is testing May’s 5 swing high at 0.6568. Additionally, the Relative Strength Index (RSI) aims higher in bullish territory, with enough room before reaching overbought conditions. Therefore, the NZD rally would keep going, and a break above 0.6568 might pave the way for further gains. The following supply zone would be the 50-DMA at 0.6607. Once cleared would expose the 100-DMA at 0.6674, followed by the 200-DMA at 0.6815.
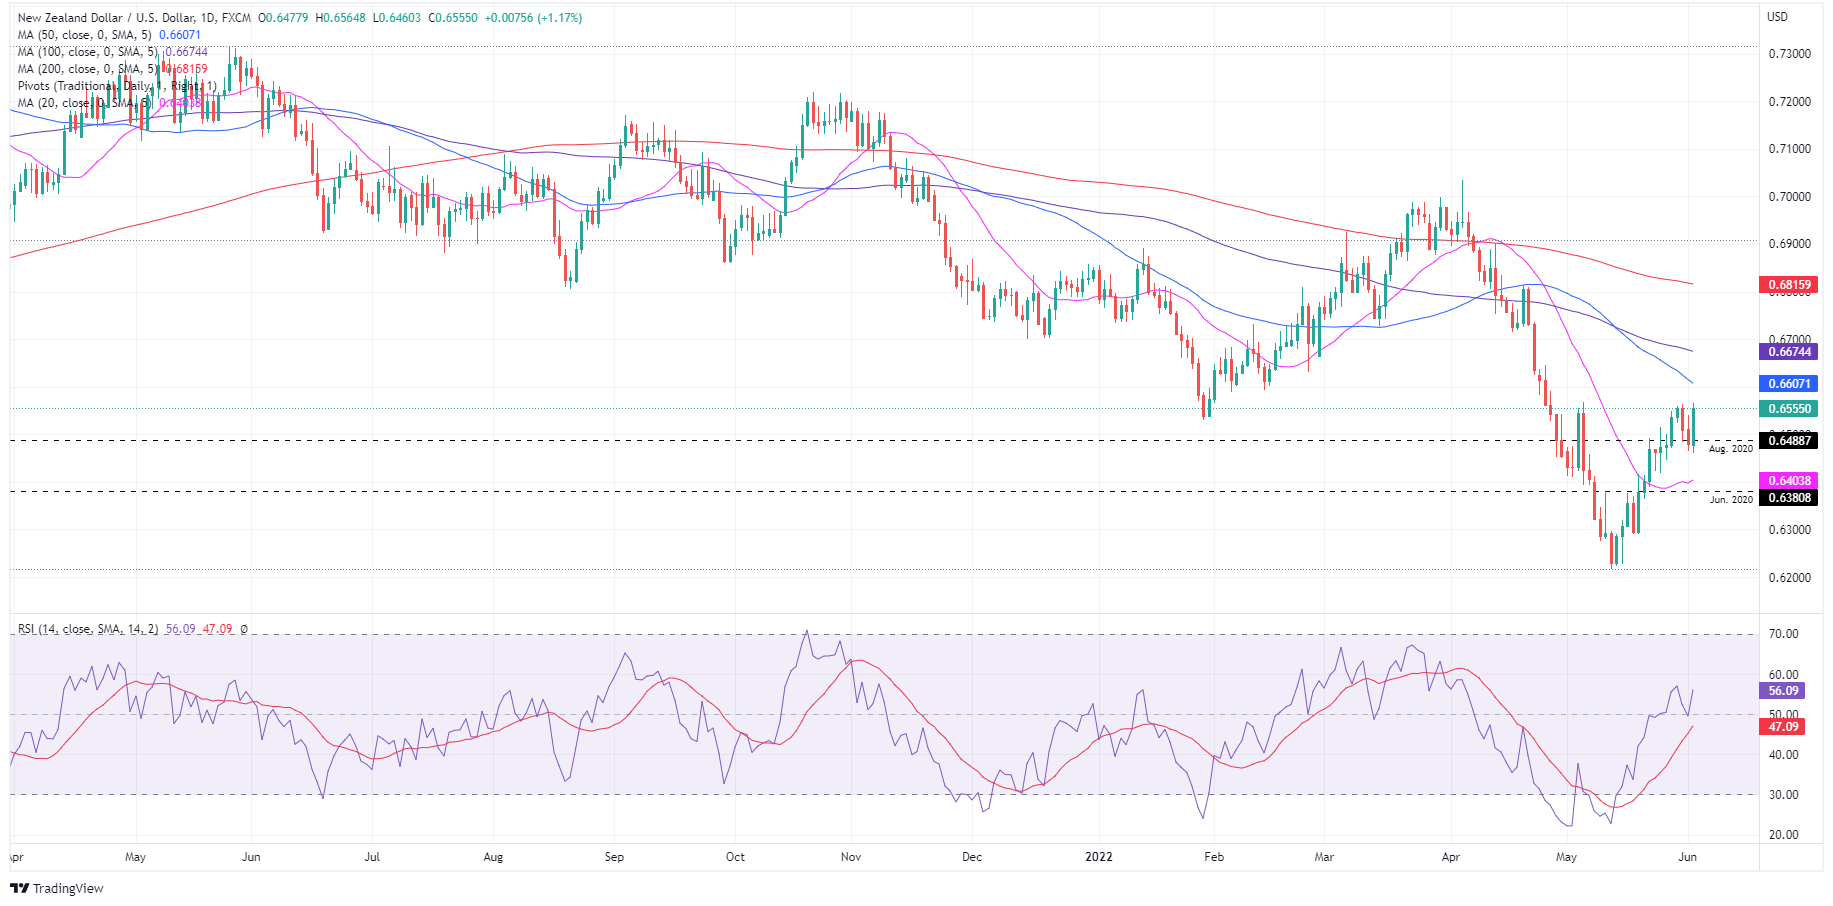
Key Technical Levels
- On the hourly time frame, the rally is parabolic and likely in need of a meanwhile correction in the coming hours.
- There is a case for the move back towards the prior highs near 4.4370.
There has been a more positive outlook for China with restrictions being eased which has been supporting base metals as bargain hunters pile in, encouraged also by positive economic data elsewhere, such as in the US and eurozone. US manufacturing activity unexpectedly advanced in May, with the ISM factory index rising to 56.1 from 55.4. The euro area PMI ticked up to 54.6 in May versus a flash reading of 54.4.
Copper has been leading the sector higher, with CFD's trading higher by over 5% on the day so far. the contract is nearly 13% up from the May 12 lows after reaching a high of 4.567.
''With restrictions in Shanghai being to ease, the worst of the recent economic weakness may be behind it. Chinese officials are also ramping up efforts to boost economic activity,'' analysts at ANZ Bank argued.
From a technical standpoint, however, there could be a correction in store on the near term charts. However, there is also the case for a much longer-term negative outlook on the charts as well and the following illustrates the market structure on a multi-time-frame basis:
Copper monthly chart
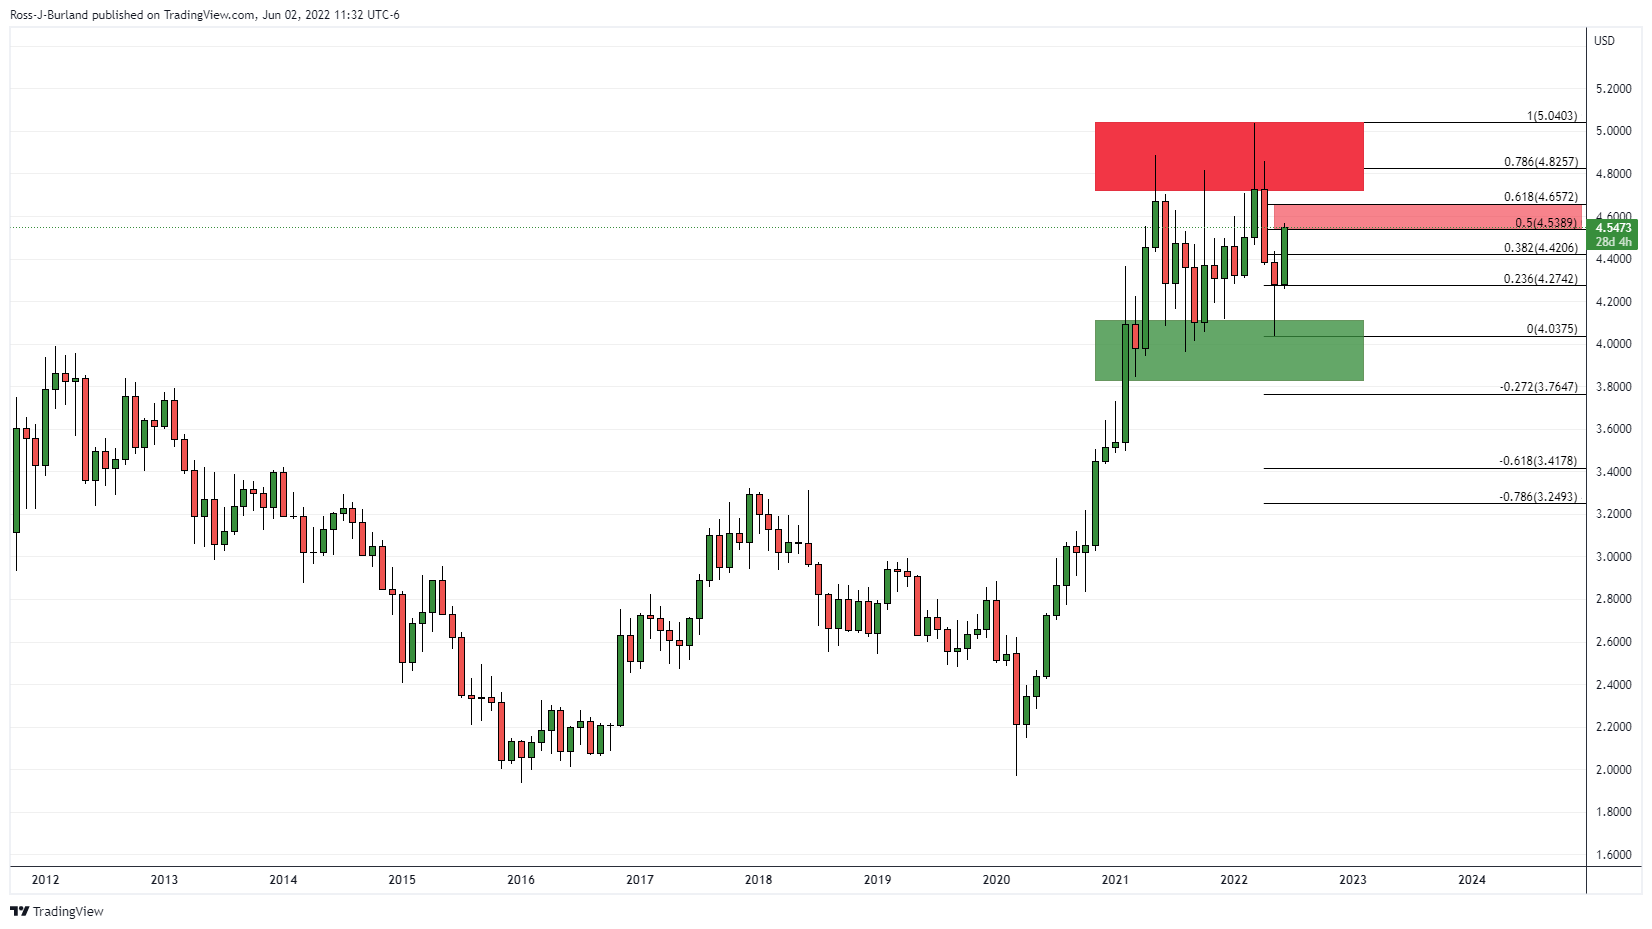
For just over a year, the price has been consolidating the 2020 bull rally. In the past weeks, the price has made a strong 50% mean reversion. This could signify more to go on the upside given the strength of the correction.
Copper weekly chart
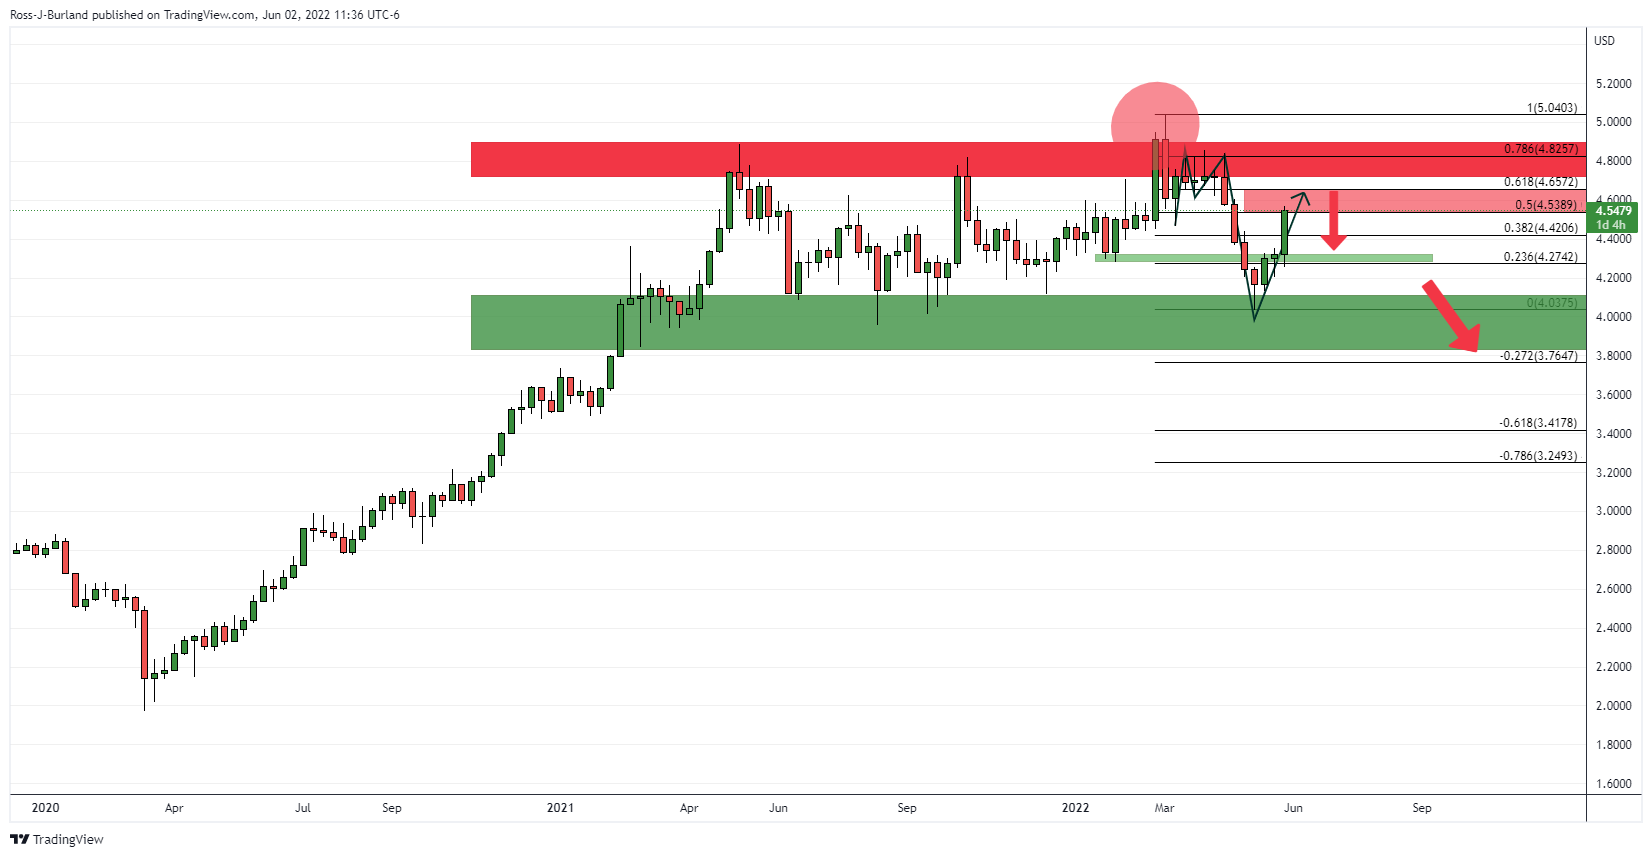
The weekly chart is more interesting. The price made a jolt through the highs of resistance from the middle of the range but quickly reverted lower and continued lower to meet the support of the channel. The bears are in control overall. This could mean that the current bullish correction is about to meet committed bears as it moved in on the neckline of the M-formation. This is an area that would be expected to act as resistance on initial tests. If it does and the best commit, a case for the downside will start to build again. 4.2780s will be key in protecting against a downside continuation and a fresh low below the channel's support for the weeks ahead.
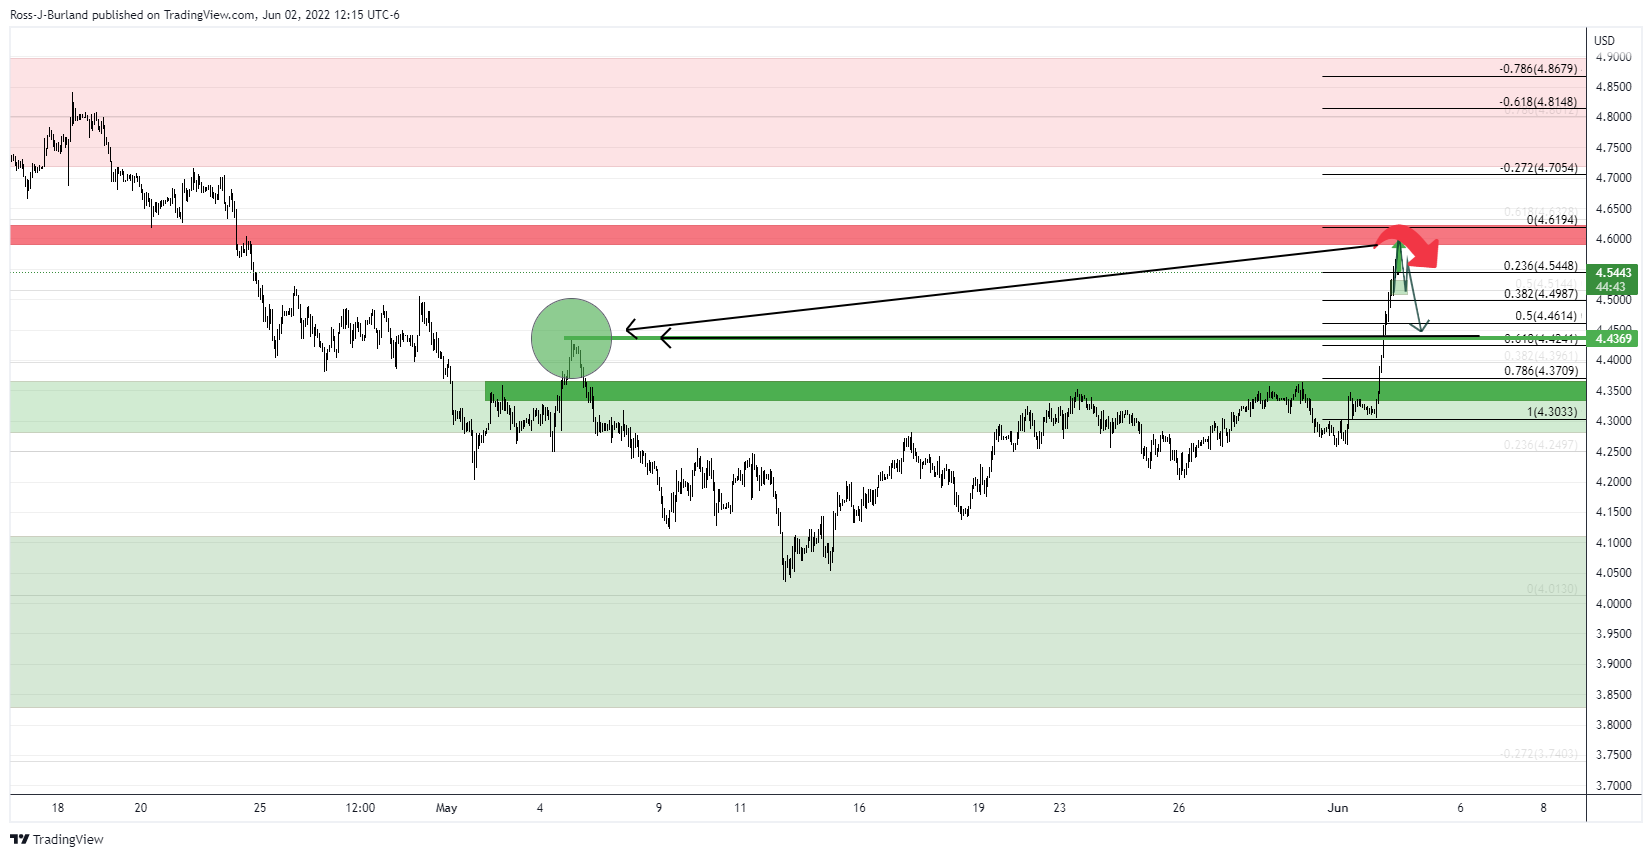
Copper daily chart
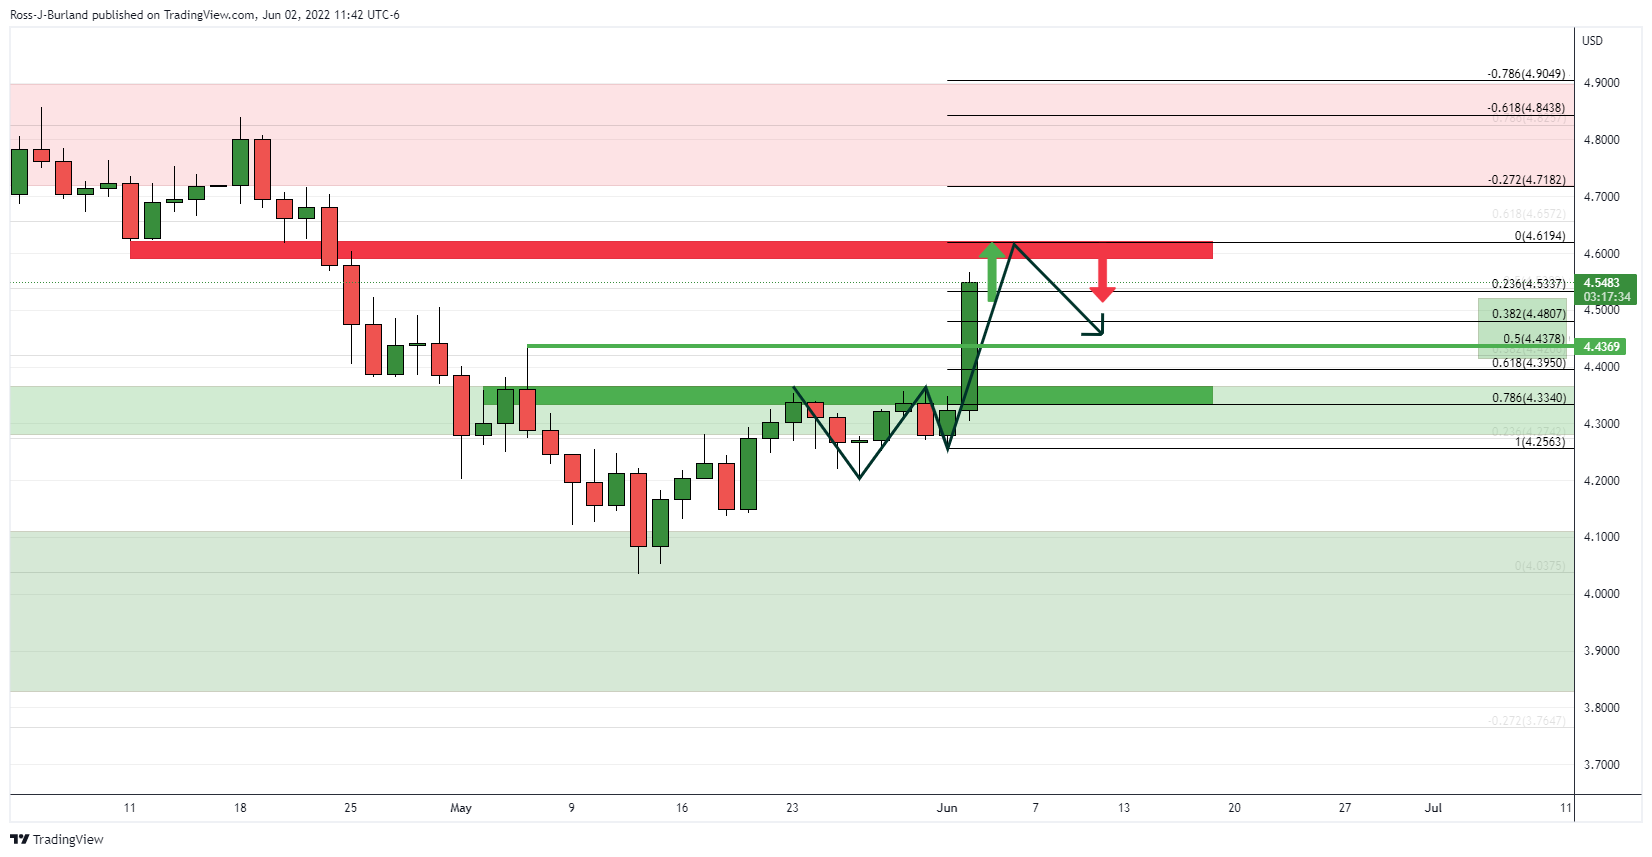
The extended W-formation on the daily chart is a bearish feature should the price fail to break above the resistance at 4.6215 for the days ahead, as illustrated above. The 61.8% ratio that has a confluence with prior wick highs could be targeted near 4.4370.
Copper hourly chart
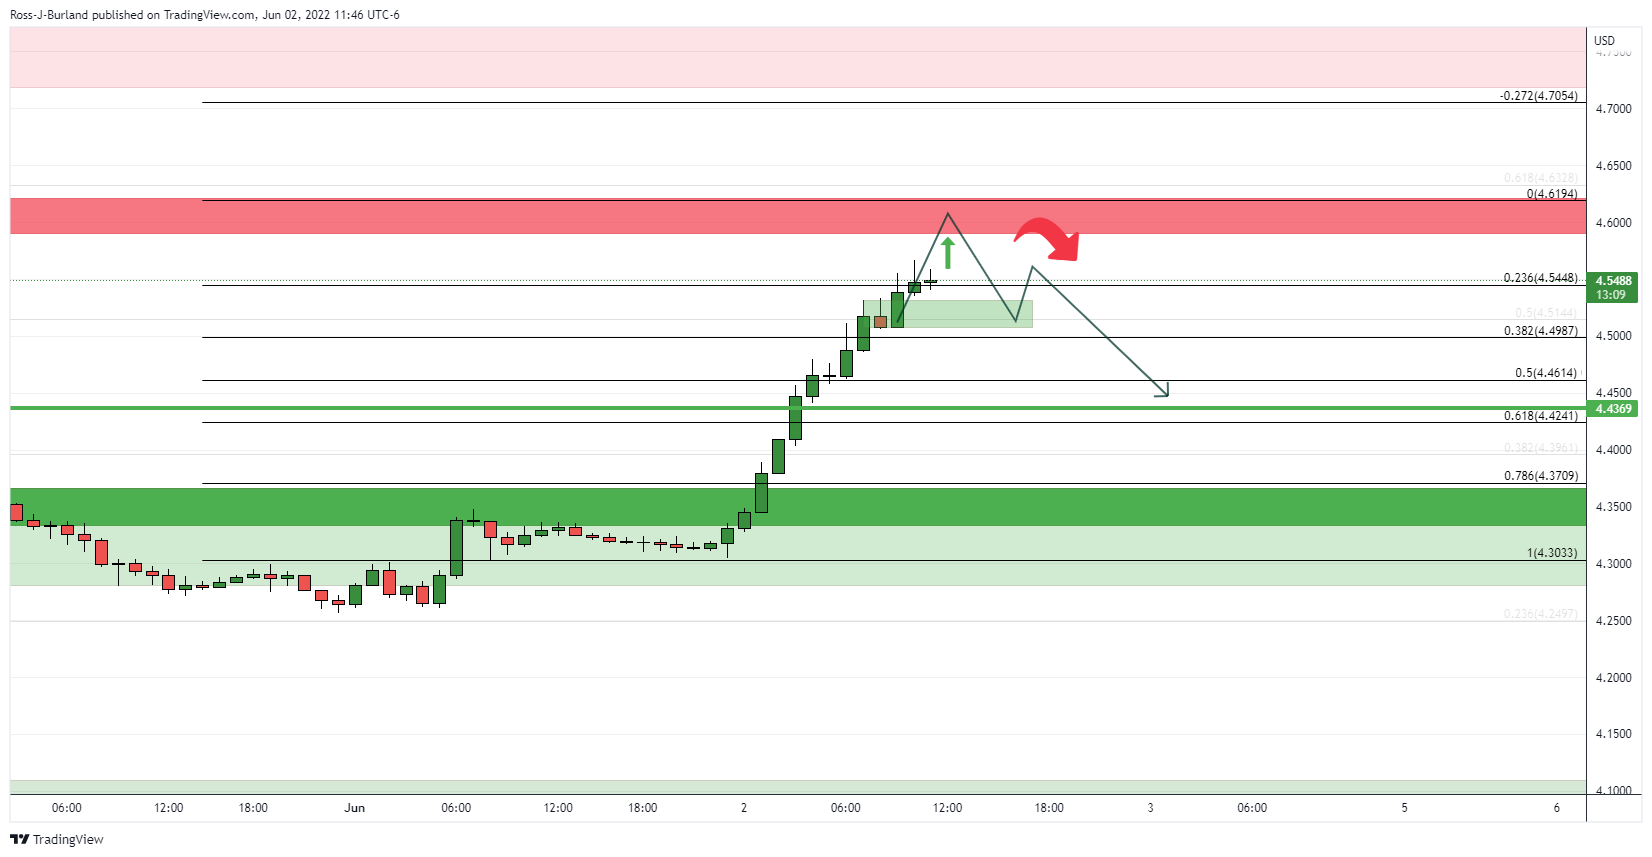
On the hourly time frame, the rally is parabolic, besides a brief stall at 4.5330 and likely in need of a meanwhile correction in the coming hours. If the bears manage to break below the potential support structure where the bulls paused for breath previously within this rally, then that will reinforce the case for the move back towards the prior highs:
- boarThe GBP/JPY is registering solid gains of almost 1.80% in the week.
- An upbeat market mood increased appetite for riskier assets, and safe-haven peers fell.
- GBP/JPY Price Forecast: To test April’s 28 swings high above 164.00.
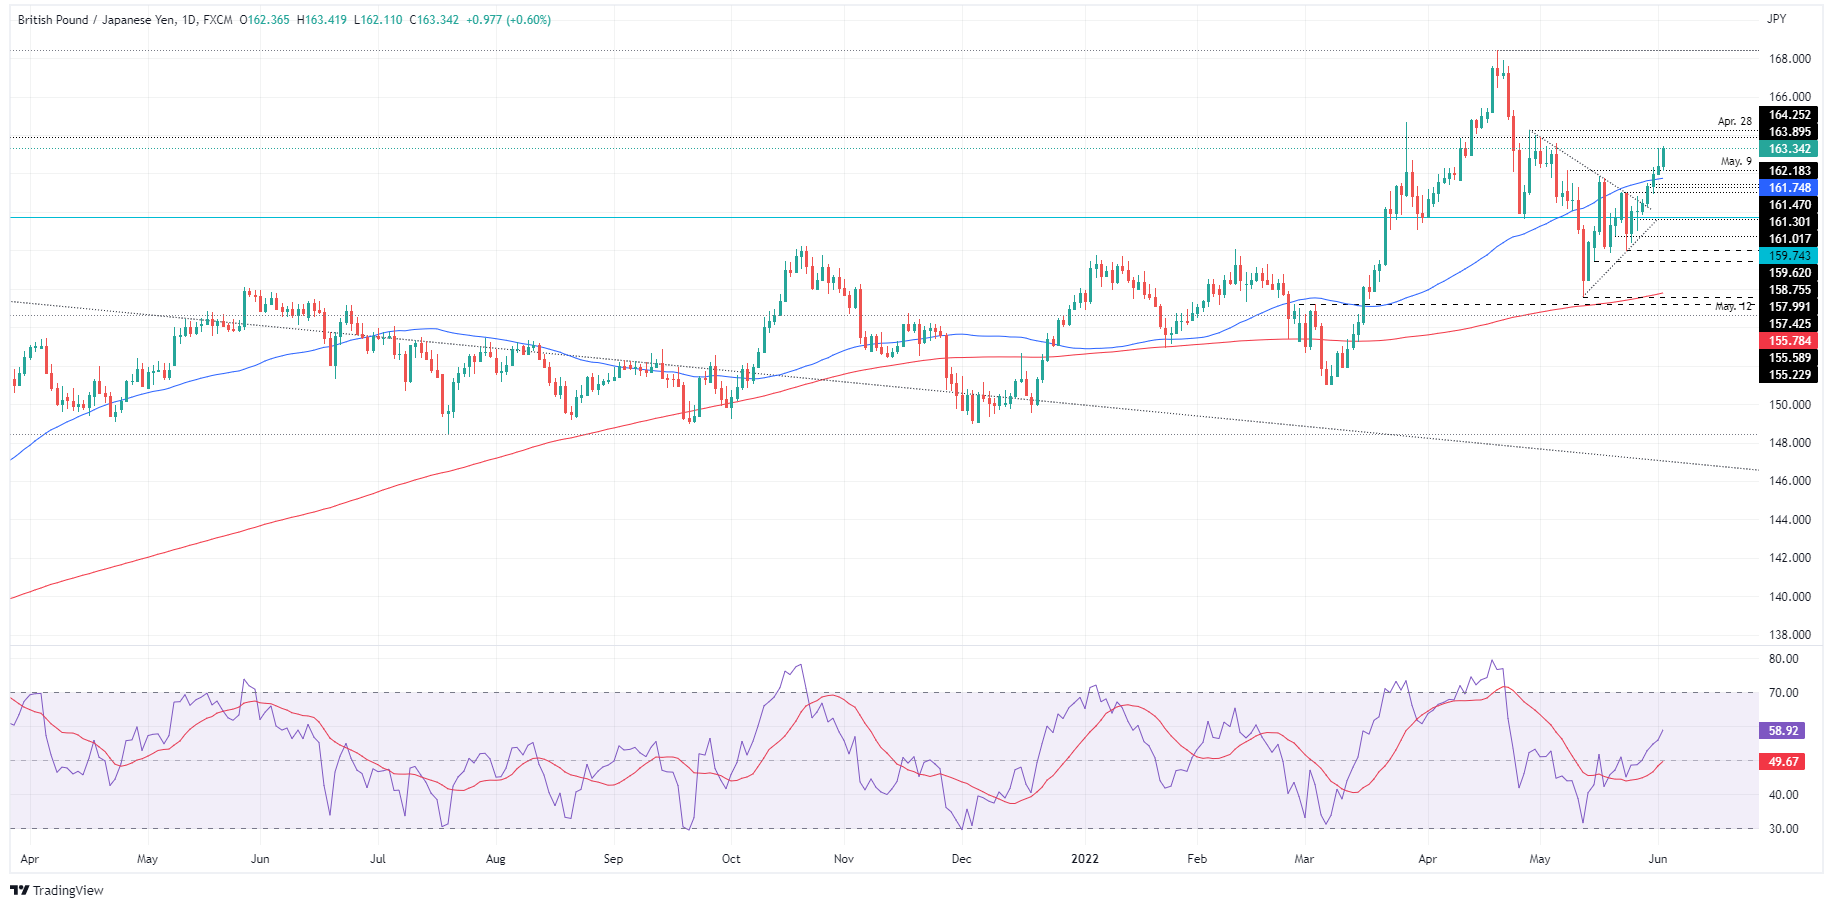
The British pound is rallying to fresh multi-week highs on Thursday, up by 1.78% and aiming towards 164.00 amidst an improved market sentiment. US equities rebound from earlier losses, and safe-haven peers are downward pressured. At 163.34, the GBP/JPY climbs sharply for the seventh straight day.
The GBP/JPY rises on a weaker JPY
The cable remains strong during the day, albeit the UK is on holiday to observe the Queen’s Jubilee. The UK’s high inflation of around 9%, about to print double digits, and slowing economic growth, would keep the GBP vulnerable to further selling pressure. Nevertheless, it got a hand from the JPY, affected by the ultra-dovish Bank of Japan’s (BoJ) monetary policy stance, despite country inflation hitting 2%.
In the Asian session, the BoJ board member Adachi said that attempting to strengthen a weaker yen by tightening monetary policy would squeeze corporate funding. Adachi commented that if the Fed’s hiking cycle cools the US economy, then there is a risk that could reverse the depreciation of the Japanese yen.
In the meantime, an absent UK economic docket left GBP/JPY traders leaning towards a pure market sentiment play. Regarding the Japanese calendar, around 12:30 GMT, Jibun Bank Services and Composite PMIs would shed some light regarding the Japanese economy.
GBP/JPY Price Forecast: Technical outlook
The GBP/JPY Thursday’s price action shows the resilience of GBP bulls, which pushed Sterling for the seventh straight session towards new daily highs. In fact, the cross-currency is trading at four-week highs whatsoever would be facing solid resistance, which is to blame for the fall from 164.25 to 155.58.
The above-mentioned would signal that the GBP/JPY is about to peak. Nevertheless, the Relative Strenght Index (RSI) at 58.90 aims higher, so a move towards April’s 28 high at 164.25 is on the cards.
Therefore, the GBP/JPY’s first resistance would be the May 5 daily high at 163.57. A breach of the latter would expose the May 2 high at 163.89, followed by 164.00 and then the above-mentioned 164.25, April’s 28 high.
- The USD/JPY retreats from weekly highs above 130.00 and falls below the 20-hour SMA, eyeing 129.50.
- Risk appetite has improved but remains fragile and could shift at any time.
- USD/JPY Price Forecast: Range-bound but slightly tilted to the downside in the 1-hour chart.
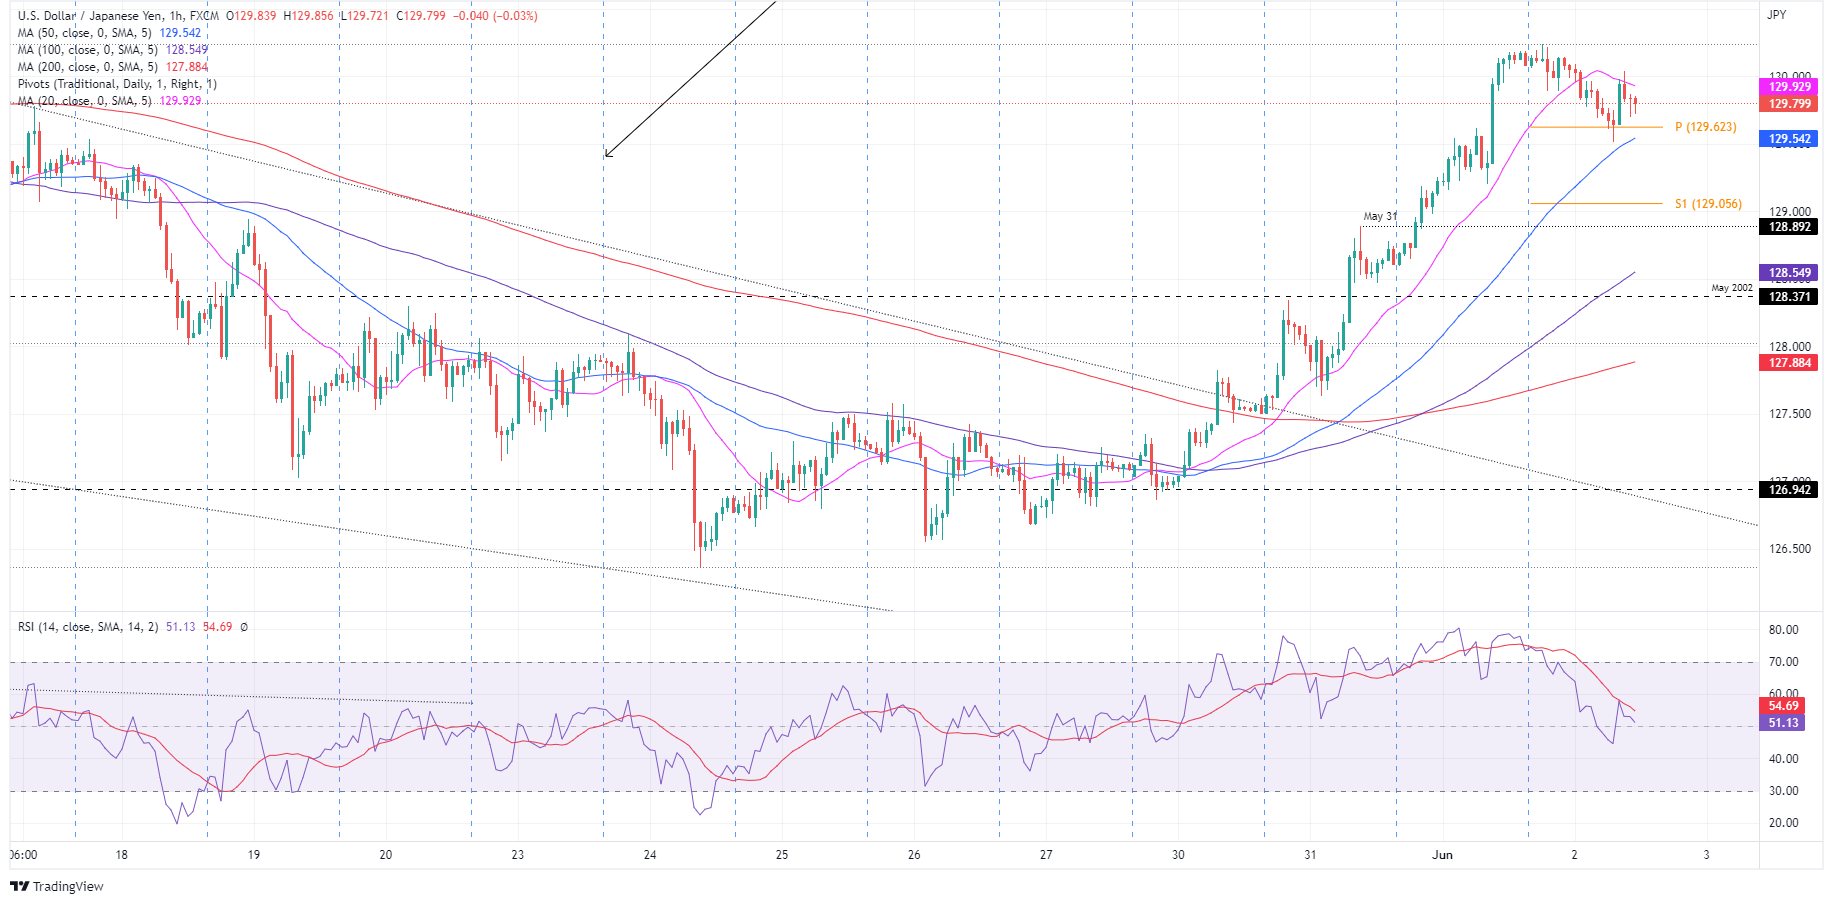
The USD/JPY retraces from three-weekly highs, and bears drag prices down the 130.00 mark, eyeing to push the pair towards the 20-day moving average (DMA) around 128.66, amidst a risk-off session on Thursday. At the time of writing, the USD/JPY is trading at 129.79, posting decent losses of 0.23%.
Besides US Dollar weakness boosting the yen, unchanged US Treasury yields add their part to the USD/JPY drop. The 10-year benchmark note rate sits at 2.919%, flat in the session.
Sentiment has improved in the North American session, as US equities record gains. The US Dollar Index, as above-mentioned, is pairing Wednesday’s losses, down 0.64%, sitting at 101.894. Mixed US economic data weighed some on the mood, but the markets lack a clear direction ahead of Friday’s Nonfarm Payrolls report.
Elsewhere, the USD/JPY retraced from weekly highs at 130.24, but the drop was capped near the 50-hour simple moving average (SMA) at 129.54, then climbed towards the 20-hour SMA at 129.92, settling down near 129.75.
USD/JPY Price Forecast: Technical outlook
From a daily chart perspective, the USD/JPY, although in an uptrend, is consolidating in the high 129.00s. The Relative Strength Index (RSI) is in bullish territory but aims lower, so buying pressure is easing.
The USD/JPY hourly chart depicts the major is trapped within the 20 and 50-hour SMAs. Furthermore, the RSI shifted gears, below the 50-midline, with a downward slope, as the USD/JPY is edging towards the daily pivot at 129.62. Nevertheless, the USD/JPY needs to break below the current daily low at 129.51 to pave the way for further downside action.
If that scenario plays out, the USD/JPY first resistance would be the S1 daily pivot at 129.05, which once cleared would expose the May 31 high at 128.89. A breach of the latter would expose the 100-hour SMA at 128.55.
Key Technical Levels
The US official employment report will be released on Friday. Analysts at TD Securities look for a slowdown in payroll in May to 300K, the lowest number since April. They consider the impact on the greenback to be limited. Martet consensus is for an increase of 325K in payrolls.
Key Quotes:
“We look for payrolls to have slowed to a still-solid pace in May, posting their smallest net job gain since April 2021. Indeed, we pencil in an increase of 300k, which is a whisker below consensus expectations at 325k. Despite this loss of momentum, we look for the unemployment rate to decline a tenth to 3.5% in May. We also forecast average hourly earnings to have advanced again at a 0.3% m/m pace.”
“We expect the USD to trade in line with the direction and magnitude of any surprise in the data given its recent correlation flip. We think the m/m AHE (Average Hourly Earnings) will be rather important as well, given concerns about a wage spiral. That said, we think USD moves will be limited with next week's CPI report but expect EURUSD and USDJPY to be particular sensitive given terminal rate correlations.
“We believe the Treasury market reaction to payrolls is likely to be asymmetric. A weaker report will likely trigger a notable bull steepening after investors recently increased pricing for the terminal Fed funds rate to 3.2% from a low of just 2.9% last week.”
The European Central Bank (ECB) will have its monetary policy meeting next week. Analysts at Danske Bank point out the meeting is set to be the formal end of the net asset purchases and a clear signal to hike interest rates in July. They don’t see the ECB helping the euro and still look for EUR/USD to fall to 1.00 over the next twelve months.
Key Quotes:
“Next week’s ECB meeting is set to be the formal end of ECB net asset purchases and a clear signal to hike rates in July, although without a specific guidance of the size of the first rate hike. We expect ECB net purchases to end on the 1 July, thereby in line with previous guidance for Q3.”
“Market focus will be on the discussion if a 50bp hike is possible, and if so when, as well as to any hints about tools that ECB may take to address fragmentation. We expect ECB to hike 25bp each meeting until Mar23, but risks are clearly skewed for a 50bp rate hike in H2 this year (July or Sep most likely).”
“The ECB’s stance has been well communicated ahead of the meeting, including the release of Lagarde’s blog post. As such, the market is well ahead of the view that rate hikes are likely at most, if not all, meetings going in to H2 and excess liquidity will fall. At present, we view it hard for ECB to surprise on the hawkish side versus those market expectations. If any, we might see some pushback against recession risks and/or confidence in inflation turning around ‘sooner than later.’ Both may well give a bit of downside to EUR/USD spot at the meeting, maybe in the scope of some 50-100pips given EUR/USD has seen a short-term uptick to 1.07 recently.”
“We continue to forecast EUR/USD towards 1.00 over the coming 12M.”
- The AUD/USD is the strongest currency in the North American session, and the greenback trades soft.
- European and US equities reflect a mixed mood; in the FX space, safe-haven peers fall.
- Fed’s Brainard: Not so sure about pausing in September because she does not have a clear sense of how the economy would be.
- AUD/USD Price Forecast: Eyeing a break of the 200-DMA around 0.7256.
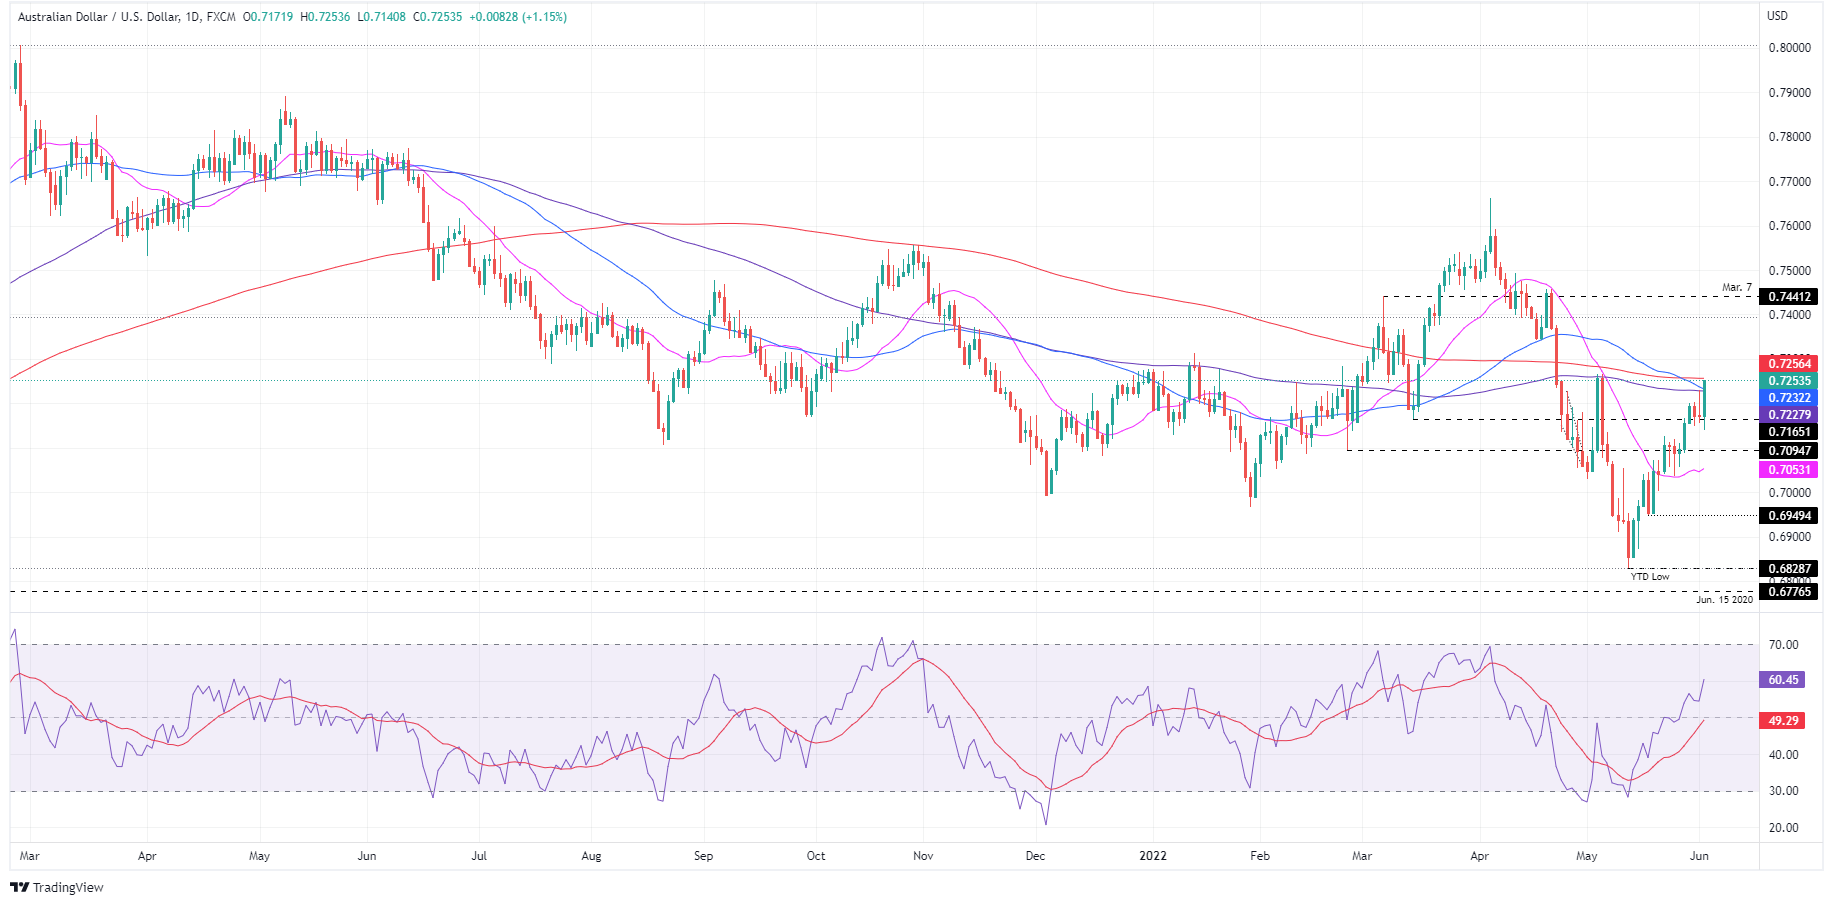
For the third straight day, the Australian dollar is rallying in the North American session amidst a mixed market mood, as European and US equity indices fluctuate and the greenback falls. At 0.7253, the AUD/USD is testing the 20-day moving average (DMA) at 0.7225, though up in the day by 1.17%.
On Thursday, the market mood improved some, though it lifted the spirits in the FX space. Risk-sensitive currencies, like the AUD, are rising against most G7 peers. In the US, mixed economic data keeps investors unease after the ADP Employment Change for May, which showed that private hiring increased by just 128K vs. 300K estimated.
The ADP chief economist Nela Richardson said, “Under a tight labor market and elevated inflation, monthly job gains are closer to pre-pandemic levels.” She added that “The job growth rate of hiring has tempered across all industries, while small businesses remain a source of concern as they struggle to keep up with larger firms that have been booming as of late.”
However, the positive news is that Initial Jobless Claims for the week ending on May 28 rose by 200K, lower than the 210K foreseen. Mixed signals in the labor market keep market players guessing what would happen on Friday’s Nonfarm Payrolls estimated at 325K.
At the same time, Factory Orders for April rose by 0.3% MoM, lower than the 0.7% expected.
Talking about Fed officials crossing wires, now is the turn of the Vice-Chairwoman Lael Brainard. She said that the central bank is getting mixed signals on the economy, and the number one challenge is bringing inflation down. When asked about a Fed pause, she said it is harder to say because the policy is not on a pre-set course via CNBC.
AUD/USD Price Forecast: Technical outlook
Thursday’s price action portrays the AUD/USD as upward biased. At the time of writing, is trading above the 50-DMA and 100-DMA, each at 0.7231 and 0.7247, respectively, and eyes to challenge the 200-DMA at 0.7256. Worth noting that the Relative Strength Index (RSI) is still bullish, above the 50-midline, aiming higher and with enough room to spare before reaching overbought conditions.
Hence, the AUD/USD’s first resistance would be the 200-DMA at 0.7256. Break above would expose the 0.7300 figure that, once cleared, would send the pair climbing towards April’s 22 high at 0.7376, followed by the 0.7400 mark.
Key Technical Levels
- Canadian dollar outperforms on hawkish BoC.
- US dollar is under pressure across the board, DXY drops 0.60%.
- USD/CAD heads for the fourth weekly decline in a row.
After taking a pause following the rate hike from the Bank of Canada on Wednesday, the USD/CAD resumed the downside on Thursday and broke below 1.2600, to the lowest level in six weeks.
The pair bottomed at 1.2581 and it is hovering around 1.2590, holding onto important weekly losses. The loonie is headed toward the fourth weekly gain in a row and has turned positive for the current year.
The decline is being driven by a weaker US dollar on Thursday. The DXY is falling by 0.60%. Equity markets are mixed while US yields are flat. Economic data from the US came in mixed, with a lower-than-expected reading of the ADP employment report ahead of tomorrow’s NFP.
The loonie was also helped by hawkish commentaries from Bank of Canada (BoC) Deputy Governor Paul Beaudry. On Thursday he said that the BoC sees an increasing likelihood that it may need to raise its policy interest rate to 3% or higher.
The USD/CAD looks oversold but no signs of a correction or consolidation are seen at the moment. The next support level might be located at 1.2570 followed by the 1.2535 area. On the upside, resistance levels lie at 1.2630 and 1.2670. The dollar needs to rise and hold above 1.2685 to alleviate the negative pressure.
Technical levels
- Gold prices rallied over 1.0% into the upper $1870 and towards multi-week highs on Thursday as the buck/US yields softened.
- But any bullish breakout towards $1900 will probably have to wait until after Friday’s official US jobs report.
Spot gold (XAU/USD) prices rallied more than 1.0% on Thursday from the low $1840s per troy ounce to the upper $1860s and are currently probing late May highs just under $1870. An upside break would open the door, technically speaking to a run higher towards the 50-Day Moving Average, which is close to the $1900 level.
Thursday’s gains come as US yields and the US dollar back off from weekly highs, giving precious metals markets some tailwinds, and despite mixed tier two US labour market data (Q1 Unit Labour Cost was revised higher, May ADP Employment Change missed expectations and weekly jobless claims was decent). But any bullish breakout will likely have to wait until after Friday’s official US jobs report.
Gold bulls should beware of the risk that the report comes in stronger than expected and/or shows a further acceleration of US wage pressures. In this scenario, markets would likely rush to price in a more hawkish Fed policy path, which could push yields and the buck higher and weigh on gold. For now, Gold will probably remain rangebound in the mid-$1800s.
Bank of Canada (BoC) Deputy Governor Paul Beaudry on Thursday said that the BoC sees an increasing likelihood that it may need to raise its policy rate to 3% or higher, reported Reuters.
Additional Remarks:
The risk is now greater that inflation expectations could de-anchor and high inflation could become entrenched.
In deliberations ahead of the 1 June 50 bps rate hike, the BoC noted price pressures are broadening and inflation is likely to go higher still before easing.
The BoC must be - and will be - resolute in bringing inflation back down and will prevent high inflation from becoming entrenched.
The BoC expects strong growth and low unemployment to continue, while interest rate increases will take time to have their full impact.
The Canadian economy is moving further into excess demand and the economic rebound has been much faster than the BoC anticipated.
The more significant of the two forces driving Canadian inflation is largely international and is more complicated for monetary policy to tackle.
Normally, inflationary shocks linked to external supply disruptions don't persist for long, so the BoC typically does not react to such shocks.
The BoC opted against raising rates in 2021 because of what it saw as temporary inflationary shocks from abroad and because the economy was still operating well below its capacity for most of the year.
The Boc also chose not to raise rates in 2021 because premature tightening could have made it harder for people who lost jobs during the pandemic to find work.
The risk of leaving rates low was that higher inflation could start to become entrenched and the risk seemed appropriate at the time, given the slack in the economy at the time.
In July, the BoC will provide an initial analysis of its inflation forecast errors.
The US Bureau of Labor Statistics (BLS) will release the May jobs report on Friday, June 3 at 12:30 GMT and as we get closer to the release time, here are the forecasts by the economists and researchers of 11 major banks regarding the upcoming employment data.
After an increase of 428K jobs in April, May's report is set to show a somewhat lower advance of 325K while a low unemployment rate of 3.6% is set to make way to an even lower level of 3.5%.
Commerzbank
“In May, we expect another noticeable increase in employment, even though the various negative factors suggest that the momentum is slowing. We forecast job growth of 300K, roughly lower than in April.”
Westpac
“US employment growth looks to be losing momentum but is currently still robust (370K), consistent with a further decline in the unemployment rate. Ahead, we believe employment growth will slow further, as tightening takes effect, and that participation will strengthen, making the unemployment rate of 3.5% expected from this month a likely low for the cycle. Given the tight state of the labour market, hourly earnings will continue to be bid higher, though not as aggressively as in 2021 and at less than the rate of inflation. As a result, real incomes are set to continue falling through 2022.”
TDS
“Employment likely continued to advance firmly in May (300K) but at a more moderate pace after consecutive job gains at 428K in March and April. Employment in the household survey likely rebounded after printing negative in April. We expect this to lead to a drop in the unemployment rate to a post-COVID low of 3.5%. We also look for wage growth to remain steady at 0.3% MoM (5.2% YoY).”
SocGen
“We expect 440K NFP reading in May. Expectations are for moderation but we still see strong hiring in retail franchises. This includes restaurants and hotel chains that are still struggling to find employees and return to normal operations. In April, the unemployment rate held steady at 3.6%, as expected. We look for a modest decline to 3.5% in May. Labor force participation should rise slightly from the lower April pace of 62.2 (which had been a drop from 62.4 in March). Overall, as the unemployment rate dips further below the long-term normal level (4.0% according to the Federal Reserve and 4.4% according to the Congressional Budget Office), each decline should be more challenging. Wages are moderating slightly, but we view the pace of above 4% as still too high and adding to inflation and profit margin concerns. Workers should enjoy a wage that is above inflation as long as labor productivity is positive.”
NBF
“Hiring should have continued at a strong pace in the month given the very high number of vacancies. Layoffs, meanwhile, could have stayed roughly stable judging from previously released data on initial jobless claims. All told, payrolls may have increased by 325K. The household survey is expected to show a similar gain, a development which could leave the unemployment rate unchanged at 3.6%, assuming a one-tick increase in the participation rate to 62.3%.”
CIBC
“Overall, headcounts likely increased by 300K, which would still be enough to push the unemployment rate down to 3.5%. With hiring likely tilted towards lower value-added services, wage growth likely slowed to 0.3% on the month. We’re below the consensus which could see the USD and bond yields fall.”
Danske Bank
“We expect another strong US jobs report with 400K new jobs in May.”
Deutsche Bank
“We project gains of 325K vs last month's 428K reading that came in above the median estimate of 380K on Bloomberg.”
ING
“US jobs report should be firm (320K). Once again the main constraint will be a lack of worker supply with nearly two vacancies for every unemployed American (we will get an update on vacancies in next Wednesday’s JOLTS report). This means wages will continue to be bid higher and the unemployment rate will likely fall to 3.5%.”
Wells Fargo
“We forecast NFP to rise 325K in May and look for the unemployment rate to decline to 3.5%. A 325K increase, should it occur, would mark a moderation from the job gains seen over the past couple of months. Regional Fed employment indices improved in May, but at a cooling pace. The job openings rate has also appeared to top out and small business hiring plans have softened. With job openings more smoothly translating into new hires, stiff competition for workers will presumably improve and help quell wage pressures. We forecast average hourly earnings to rise 0.4% MoM in May.”
Citibank
“We continue to expect that monthly job gains are likely to slow over the coming months as labor supply shortages limit the pace of hiring, with 315K payrolls added in May and some further slowing back towards a pre-pandemic pace of ~150K-250K over the coming months.”
Vice Chairwoman of the US Federal Reserve Lael Brainard said on Thursday that the Fed is seeing mixed signals on the economy, but the number one priority remains getting inflation down, reported Reuters citing an interview on CNBC. Brainard added that she does expect to see some cooling of the economy over time, and that she does expect to see some moderation and a better balance in the labour market.
Regarding moderation of inflation and the economy, Brainard warned that it too early to say that the Fed is seeing this, and that she wants to see a consistent string of data showing this is the case. There's a fair amount of uncertainty, she continued, though she added that its clear that the Fed needs to get inflation down.
There is a path to do this with a growing economy and moderating labour market, she continued, adding also that there is a path to see demand cooling, inflation coming down and the labour market still strong. Economists refer to this as a "soft landing".
The economy has a lot of momentum, Brainard added, noting that the Fed is going to do what is necessary to bring inflation back down. Businesses, households and balance sheets are starting this process from a very healthy position, she continued.
Financial conditions have tightened quite a lot and are a lot tighter than pre-pandemic levels, Brainard observed. While the Fed cannot affect supply shocks, Brainard said the central bank has confidence that it has the tools to start cooling demand, adding that monetary policy transmission is already working.
Brainard noted that market expectations for 50 bps rate hikes at the next two meetings seem like a reasonable path, before adding that, regarding September's meeting, its harder to say, as she does not have a clear sense of where the economy will be in September. If inflation hasn't sufficiently decelerated, it may be appropriate for another 50 bps rate hike, she said.
Conversely, if demand does moderate and inflation decelerates then the pace of hikes could slow to that prices by markets (25 bps per meeting). It is important to keep in mind that while the Fed is raising interest rates, it is also shrinking its balance sheet, Brainard added, and this is also tightening financial conditions.
Quantitative Tightening might be worth another 2-3 rate hikes, she stated and the Fed takes this into account when assessing financial conditions.
- EUR/USD is trading higher by about 0.5% on Thursday as US yields ease amid mixed US jobs data pre-Friday’s NFP.
- The pair has rebounded back to around 1.0700, though remains capped under its 50DMA.
- Buck bulls may come back if Friday’s US jobs data reveals hotter than expected wage growth.
EUR/USD rebounded on Thursday, though was unable to break back above the 1.0700 level or its 50-Day Moving Average just above it at 1.0723 and has since pulled back to change hands just below 1.0700. The pair is nonetheless still trading with on-the-day gains of about 0.5%, as the US dollar eases across the board amid a pullback from earlier weekly highs in US yields.
The buck had been given a boost on Wednesday following stronger than expected US ISM Manufacturing PMI numbers for May, whilst a barrage of employment data on Thursday (Q1 Unit Labour Cost, May ADP Employment Change and weekly jobless claims) failed to spur a similar reaction. That perhaps isn’t too surprising given the upcoming release of the official US labour market report for May on Friday, which is deterring currency market participants from placing any big dollar bets based on labour market considerations for now.
EUR/USD is now back to trading with only very slight losses on the week, with the pair also still deriving support from hot Eurozone inflation figures that showed price pressures reaching record highs last month. The latest inflation data means that a 50 bps rate hike from the ECB at its July meeting is on the table, with some even going so far as to bet that the ECB might break from its recent guidance and lift interest rates even sooner than the July meeting (i.e. this month?).
Hot Eurozone inflation, a hawkish ECB plus a growing sense since April US Consumer Price Inflation (CPI) and Core PCE data was released last month that US inflation might have now peaked, reducing the pressure on the Fed to tighten so aggressively in H2 2022 and 2023, have been key factors supporting EUR/USD in recent weeks. As of Thursday, the pair is trading nearly 3.5% higher versus mid-May lows in the mid-1.0300s.
But there is a risk that Friday’s US jobs report rekindles some USD strength, if it shows US wage growth picking up once again. Labour market developments that raise the risks of high US inflation becoming embedded (such as rapid wage growth) will encourage the Fed to remove their foot from the monetary accelerator and onto the break at a faster pace. In this scenario, the EUR/USD bears will be eyeing a drop back towards the 21DMA around 1.0600.
A more consistently hawkish-sounding European Central Bank (ECB) and China reopening, has neutralised the US Dollar Index (DXY) upside. However, it is still too early to call a long-term DXY peak, in the opinion of economists at Westpac.
More hawkish ECB countering the Fed for now
“China reopening hopes, rate hike rethink in the US and a decidedly more hawkish ECB have neutralised USD upside recently.”
“The greater risk is surely that the ECB does not deliver against rate expectations than the Fed.”
“DXY could ease back as far as 100 near-term, but it’s still too early to call a peak in the multi-month bull trend.”
EUR/USD has recovered around half of Wednesday’s decline. The pair needs to close above the 1.07 to improve its technical outlook, economists at Scotiabank report.
Support aligns at 1.0680
“A firm break past 1.07 to close above it on the day would add some bullishness back into the EUR technical picture.”
“Support is 1.0680 followed by the 1.0640/60 zone and yesterday’s low of 1.0627.”
The loonie rebounds after dipping to the upper 1.26s against the US dollar. Economists at Scotiabank expect the USD/CAD pair to witness additional losses towards the 1.25 zone.
Spreads to support gains
“We think yield spreads can move a bit further in the CAD’s favour in the coming weeks as a result, helping support CAD gains towards the 1.25 area.”
“The USD’s rebound from yesterday’s low just ahead of 1.26 formed a bullish signal on the short-term chart (bull ‘hammer’) but the lack of upside follow-through demand over the past few hours along with a fairly firm rejection of the 1.2690 resistance zone suggest that the broader trend lower remains intact.”
“A break under 1.2600/10 targets a drop to 1.2550.”
- EUR/USD reclaims ground lost and advances beyond 1.0700.
- The 1.0780/90 band emerges as a key resistance area.
EUR/USD retakes the area above the 1.0700 yardstick and reverses two consecutive daily pullbacks.
The surpass of the 1.0780/90 region, where the May high and the 3-month resistance line are located, should alleviate the downside pressure and allow a potential move to he weekly peak at 1.0936 (April 21).
In the longer run, the pair’s bearish view is expected to prevail as long as it trades below the 200-day SMA at 1.1237.
EUR/USD daily chart

GBP/USD has rebounded to the mid-1.25s on Thursday. In the opinion of economists at Westpac, surprisingly firm business reports may support the pound, but it remains vulnerable as it consolidates.
Pressure on PM Johnson is likely to resume
“BoE releases its latest inflation expectations survey at the end of next week. It is likely to be well above the peak of its data history (4.4% in 2008) and a spike to 5.0% or more will cement further BoE rate hikes but will also increase the risk of a cost-of-living induced recession. Countering that risk have been a series of persistently firm business-related surveys.”
“There are two by-elections likely towards the end of June which will be seen as key tests of Johnson’s and Conservative support. A constant flow of dissent could lead to a full leadership challenge should those Tory seats be lost.”
“Despite the prospect of higher rates, GBP remains vulnerable to retesting its recent lows.”
Bounce in Treasury yields helped USD/JPY back above 130. In the view of economists at Westpac, risks over the week ahead look to be for a run at the early May high of 131.35.
Tight correlation between USD/JPY and the 10 year US-JP yield spread
“The correlation between USD/JPY and the 10-year US-JP yield spread has been tight in recent months. And with BoJ officials this week once again dismissing talk of e.g. widening the 0% +/-0.25% yield target on the 10yr JGB, this spread remains overwhelmingly driven by the 10yr Treasury yield.”
“With USD/JPY back above 130 for the first time since 12 May, risks over the week ahead look to be for a run at the early May high of 131.35.”
OPEC+ nations agreed on Thursday to lift output by 648K barrels per day (BPD) in both July and August, according to sources speaking to Reuters, in line with the recommendation made by the group's Joint Ministerial Monitoring Committee earlier in the day.
The aussie has outperformed most of the G10 over the week. The Reserve Bank of Australia (RBA) could underpin the AUD on a 40 basis point rate hike, economists at Westpac report.
AUD’s ranges to move lower over June
“The fragile foundations of global equities leaves us skeptical of the sustainability of the aussie’s probes above 0.72.”
“If the RBA delivers the 40bp hike to 0.75% that we expect and remains upbeat on the growth outlook, AUD/USD should be able to hold in the 0.71 to low 0.72 area but with ranges to move lower over June.”
- DXY comes under pressure after two daily gains in a row.
- The leg lower could revisit the 101.30 region near term.
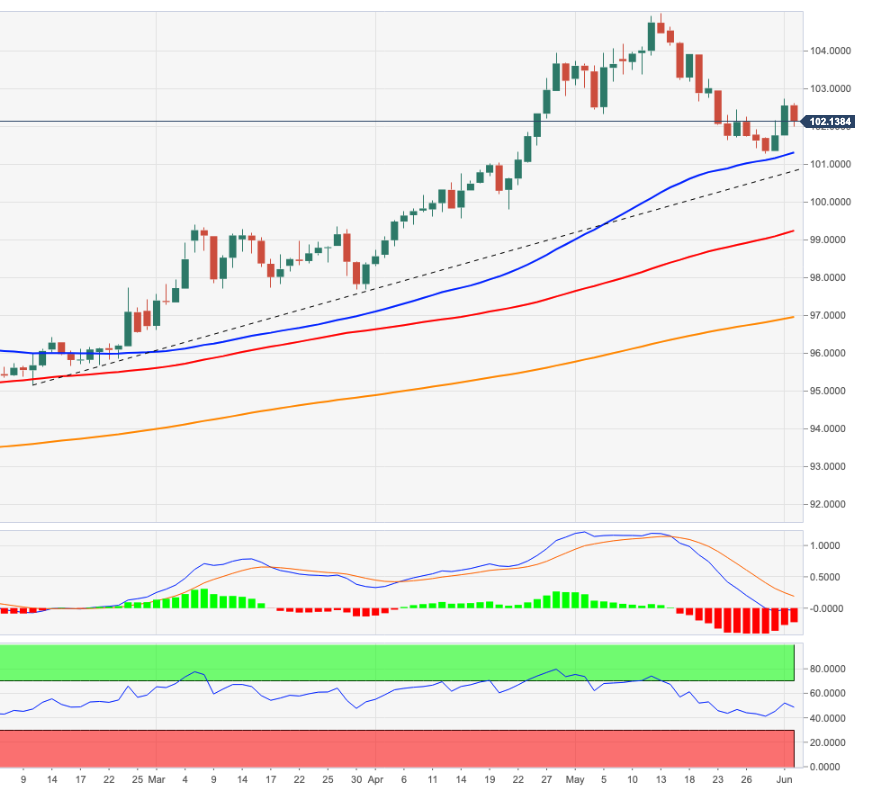
DXY reverses the recent upside and retests the 102.00 neighbourhood on Thursday.
The inability of the dollar to spark a more serious rebound could prompt sellers to return to the market and shift the focus to a potential test of the Mat low at 101.29 (May 30), which is also underpinned by the proximity of the 55-day SMA, today at 101.31.
As long as the 3-month line around 100.90 holds the downside, the outlook for the index should remain constructive.
Looking at the longer run, the outlook for the dollar is seen constructive while above the 200-day SMA at 96.94.
DXY daily chart
- Silver prices are holding onto gains in wake of a barrage of US labour market data.
- XAG/USD was last up around 1.3% in the $22.10 area and eyeing a test of last week’s highs.
- Focus is now turning to Friday’s official labour market report.
A barrage of US labour market data in recent trade gave mixed signals, with ADP’s estimate of employment change for May missing consensus and adding some downside risks to the market’s expectations for a 325K gain in non-farm payrolls in May on Friday, while the second estimate of Q1 Unit Labour Costs saw an upward revision to 12.6% QoQ from an already spicey 11.6%. Weekly jobless claims data was also robust, but the net impact has been that the US dollar has fallen to fresh session lows in recent trade as US yields continue to trade with losses on the day.
This has created a favourable backdrop for spot silver (XAG/USD) prices, which were last trading up about 30 cents or roughly 1.3% on the day in the $22.10 area per troy ounce. That marks a more than 3.0% bounce from Wednesday’s sub-$21.50 lows, with the bulls now eyeing a test of last week’s highs just under $22.50.
However, any bullish breakout in silver will have to wait until after Friday’s official US labour market report is released. If job gains do underwhelm, thus indicating a weaker-than-expected economy and less pressure on the Fed to tighten monetary policy so aggressively, that could provide impetus to the bulls. A break above resistance in the $22.50 area would open the door to a run higher towards $23.00 and resistance in the mid-$23.00s.
Note that traders will also be closely watching Friday’s US wage growth metrics and if these surprise on the upside, that would come as a worry to the Fed (and markets), as everyone has been hoping that inflation might have now peaked. In this case, a dip back below the 21-Day Moving Average (at $21,76), which XAG/USD has been pivoting either side of in recent weeks, is on the cards, plus a test of earlier weekly lows in the mid-$21.00s.
- Gold Price preserves its bullish momentum following Wednesday's rebound.
- Mixed data releases from the US weigh on the greenback on Thursday.
- 10-year US Treasury bond yield settles around 2.9% ahead of US jobs report.
Gold Price extended its recovery beyond $1,850 on Thursday after having registered daily gains on Wednesday. XAUUSD paid no attention to rising US Treasury bond yields mid-week and took advantage of the broad-based selling pressure surrounding the euro and the British pound.
Dollar rally loses its steam
The fact that gold managed to reclaim the critical 200-day SMA shows that buyers remain interested. Friday's May jobs report from the US could ramp up the market volatility ahead of the weekend. Meanwhile, the renewed dollar weakness on Thursday amid mixed data releases from the US help XAU/USD keep its footing.
Also read: Gold Price Forecast: XAUUSD in search of a clear direction, awaits NFP.
The monthly report published by the ADP showed on Thursday that private-sector employment in the United States rose by 128,000 in May, compared to the market forecast of 300,000. April's reading of 247,000 got revised lower to 202,000, Commenting on the data, “the job growth rate of hiring has tempered across all industries, while small businesses remain a source of concern as they struggle to keep up with larger firms that have been booming as of late," said Nela Richardson, chief economist at ADP. On the other hand, the US Bureau of Labor Statistics (BLS) reported that Unit Labor Costs increased by 12.6% in the first quarter following the 11.6% jump recorded in the previous quarter.
Gold Price ignores rising US yields for now
Comments from Fed officials provided a boost to the US Treasury bond yields on Wednesday and the dollar outperformed its rivals. St. Louis Federal Reserve Bank President James Bullard said on Wednesday that he was sceptical about recession probabilities. On a similar note, Richmond Fed President Thomas Barkin told Fox Business that the latest data or the actions of business executives were not suggesting that the economy was moving toward a recession. In addition to these remarks, the Fed's balance sheet reduction started on June 1st, allowing the 10-year yield to climb to the 2.9% area.
Federal Reserve building in Washington, D.C.
Nevertheless, XAUUSD stayed relatively resilient despite rising yields. XAUEUR and XAUGBP pairs both gained more than 1% on Wednesday, revealing that gold was able to capture some of the capital outflows out of the euro and the British pound. The European Central Bank (ECB) and the Bank of England (BOE) face a tough balancing act as the worsening economic outlook alongside high inflation causes policymakers to reassess how they should approach policy tightening moving forward.
The BLS will release the Nonfarm Payrolls (NFP) data for May on Friday. Markets expect payrolls to rise by 325,000 following April's increase of 428,000. Unless the headline NFP print offers a big negative surprise, investors are likely to react to the wage inflation data. On a yearly basis, Average Hourly Earnings are forecast to arrive at 5.2%, down from 5.5% recorded in April. The Fed grows increasingly concerned about wage growth feeding into consumer inflation. In case the US job report shows an improvement in the Labor Force Participation Rate and a retreat in wage inflation, the dollar could come under selling pressure and open the door for additional gold gains and vice versa.
Gold Price technical outlook
Gold Price dropped below the key 200-day SMA, which is currently located at $1,840, on Wednesday but managed to close the day above that level. XAUUSD faces next resistance at $1,865 (static level) ahead of $1,875 (Fibonacci 38.2% retracement of the latest downtrend) and $1,890 (100-day SMA).
On the downside, a daily close below $1,840 could be seen as a significant bearish development and attract sellers. In that case, additional losses toward $1,830 (June 1 low) and $1,810 (the end-point of the downtrend) could be witnessed.
Meanwhile, the Relative Strength Index (RSI) indicator on the daily chart recovered toward 50, suggesting that gold sellers remain on the sidelines for the time being.
Gold Price correction looks completed
- Unit Labour Cost growth was revised higher to 12.6% QoQ from 11.6% for Q1 2022.
- The DXY saw some initial strength though this has now been pared.
The second estimate of Unit Labour Cost growth in the first quarter of 2022 was revised higher to 12.6% QoQ from an initial estimate of 11.6%, according to the latest data released by the Bureau of Labour Statistics and Department of Labour released on Thursday.
Market Reaction
In wake of data showing that wage pressures were even higher than expected in the first quarter of this year, the DXY saw some initial upside, though has since pared most of this back and continues to trade close to lows of the day.
Weekly initial jobless claims in the US fell to 200,000 in the week ending 28 May, below the expected drop to 210,000 from 211,000 a week earlier, data released by the US Labour Department on Thursday showed. That meant the four-week average number of claims fell to 206,500.
Meanwhile, Continued Claims fell to 1.309 million in the week ending on 21 May, from 1.343 million a week prior, larger than the expected drop to 1.325 million. That meant the insured unemployment rate fell back to 0.9% from 1.0% a week earlier.
Market Reaction
There wasn't really any market reaction specifically to the latest weekly jobless claims data.
- ADP's estimate of US private sector employment change was a gain of 128K in May, below expectations.
- The buck weakened as a result, with the DXY edging to fresh session lows.
Private sector employment in the US rose by 128,000 in May according to US payroll company ADP's latest estimate of employment change released on Thursday. That was below expectations for 300,000 rise and lower than April's 247,000 gain.
Market Reaction
Though ADP has a patchy record in recent months in terms of predicting the official non-farm payroll change number, which is set to be released on Friday, the downbeat data has nonetheless weighed slightly on the US dollar in recent trade. The DXY dropped a couple of pips to hit fresh session lows in just above 102.10 in recent trade, but has since bounced a little.
- Better risk appetite has seen GBP/USD rebound to the mid-1.2500s on Thursday despite UK market closures.
- But the pair remains at risk of further downside if upcoming US data points to further economic strength there.
Despite the closure of UK markets for the rest of the week amid public holidays to commemorate the Queen’s platinum jubilee as head of state, and the lower than unusual trading in volumes in global FX markets as a result, sterling is one of the better performing G10 currencies on Thursday. A rebound in global risk appetite after yesterday’s more risk-off session, as evidenced in US equities trading higher in the pre-markets, seems to be the main culprit behind GBP/USD’s 0.5% rally on Thursday from the 1.2460s to current levels near 1.2550.
But that still leaves GBP/USD trading lower by roughly 0.6% on the week and nearly 1.0% lower versus earlier weekly highs in the upper 1.2600s. Though the pair is still trading higher by over 3.0% versus last weak’s lows after the US dollar was weakened in recent weeks as the idea that inflation in the US might have already peaked gained traction, divergence in the outlook for US/UK economic growth and Fed/BoE monetary policy remains a major headwind for the pair.
Wednesday’s UK and US PMI data for May highlighted this. The rest of the week will of course be quiet in terms of the UK economic calendar, but quite the opposite for the US. First up on Thursday, US payroll company ADP’s estimate of private employment change in May will be released at 1215GMT and will, as usual, help market participants guage their expectations for Friday’s official non-farm payrolls change figure.
Continued robust employment gains would add further evidence to the idea that the US economy is holding up well for now and could weigh on GBP/USD once again between now and the end of the week. Traders should also keep an eye on remarks from typically quite hawkish Fed policymaker Loretta Mester later in the US session, who will likely double down on the Fed’s guidance towards several further 50 bps rate hikes at upcoming meetings.
- EUR/JPY falters once again just ahead of the 139.00 yardstick.
- Further advance should now target the 2022 high at 140.00.
EUR/JPY extends the strong performance for yet another session, although a breakout of the 139.00 mark remains elusive so far.
The cross now needs to clear the area of resistance near 139.00 to allow for bulls to challenge the 2022 high at 140.00 (April 21) in the not-so-distant future.
In the meantime, while above the 2-month support line near 135.20, the short-term outlook for the cross should remain bullish.
EUR/JPY daily chart
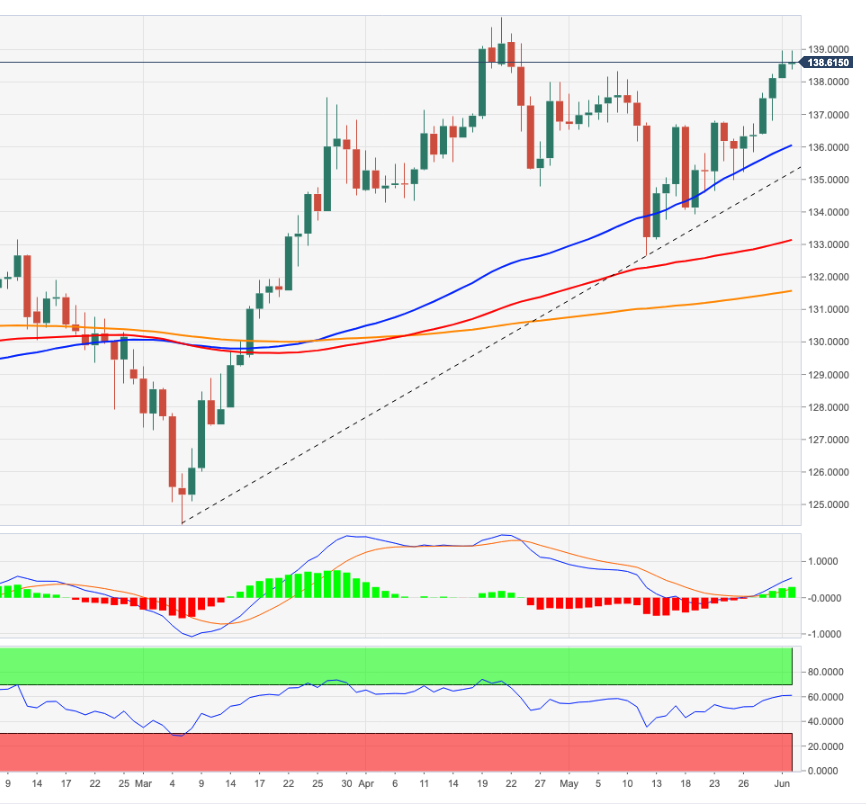
Economist at UOB Group Lee Sue Ann assesses the latest inflation figures in the euro area and its potential impact on the ECB’s policy.
Key Takeaways
“Eurozone CPI rose to an all-time high of 8.1% y/y in May, up from 7.5% y/y in Apr. The acceleration was driven by food and energy largely affected by the impact from Russia’s invasion of Ukraine. Core CPI rose to 3.8% y/y, up from 3.5% y/y in Apr.”
“Since the Apr meeting, however, widespread comments from doves and hawks alike, suggest that the European Central Bank (ECB) will hike rates as soon as Jul, an option (among several) clearly favored by the hawks in Apr. Following the recent rhetoric from the ECB, 25bps moves in Jul and Sep seem like a done deal.”
“But we are also unconvinced of aggressive hikes at the ECB and believe that the process of monetary policy tightening will be gradual and far less sizable than financial markets are currently envisaging. We will be finalizing our forecasts following the next ECB meeting on 9 Jun, likely looking at two 25bps hikes this year and then a pause, with two further 25bps increases through 2023.”
- USD/JPY turns red for the first time this week, as sellers return.
- The US dollar drops with the Treasury yields amid a risk-on mood.
- The pair drops towards 21-DMA as RSI turns south ahead of US data.
USD/JPY is trading under 130.00 in the European session, retreating from three-week highs of 130.24 reached earlier in the Asian trades.
The pair tracks the US dollar price action, falling in tandem amid the return of risk appetite and easing oil prices. Further, the pullback in the US Treasury yields also collaborate with the corrective decline in the spot.
Meanwhile, traders seem to have shrugged off the dovish commentary from Bank of Japan (BOJ) board member Seiji Adachi. Adachi said that the central bank’s efforts to stem weak yen by tightening monetary policy would squeeze corporate funding.
All eyes now remain on the US ADP jobs data, a precursor to Friday’s payrolls, which could have a significant market impact, in terms of the dollar and yields reaction.
Technically, USD/JPY’s daily chart shows that the price has snapped its three-day uptrend, which kicked in following the confirmation of a falling wedge breakout on Monday.
With a pause in the ongoing rally, the spot heads back towards the horizontal 21-Daily Moving Average (DMA) resistance now turned support at 128.80.
Ahead of that level, sellers will challenge the 129.50 psychological level.
The 14-day Relative Strength Index (RSI) has turned south while above the midline, justifying the latest leg down in the pair.
USD/JPY: Daily chart
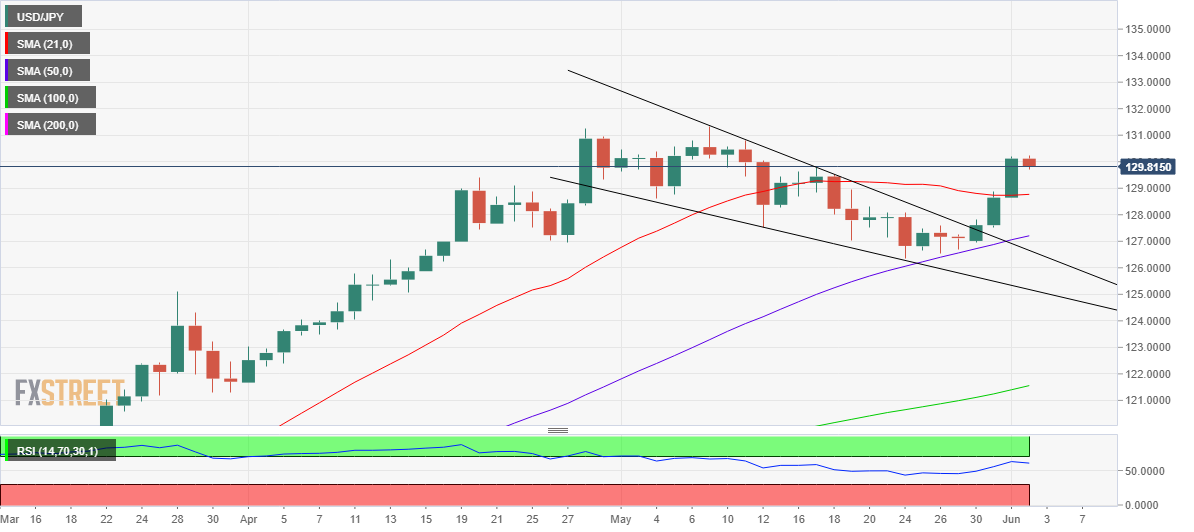
However, if bulls manage to defend the 129.50 demand area, then a rebound towards the 130.00 round figure will be inevitable.
The next bullish target will be the intra-day highs of 130.24, above which doors will open up towards the multi-year highs of 131.34 reached last month.
USD/JPY: Additional levels to consider
“China’s monetary policy will stabilize economic growth, employment and prices,” the People’s Bank of China’s (PBOC) Vice Governor said on Thursday.
Additional comments
Will use various policy tools to step up liquidity injections to maintain ample liquidity.
Will require financial institutions to maintain prudence in operations, control risks.
Relatively stable returns on yuan assets will help attract foreign investment.
Will strengthen the implementation on prudent monetary policy, aim for appropriate front loading.
Gold has climbed back above $1,850. Today will see participants on focusing on the publication of the ADP’s employment figures and initial jobless claims in the US. Robust figures could drag the yellow metal down again, economists at Commerzbank report.
Gold price up despite headwind
“The price increased despite the US dollar appreciating noticeably and bond yields rising further. The upswing is all the more remarkable given that the gold ETFs tracked by Bloomberg also registered outflows of 2.7 tons yesterday.”
“The US labour market is very tight, serving as a key argument for Fed rate hikes. Robust data today could push rate hike expectations further up and put pressure on the gold price again.”
- Gold Price remains supported above 21-DMA, with eyes on $1,870.
- Risk-on flows down the dollar alongside the yields, favor XAUUSD bulls.
- US ADP jobs beat may revive aggressive Fed tightening bets, cap gold’s rebound.
Gold Price is building on the previous rebound from ten-day lows of $1,829, as bulls remain in total control in the European session.
The European markets find some comfort from the retreat in oil prices, amid hopes for a concerted effort to increase supply, which has helped lift the overall market mood and trigger a fresh bout of broad US dollar sell-off.
The US Treasury yields are also on a retreat across the curve, adding to the downside in the greenback. The pullback in the US rates could be associated with the profit-taking slide after the benchmark 10-year US yields faced rejection just below the key 3% level.
The bright metal also continues to benefit from the persistent concerns over surging inflation globally, which could temper the economic outlook. Further, the renewed US-Sino trade concerns and the ongoing Russia-Ukraine crisis keep the sentiment around the traditional safe-haven buoyed.
Gold traders now look forward to the US ADP Jobs data for fresh dollar valuations. A print above the expected 300K figure in May could bring the aggressive Fed tightening expectations back to the fore, which could check the renewed upside in the bullion.
The main event risk this week, however, remains the May month US Nonfarm Payrolls data, which will be eagerly waited for the next direction in the USD-priced metal.
Gold Price: Daily chart
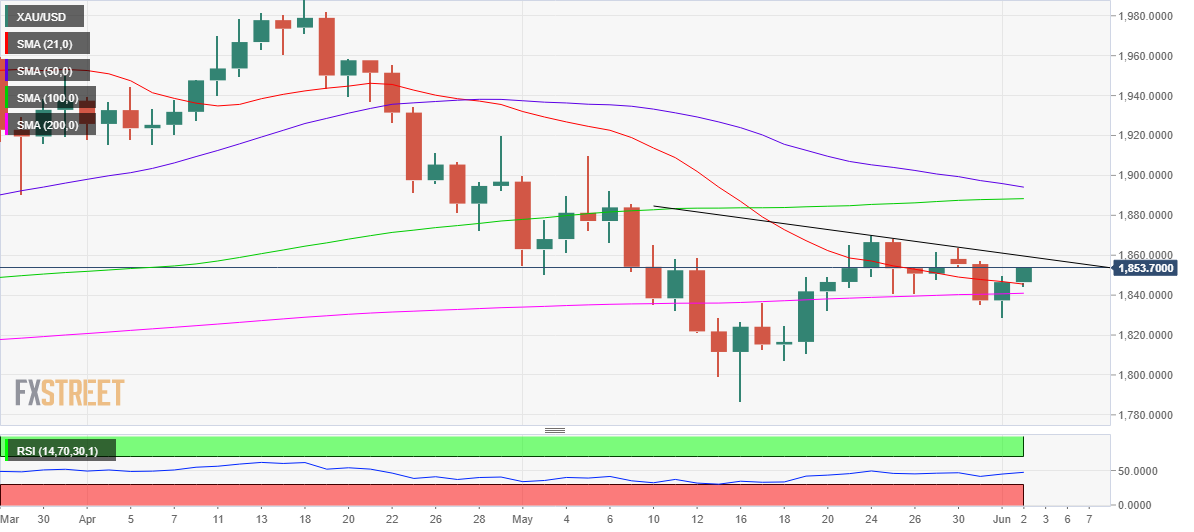
The next key resistance level is seen at $1,860, which is the descending trendline hurdle. A firm break above the latter will call for a retest of the previous week’s high of $1,870.
Also read: Gold Price Forecast: XAUUSD in search of a clear direction, awaits NFP
The 14-day Relative Strength Index (RSI) is sitting just beneath the midline, suggesting that recovery attempts are likely to remain shallow and sellers could jump in on the bounce.
A breach of the 21-DMA at $1,845 once again will expose the 200-DMA support of $1,841, below which the previous day’s low of $1,829 will be put to test.
Gold Price: Additional levels to consider
EUR/USD has managed to rebound following Wednesday's sharp decline. As FXStreet’s Eren Sengezer notes, the pair approaches key resistance area that could cap the upside as investors await key data releases from the US.
Euro closes in on resistance area that could limit recovery
“The US private sector employment report published by the ADP will be watched closely by market participants. Considering how the upbeat data helped the dollar find demand on Wednesday, a similar market reaction could be witnessed if the data suggest that the US economy remains in a good spot with tight labor market conditions.”
“1.07 (psychological level) aligns as interim resistance ahead of 1.0720 (20-period SMA, 50-period SMA). In case the pair rises above the latter and starts using it as support, the next recovery target could be seen at 1.0740 (static level). Until that happens, the bullish pressure is unlikely to gather momentum.”
“1.0680 (Fibonacci 23.6% retracement of the latest uptrend) could be seen as first support. With a four-hour close below that level, sellers could show interest and drag the pair toward 1.0660 (static level) and the 1.0630/1.0620 area (Fibonacci 38.2% retracement, 200-period SMA).”
- AUD/USD rebounds in tandem with risk, S&P 500 futures jump 0.50%.
- Strong Australian economic data fans aggressive RBA rate hike bets.
- US ADP jobs eyed for the next push higher in the aussie pair.
AUD/USD has staged an impressive comeback in the last hours, as bulls look to recapture the 0.7200 level ahead of the US ADP jobs report.
The latest upswing in the aussie could be mainly linked to the broad slippage in the US dollar, as risk-on flows return in European trading. The overnight slump in oil prices on a potential boost in production from Saudi Arabia and OPEC+ has helped calm investors’ nerves, as they reel from raging inflation.
The safe-haven dollar reversed sharply to near 102.20 versus its main peers after failing to find acceptance above 102.50. Meanwhile, the S&P 500 futures jump 0.50% on the day, reflecting the upbeat market mood.
The major also finds support from upbeat Australian employment and trade balance data, which fanned aggressive RBA rate hike expectations, boding well for the AUD. The Australian Trade Balance came in stronger at A$10.495 billion vs. an estimated A$9 billion.
In witnessing an upturn, the aussie reversed the Asian dip to the 0.7140 region, led by the renewed US-Sino concerns. Reuters reported on Wednesday, “US authorities are ready to implement a ban on imports from China's Xinjiang region when a law requiring it becomes enforceable later in June, citing a US Customs official.”
Looking ahead, the pair awaits the US ADP Employment Change data for fresh impetus, as an above-forecast print could revive the dollar’s demand while weighing negatively on the antipodean. The ADP figure is seen arriving at 300K in May vs. 247K reported previously. The US Factory Orders and the Wall Street sentiment will be also closely eyed for the aussie price action.
AUD/USD: Technical levels to consider
- EUR/USD reverses the recent downside and approaches 1.0700.
- ECB’s Villeroy said the normalization of the policy is necessary.
- US ADP report will take centre stage later in the NA session.
The single currency manages to leave behind two sessions with losses and encourages EUR/USD to advance to the vicinity of the 1.0700 region on Thursday.
EUR/USD up on dollar losses
The better tone in the risk complex favours the resumption of the buying interest in EUR/USD, which now trades at shouting distance from the key barrier at 1.0700 the figure.
Sellers, in the meantime, seem to have returned to the greenback and motivate the US Dollar Index (DXY) to give away part of the gains recorded in the last couple of sessions.
The daily improvement in spot comes amidst higher yields in both US and German money markets and after ECB’s Villeroy deemed as necessary the normalization of the bank’s monetary conditions, although he differentiated this process from tightening.
Later in the session, the only release of note in the region will be the EMU’s Producer Prices for the month of April. It will get more interesting across the pond, where the ADP Employment Change is due seconded by Factory Orders and weekly Claims.
In addition, FOMC’s Logan and Mester will also speak later in the NA session.
What to look for around EUR
EUR/USD’s bounce off 2022 lows near 1.0350 (May 13) has been so far underpinned by unusual hawkish ECB-speak leaning towards an initial rate hike as soon as in July, while the consensus view that the bond-purchase programme should end at some point in early Q3 has also lent legs to the European currency.
In addition, the renewed selling bias in the greenback has also collaborated with the multi-cent upside in the pair, as investors appear to have already pencilled in a couple of 50 bps rate hikes at the June and July gatherings.
However, EUR/USD is still far away from exiting the woods and it is expected to remain at the mercy of dollar dynamics, geopolitical concerns and the Fed-ECB divergence, while higher German yields, elevated inflation and a decent pace of the economic recovery in the euro bloc are also supportive of an improvement in the mood around the euro.
Key events in the euro area this week: EMU Producer Prices (Thursday) - Germany Balance of Trade, Final Services PMI, EMU Retail Sales, Final Services PMI (Friday).
Eminent issues on the back boiler: Speculation of the start of the hiking cycle by the ECB as soon as this summer. Asymmetric economic recovery post-pandemic in the euro area. Impact of the war in Ukraine on the region’s growth prospects.
EUR/USD levels to watch
So far, spot is gaining 0.44% at 1.0691 and faces the immediate up barrier at 1.0786 (monthly high May 30) followed by 1.0936 (weekly high April 21) and finally 1.0965 (100-day SMA). On the other hand, a breach of 1.0627 (weekly low June 1) would target 1.0532 (low May 20) en route to 1.0459 (low May 18).
USD/MXN broke through not just the 20 handle but 19.70 gave way opening up a move down to 19.50 in quick succession. Economists at Rabobank expect a move back above 20 to happen in similar fashion over the course of the next month
Resiliant but risky
“We expect USD/MXN to trade back above the 20 handle before the end of June but the current technical picture does suggest that might come after a test of 19. That said, we do expect the move higher in USD/MXN to happen quickly when it does occur. We, therefore, prefer layering into USD/MXN longs gradually with larger positions the closer the pair moves to 19.”
“We see an implied probability of USD/MXN trading to 16.50 by the end of 2022 at just 3% while the equivalent move higher to 22.5 has around a 24% implied probability of occurring.”
The Malaysian ringgit continued to weaken for a second consecutive month. Economists at MUFG Bank expect the USD/MYR to trend lower towards 4.30 by end-2022.
MYR vulnerable as markets worry about higher interest rates and economic slowdown
“The currency is primarily weighed down by concerns over higher global interest rates and the risk of a general economic slowdown in major economies. Market participants fear that higher interest rates will cause a global recession, which will likely dampen commodity prices and demand for Malaysia’s exports.”
“BNM’s policy rate hike has set expectations towards normalization. We forecast a 25 bp rate hike each quarter, bringing the OPR to 3.00% by the end of June 2023.”
“We forecast USD/MYR at 4.35 at the end of June, moving lower to 4.30 at the end of the year and then 4.28 by end-March 2023. Those forecasts are partly premised on our view of some USD weakness as Malaysia’s interest rate differentials with the US narrow in the coming year.”
USD/CNH is still seen navigating the 6.6500-6.8000 range in the next few weeks, noted FX Strategists at UOB Group Lee Sue Ann and Quek Ser Leang.
Key Quotes
24-hour view: “Our view for USD to “trade within a range of 6.6590/6.6880” was incorrect as it rose to a high of 6.7132 before pulling back. The underlying tone has firmed and USD could edge higher but is unlikely to break the resistance at 6.7350. Support is at 6.6900 followed by 6.6750.”
Next 1-3 weeks: “There is no change in our view from Monday (30 May, spot at 6.7200). As highlighted, the recent choppy price actions have resulted in a mixed outlook and USD could trade within a broad range of 6.6500/6.8000 for now.”
Considering advanced prints from CME Group for natural gas futures markets, open interest increased for the fourth consecutive session on Wednesday, now by around 7.2K contracts. On the other hand, volume went down by around 47.2K contracts.
Natural Gas still targets $9.50
Wednesday’s strong upside in prices of natural gas was accompanied by rising open interest and therefore reinforced the case for the continuation of the uptrend in the very near term. That said, the next up barrier remains at the so far 2022 high near $9.50 per MMBtu (May 26).
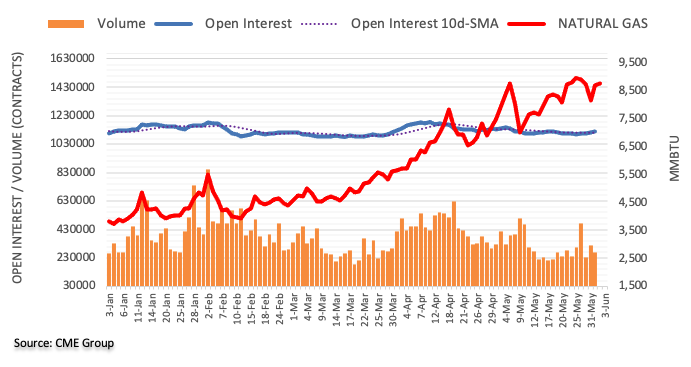
Here is what you need to know on Thursday, June 2:
Rising US Treasury bond yields continued to help the greenback on Wednesday and US Dollar Index (DXY) registered its biggest one-day gain in a month. The DXY stays in a consolidation phase below 102.50 early Thursday as focus shifts to the ADP's private sector employment report and the US Department of Labor's weekly Initial Jobless Claims data. The US economic docket will also feature the Unit Labor Costs data for the first quarter and Eurostat will release the Producer Price Index (PPI) figures for the euro area.
US ADP Employment Change May Preview: The labor market recedes from center stage.
OPEC+ will hold a meeting on Thursday and Reuters reported earlier in the day that the group was looking to come up with a solution to compensate for Russia's one million barrels per day decline in its output due to sanctions. The barrel of West Texas Intermediate (WTI), which rose to $120 earlier in the week, was last seen losing 1.5% on a daily basis near $113.00.
Meanwhile, St. Louis Federal Reserve Bank President James Bullard said on Wednesday that he was sceptical about recession probabilities. Similarly, Richmond Fed President Thomas Barkin told Fox Business that the latest data or the actions of business executives were not pointing to recession. The benchmark 10-year US Treasury bond yield rose more than 2% on Wednesday and was last seen moving sideways slightly above 2.9%. US stock index futures rise between 0.2% and 0.5%, suggesting that the market mood is improving early Thursday.
EUR/USD lost nearly 100 pips on Wednesday but managed to stage a rebound in the European session. Although the pair trades in positive territory, it stays below 1.0700 so far on the day. European Central Bank (ECB) policymaker Francois Villeroy de Galhau reiterated on Thursday that inflation in the euro area was too high and too broad. "Normalization of the ECB policy is required," Villeroy added.
GBP/USD reclaimed 1.2500 on Thursday after having suffered heavy losses on Wednesday. The UK markets will be closed on Thursday and Friday. Hence, the dollar's market valuation should continue to drive the pair's action.
Following the Bank of Canada's decision to hike its policy rate by 50 basis points to 1.5%, USD/CAD edged lower toward 1.2600. Falling crude oil prices, however, made it difficult for the commodity-sensitive loonie to preserve its strength and the pair recovered above 1.2650.
After falling to a fresh multi-week low below $1,830, gold reversed its direction and rose toward $1,850. XAU/USD manages to hold its ground for the time being but another leg higher in US yields could weigh on the pair and vice versa.
Fueled by surging US yields, USD/JPY extended its rally toward 130.00. Bank of Japan (BOJ) board member Seiji Adachi argued on Thursday that trying to stem the weak yen by tightening monetary policy would squeeze corporate funding.
Following the decisive rebound witnessed earlier in the week, Bitcoin came under renewed selling pressure and lost more than 6% on Wednesday. At the time of press, BTC/USD was moving sideways a tad below $30,000. Ethereum closed the second straight day in negative territory and lost nearly 10% during that period. ETH/USD is currently moving up and down in a narrow range near $1,800.
According to FX Strategists at UOB Group Lee Sue Ann and Quek Ser Leang, the next hurdle for USD/JPY emerges at 130.50 in the short term.
Key Quotes
24-hour view: “We highlighted yesterday that ‘upward momentum is still strong and USD could extend its advance to 129.30’. While our view for a higher USD was correct, we did not expect the manner by which it lifted off and surged to a high of 130.18. Further USD strength is not ruled out but in view of the deeply overbought conditions, the pace of advance is likely to be slower and a clear break of the next major resistance at 130.50 is unlikely. On the downside, a break of 129.50 (minor support is at 129.80) would indicate that the current upward pressure has eased.”
Next 1-3 weeks: “While we turned positive in USD on Monday (31 May, spot at 128.00). Yesterday (01 Jun, spot at 128.80), we highlighted that further USD strength would not be surprising and we indicated that resistance is at 129.30 followed by 129.80. We did anticipate the sharp rally as USD surged to a high of 130.18. While USD could continue to strengthen, overbought conditions suggest a slower pace of advance. The next resistance is at 130.50 followed by 130.80. Overall, only a break of 129.00 (‘strong support’ level was at 128.00 yesterday) would indicate that the rapid build-up in momentum has fizzled out.”
- DXY reverses two daily advances and returns to the 102.30 zone.
- The appetite for the risk complex weighs on the dollar.
- US ADP report, weekly Claims next of relevance in the docket.
The US Dollar Index (DXY), which tracks the greenback vs. a bundle of its main competitors, comes under some selling pressure and tests daily lows near 102.30 on Thursday.
US Dollar Index looks to risk trends, docket
The index sheds ground after two consecutive daily gains in response to the re-emergence of the investors’ appetite for the risk-associated universe, all against the backdrop of a renewed upside momentum in US yields.
On the latter, the short end of the curve approaches the 2.70% area and the belly of the curve seems to have retargeted the key 3.00% level.
Later in the US data space, the ADP Employment Change is due seconded by usual Initial Claims and Factory Orders. In addition, Dallas Fed L.Logan (2023 voter) and Cleveland Fed L.Mester (voter, hawk) are due to speak.
What to look for around USD
The dollar meets some resistance in the low-102.00s so far this week, as investors seem to have re-shifted their interest to the riskier assets.
Renewed weakness in the dollar came in response to the rising perception that inflation might have peaked in April, which in turn supports the idea that the Fed may not need to be as aggressive as market participants expect when it comes to raising the Fed Funds rates.
In the meantime, the Fed’s divergence vs. most of its G10 peers coupled with bouts of geopolitical effervescence, higher US yields and a potential “hard landing” of the US economy are all factors still supportive of a stronger dollar in the next months.
Key events in the US this week: ADP Employment Change, Initial Claims, Factory Orders (Thursday) – Nonfarm Payrolls, Unemployment Rate, Final Services PMI, ISM Non-Manufacturing (Friday).
Eminent issues on the back boiler: Powell’s “softish” landing… what does that mean? Escalating geopolitical effervescence vs. Russia and China. Fed’s more aggressive rate path this year and 2023. US-China trade conflict. Future of Biden’s Build Back Better plan.
US Dollar Index relevant levels
Now, the index is retreating 0.31% at 102.23 and faces the next contention at 101.31 (55-day SMA) followed by 101.29 (monthly low May 30) and then 99.81 (weekly low April 21). On the upside, a break above 102.73 (weekly/monthly high June 1) would open the door to 105.00 (2022 high May 13) and finally 105.63 (high December 11 2002).
USD/IDR peaked above 14,700 on 19 May but pulled back after broad dollar weakness emerged. The Indonesian rupiah was adversely affected by export ban in May and is likely to remain impacted by trade balance changes in the months ahead, according to strategists at MUFG Bank.
BI will only hike by the 7D RR from Q3, with a total of 100bps for the year
“We see some rebound in the trade balance from June, after a high of USD7.56 bn in April and an expected dip in May. Meanwhile, BI has utilised the RRR instead of the 7D RR to tighten monetary policy.”
“BI may have found some policy scope to maintain its policy stance after the government’s announcement to increase fuel subsidies and lift the ban on palm oil exports. These will likely respectively cap inflationary pressures and provide some stability to the IDR.”
“We now forecast higher USD/IDR at 14,600 for Q4-2022 and Q1-2023.”
“We now believe that BI will only hike by the 7D RR from Q3, with a total of 100bps for the year.”
During May, the Canadian dollar strengthened versus the US dollar from 1.2820 to 1.2657. Economists at MUFG Bank expect the loonie’s resilience to continue throughout the rest of the year.
CAD gains could stall later in 2023
“Crude oil prices are set to remain elevated before falling from higher levels before year-end and the Bank of Canada is likely to at least match the Fed’s rate tightening actions. That is more likely following the inflation data in Canada. All three core annual inflation readings the BoC monitor were higher than expected. The data increases the likelihood of two 50bp rate hikes at the meetings in June and July.”
“While CAD should recover as the US dollar weakens as the Fed pulls back from tightening to the extent as currently priced, the scope for CAD gains will become more limited given the household sector is more leveraged and hence more sensitive to interest rate increases.”
“Household sector deleveraging post-GFC was not as large as in the US and house price declines could have a more notable impact in slowing economic growth in 2023. That suggests CAD gains could stall later in 2023.”
European Central Bank (ECB) policymaker Francois Villeroy de Galhau said on Thursday, inflation is too high and too broad.
Additional quotes
Normalization of the ECB policy is required.
European growth will be slower in next two years.
Market reaction
EUR/USD is fast approaching the 1.0700 level, adding 0.37% so far.
During May, the New Zealand dollar appreciated modestly against the US dollar from 0.6473 to 0.6502. Economists at MUFG Bank expect the kiwi to strengthen on a more sustainable basis later in the year.
Aggressive tightening well priced so only moderate gains ahead
“The hawkish action from the RBNZ should help limit further declines from here although some renewed selling seems plausible to us given financial conditions could tighten again.”
“The RBNZ now predicts the policy rate reaching 3.25% this year and 3.95% by Q3 2023. That guidance is now more than fully priced suggesting the upside for short-term yields in New Zealand is now limited.”
“If financial conditions continue to tighten, the RBNZ is unlikely to deliver what is currently priced. However, the Fed will also not deliver what is priced and assuming China downside risks recede later in the year and risk aversion recedes then NZD/USD can drift higher on a more sustainable basis.”
“New Zealand’s terms of trade should also provide support. Food prices are set to rise and food makes up a large portion of New Zealand’s key exports. New Zealand is also planning to increase wheat production in order to benefit from global shortages”.
The Australian dollar swung wildly in May. Economists at MUFG Bank expect continued fears over global growth will counter AUD strength in the short-term but believe that the AUD/USD is set to march forward later in the year.
Initial downside risks should subside later in the year
“Over the short-term, we continue to see risks of another correction lower with China growth weak and equity markets globally vulnerable to renewed selling.”
“Later in the year, the slower growth scenario, declines in inflation and tighter financial conditions will likely mean the Fed can pull back from tightening to the extent currently priced. That will help lift AUD. This could well be reinforced then by an improving economic outlook in China. Assuming covid disruptions diminish, policy support in China should result in better economic conditions.”
“A new Labour government in Australia led by Anthony Albanese is unlikely to have implications for monetary policy. Policy differences with the previous government are not significant enough. Hence, initial downside risks should subside later in the year and result in AUD/USD gains.”
The Chinese yuan depreciated slightly against a weaker US dollar in May. The USD/CNY pair is set to trade within a 6.50-6.90 range in the short-term, economists at MUFG Bank report.
USD/CNY likely remain volatile
“We shall see a sequential negative GDP growth in Q2. We expect a sustained but gradual recovery in Q3 and Q4. Together with a potential weaker US dollar in the second half of this year, we expect a modest trend appreciation of CNY in Q3 and Q4, but in near term, factors including recurring growth concerns, China’s covid breakouts and lockdowns, and geopolitical tensions between China and US will likely keep USD/CNY volatile and range-bound between 6.50-6.90.”
“We expect USD/CNY to be at 6.70 by the end of Q2, 6.67 at the end of Q3, 6.64 at the end of Q4, and 6.60 at the end of Q1, 2023.”
The Japanese yen has reversed course versus the US dollar after sustained losses. Economists at MUFG Bank believe that the peak in USD/JPY may be behind us.
Clear turnaround in yen weakness may only materialise later in the year
“Global financial conditions remain highly uncertain and therefore we cannot say with complete confidence that the sell-off of the yen has turned but we do see increasing evidence that the peak in rates may be topping out.”
“We still expect commodity prices to increase further though which may mean a clear turnaround in yen weakness only materialises later in the year, but a peak in USD/JPY may now be in place.”
After advancing by nearly 10% on a year-to-date basis, the US Dollar Index(DXY) has turned and from the intra-day high on 13 May (105.00), the DXY has declined by 3.0%. In the view of economists at MUFG Bank, a turning point in the dollar is looming.
Fed will be in a position later this year to ease off on the tightening cycle
“While we are not confident the US dollar has reached a turning point, the price action in May we believe does suggest a turning point is approaching and that the scope for sustained US dollar strength is limited.”
“The Fed will be in a position later this year to ease off on the tightening cycle which will help turn the US dollar weaker on a more sustained basis.”
- EUR/CHF dropped nearly 50 pips after hot Swiss CPI for May, breaks ascending support line from March.
- Sustained trading below the key DMAs, softer RSI also signal further downside.
EUR/CHF prints a three-day downtrend as bears keep reins at the lowest levels in five-week, down 0.25% around 1.0235 during early Thursday morning in Europe.
The pair slumped 50 pips to form the multi-day low around 1.0218 after the Swiss Consumer Price Index (CPI) for May rose past 0.3% MoM forecast and 0.4% expectations to 0.7%. The YoY figures also rallied to 2.9% versus 2.6% expected and 2.5% prior. In doing so, the quote broke an upward sloping support line from March.
In addition to the strong Swiss data and trend line break, the EUR/CHF pair’s successful trading below the 100 and 200 DMAs, respectively around 1.0325 and 1.0465, also favor sellers.
However, a clear downside break of the 38.2% Fibonacci retracement of the February-March fall, around 1.0218, becomes necessary for the EUR/CHF bears.
Following that, a south-run towards April’s low of 1.0090 and then to the 1.0000 psychological magnet can’t be ruled out.
Meanwhile, the 50% and 61.8% Fibonacci retracement levels, around 1.0295 and 1.0370, may act as additional upside filters to watch during the EUR/CHF pair’s rebound.
EUR/CHF: Daily chart
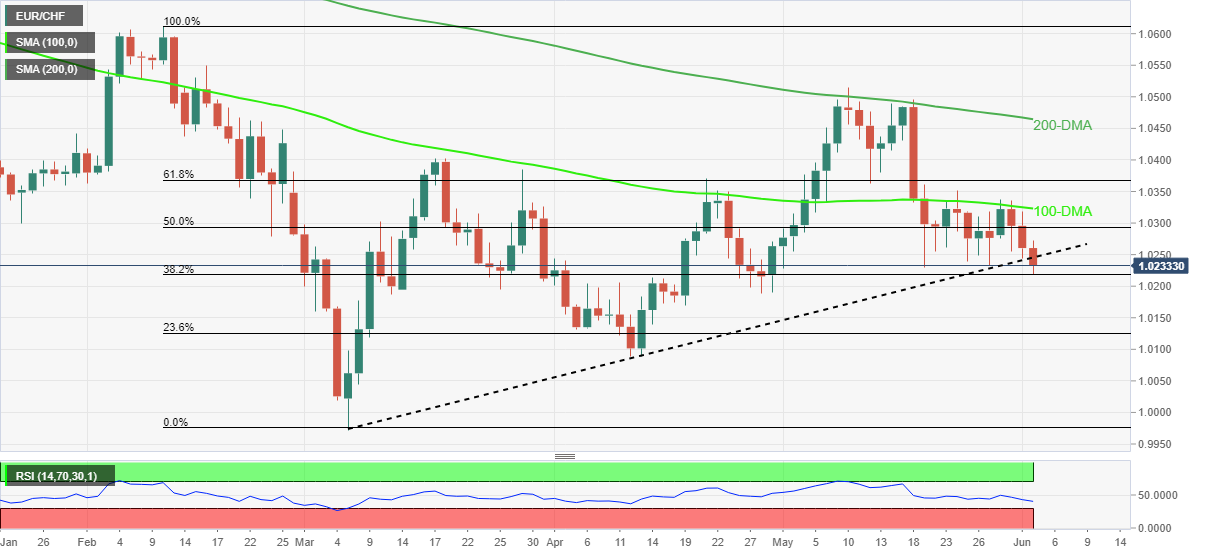
Trend: Further weakness expected
- NZD/USD is bided around 0.6460 as safe-haven assets lose glory.
- A slippage in the US employment data may result in a minor impact on the DXY.
- The US ADP Employment Change is seen at 300k while the US NFP may land at 325k.
The NZD/USD pair has attracted some significant bids after hitting a low of 0.6461 in the European session. A responsive buying action near Wednesday’s low at 0.6465 is indicating that the kiwi dollar is a value bet now and longs could be initiated. At the press time, a rebound in the positive market sentiment has helped the antipodean to recover its intraday losses.
An improvement in the risk appetite of the market participants has brought a decent sell-off in the US dollar index (DXY). The DXY has slipped sharply below 102.40 amid uncertainty over the release of the US Automatic Data Processing (ADP) Employment Change, which is due in the New York session. Investors are seeing the ADP Employment Change at 300k. Also, this week’s US Nonfarm Payrolls (NFP) is expected to land at 325K.
It is worth noting that the US economy added 428k jobs to the labor force last month and an average of 551.6k jobs have been filled in the previous 12-months. May’s employment figure is expecting a sharp decline, however, one should understand that the US economy is handling full-employment levels. Therefore, the employment curve will continue to elevate but at a diminishing rate.
On the kiwi front, the upbeat Caixin Manufacturing PMI failed to strengthen the kiwi bulls. The economic data landed at 48.1, higher than the estimates of 47 and the prior print of 46. Going forward, the discussions over the monetary policy by the Reserve Bank of New Zealand will keep the antipodean active. Investors should be aware of the fact that the Official Cash Rate (OCR) stands at 2%.
GBP/JPY is marching higher from a recent 155.60 low. However, price recoveries can be seen as launchpads for top-picking, according to Benjamin Wong, Strategist at DBS Bank.
A minor bearish head and shoulders top pattern looks plausible
“Seasonality for GBP/JPY is weak for the months May-August; hence we see price recoveries as launchpads for top-picking.”
“The moot question is whether this current rally offers an identical opportunity to short GBP/JPY, given the cross has been guided higher by a rising trendline from 127.63 since late March 2020. If the cross does not sustain a fresh challenge to surmount 168.43, the balance of odds fancies another shorting opportunity.”
“There is the image of a minor head & shoulders top to tap onto; but that needs affirmation of a proper neckline cut.”
Russia is said to agree to OPEC and its allies (OPEC+) compensating for its drop in oil output because of sanctions, Reuters reports, citing an OPEC+ source.
“Any compensation could be approved gradually and there is no guarantee that it will be approved in full later in the day,” the source said.
Market reaction
WTI came under renewed selling pressure on these headlines. The US oil is losing 1.70% on the day to trade at $111.75, as of writing.
The Bank of Canada (BoC) delivered on the widely expected 50bp hike in June. The CAD edged a little lower in the aftermath of the decision. However, economists at Scotiabank expect the USD/CAD pair to plummet towards the 1.2500/50 zone.
Hawkish BoC supports CAD
“The BoC policy decision delivered the expected 50bps hike, taking the Overnight Rate to 1.50%. The rate increase was accompanied by hawkish language which suggests limited CAD downside.”
“Canadian 5Y yields have collapsed the differential over similar US yields since early May; moving to a premium for Canadian yields should support further CAD strength. In addition, we consider: 1) Canada’s positive terms of trade amid still rising commodity prices and 2) relatively better domestic data outcomes compared to US data surprises, suggesting a more resilient economy, as important CAD supports.”
“We look for solid resistance in the 1.2685/1.2715 zone in the short run and strong resistance now in the mid-1.27s.”
“Downtrend in the USD has picked up momentum since edging below key support around 1.2740 and we think the USD is at risk of falling to the 1.2500/50 over the next few weeks. Speculation of a 75bps hike puts 1.24 on the radar over a similar timeframe.”
- USD/CHF slumped 50 pips after Swiss inflation numbers surged in May.
- Swiss CPI rose past market consensus and previous readouts in May, fueling SNB rate hike concerns.
- Softer US Treasury yields also exert downside pressure ahead of the key US data.
USD/CHF collapses around 50 pips to form the daily low of around 0.9575 after hot Swiss inflation numbers for May, published on early Thursday in Europe. In doing so, the Swiss currency (CHF) pair not only snapped the previous two-day uptrend after the data but also drops the most in over a week on the daily basis.
Swiss Consumer Price Index (CPI) for May rose past 0.3% MoM forecast and 0.4% expectations to 0.7%. The YoY figures also rallied to 2.9% versus 2.6% expected and 2.5% prior.
The hot inflation raised doubts about the comments of Vice Chairman of the Swiss National Bank (SNB) Martin Schlegel who said that while inflation in Switzerland is low relative to other countries, it is not irrelevant, reported Reuters. It’s worth noting that SNB Chair Thomas Jordan previously said that "We are moving into an unpleasant phase for monetary policy,” per Reuters.
Not only the Swiss inflation data but softer US Treasury yields, which in turn weigh on the US dollar, also keep the USD/CHF bears hopeful. That said, the benchmark 10-year US Treasury yields dropped 1.4 basis points (bps) to 2.91% at the latest.
The pullback in yields contrasts the previous day’s upbeat data. That said, The US ISM Manufacturing PMI for April rose to 56.1 versus the 54.5 expected and the 55.4 prior. Further, the US JOLTs Job Openings eased below 11.8 prior readings but matched 11.4 market forecasts.
Looking forward, US ADP Employment Change for May, expected 300K versus 247K prior, will be eyed closely due to being the early signal for Friday’s US Nonfarm Payrolls (NFP). Also important to watch is the US Factory Orders for May bearing forecasts of a 0.7% increase compared to 2.2% in previous readouts.
Also read: US ADP Employment Change May Preview: The labor market recedes from center stage
Technical analysis
A clear downside break of the 50-DMA, around 0.9595 by the press time, directs USD/CHF bears towards May’s low of 0.9544.
FX option expiries for June 2 NY cut at 10:00 Eastern Time, via DTCC, can be found below.
- EUR/USD: EUR amounts
- 1.0500 1.6b
- 1.0555 767m
- 1.0650 886m
- 1.0700 1.4b
- 1.0725 1.2b
- 1.0735 3.3b
- 1.0800 683m
- USD/JPY: USD amounts
- 125.50 500m
- 126.00 480m
- 127.00 485m
- 129.50 455m
- 132.00 1.1b
- 132.50 431m
- USD/CHF: USD amounts
- 0.9600 851m
- AUD/USD: AUD amounts
- 0.7055 333m
- 0.7100 330m
- 0.7140 429m
- 0.7300 514m
- USD/CAD: USD amounts
- 1.2595 640m
- 1.2875 380m
-NZD/USD: NZD amounts
- 0.6200 403m
- 0.6500 377m
Iron ore prices have found a floor over recent weeks after a series of supply-side issues tightened the market despite weakness in China. However, the upside will be limited, according to strategists at ANZ Bank.
Limited upside in iron ore prices
“Iron ore prices have found a floor amid renewed supply-side issues. This could develop into gainsasChinese stimulus measures boost sentiment. Ultimately the upside looks limited, as constraints on China’s steel output should keep demand muted.”
“We have raised our end of year target to $130/t. However, our short-term (0-3mth) target remains unchanged at $145/t.”
“We expect prices to trend lower in Q4 and into 2023 as the impact of the stimulus measures peter out and iron ore demand ultimately weakens.”
The Hungarian National Bank (MNB) hiked its main base rate by 50bp earlier in the week and is expected to follow up with a 30bp hike to its one-week depo rate today.
MNB expected to hike rate by 30bp
“MNB will take the depo rate to 6.75%. This is a pretty high-interest rate level for Hungary in absolute terms of course, but the market appears to be increasingly impatient about MNB’s monetary tightening, which results in notable HUF underperformance.”
“A suggestion that monetary tightening can happen more gradually, at a relatively routine pace, is something the FX market appears to dislike.”
“The smaller hike to the depo rate (which effectively acts as upper-bound for the base rate) further intensifies the market’s concerns – hence, we expect HUF to weaken further.”
Many market participants will be keeping an eye on the ADP employment data on Thursday and the US labour market report for May on Friday. However, economists at Commerzbank expect the US dollar to ignore these releases.
US jobs data no longer matters
“To be honest, I don’t think that labour market data will be decisive for the dollar at present.””
“It is up to the individual whether they want to buy or sell the dollar as a result of the labour market data. However, the data does not really provide a particularly good reason at present.”
AUD/USD pair is witnessing a modest downside move after failing to sustain above 0.72. Economists at Westpac believe that the aussie could sustain pullbacks to 0.70 or even below in June.
A recovery to 0.74 or higher in Q3 remains likely
“The economic ripples from Russia’s invasion of Ukraine continue to underpin energy prices, strengthening the outlook for Australia’s already large trade surpluses. But the aussie remains at risk against a US dollar backed by the Fed’s determination to frontload rate hikes and shrink its balance sheet, a notably more aggressive tightening stance than the RBA.”
“Equity markets have helped AUD/USD recently but are hardly on a firm footing, so pullbacks to around 0.70 or below during June would not surprise.”
“A recovery to 0.74 or higher in Q3 remains likely. Australian growth should be swift in Q2 and Q3, supporting pricing for RBA tightening, while China’s policy focus will once again to infrastructure-led growth.”
- Gold Price struggles to extend the previous day’s recovery from a two-week low.
- XAUUSD stays on bear’s radar unless crossing $1,915, multiple EMAs to test bulls before that.
- Treasury yields’ retreat probes US dollar bulls ahead of key data points, market sentiment dwindles.
Gold Price lacks upside momentum, despite bouncing off a two-week low the previous day, ahead of the key US employment data. In doing so, XAUUSD takes clues from sluggish markets, while also failing to cheer softer US Treasury yields and the US dollar retreat, amid mixed concerns.
US ADP, NFP to decorate calendar, Fedspeak eyed as well
To break the current deadlock, gold traders eagerly await monthly prints of the US ADP Employment Change, as well as Nonfarm Payrolls (NFP) for May, up for publishing on Thursday and Friday respectively. The data gains major attention amid the Fed’s latest hawkish commentary and recently upbeat US statistics that renewed calls for the central bank’s aggressive rate hikes. Should the scheduled figures match upbeat forecasts, the US Treasury yields and the US dollar’s anticipated recovery could weigh on the precious metal prices.
Also read: Gold Price Forecast: XAUUSD in search of a clear direction, awaits NFP
Recession woes keep Gold Price heavy

Global markets remain dicey on Thursday after Fed’s Beige Book, as well as comments from St. Louis Federal Reserve Bank President James Bullard, renewed growth fears. Fed’s Beige book raised concerns over economic growth in the US as the majority of districts indicated slight or modest growth while most informed of continued price rises. Also, three districts, out of 12, expressed concerns about a US recession. On the same line were comments from St. Louis Federal Reserve Bank President James Bullard also raised concerns about the US recession as he repeated that a pace of 50 bps hike per meeting is a “good plan” for now. However, Federal Reserve Bank of Richmond President Thomas Barkin mentioned, “You can't find a recession in the data or actions of business execs,'' speaking on Fox Business, which in turn tests the bullion bears.
Firmer US data raise doubts about the recession fears but the same increase the odds of the Fed’s aggression in rate hikes and weighs on market sentiment, as well as gold prices. The US ISM Manufacturing PMI for April rose to 56.1 versus the 54.5 expected and the 55.4 prior. Further, the US JOLTs Job Openings eased below 11.8 prior readings but matched 11.4 market forecasts.
Recession fears and upbeat US data join hawkish Fedspeak to underpin firmer Treasury yields, which in turn play a crucial part in challenging Gold Price. That said, the recent retreat of the benchmark 10-year US Treasury yields, down 1.4 basis points (bps) to 2.91%, fail to please equity buyers amid recession woes.
Headlines concerning China, suggesting a fresh trade war also weigh on the precious metal prices due to the dragon nation’s status as one of the world’s top gold consumers. It’s worth noting that Beijing’s economic hardships also raise questions over the global growth as it is the world’s second-largest economy. Reuters’ news suggesting the US readiness to implement a ban on Xinjiang goods also roil the mood in major markets. Further, comments from China's Ambassador to Australia, Xiao Qian, hint at no relief to Aussie business houses from Beijing’s ban despite the change in government.
Additionally, geopolitical fears surrounding Russia also weigh on the market sentiment and the bullion prices as the hawkish Fed lures safe-haven flows towards the US dollar. Recently, Moscow’s tough fight in Donbas spread pessimism.
Gold Price technical outlook
Gold Price again looks to poke the 200-day EMA level surrounding $1,856 as firmer RSI and bullish MACD signals favor the previous day’s rebound.
However, any further upside past $1,856 will need validation from a confluence of the 100-day EMA and the 50-day EMA near $1,876.
Should buyers manage to cross the $1,876 hurdle, a downward sloping resistance line from March, near $1,915 will be important to watch.
Alternatively, multiple supports around $1,810 and the $1,800 threshold will challenge the XAUUSD bears.
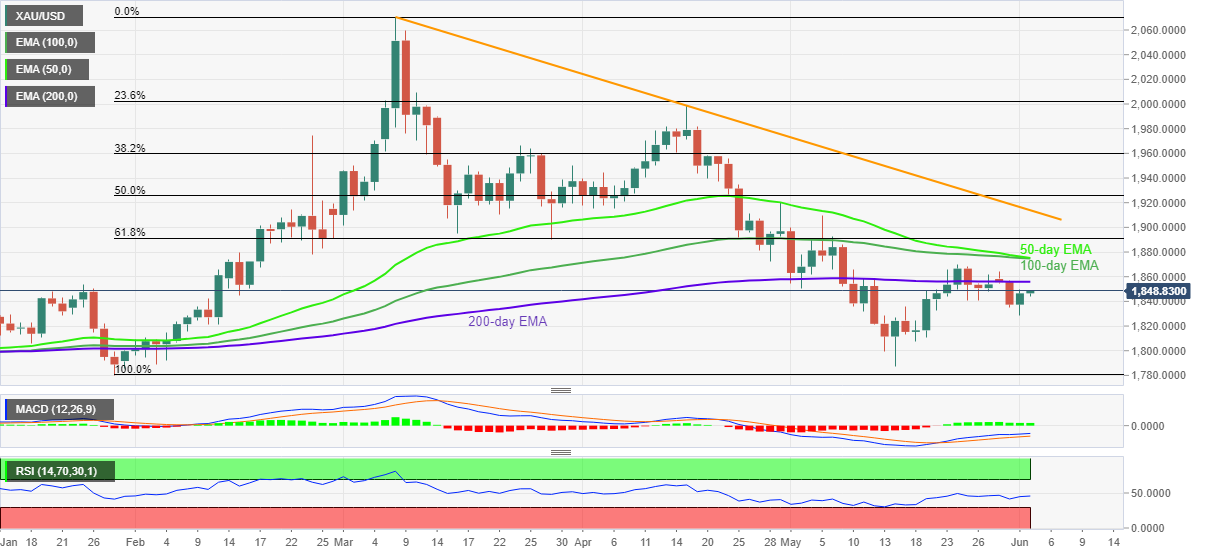
Gold Price signals rebound
The kiwi is lower again below 0.65. As economists at ANZ Bank note, hard landing fears continue to undermine carry.
USD steamrolls its way back into the picture
“The volatility continues as the USD steamrolls its way back into the picture, trumping the currencies of even the most hawkish central banks like the RBNZ, and the Bank of Canada, who hiked another 50bps.”
“On the global side, it’s all about bond yields and equity prices, but locally, we remain attuned to the hard landing fears, which undermine carry.”
“Support 0.6230/0.6410 Resistance 0.6545/0.6625/0.6840.”
Gold Price clings to 21-Daily Moving Average (DMA) at $1,845 after staging a comeback from ten-day lows. As FXStreet’s Dhwani Mehta notes, XAUUSD is in search of a clear direction.
Gold is lacking the follow-through recovery momentum
“Bulls remain cautious amid resurfacing aggressive Fed rate hikes bets and ahead of the US ADP jobs data, which seen rising to 300K in May vs. 247K previous. Strong US employment numbers will add to the hawkish Fed rate hike track, which could likely bolster the dollar’s demand at gold’s expense.”
“Gold has opened Thursday above the bearish 21-DMA at $1,845, which is now acting as strong support. Bulls could take out the $1,850 hurdle should the recovery momentum extend in the sessions ahead. The next key resistance level is seen at $1,859, which is the descending trendline hurdle. A firm break above the latter will call for a retest of the previous week’s high of $1,870.”
“A breach of the 21-DMA once again will expose the 200-DMA support of $1,841, below which the previous day’s low of $1,829 will be put to test. The next downside target aligns at the $1,820 round figure before the May 19 low of $1,811 could be threatened.”
- The greenback bulls challenge the demand zone, which is placed in a 1.2548-1.2570.
- An Inverted Flag formation advocates a follow-up sell-off after a topsy-turvy move.
- A death cross, represented by the 50- and 200-period EMAs add to the downside filters.
The pound bulls have displayed a subdued performance in the entire Asian session amid the unavailability of any potential trigger. A phase of topsy-turvy moves in the cable is witnessed after a sheer downside move from a high of 1.2600. The asset experienced intense selling pressure after slipping below the critical support of 1.2558.
On an hourly scale, the GBP/USD pair has formed an Inverted Flag chart pattern that indicates further downside after a rangebound move. Usually, an Inverted Flag dictates the initiation of fresh shorts by those investors, which prefer to execute positions after the establishment of a downside bias. The cable is hovering near the demand zone placed in a 1.2548-1.2570.
A death cross has been displayed by the 50- and 200-period Exponential Moving Averages (EMAs) at 1.2555, which signals more pain ahead.
Meanwhile, the Relative Strength Index (RSI) (14) is oscillating in a bearish range of 20.00-40.00, which adds to the downside filters.
Should the asset drops below Wednesday’s low at 1.2459, the greenback bulls will get strengthened and will drag the asset towards May 20 low at 1.2438. A breach of the latter will open room for more downside to near the round-level support at 1.2400.
On the contrary, an upside move above Tuesday’s high at 1.2630 will trigger an initiative buying action, which will drive cable towards May’s high at 1.2667, followed by the round-level resistance at 1.2700.
GBP/USD hourly chart
-637897473642845257.png)
NZD/USD could accelerate the decline if 0.6440 is cleared in the next weeks, commented FX Strategists at UOB Group Lee Sue Ann and Quek Ser Leang.
Key Quotes
24-hour view: “We expected NZD to ‘trade sideways between 0.6490 and 0.6550’ yesterday. NZD subsequently rose to 0.6540 before staging a surprisingly sharp drop to 0.6465. The rapid decline appears to running ahead of itself and NZD is unlikely to weaken much further. For today, NZD is more likely to trade between 0.6460 and 0.6515.”
Next 1-3 weeks: “Yesterday (01 Jun, spot at 0.6530), we highlighted that the recent NZD strength has run its course and we held the view that NZD is likely to consolidate and trade within a range of 0.6440/0.6570. NZD subsequently dropped to a low of 0.6465 before closing on a soft note at 0.6485 (-0.47%). Downward momentum is beginning to build but NZD has to break below 0.6440 before a sustained decline is likely.”
CME Group’s flash data for crude oil futures markets noted traders increased their open interest positions for the fifth session in a row on Wednesday, this time by around 14.8K contracts. Volume, instead, remained choppy and shrank by around 247.5K contracts.
WTI: Initial support comes at the 55-day SMA
Prices of the barrel of WTI added to the weekly correction on Wednesday amidst rising open interest. That said, further retracements remain on the cards in the very near term with the immediate target at the 55-day SMA around $106.50,
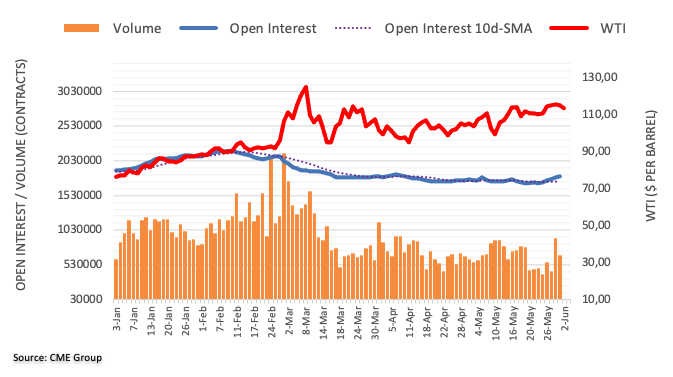
In the opinion of FX Strategists at UOB Group Lee Sue Ann and Quek Ser Leang, further downside in cable could revisit the 1.2400 region in the next weeks.
Key Quotes
24-hour view: “The sharp drop in GBP to a low of 1.2459 came as a surprise (we were expecting GBP to consolidate). While the rapid decline is deeply oversold, the weakness in GBP could extend below 1.2450 before stabilization is likely. The major support at 1.2405 is unlikely to come into the picture. Resistance is at 1.2510 followed by 1.2540.”
Next 1-3 weeks: “We highlighted yesterday (01 Jun, spot at 1.2610) that upward momentum has more or less dissipated and we expected GBP to consolidate and trade between 1.2530 and 1.2670. We did not expect the sharp sell-off that sent GBP to a low of 1.2459. The rapid improvement in downward momentum suggests GBP is likely to weaken towards 1.2405. At this stage, the chance for a sustained decline below this level is not high. On the upside, a breach of the ‘strong resistance’ level, currently at 1.2570, would indicate that GBP is not ready to head lower.”
Fitch affirms China ratings at 'A+' with Stable outlook
more to come ...
Open interest in gold futures markets extended the downtrend in place since May 12, this time by around 7.2K contracts according to preliminary readings from CME Group. In the same line, volume reversed the previous build and dropped by around 50.8K contracts.
Gold remains side-lined around $1,850
Gold prices charted decent gains near $1,850 per ounce troy on Wednesday. The daily advance, however, was on the back of shrinking open interest and volume, removing strength from prospects for further upside in the very near term and thus leaving the precious metal largely side-lined.
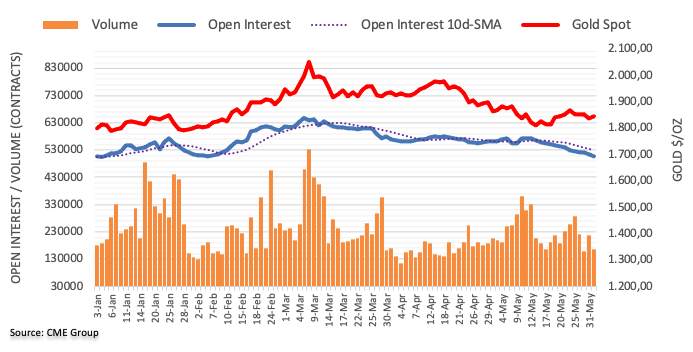
Bank of Japan (BOJ) board member Seiji Adachi is back on the wires now, via Reuters, speaking on the negative effect of the monetary policy tightening to curb the yen's downfall.
Key quotes
Trying to stem weak yen by tightening monetary policy would squeeze corporate funding.
Downside risks to Japan’s output appear to be heightening but that is offset by improvement in household sentiment.
Degree of next fiscal year's wage hike will be key to whether Japan can pull out of deflation.
If Fed rate hike cools the US economy, there is a risk that could reverse current weak-yen trend.
Market reaction
USD/JPY is off the highs, back to test 130.00 on the above comments. The pair is currently trading at 130.02, down 0.07% on the day. Falling yields are also adding to the weight on the major.
- USD/JPY is balanced above 130.00 ahead of the job additions numbers by the US ADP.
- The US employment numbers are likely to slip as the employment curve has reached its peak.
- The BOJ is inclined to elevate its inflation rate and its maintenance at desired levels.
The USD/JPY is oscillating in a narrow range of 129.90-130.15 in the early European session as investors are awaiting the disclosure of the US Automatic Data Processing (ADP) Employment Change in May. As per the market consensus, the ADP Employment Change is seen at 300k vs. the figure of 247k recorded in April.
No doubt the extent of additions of employment in the US labor force (except farming personnel) is likely to slip this month. The US ADP may disclose a figure of 300k while the consensus for the US Nonfarm Payrolls is 325k. It looks like the upward sloping employment curve will increase at a diminishing rate from now. The US labor market is extremely tight and has reached near its full capacity, which signals less room for more job additions in the workforce.
Also, the employment figures carry more importance this time as they will have a significant impact on the interest rate decision and guidance by the Federal Reserve (Fed). The Fed will dictate its June monetary policy in the third week and an extreme hawkish commentary is expected from Fed chair Jerome Powell.
On the Tokyo front, the Japanese yen is underperforming despite the upbeat employment numbers released this week. The Jobs/Applicants ratio improves to 1.23 while the Unemployment Rate slipped to 2.5%. The Bank of Japan (BOJ) is more focused on accelerating the inflation rate and maintaining the same at elevated levels.
FX Strategists at UOB Group Lee Sue Ann and Quek Ser Leang suggested further downside in EUR/USD is expected to meet tough contention around 1.0580 in the near term.
Key Quotes
24-hour view: “We expected EUR to ‘consolidate and trade between 1.0685 and 1.0765’ yesterday. We did not expect the sharp drop to a low of 1.0625 during NY session. While the rapid decline appears to be running ahead of itself, there is scope for EUR to dip below 1.0625. The next major support at 1.0570 is not expected to come under threat (there is another support at 1.0600). On the upside, a breach of 1.0700 (minor resistance is at 1.0680) would indicate that the current weakness has stabilized.”
Next 1-3 weeks: “We highlighted yesterday (01 Jun, spot at 1.0735) that the recent strong phase in EUR has run its course and we expected EUR to consolidate and trade within a range of 1.0625/1.0790. We did not expect the rapid manner by which EUR approaches the bottom of the expected range at 1.0625 (low of 1.0625 in NY). The rapid build-up in downward momentum has shifted the risk in EUR to the downside. However, any weakness is expected to encounter solid support at 1.0580. The downside risk is intact as long as EUR does not move above 1.0730 (‘strong resistance’ level).”
- EUR/JPY struggles to extend five-day uptrend as bulls flirt with lat April tops.
- Bullish MACD, firmer RSI portray upside momentum towards the yearly high.
- Three-month-long support line appears the key for bears, 61.8% FE lures buyers.
EUR/JPY pares intraday gains around multi-day high, easing to 138.50 of late, as bulls take a breather during early Thursday morning in Europe.
Despite the cross-currency pair’s failure to extend the four-day uptrend, the quote’s trading beyond the 136.30 support confluence, including the 50-DMA and 23.6% Fibonacci retracement (Fibo.) of March-April upside favor bulls.
Also keeping EUR/JPY buyers are the bullish MACD signals and firmer RSI (14), not overbought.
That said, the yearly high marked in April, around 140.00, appears immediate target for the pair buyers.
However, the RSI conditions may turn overbought around the stated psychological magnet and could trigger a consolidation, failing to do so may propel the EUR/JPY prices towards 61.8% Fibonacci Expansion (FE) of March-May moves, near 142.40.
Alternatively, the pair’s weakness past 136.30 support confluence isn’t an open invitation to the bears as an upward sloping trend line from early March, near 135.80, could also challenge the EUR/JPY downside.
In a case where the pair decline below 135.80, the odds favoring its slump to May’s low near 132.65 can’t be ruled out.
EUR/JPY: Daily chart
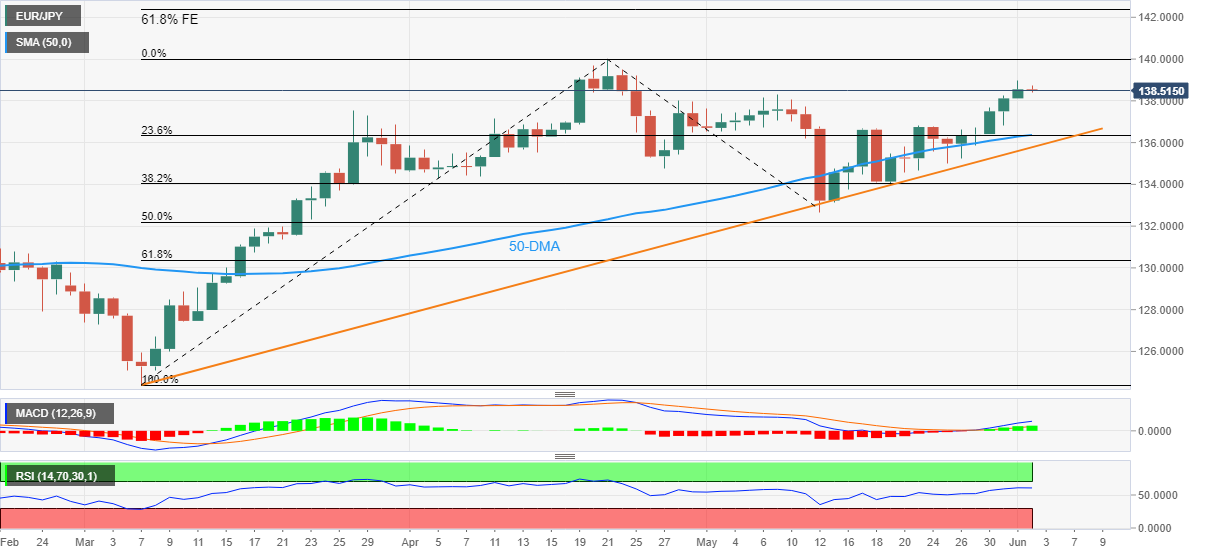
Trend: Further upside expected
- A bearish Megaphone formation advocates a bearish reversal.
- A bear cross, represented by the 20- and 50-EMAs adds to the downside filters.
- The RSI (14) needs to violate the 40.00-60.00 range of volatility expansion.
The AUD/USD pair is witnessing a modest downside move after failing to sustain above the critical resistance of 0.7200. The asset has displayed a lackluster performance in the Asian session considering its narrow range auction.
On an hourly scale, the major has formed a Bearish Megaphone that indicates a bearish reversal after the inventory distribution process in which inventory shifts to retail participants from the institutional investors. The upward sloping trendline placed from 0.6872 adjoining May 25 low at 0.7034 will act as a major cushion for the counter.
The 20- and 50-period Exponential Moving Averages (EMAs) have given a bearish crossover at 0.7175, which adds to the downside filters.
Meanwhile, the Relative Strength Index (RSI) (14) is oscillating in the 40.00-60.00 range, which signals a volatility contraction.
A decisive drop below May 31 low at 0.7150 will drag the aussie bulls towards May 24 high at 0.7120, followed by May 25 low at 0.7035.
Alternatively, the greenback bulls could lose their grip if the asset oversteps Monday’s high at 0.7230. The occurrence of the same will drive the asset towards May’s high at 0.7267. A violation of May’s high will unleash the aussie bulls for further upside to April 18 low at 0.7342.
AUD/USD hourly chart
-637897431360072228.png)
- Asian equities remain depressed as price pressure, recession woes dominate.
- Pullback of Treasury yields allowed bears to take a breather but bulls remain away from table.
- Hawkish Fed, US data weigh on risk appetite, China-linked fears add to the pessimism.
Growing fears of global recession joined the hawkish central bank chatters to weigh on Asian markets during early Thursday. Adding to the market’s pessimism is the trade-negative news from China. However, a pullback in Treasury yields and oil prices seems to chain the bears during the lackluster session.
While portraying the mood, the MSCI’s index of Asia-Pacific shares outside Japan drops 1.1% whereas Japan’s Nikkei 225 prints a 0.11% daily loss by the press time.
It’s worth noting that the comments from Bank of Japan (BOJ) board member Seiji Adachi, supporting the BOJ’s easy money policies, seemed to have trimmed losses of the Nikkei 225 of late.
Elsewhere, China’s blue-chip index drops near 0.50% while Hong Kong’s Hang Seng loses more than 1.5% at the latest.
Further, Australia’s ASX 200 lost around 1.0% even as Australia’s trade numbers came in positive for April. On the same line was New Zealand’s NZX 50 which failed to cheer upbeat prints of the Q1 Terms of Trade Index, down 0.75% intraday at the latest.
In addition to the broad fears, Reuters’ news suggesting the US readiness to implement a ban on Xinjiang goods also roil the mood in major markets. Further, comments from China's Ambassador to Australia, Xiao Qian, hint at no relief to Aussie business houses from Beijing’s ban despite the change in government exerting additional downside pressure on Aussie shares.
It should be observed that mixed prints of Indonesia’s Inflation data for May could provide proper directions to IDX Composite, losing 0.10% to 7,141 by the press time, whereas South Korea’s KOSPI loses over 1.0% while tracking the across the board dullness.
On a broader front, S&P 500 Futures struggle to defend the 4,100 level whereas the US 10-year Treasury yields retreat from a two-week high, down 1.8 basis points (bps) to 2.91% of late.
Looking forward, the OPEC meeting and the US ADP Employment Change for May, expected at 300K versus 247K prior will be important for Asian markets ahead of Friday’s US Nonfarm Payrolls.
- USD/IDR takes offers to snap three-day uptrend, drops to the multi-day low.
- Indonesia Inflation eased in May, Core Inflation also dropped below forecasts.
- US dollar retreat, mixed sentiment enable sellers to retake controls.
USD/IDR stands on slippery ground near a three-week low even as Indonesia's inflation softened in May. In doing so, the Indonesia rupiah (IDR) pair drops to $14,495, the lowest level since May 11, while posting the first daily negative in four days ahead of Thursday’s European session.
Indonesia Inflation eased to 0.4% MoM in May, from 0.41% forecast and 0.95% prior. The YoY figures also softened to 2.58% from 2.7% expected and 2.6% prior. It’s worth noting that the Core Inflation rose beyond 3.47% in previous readings but stayed below the market consensus of 3.6% while posting 3.55% figures for the stated month.
“Indonesia's inflation rate accelerated slightly in May to 3.55% due to rising food prices and airfares, official data showed on Thursday, roughly in line with market expectations and within the central bank's target range,” said Reuters following the data release.
The pair’s latest weakness could be linked to the US dollar’s pullback from a one-week high. That said, the US Dollar Index (DXY) retreats from a seven-day top to 102.53 at the latest while consolidating the biggest daily gains since early May.
The greenback’s consolidation portrays the market’s anxiety ahead of the US ADP Employment Change for May, expected at 300K versus 247K prior. Also likely to have challenged the USD/IDR prices could be the downbeat performance of Asian markets, with Indonesia’s benchmark IDX Composite falling 0.20% intraday by the press time.
Technical analysis
A two-week-old descending trend line around $14.570 by the press time, directs USD/IDR prices towards the 50-DMA support of $14.475.
- USD/CNH is struggling at around 6.7100 on mounting trade tensions between the nations.
- The US is prohibiting imports from China’s Xinjiang region amid allegations of forced labor manufacturing.
- The DXY is consolidating as investors await the US NFP.
The USD/CNH pair has witnessed a mild correction after failing to sustain above Wednesday’s high at 6.7139. A corrective move is filled with small-bodied candlesticks, which indicates that the upside is still intact.
Mounting tensions between China and the US have put the asset on the tenterhooks. The news from Reuters, that the US authorities are ready to implement a ban on imports from China's Xinjiang region has sidelined the market participants. The US administration has considered the option of banning imports from China after the discovery of the fact that all goods from Xinjiang are manufactured where Chinese authorities have established the detention camps for Uyghurs and other Muslim groups.
The goods are made with forced labor and the US economy denies receiving of goods manufactured with the same. Therefore, banning Chinese exports to the US looks likely till it is proven innocent.
Apart from that, the US dollar index (DXY) is oscillating in a narrow range of 102.49-102.60 in the late Tokyo session. A rebound in the risk-off impulse has improved the safe-haven’s appeal. Going forward, investors will keep an eye on the release of the US Nonfarm Payrolls (NFP). As per the market consensus, job additions in the US labor force are seen at 325k for May, significantly lower than the additions recorded in 428k.
- USD/CAD grinds higher after bouncing off six-week low, battles key horizontal hurdle.
- RSI, MACD signal further upside but short-term resistance line, 200-SMA will test bulls.
- Two-month-old ascending support line holds the gate for the bear’s entry.
USD/CAD prints mild gains around 1.2670 as bulls battle with nearly two-month-old horizontal resistance during Thursday’s late Asian session.
In doing so, the Loonie pair extends the previous day’s rebound from an upward sloping trend line from early April, which in turn triggered the quote’s bounce off a six-week low.
Given the pair’s sustained bounce off the short-term key support line, as well as bullish MACD signals and firmer RSI (14), USD/CAD prices are likely to keep the latest recovery moves.
However, the quote needs a clear break of 1.2670-85 region, comprising the aforementioned horizontal resistance, to rise further.
Following that, a downward sloping trend line from May 12 and the 200-SMA level, respectively near 1.2770 and 1.2800, will challenge the USD/CAD bulls.
On the contrary, the previously stated support line, near 1.2600 by the press time, limits the pair’s immediate downside.
Should the USD/CAD prices drop below 1.2600, a slump towards the late April swing low near 1.2460 can’t be ruled out.
USD/CAD: Four-hour chart
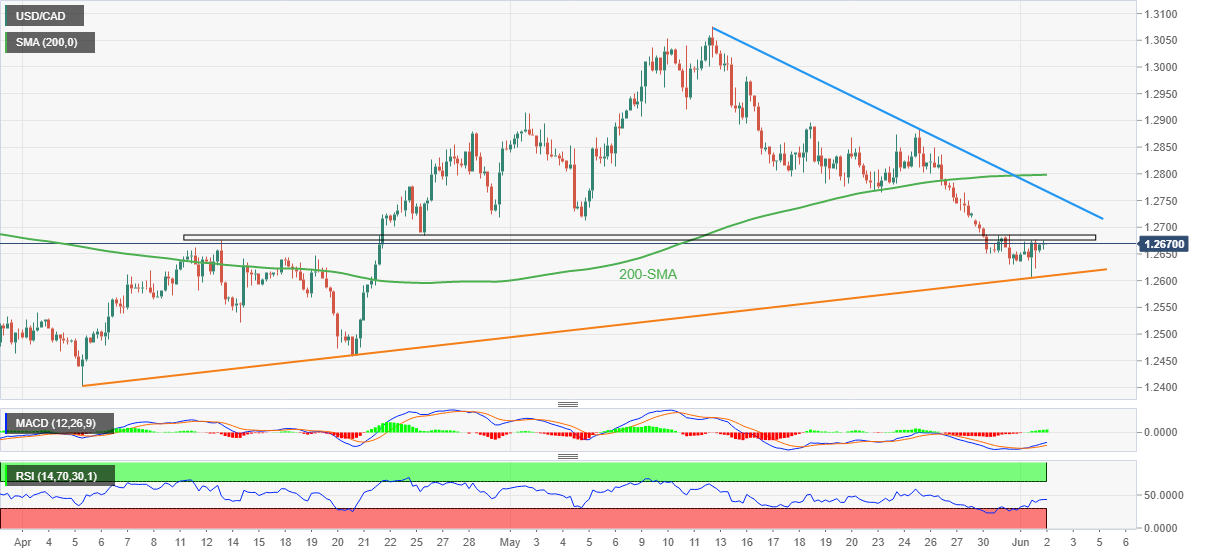
Trend: Further recovery expected
- Gold Price range play intact at around $1,850 amid a cautious mood.
- The US dollar clings to gains, as inflation and Fed worries play out.
- XAU bulls could try their luck once again ahead of critical US data.
Gold Price is treading water while keeping its range around $1,850, having hit ten-day lows at $1,829 a day before. The US dollar holds onto its recent advance amid a cautious market mood, making it difficult for XAU bulls to flex their muscles. Meanwhile, the downside in the bright metal finds support from a minor pullback in the Treasury yields. However, it remains to be seen if gold price can breakout from the ongoing range trade, as inflation, geopolitics, the Fed sentiment and critical US economic data remain in play.
Also read: Where gold’s downtrend is heading
Gold Price: Key levels to watch
The Technical Confluence Detector shows that the Gold Price is challenging fierce resistance at $1,846, which is the convergence of the Fibonacci 23.6% one-day, the previous low four-hour and the Bollinger Band one-day Middle.
If bulls reclaim the abovementioned barrier, then they could march towards a dense cluster of healthy resistance levels stacked up around $1,851. That area is the meeting point of the Fibonacci 61.8% one-week, SMA50 four-hour, SMA10 one-day and the previous day’s high.
The pivot point one-day R1 at $1,855 could then test the bearish commitments on the road to recovery, above which the doors will open up for the Fibonacci 38.2% one-week.
The last line of defense for gold sellers aligns at $1,863, where the Fibonacci 61.8% one-month and the Fibonacci 23.6% one-week merge.
On the downside, the immediate cap appears at $1,840, which comprises the SMA100 four-hour, SMA200 one-day and the Fibonacci 38.2% one-day.
The next bearish target is seen at the Fibonacci 61.8% one-day at $1,837, below which the strong support around $1,834 will get tested.
At that level, the Fibonacci 38.2% one-month coincides with the pivot point one-day S1. The previous day’s low of $1,829 will be next on the sellers’ radars.
The next bullish target is aligned at $1,859, the Fibonacci 38.2% one-day and one-week.
The Fibonacci 23.6% one-week at $1,863 will guard the additional upside, opening doors for a test of the previous week’s high of $1,870.
Here is how it looks on the tool
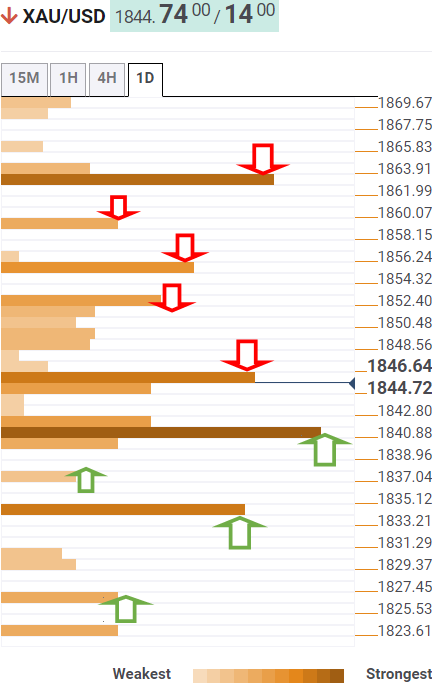
About Technical Confluences Detector
The TCD (Technical Confluences Detector) is a tool to locate and point out those price levels where there is a congestion of indicators, moving averages, Fibonacci levels, Pivot Points, etc. If you are a short-term trader, you will find entry points for counter-trend strategies and hunt a few points at a time. If you are a medium-to-long-term trader, this tool will allow you to know in advance the price levels where a medium-to-long-term trend may stop and rest, where to unwind positions, or where to increase your position size.
- EUR/USD pares the biggest daily loss in three weeks inside a 15-pip range.
- Market sentiment remains sour but a pause in bond selling seems to test bears.
- ECB’s Holzmann backs 50 bps rate hike, Fedspeak portrays hawkish concerns.
- US ADP Employment Change can renew DXY run-up if matches recently positive US data.
EUR/USD skates on thin ice as traders await early signals of Friday’s US NFP, namely the ADP Employment Change, amid sluggish markets. That said, the quote remains sidelined between 1.0645 and 1.0660, recently picking up bids from the bottom, during early Thursday morning in Europe.
Global markets remain dicey on Thursday even as growth fears join China-linked headlines. The reason could be linked to the cautious sentiment ahead of this week’s key data, as well as the US Treasury yields’ struggle to refresh its two-week high, down 1.2 basis points (bps) to 2.91% by the press time.
That said, the benchmark US 10-year Treasury yields jumped to the highest levels in a fortnight the previous day after strong US data joined comments from the Fed policymakers that portrayed the US central bankers’ likely aggression in lifting rates. It’s worth noting that fears of global growth and China-linked headlines are extra positive for the US dollar, due to its safe-haven appeal.
Fed’s monthly Beige Book and statements from St. Louis Federal Reserve Bank President James Bullard renewed recession fears the previous day. Also challenging the growth concerns were fresh headlines suggesting trade/political tensions between the US and China, as well as between China and Australia, not to forget fears emanating from the Russia-Ukraine crisis.
On the other hand, firmer US data also allowed Federal Reserve Bank of Richmond President Thomas Barkin to stay positive about the future rate hikes. The US ISM Manufacturing PMI for April rose to 56.1 versus the 54.5 expected and the 55.4 prior. Further, the US JOLTs Job Openings eased below 11.8 prior readings but matched 11.4 market forecasts.
Alternatively, no change in the Eurozone Unemployment Rate also exerted downside pressure on the EUR/USD prices even as comments from European Central Bank (ECB) Governing Council member Robert Holzmann defended bulls. The policymaker said that the record-high inflation print for the euro area supports the view that a 50 basis points rate hike will be needed.
Considering the sour sentiment and increasing odds of the Fed’s aggression in rate hikes, not to forget recently firmer US data, EUR/USD prices are likely to remain pressured. However, today’s US ADP Employment Change for May, expected at 300K versus 247K prior, will be eyed closely due to being the early signal for Friday’s US Nonfarm Payrolls (NFP). Additionally, the US Factory Orders for May, bearing forecasts of a 0.7% increase compared to 2.2% in previous readouts, could also entertain the pair traders.
Also read: US ADP Employment Change May Preview: The labor market recedes from center stage
Technical analysis
A clear downside break of a three-week-old support line, now resistance around 1.0750, directs EUR/USD towards the 21-DMA level surrounding 1.0600.
- WTI remains on the back foot around one-week low, prints three-day downtrend.
- Chatters surrounding Russia leaving OPEC+, Saudi output increase favor bears.
- Clear downside break of monthly support and sustained trading below 50-SMA also keep sellers hopeful.
WTI bears keep reins around the weekly low during the third consecutive negative day, down 1.45% to $111.90 during Thursday’s Asian session.
The black gold’s latest weakness could be linked to speculations that Russia may leave the OPEC+ group, as well as talks of Saudi Arabia’s likely increase of oil output.
Read: Saudi Arabia ready to pump more oil if Russian output sinks under ban – FT
Also keeping sellers hopeful is the previous day’s downside break of an ascending support line from early May, now resistance surrounding $114.10.
Additionally, the quote’s sustained trading below 50-SMA, at $112.35 by the press time, also hints at the further downside.
That said, a horizontal area comprising multiple levels marked since May 19, near $108.00, gains the WTI bear’s attention.
However, a clear break of the 38.2% Fibonacci retracement of the May 10-31 upside, at $110.40, becomes necessary for the bears.
During the quote’s weakness past $108.00, the 200-SMA level of $106.60 will gain the market’s attention.
Meanwhile, the 50-SMA and previous support line, respectively around $112.35 and $114.10, can restrict the quote’s corrective pullback.
In a case where WTI remains firmer past $114.10, an upward trajectory towards $116.50 and the last monthly peak near $118.70 can’t be ruled out.
WTI: Four-hour chart
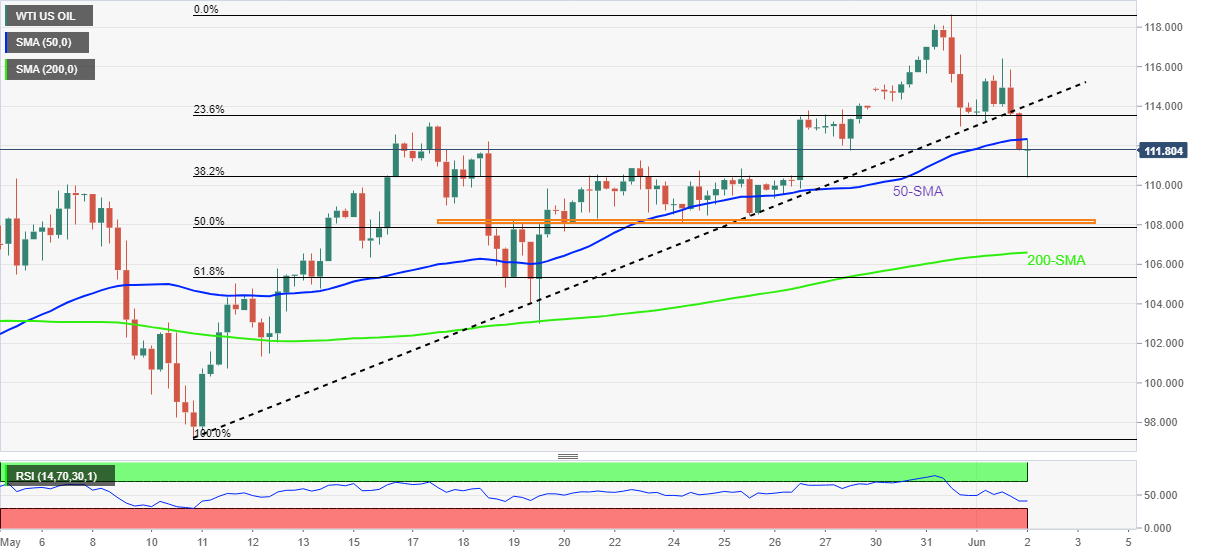
Trend: Further weakness expected
- A Darvas Box formation dictates a slippage in the standard deviation.
- The narrow gap between the 20- and 50- period EMAs favors the continuation of a consolidation phase.
- A power-pack action will be recorded if the RSI (14) violates the current oscillating range of 40.00-60.00.
A responsive buying action in the USD/INR pair after hitting a low of 77.42 has strengthened the greenback bulls for a while. The asset has displayed a lackluster performance from the last week after failing to overstep monthly highs at 78.12.
The formation of a Darvas Box on a four-hour scale is indicating an extreme squeeze in the volatility and a balanced auction profile. The asset is trading back and forth in a range of 77.33-78.12 for the past two weeks. Usually, a Darvas box formation after a vertical upside move dictates the presence of initiative buyers, which holds the potential of driving the asset higher.
An acute narrow gap between the 20- and 50-period Exponential Moving Averages (EMAs) is indicating the continuation of a balanced market profile.
The Relative Strength Index (RSI) (14) is oscillating in a 40.00-60.00 range, which signals the unavailability of any potential trigger to active power-pack action in the asset.
An upside break of the Darvas Box above monthly highs at 78.12 will send the asset into uncharted territory. The asset may find hurdles near the round-level resistance at 78.50 and psychological barricade at 79.00.
On the flip side, the Indian rupee bulls could gain control if the asset tumbles below May 17 low at 77.34. This will open doors for more downside move towards April 27 high at 77.07, followed by May 3 high at 76.82.
USD/INR four-hour chart
-637897376025809350.png)
- GBP/USD is oscillating in an 18-pips range and a downside break looks likely on risk-off impulse.
- The DXY has been strengthened on the upbeat US ISM Manufacturing data.
- This week the release of the US NFP holds significant importance.
The GBP/USD pair is displaying a topsy-turvy move in a narrow range of 1.2474-1.2492 in the Asian session. A lackluster performance in the cable is followed by a vertical downside move as an improved appeal for safe-haven assets resulted in a sell-off in the risk-perceived assets. The asset witnessed a steep fall after slipping below the crucial support of 1.2560 on Wednesday.
The US dollar index (DXY) has turned into a consolidation phase after witnessing a significant buying interest from the market participants. Stronger than expected US ISM Manufacturing PMI, released on Wednesday, strengthened the greenback against pound. The ISM Manufacturing PMI landed at 56.1, higher than the forecasts of 54.5 and the prior print of 55.4. An outperformance from the US economy on Manufacturing PMI despite rising inflationary pressures spurted a rally in the DXY.
Going forward, investors’ focus will remain on the release of the US Nonfarm Payrolls (NFP). This time, the NFP holds more importance as it will be the last employment data before the announcement of the June monetary policy by the Federal Reserve (Fed). The US economy may have added 325k jobs in May much lower than the 425k job additions recorded in April.
On the pound front, a light calendar week will assign more focus to the DXY. However, the discussions over the monetary policy announcement by the Bank of England (BOE) will keep the pound bulls active. As per the market consensus, the BOE will announce an interest rate hike by 50 basis points (bps).
Japan’s Chief Cabinet Secretary Hirokazu Matsuno said on Thursday that the government wants the average minimum wage hiked to 1000 yen from the current hourly average minimum wage which is just over JPY900.
There is nothing further reported on the same.
USD/JPY was last seen trading at 130.11, almost unchanged on the day. The pair’s upsurge came on the back of a renewed upside in the US dollar alongside the Treasury yields.
Saudi Arabia has indicated to western allies that it is prepared to raise oil production should Russia’s output fall substantially due to the energy sanctions against Moscow, the Financial Times (FT) reports, citing five people familiar with the discussions.
Key takeaways
“Saudi Arabia is aware of the risks and that it is not in their interests to lose control of oil prices.”
“Saudi Arabia’s view is that while the oil market is undoubtedly tight, which has buoyed the rise in prices, there are not yet genuine shortages.”
“There had been discussions about an immediate increase in production from Saudi Arabia and the United Arab Emirates, which could be announced at Thursday’s OPEC+ meeting.”
“But nothing has yet been finalised, and OPEC+ could still stick with its production plan that has been in place since the beginning of the COVID-19 crisis.”
Market reaction
WTI is consolidating the overnight losses around $111.00, as of writing, licking its wound after tumbling from near the $116.00 region on the above report.
- AUD/JPY takes offers to renew intraday low despite upbeat Australia trade numbers.
- Aussie trade surplus widened whereas Exports, Imports improved in April.
- BOJ’s Adachi hints at more days for easy money policy as inflation target remains unachieved.
- Markets sentiment worsens as growth fears join hawkish Fedspeak and Chinal-linked jitters.
AUD/JPY renews intraday low to 93.03 as it snaps a four-day uptrend during Thursday’s Asian session. In doing so, the cross-currency pair reverses from a one-month high despite upbeat trade data from Australia and comments favoring JPY weakness from a Bank of Japan (BOJ) official. The reason could be linked to the risk-aversion wave in the markets of late.
Australia’s Trade Balance rose to 10,495M versus 9,300M market forecasts and 9,314M prior. Further details suggest that the Exports grew to 1% versus 0% previous readings while the Imports eased contraction from -5.0% to -1.0%.
On the other hand, Bank of Japan (BOJ) board member Seiji Adachi said in a statement on Thursday, “Japan is still halfway to achieving BOJ's price target.” The same suggests a long way before the Japanese central bank hints at monetary policy tightening.
Talking about the risk appetite, fears of growth and faster Fed rate hikes, especially after the recent strong US data and hawkish Fedspeak. Also weighing on the sentiment could be headlines from China and anxiety ahead of this week’s top-tier events, namely the US ADP Employment Change and Nonfarm Payrolls (NFP) for May.
The Fed’s monthly Beige Book joined hawkish comments from St. Louis Federal Reserve Bank President James Bullard and Richmond Fed President Thomas Barkin to resurface growth fears. Also signaling recession woes were fresh headlines suggesting trade/political tensions between the US and China, as well as between China and Australia, not to forget fears emanating from the Russia-Ukraine crisis.
That said, Reuters came out with the news suggesting the US readiness to implement a ban on Xinjiang goods whereas comments from China's Ambassador to Australia, Xiao Qian, hint at no relief to Aussie business houses from Beijing’s ban despite the change in government.
While portraying the mood, S&P 500 Futures struggle to defend the 4,100 level whereas the US 10-year Treasury yields retreat from a two-week high, down 1.4 basis points (bps) to 2.91% of late.
Moving on, AUD/JPY moves are likely to take clues from the market sentiment, which in turn signal further weakness for the pair.
Technical analysis
AUD/JPY pullback remains elusive until the quote stays beyond 61.8% Fibonacci retracement (Fibo.) of April-May downside, around 92.55.
- GBP/JPY remains pressured around daily lows after reversing from monthly high.
- RSI retreat also keep sellers hopeful but 200-SMA adds to the downside filters.
- Recovery remains elusive below 61.8% Fibonacci retracement level.
GBP/JPY extends pullback from a one-month high as traders jostle with the weekly support line during Thursday’s Asian session. That said, the quote stays depressed near 162.30 by the press time.
In doing so, the cross-currency pair traces the pullback in the RSI (14), as well as failures to cross the 61.8% Fibonacci retracement (Fibo.) of April 20 to May 12 downside, near 163.55 by the press time.
Given the pullback in RSI and failures to cross the key Fibo. level, the latest GBP/JPY weakness is likely to extend towards an upward sloping trend line from May 12, close to 159.85.
However, the one-week-old rising trend line support and the 200-SMA, respectively around 162.00 and 161.60, could challenge the pair bears.
Alternatively, recovery moves may initially aim for the 61.8% Fibonacci retracement level of 163.55 before highlighting the late April swing high near 164.30, as well as March’s high of 164.65.
In a case where GBP/JPY remains firmer past 164.65, the odds of its run-up towards the yearly peak of 168.43 can’t be ruled out.
GBP/JPY: Four-hour chart
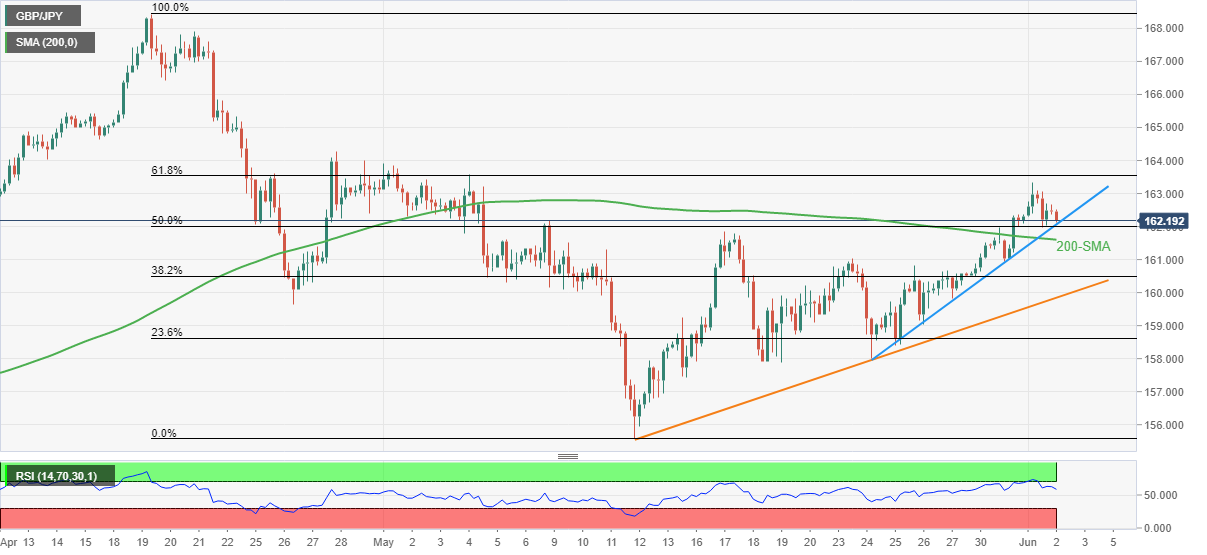
Trend: Further weakness expected
Australia's new Energy Minister Chris Bowen made some comments on the topic of domestic gas security, in the face of the Ukraine crisis-led surge in global energy prices.
Key quotes
Will take whatever action is necessary to ensure ongoing reliability and affordability for domestic energy markets.
Won't shy away from taking hard decisions.
It is not a short-term answer to trigger the domestic gas security mechanism.
Related reads
- AUD/USD fails to cheer upbeat Aussie trade data below 0.7200 ahead of US ADP Employment
- Australian Trade Balance higher than expected, A$10.495Bln vs. estimated A$9Bln, AUD/USD steady
Bank of Japan (BOJ) board member Seiji Adachi said in a statement on Thursday, “Japan is still halfway to achieving BOJ's price target.”
Additional quotes
See a bigger chance of inflationary pressures in Japan increasing.
Japan's service spending showing signs of improvement.
Japan's exports rising as a trend.
Japan's economy picking up as a trend.
There is rising risk that drop in China's output, caused in part by its zero-covid policy, may lead to serious global supply constraints.
Such risks from China may be temporary if covid infections subside, China’s output recovers.
Must be mindful of risk US Monetary tightening could lead to major slowdown in its economy, cause global asset price adjustments.
We must not forget that strong yen was among the factors that led to Japan's prolonged period of deflation and economic stagnation.
Market reaction
USD/JPY is unfazed by these above comments, currently trading at 130.03, down 0.04% on the day.
- AUD/USD remains pressured despite the firmer Aussie trade numbers.
- Australia’s trade surplus grew in April, Exports and Imports also improved.
- Risk-aversion seems to weigh on the pair amid fears of inflation, growth.
- US ADP Employment Change, Factory Orders eyed for intermediate clues ahead of Friday’s NFP.
AUD/USD stays depressed around 0.7170, fading the bounce off intraday low, even as Australia’s trade numbers for April came in firmer. The reason could be linked to the market’s sour sentiment during Thursday’s Asian session.
Australia’s Trade Balance rose to 10,495M versus 9,300M market forecasts and 9,314M prior. Further details suggest that the Exports grew to 1% versus 0% previous readings while the Imports eased contraction from -5.0% to -1.0%.
Read: Australian Trade Balance higher than expected, A$10.495Bln vs. estimated A$9Bln, AUD/USD steady
It’s worth noting that the jittery markets, as well as the consolidation of gains near a one-month high, challenge AUD/USD buyers from cheering upbeat data at home, due to the pair’s risk-barometer status.
The risk-off mood could be linked to the fears of growth and faster Fed rate hikes, especially after the recent strong US data and hawkish Fedspeak. Also weighing on the sentiment could be headlines from China and anxiety ahead of this week’s top-tier events.
That said, the Fed’s monthly Beige readings joined comments from St. Louis Federal Reserve Bank President James Bullard to renew recession fears. Also challenging the growth concerns were fresh headlines suggesting trade/political tensions between the US and China, as well as between China and Australia, not to forget fears emanating from the Russia-Ukraine crisis.
Additionally, firmer US data also allowed Federal Reserve Bank of Richmond President Thomas Barkin to stay positive about the future rate hikes. The US ISM Manufacturing PMI for April rose to 56.1 versus the 54.5 expected and the 55.4 prior. Further, the US JOLTs Job Openings eased below 11.8 prior readings but matched 11.4 market forecasts.
Amid these plays, S&P 500 Futures rise 0.20% whereas the US 10-year Treasury yields retreat from a two-week high, down 1.0 basis points (bps) to 2.91% of late.
To sum up, the AUD/USD pair’s failure to stay firmer, despite upbeat Aussie data, hints at the underlying weakness in momentum. However, sellers should wait for the US ADP Employment Change for May, expected 300K versus 247K prior, will be eyed closed due to being the early signal for Friday’s US Nonfarm Payrolls (NFP), for conviction. Also important to watch is the US Factory Orders for May bearing forecasts of a 0.7% increase compared to 2.2% in previous readouts.
Also read: US ADP Employment Change May Preview: The labor market recedes from center stage
Technical analysis
The AUD/USD pair’s latest downside justifies the previous day’s bearish candlestick, namely the “Gravestone Doji”, as well as failures to cross the 100-DMA, around 0.7230 by the press time. However, a clear break of a three-week-old support line, near 0.7170 at the latest, becomes necessary for the bears to retake control.
The Aussie Trade Balance released by the Australian Bureau of Statistics has been released as follows:
Australia Trade Balance April: 10.495Bln (estimated A$9Bln, previous A$9.314Bln).
Exports (MoM) April: 1% (estimated 1%, prev 0%).
Imports (MoM) April: -1% (estimated 1%, prev -5%).
AUD/USD update
AUD/USD is steady on the release.
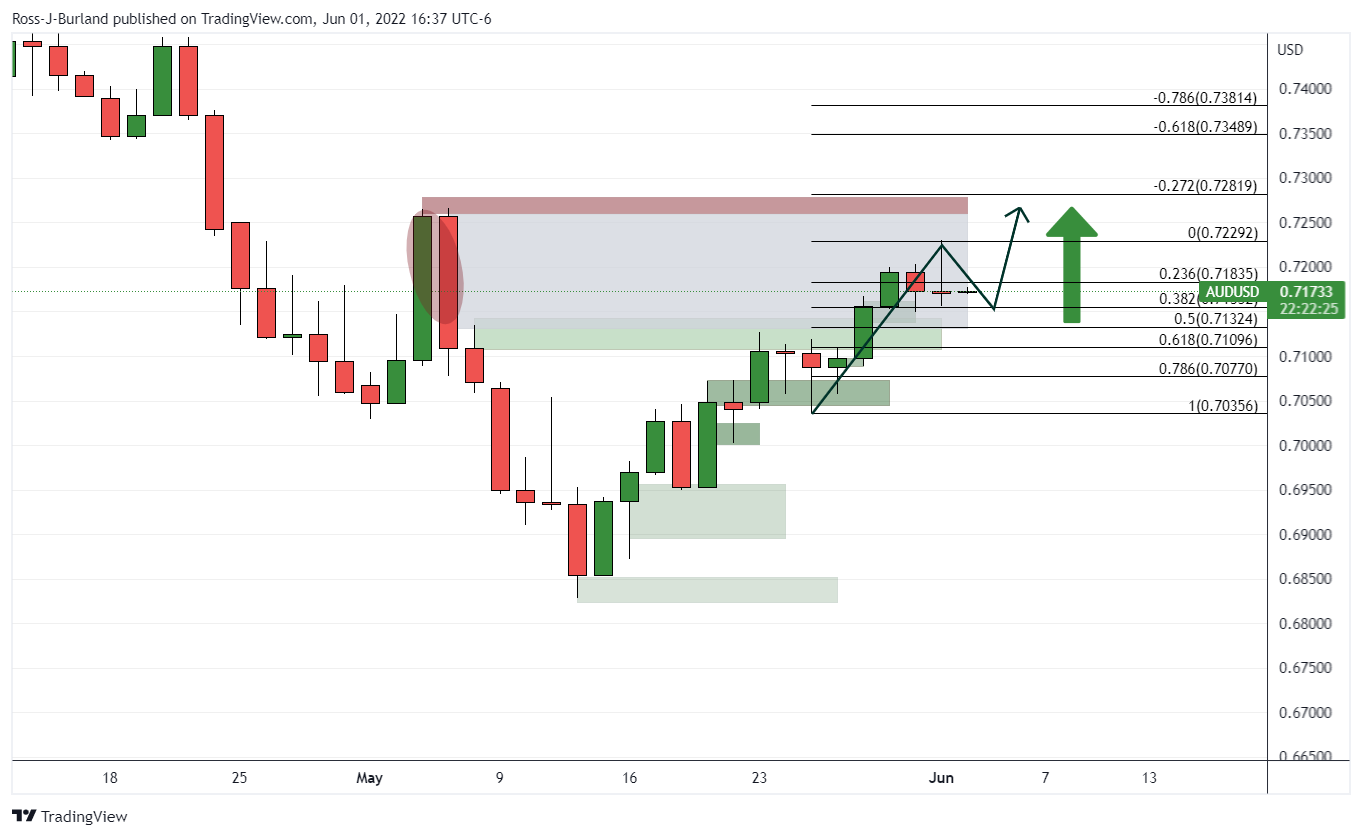
Wednesday's doji is a bearish factor but the restest of the 38.2% could encourage the bulls. If they move in at a discount and break resistance, a full-on mitigation of the price imbalance between the highs of the doji to towards the My 5 highs of 0.7266 could be on the cards.
On the flip side, if the bulls throw in the towel, a deeper correction to the support area below would be likely ahead of US Nonfarm Payrolls on Friday.
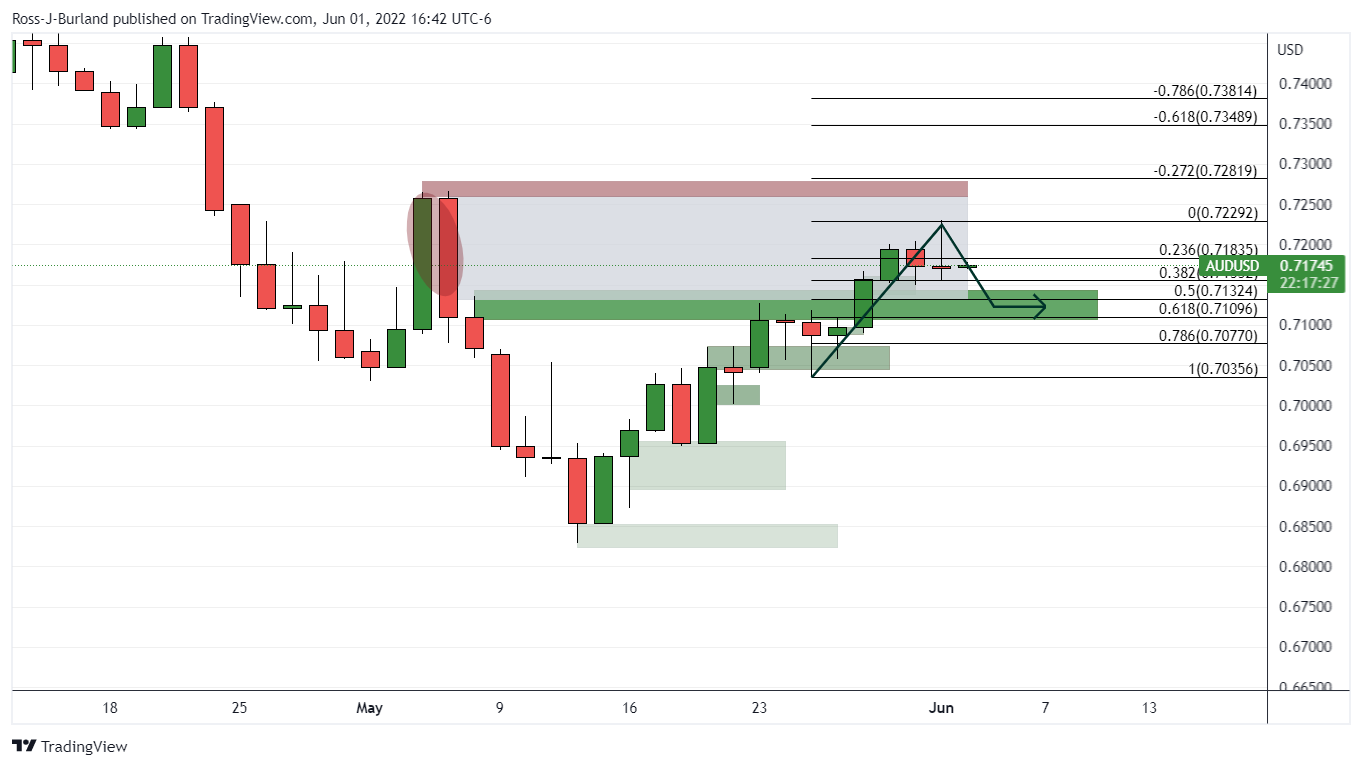
About Aussie Trade Balance
The trade balance released by the Australian Bureau of Statistics is the difference in the value of its imports and exports of Australian goods. Export data can give an important reflection of Australian growth, while imports provide an indication of domestic demand. Trade Balance gives an early indication of the net export performance. If a steady demand in exchange for Australian exports is seen, that would turn into a positive growth in the trade balance, and that should be positive for the AUD.
- USD/JPY retreats from three-week high, snaps four-day uptrend.
- Overbought RSI, a pullback from key hurdle hints at further downside towards 61.8% Fibonacci retracement level.
- Bears remain cautious unless breaking 200-SMA support, bulls need validation from the 130.50-55 area.
USD/JPY pares intraday losses around 130.10 as bulls struggle to keep reins during Thursday’s Asian session.
That said, the yen pair rose to the highest levels in three weeks the previous day before recently reversing from 130.23, close to the 78.6% Fibonacci retracement (Fibo.) of May 09-24 downside.
Given the overbought RSI (14) also supporting the quote’s pullback moves, USD/JPY prices may extend the latest weakness towards testing the 61.8% Fibo. level surrounding 129.40. However, a clear break of the 130.00 becomes necessary for their conviction.
In a case where the quote drops below 129.40, the 200-SMA and the 50% Fibonacci retracement level could challenge the bears around 128.80.
Meanwhile, recovery moves need to cross the immediate Fibonacci retracement level near 130.30 to recall the USD/JPY buyers.
Even so, 130.50 and the double tops marked near 131.25-30 appear tough nut to crack for the bulls.
USD/JPY: Four-hour chart
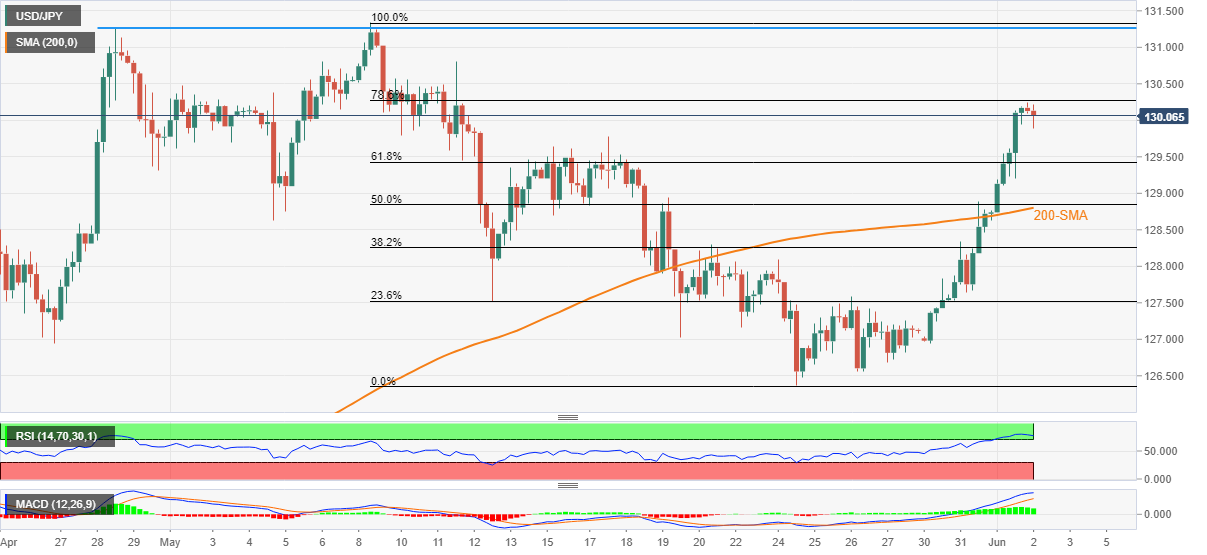
Trend: Pullback expected
In recent trade today, the People’s Bank of China (PBOC) set the yuan (CNY) at 6.7095 vs. the last close of 6.6858.
About the fix
China maintains strict control of the yuan’s rate on the mainland.
The onshore yuan (CNY) differs from the offshore one (CNH) in trading restrictions, this last one is not as tightly controlled.
Each morning, the People’s Bank of China (PBOC) sets a so-called daily midpoint fix, based on the yuan’s previous day's closing level and quotations taken from the inter-bank dealer.
- EUR/GBP is advancing to reclaim 0.8600 as the ECB may adopt a hawkish stance post the pandemic.
- An outperformance is expected from the eurozone Retail Sales data.
- Higher price pressures in the UK are depreciating the wallets of the households in the UK.
The EUR/GBP pair is auctioning around 0.8530 after giving an upside break of the consolidation formed in a range of 0.8481-0.8530. The cross is likely to perform lackluster as investors are awaiting the release of the eurozone Retail Sales, which are due on Friday.
A preliminary estimate for the annual and monthly Retail Sales is 5.4% and 0.3% respectively. The economic data is expected to display an outperformance as the prior prints were 0.8% on annual basis and -0.3% on monthly basis. And, preliminary estimates for the annual and monthly Retail Sales are 5.4% and 0.3% respectively.
Investors are expected to favor the shared currency bulls as the odds of ending the lower rates cycle by the European Central Bank (ECB) are advancing higher. ECB policymakers are advocating for a rate hike announcement to corner the soaring inflation. It is worth noting that, unlike the other giant central banks, the ECB has yet not elevated its interest rates. The majority of the central banks have come halfway to their neutral rates and the ECB is still stuck to an ultra-loose monetary policy.
On the pound front, the Bank of England (BOE) looks bound to feature a 50 basis point (bps) interest rate hike in its June monetary policy meeting. The recorded annual inflation rate in the UK is above 9%, which is sufficient to trigger recession fears and eat income of the households.
- Gold is stalling on the bid in a period of consolidation at daily resistance but the bulls are accumulating at hourly support.
- The markets will look to further UIS data seeking an insight into the rate-hiking path of the Fed.
At $1848.13, the gold price is flat in the session so far as markets consolidate the rise in the greenback that climbed higher due to a bid in US Treasury yields as global inflation worries flared anew. Gold prices also rose from a two-week low on Wednesday as investors looked toward the safe-haven metal amid worries over an increase in inflation, although a stronger dollar capped the yellow metal at daily resistance.
While bullion is considered a hedge against inflation and a safe haven during times of economic uncertainty. However, higher interest rates increase the opportunity cost of holding gold and boost the dollar. The risk sentiment has been on tenterhooks and stocks fell broadly on worries over aggressive tightening risks. Asian exchanges traded choppily overnight, while European bourses edged lower on the continent. In the US, the dollar index DXY, which measures the currency against six major peers, climbed to 102.71 and stalled near there, extending Tuesday's gains. US stocks fell as strong US manufacturing and job openings data reinforced the need for aggressive Fed funds rate hikes.
The Institute for Supply Management's manufacturing index unexpectedly rose in May, climbing to 56.1 last month from 55.4 in April. Consequently, the Dow Jones Industrial Average fell by 0.5% to 32,813.23, the S&P 500 declined by 0.8% to 4,101.23 and the Nasdaq Composite was 0.7% lower at 11,994.46 despite all of the indexes opening the session in the green. The US 10-year yield lifted 9.3bps to 2.937%. As such, the gold price picked up a safe haven bid, despite the spectre of further rate hikes.
''For the time being, gold prices have managed to sustain elevated levels with consensus positioning still heavily tilted to the long-side despite a hawkish Fed narrative,'' analysts at TD Securities noted. ''What has kept gold bugs from capitulating? We see evidence that the pandemic has reinvigorated discretionary trading in gold, leaving 'Other Reportables' to play a larger role in speculative markets.''
''This cohort has yet to capitulate, but with gold prices below their bull-market defining trendline and without conviction that the Fed could blink, these traders represent the greatest risk for a liquidation vacuum as we exit the pandemic regime. A break below $1800/oz could catalyze additional CTA liquidations which we expect will further weigh on gold,'' the analysts argued.
Meanwhile, investors are also looking ahead to US Nonfarm Payrolls and more inflation data that will help traders and investors to gauge the Fed's next move and give insight into the economic outlook.
''Employment likely continued to advance firmly in May but at a more moderate pace after consecutive job gains at +428k in March and April. Employment in the household survey likely rebounded after printing negative in April,'' the analysts at TD Securities argued.
''We expect this to lead to a drop in the Unemployment Rate to a post-COVID low of 3.5%. We also look for wage growth to remain steady at 0.3% m/m (5.2% YoY).''
Gold technical analysis
The gold price is meeting resistance n the weekly chart at a key 38.2% Fibonacci retracement level as follows:
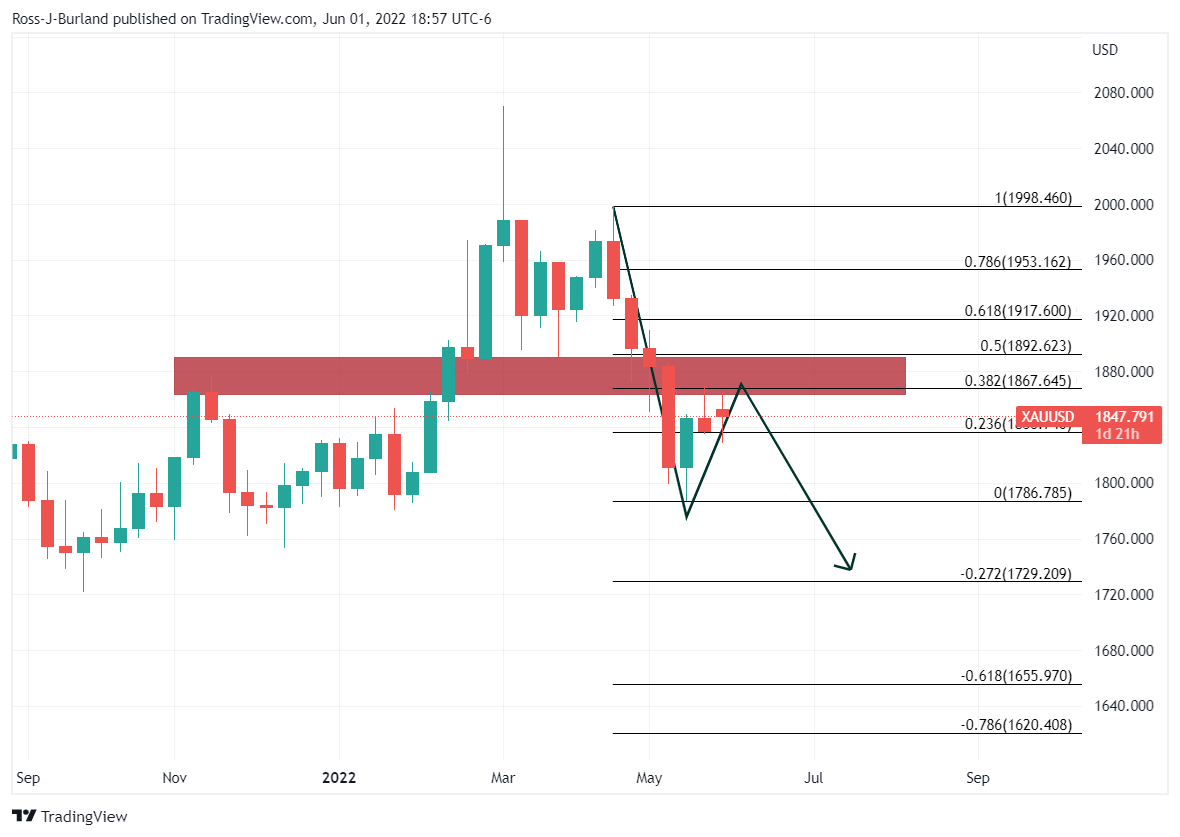
However, in the prior analysis, it was noted that there were prospects of a bullish move on the daily chart as follows:
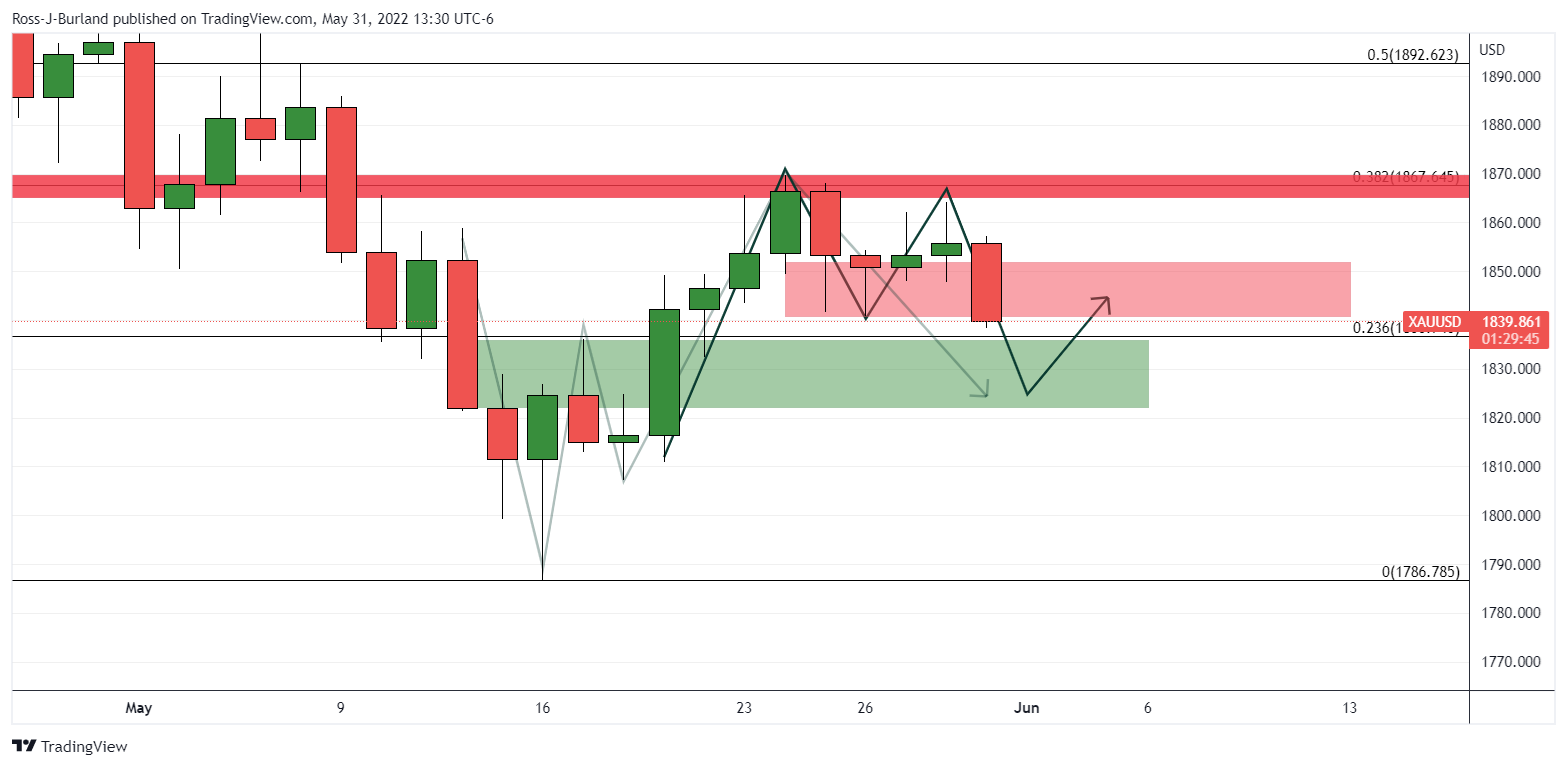
''From a daily perspective, the price is forming an M-formation while on the way to completing the test of the neckline of the prior W-formation.''
''This makes for prospects of some meanwhile consolidation in the days ahead, with the price potentially trapped between the two opposing necklines acting as support and resistance.''
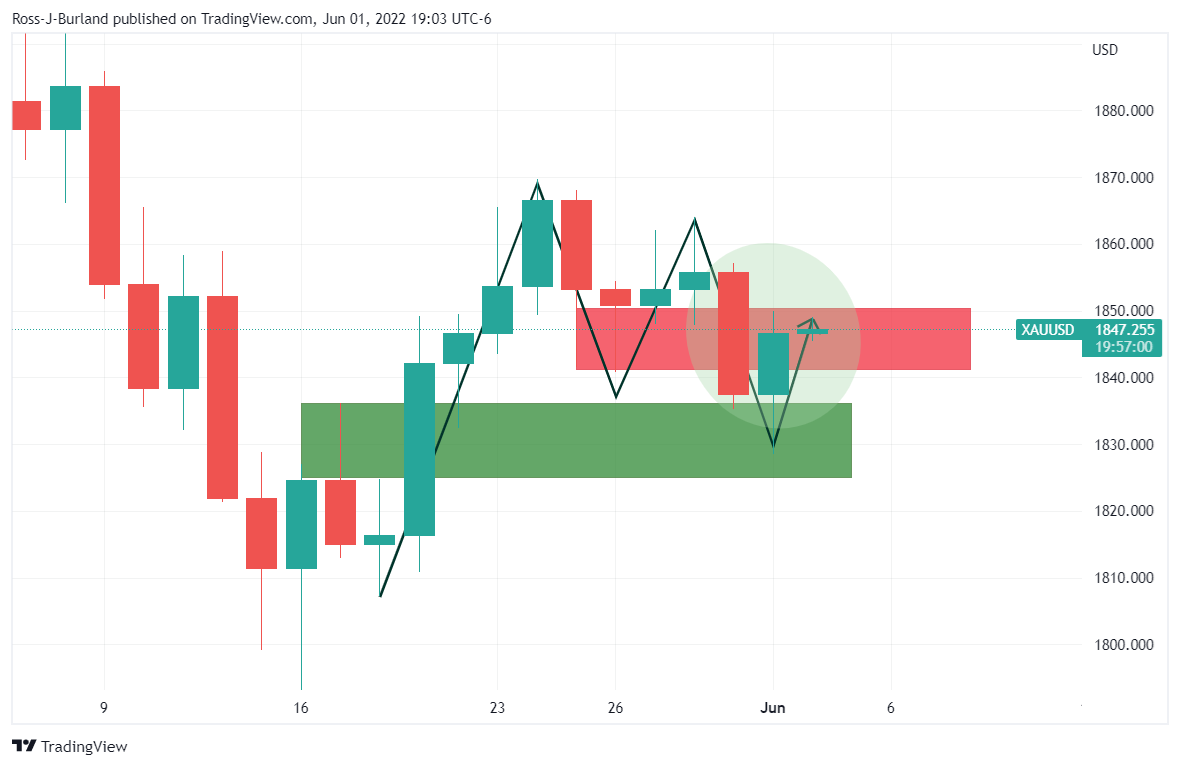
From an hourly perspective the bulls are moving in from a 38.2% % Fibonacci and eye the $1,851 prior highs:
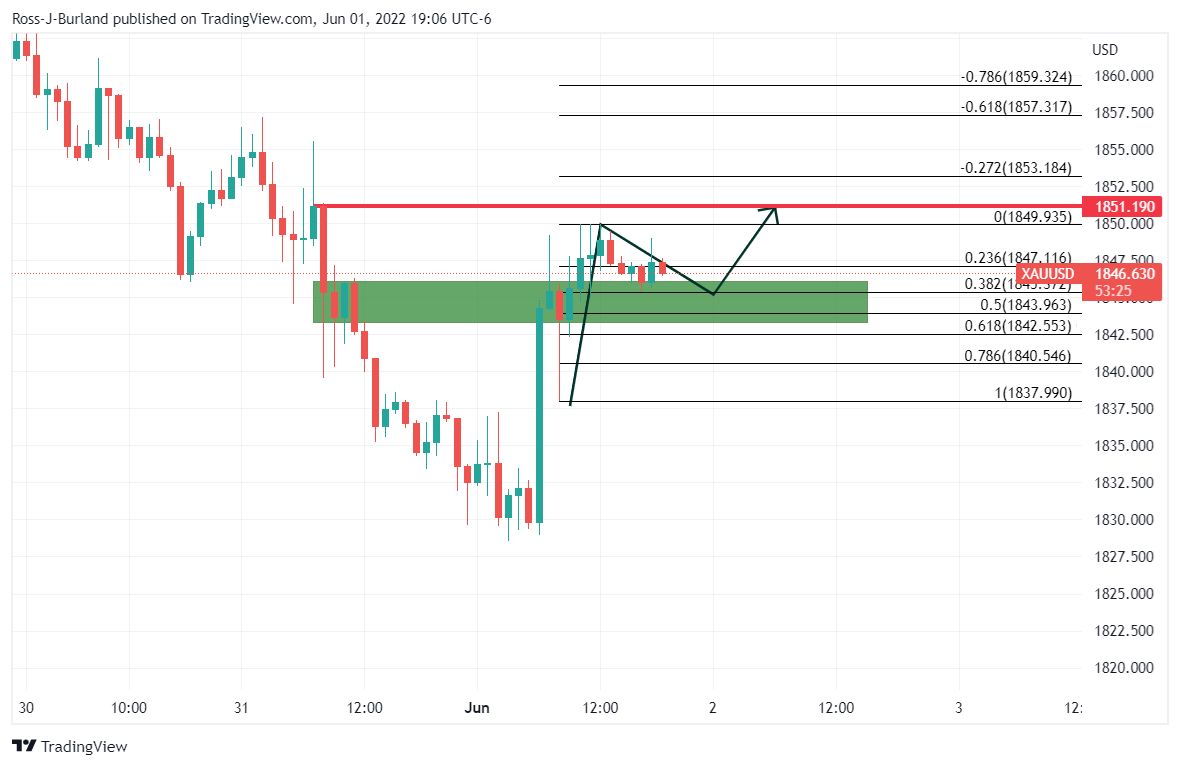
“The US dollar is set to clear its recent weak period unscathed and remain dominant because the number of reasons supporting it, including its safe-haven status, still strongly outweigh any reason to sell,” according to the latest Reuters poll.
Key findings
Risk assets, which had their worst start to the year since the COVID-19 outbreak in 2020, pushed the dollar to a nearly two-decade high last month.”
A minor rebound in stocks last week partly held the dollar back from retaking those levels and got many talking about a snap in the trend. But most say it's too soon to discuss that.
Indeed, a near two-thirds majority of strategists, 28 of 44, said the dollar's recent pullback would last less than three months.
Among those, 16 said it would die down as early as end-June. Six said three to six months, three said six to 12 months. The remaining seven chose over a year.
The latest positioning data from the Commodity Futures Trading Commission (CFTC) showed speculators were net long on the U.S. dollar. The trend that started nearly a year ago was expected to stay in place.
Nearly a two-thirds majority of analysts, 25 of 39, who answered an additional question said strategies of going long the dollar and shorting either emerging or major currencies would dominate trading over the next three months.
But the wider poll of nearly 60 currency strategists reiterated the view the dollar will weaken marginally over the 12-month horizon.
Also read: US Dollar Index (DXY) Price Analysis: Reaches a seven-day high around 102.731, on risk-aversion
- Market sentiment remains downbeat amid fears of growth, inflation joining hawkish Fedspeak.
- Headlines concerning China, Russia also weigh on the risk appetite ahead of US ADP Employment data.
- S&P 500 Futures struggles to pause two-day downtrend, US 10-year Treasury yields ease from two-week top.
Global markets remain pressured as chatters surrounding recession join the hawkish Fedspeak and trade-negative headlines from China. It should, however, be noted that cautious sentiment ahead of the key US ADP Employment Change also adds to the risk-off mood but softer yields probe equity bears of late.
That said, the S&P 500 Futures struggles to defend the 4,100 level, up 0.10% around 4,110 by the press time, whereas the 10-year Treasury yields step back from a fortnight top after rising for three consecutive days, down 2.5 basis points (bps) to 2.905% at the latest.
Fed’s Beige book raised concerns over economic growth in the US as the majority of districts indicated slight or modest growth while most informed of continued price rises. Also, three districts, out of 12, expressed concerns about a US recession.
On the same line were comments from St. Louis Federal Reserve Bank President James Bullard also raised concerns about the US recession as he repeated that a pace of 50 bps hike per meeting is a “good plan” for now. Furthermore, Federal Reserve Bank of Richmond President Thomas Barkin mentioned, “You can't find a recession in the data or actions of business execs,'' speaking on Fox Business.
It should be noted that the strong US data tried to tame the recession fears but hawkish Fed concerns challenged the market’s optimism. That said, the US ISM Manufacturing PMI for April rose to 56.1 versus the 54.5 expected and the 55.4 prior. Further, the US JOLTs Job Openings eased below 11.8 prior readings but matched 11.4 market forecasts.
Elsewhere, Reuters came out with the news suggesting the US readiness to implement a ban on Xinjiang goods whereas comments from China's Ambassador to Australia, Xiao Qian, hint at no relief to Aussie business houses from Beijing’s ban despite the change in government.
On a different page, the Wall Street Journal (WSJ) raised concerns over the easing in the US job numbers by saying, “Tightness in the labor market has started to ease with some hiring freezes, according to some firms.”
Looking forward, US ADP Employment Change for May, expected 300K versus 247K prior, will be eyed closed due to being the early signal for Friday’s US Nonfarm Payrolls (NFP). Also important to watch is the US Factory Orders for May bearing forecasts of a 0.7% increase compared to 2.2% in previous readouts.
Also read: US ADP Employment Change May Preview: The labor market recedes from center stage
- A breakdown of the H&S formation has underpinned the greenback bulls.
- The 50- and 200-period EMAs are on the verge of showing a death cross.
- The RSI (14) has shifted into a bearish range of 20.0-40.00.
The EUR/USD pair is trading back and forth in a narrow range of 1.0644-1.0654 in the Asian session. The shared currency bulls have witnessed an extreme sell-off on Wednesday after slipping below the round level support of 1.0700.
A breakdown of the Head and Shoulder pattern on an hourly scale is strengthening the greenback bulls for the upcoming trading sessions. Usually, the formation of the above-mentioned chart pattern displays a prolonged inventory distribution in which the institutional investors shift their investors to the retail participants.
A death cross is highly expected from the asset as the 50- and 200-period Exponential Moving Averages (EMAs) are set to discover a bearish crossover around 1.0700.
Meanwhile, the Relative Strength Index (RSI) (14) has shifted into a bearish range of 20.00-40.00, which strengthens the greenback bulls.
A pullback move towards the 200-EMA at 1.0686 will be an optimal selling opportunity for the bargain sellers, which will drag the asset towards Wednesday’s low at 1.0623. A breach of the latter will unleash the greenback bulls for more downside towards May 20 high at 1.0600.
On the flip side, the eurozone bulls could regain their glory if the asset oversteps Tuesday’s high at 1.0747. This will drive the asset towards Monday’s high at 1.0786, followed by May 13 low at 1.0809.
EUR/USD hourly chart
-637897274750912647.png)
“There is a serious mismatch between inflation and the level of interest rates in Britain,” said the UK Times in its latest analytical piece published during Thursday’s Asian session. The report gains major attention as the writer Andrew Sentence is a senior adviser at Cambridge Econometrics, as well as an ex-BOE member.
Key quotes
The rate of consumer prices inflation measured by the CPI is now 9 percent — four-and-a-half times the official target rate of 2 percent. The Bank of England is forecasting that CPI inflation will reach double-digit levels by the end of the year.
The expectations of the general public about future price rises are already shifting upwards. The latest Citi/YouGov survey, released just a few days ago, shows that inflation expectations for the next 12 months are more than 6 percent, and for the next five to ten years more than 4 percent.
Another factor pointing to the need for tighter UK monetary policy is the evidence from the housing market, where property prices have been rising at about 10 percent or more for some time.
In addition, the inflation surge we face is a cocktail of many influences. Some of these — tight labor markets, widespread price increases and high price expectations — threaten to prolong high inflation for a number of years.
All this points to the need for more robust action by the Bank, and other central banks, in raising interest rates over this summer, and beyond.
If I were a member of the MPC now, I would be looking to raise the official UK interest rate to at least 2 percent by the autumn and to about 3 percent by next spring.
Also read: GBP/USD Price Analysis: 100-SMA tests bears below 1.2500
Silver (XAG/USD) prices consolidate the biggest daily gain in over a week by refreshing the intraday low with $21.77 during Thursday’s Asian session. In doing so, the bright metal justifies the bearish bias of the options traders, as per the latest Risk Reversal (RR) data from Reuters.
One-month silver RR, the spread between calls and puts, prints the biggest weekly fall in three with the latest -0.270 figures, per Reuters options market figures. It’s worth noting that the daily RR figures also remain downbeat for the second consecutive day and favor bears with -0.010 numbers. Furthermore, the XAG/USD RR dropped during the last two months and praised bears, the latest data for May month portray a -1.135 number.
In addition to the RR, risk-off mood and firmer US dollar also weighed on silver prices ahead of the key US ADP Employment Change for May, expected 300K versus 247K prior.
Also read: Silver Price Forecast: XAG/USD bounces off weekly lows and aims to re-test the $22.00 figure
| Pare | Closed | Change, % |
|---|---|---|
| AUDUSD | 0.71739 | -0.03 |
| EURJPY | 138.631 | 0.37 |
| EURUSD | 1.0653 | -0.74 |
| GBPJPY | 162.465 | 0.21 |
| GBPUSD | 1.24841 | -0.92 |
| NZDUSD | 0.64841 | -0.48 |
| USDCAD | 1.26567 | 0.06 |
| USDCHF | 0.96209 | 0.26 |
| USDJPY | 130.139 | 1.13 |
- AUD/USD stays on the back foot as sellers attack three-week-old support line.
- Wednesday’s Gravestone Doji, failures to cross 100-DMA favor bears.
- May’s high acts as an additional upside filter while area surrounding 0.7130-20 probes downside.
AUD/USD remains on the back foot around 0.7170, refreshing daily lows, as bears jostle with a short-term key support line during Thursday’s Asian session.
In doing so, the Aussie pair justifies the previous day’s bearish candlestick, namely the “Gravestone Doji”, as well as failures to cross the 100-DMA.
That said, the quote’s further downside hinges on a clear break of 0.7170. Even so, multiple tops marked during May 23-26 near 0.7130-20, will challenge AUD/USD sellers before directing them to the 0.7100 threshold.
In a case where the quote remains bearish past 0.7100, the 23.6% Fibonacci retracement of April-May fall, close to 0.7025, will be in focus.
Alternatively, a daily closing beyond the 100-DMA level of 0.7230 isn’t a welcome card for the AUD/USD buyers as the last monthly top surrounding 0.7270 offers an extra filter to the north.
Following that, a run-up towards the 61.8% Fibonacci retracement level near 0.7345 can’t be ruled out.
AUD/USD: Daily chart
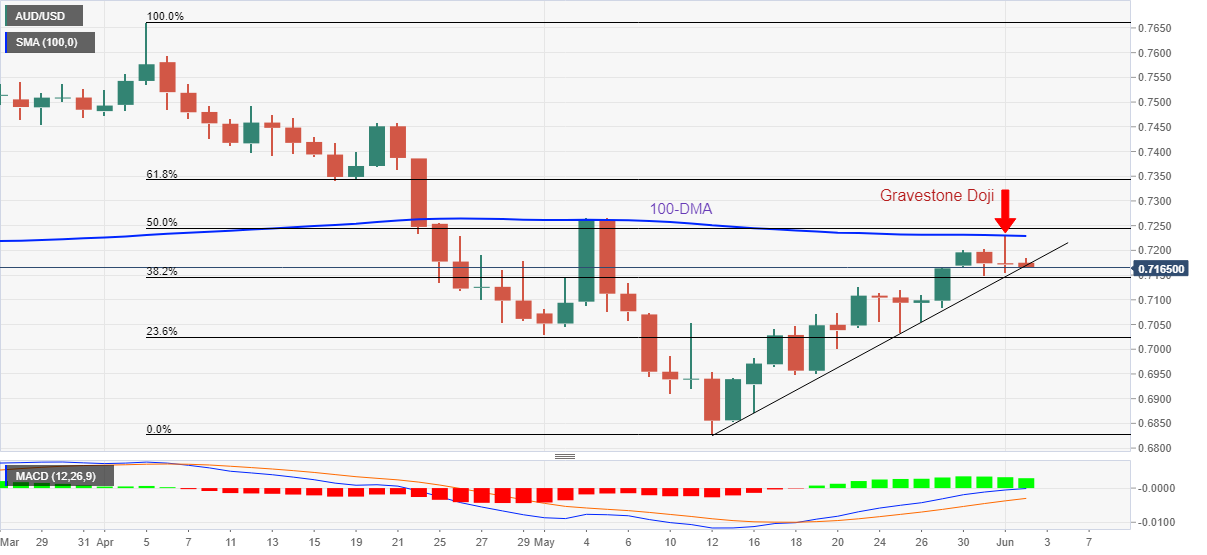
Trend: Further weakness expected
- USD/CHF is aiming to reclaim 0.9659 on the souring market mood.
- The Swiss inflation is expected to improve to 2.6% vs. 2.5% recorded earlier.
- The DXY has strengthened on advancing bets over a hawkish Fed policy.
The USD/CHF pair is trading lackluster around 0.9630 as investors are awaiting the release of the Swiss Consumer Price Index (CPI), which is due in the European session. The Swiss inflation is seen at 2.6% on annual basis, higher than the prior print of 2.5%. While the monthly CPI may decline to 0.3% vs. 0.4%. No doubt the CPI rate in the Swiss is is advancing gradually, but a hawkish stance by the Swiss National Bank is still not in consideration.
This week, the Swiss franc failed to capitalize on upbeat Gross Domestic Product (GDP) numbers. The annual figure jumped to 4.4%, in line with the estimates but higher than the previous figure of 3.6%. Also, the quarterly figure climbed to 0.5% vs. the forecast of 0.4% and the former print of 0.2%.
The pair has displayed a corrective move after hitting a weekly high of 0.9659. More upside is expected from the asset as a rebound in the risk-off impulse has underpinned the safe-haven assets.
Meanwhile, the US dollar index (DXY) is gearing up for resuming the bullish trend on expectations of an extreme hawkish stance from the Federal Reserve (Fed). Taking into account, the stability of the inflation figure above 8% and the tight labor market, a rate hike is highly needed to safeguard the pockets of the households.
Investors’ focus will remain on the release of the US Nonfarm Payrolls (NFP), which are due on Friday. A dismal performance is expected from the economic catalyst as the data is seen at 325k against the prior print of 428k.


© 2000-2026. All rights reserved.
This site is managed by Teletrade D.J. LLC 2351 LLC 2022 (Euro House, Richmond Hill Road, Kingstown, VC0100, St. Vincent and the Grenadines).
The information on this website is for informational purposes only and does not constitute any investment advice.
The company does not serve or provide services to customers who are residents of the US, Canada, Iran, The Democratic People's Republic of Korea, Yemen and FATF blacklisted countries.
Making transactions on financial markets with marginal financial instruments opens up wide possibilities and allows investors who are willing to take risks to earn high profits, carrying a potentially high risk of losses at the same time. Therefore you should responsibly approach the issue of choosing the appropriate investment strategy, taking the available resources into account, before starting trading.
Use of the information: full or partial use of materials from this website must always be referenced to TeleTrade as the source of information. Use of the materials on the Internet must be accompanied by a hyperlink to teletrade.org. Automatic import of materials and information from this website is prohibited.
Please contact our PR department if you have any questions or need assistance at pr@teletrade.global.
transfers