- Analytics
- News and Tools
- Market News
CFD Markets News and Forecasts — 01-05-2024
Japan's top currency diplomat, Masato Kanda, who will instruct the BoJ to intervene, when he judges it necessary, declined to confirm if Japanese authorities had stepped into the foreign exchange (FX) market early Thursday following a sharp strengthening of the Yen. Kanda added that they will disclose intervention data at the end of this month.
Market reaction
At the time of writing, USD/JPY was trading at 155.67, adding 0.68% on the day.
Japanese Yen FAQs
The Japanese Yen (JPY) is one of the world’s most traded currencies. Its value is broadly determined by the performance of the Japanese economy, but more specifically by the Bank of Japan’s policy, the differential between Japanese and US bond yields, or risk sentiment among traders, among other factors.
One of the Bank of Japan’s mandates is currency control, so its moves are key for the Yen. The BoJ has directly intervened in currency markets sometimes, generally to lower the value of the Yen, although it refrains from doing it often due to political concerns of its main trading partners. The current BoJ ultra-loose monetary policy, based on massive stimulus to the economy, has caused the Yen to depreciate against its main currency peers. This process has exacerbated more recently due to an increasing policy divergence between the Bank of Japan and other main central banks, which have opted to increase interest rates sharply to fight decades-high levels of inflation.
The BoJ’s stance of sticking to ultra-loose monetary policy has led to a widening policy divergence with other central banks, particularly with the US Federal Reserve. This supports a widening of the differential between the 10-year US and Japanese bonds, which favors the US Dollar against the Japanese Yen.
The Japanese Yen is often seen as a safe-haven investment. This means that in times of market stress, investors are more likely to put their money in the Japanese currency due to its supposed reliability and stability. Turbulent times are likely to strengthen the Yen’s value against other currencies seen as more risky to invest in.
- GBP/USD trades on a stronger note around 1.2535 amid the weaker USD on Thursday.
- The Fed maintained rates unchanged in a 5.25%–5.50% range, as widely expected.
- Financial markets expect the Bank of England (BoE) to cut borrowing costs in the June or August meetings.
The GBP/USD pair gains traction near 1.2535 on Thursday during the early Asian session. The uptick of the major pair is supported by the sharp decline of the US Dollar (USD) after the US Federal Reserve (Fed) left its interest rate unchanged.
As widely anticipated, the US central bank kept its benchmark rate in a target range of 5.25%–5.50% at its May meeting on Wednesday, its highest level in more than two decades. The US Fed did not expect it would be appropriate to cut the interest rate until the central bank gain greater confidence that inflation was moving sustainably to its 2% target.
Furthermore, Fed Chair Jerome Powell said during the press conference, “I think it’s unlikely that the next policy rate move will be a hike.” These comments spark a modest dovish reaction in the markets, which weighs on the Greenback and creates a tailwind for the GBP/USD pair. Amidst the persistence of elevated inflation and the robust economy, financial markets see only one rate cut in November, according to the CME FedWatch. The central bank has also announced that it will now reduce its bond portfolio more slowly. The Fed will reduce their monthly holdings in US Treasury securities from $60 billion to $25 billion, starting in June
On the other hand, investors expect the Bank of England (BoE) to cut borrowing costs in the June or August meetings, as BoE Governor Andrew Bailey said he is confident that headline inflation will return to 2% in April. However, BoE Chief Economist Huw Pill warned last week that there were greater risks from cutting the interest rate too quickly, rather than too late. His remarks provide some support for the Pound Sterling (GBP).
- EUR/USD churned after Fed rate hold.
- Investors pivoting to focus on Friday’s US NFP.
- Quiet Thursday ahead with mid-tier data.
EUR/USD cycled familiar territory on Wednesday after the US Federal Reserve (Fed) held rates as many investors had expected. However, market participants were hoping for further signs of impending rate cuts from the US central bank. At current cut, rate markets are anticipating a first and only rate cut for the year in November.
Powell speech: Unlikely that next policy rate move would be a hike
Thursday sees final HCOB Manufacturing Purchasing Manager Index (PMI) figures from Europe, with markets expecting the prints to land exactly where preliminary figures had come in. Manufacturing currently comprises less than 24% of the overall European economy.
Friday’s US NFP will drive much of the market momentum to close out the trading week, with markets expecting a print of 243K in April versus the previous month’s 303K. Revisions to data will be closely watched as layoffs continue to plague larger sections of the US economy. Investors are also hoping that Average Hourly Earnings MoM in April hold flat at 0.3% as wages continue to be the popular target for broad-market inflation fears.
EUR/USD technical outlook
EUR/USD has churned in near-term consolidation for six consecutive trading days as the pair grapples with the 1.0700 handle. The 200-hour Exponential Moving Average (EMA) provides a key midrange level, with rough upper and lower bounds at 1.0740 and 1.0650.
A near-term floor has been priced in near the 1.0600 handle on daily candles, but the pair has struggled on the bearish side of the 200-day EMA near 1.0790.
EUR/USD hourly chart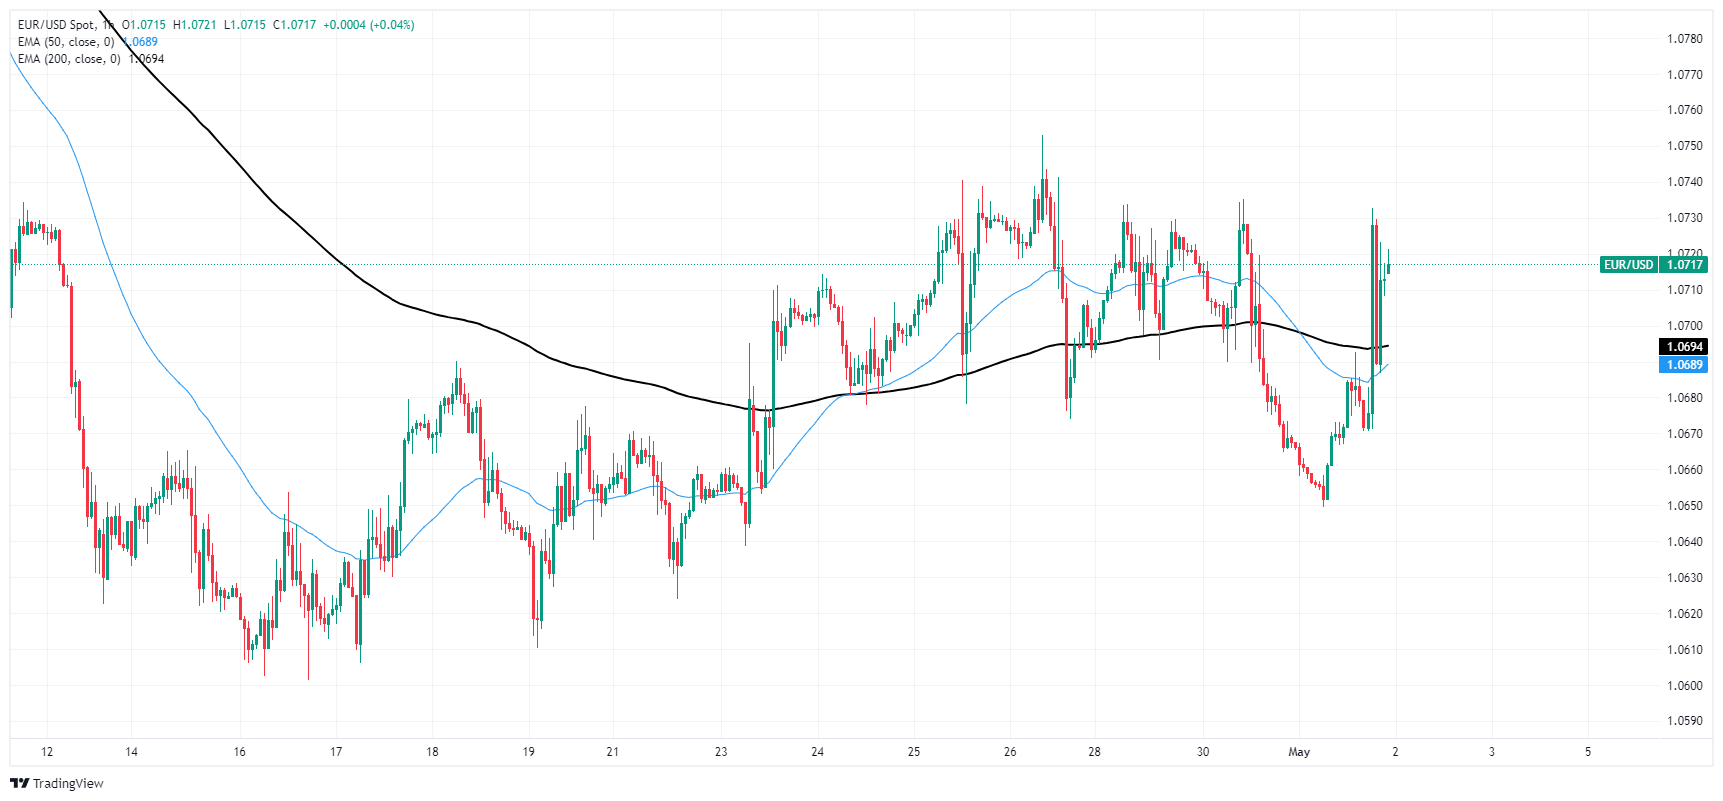
EUR/USD daily chart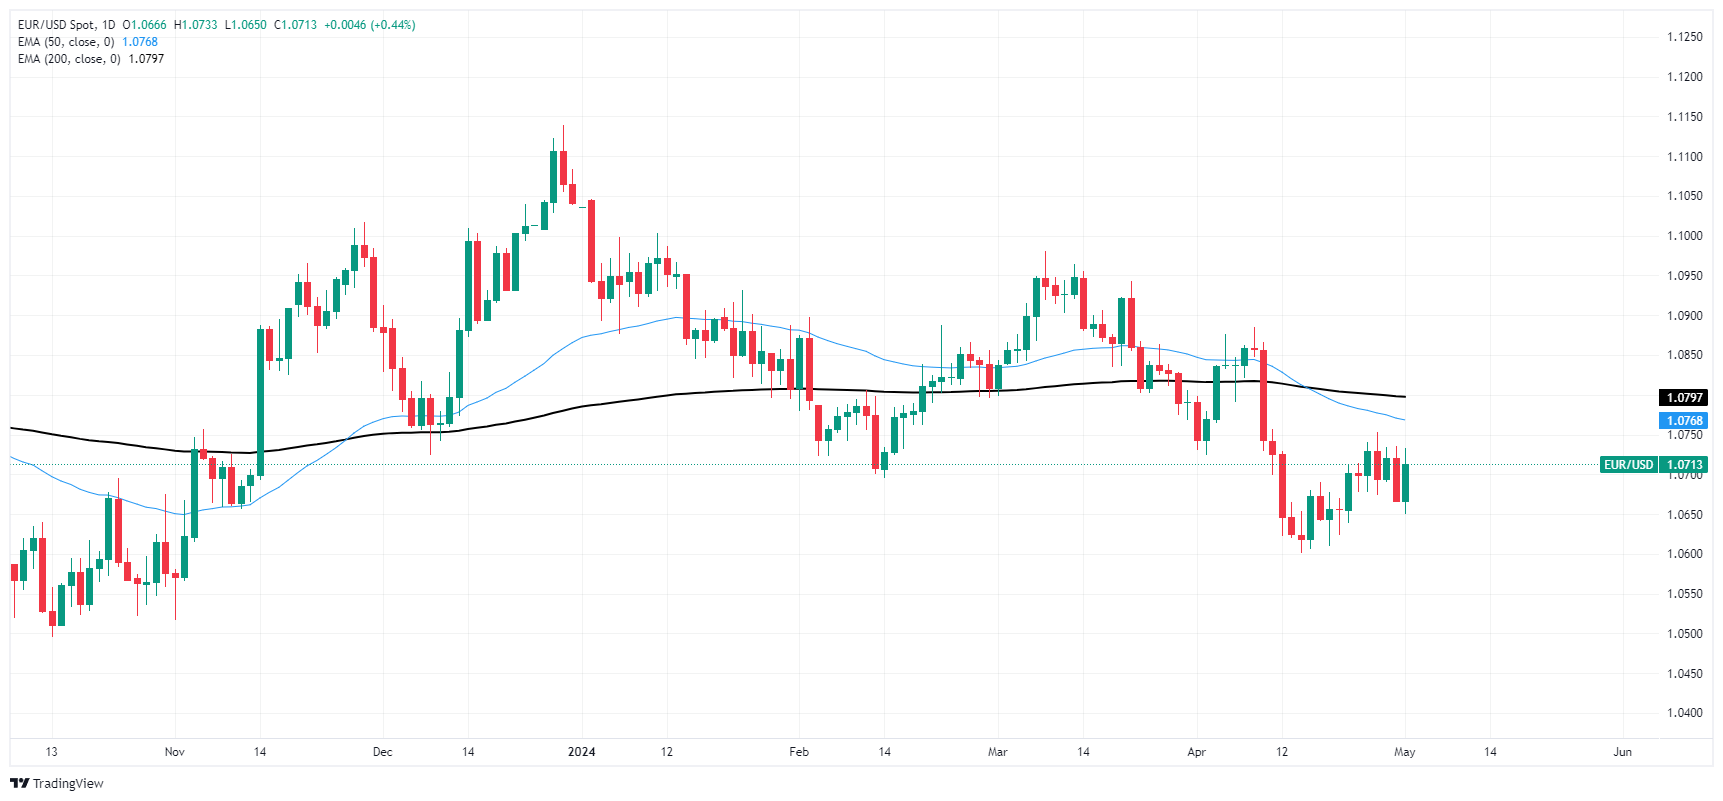
Bank of Canada (BoC) Governor Tiff Macklem hit newswires late Wednesday, reiterating that the BoC isn't beholden to following the Federal Reserve's (Fed) playbook as the two central banks grapple with slightly different economic situations.
Key highlights
- BoC is getting close to being able to cut rates.
- GDP growth is expected to be 1.5% in 2024, 2.0% in 2025 and 2026.
- Data since January has increased our confidence that inflation will continue to come back down.
- BoC expected core inflation to continue to ease gradually.
- Growth in the Canadian economy appears to be picking up.
- Monetary policy appears to be working.
- BoC does not have to do whatever the Fed does.
- Silver stable at $26.64 after Fed holds rates steady, per Chair Powell's data-driven stance.
- Technicals: Silver rebounds from $26.27 low, eyes $27.00 resistance.
- Silver hints at bullish trend; breakout above $27.14 could reinforce this.
- Bearish shift requires silver below $26.13, targeting lower supports.
Silver's price stayed firm at around $26.64 after the Fed decided to hold rates unchanged and Powell’s press conference. Fed Chair Jerome Powell said they would remain data-dependent, decide meeting by meeting, and won’t cut rates until they’re confident that inflation is trending towards its 2% goal.
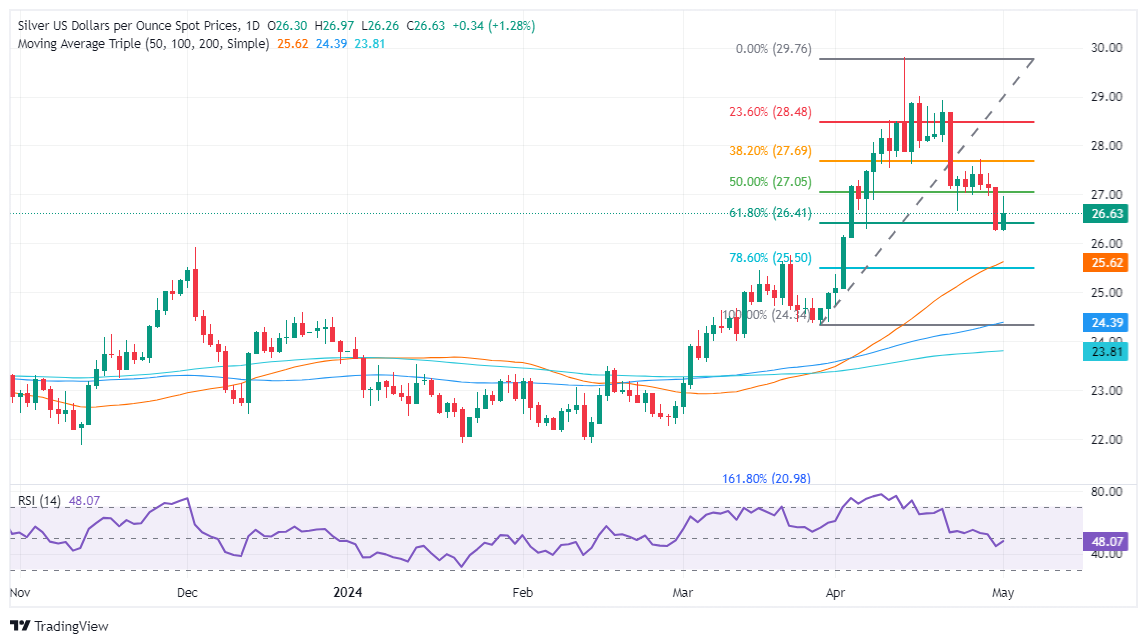
XAG/USD Price Analysis: Technical outlook
The grey metal dipped below the 61.8% Fibonacci retracement at $26.41, hitting a two-week low of $26.27 before resuming its uptrend. Although Silver reached a daily high of $26.96, buyers lacked the strength to break above the $27.00 figure, which paved the way to retreat to current price levels.
The XAG/USD is upward biased despite going through a pullback that sent prices from around $29.79 to $26.27. For sellers to shift the bias to bearish, they would need to push the spot price below the May 5 high at $26.13, which would pave the way toward $26.00 and below.
On the flip side, and the most likely scenario, if XAG/USD achieves a daily close at around the current level, a ‘bullish harami’ and a two-candle chart pattern will form. This usually would be bullish for the asset, but buyers must crack the April 30 high at $27.14, before resuming its uptrend.
XAG/USD Price Action – Daily Chart
- The Fed acknowledged no significant progress towards the 2% inflation goal, maintaining a hawkish stance.
- Despite challenges, Powell notes restrictive policies have moderated inflation and that risks to dual goals are more balanced.
- Markets are giving up the hopes of three rate cuts in 2024.
The NZD/USD found some momentum after the widely-anticipated Federal Reserve (Fed) decision which announced yet another hold, leaving rates at the 5.25-5.50% range. Powell’s cautious tone and data dependency were taken as dovish by markets which made investors dump the USD.
In addition, Powell stated that the bank still needs additional evidence to gain confidence to start cutting rates, noting that inflation’s progress stagnated in the last months. He confirmed that in case data continues to come strong, it would be appropriate to hold the restrictive police for some more time. When the data started to align with the bank’s forecast, he pointed out that he would consider cutting rates.
Regarding expectations, markets are giving up hopes of a cut in June and July and are pushing the start of the easing to September or even November.
NZD/USD technical analysis
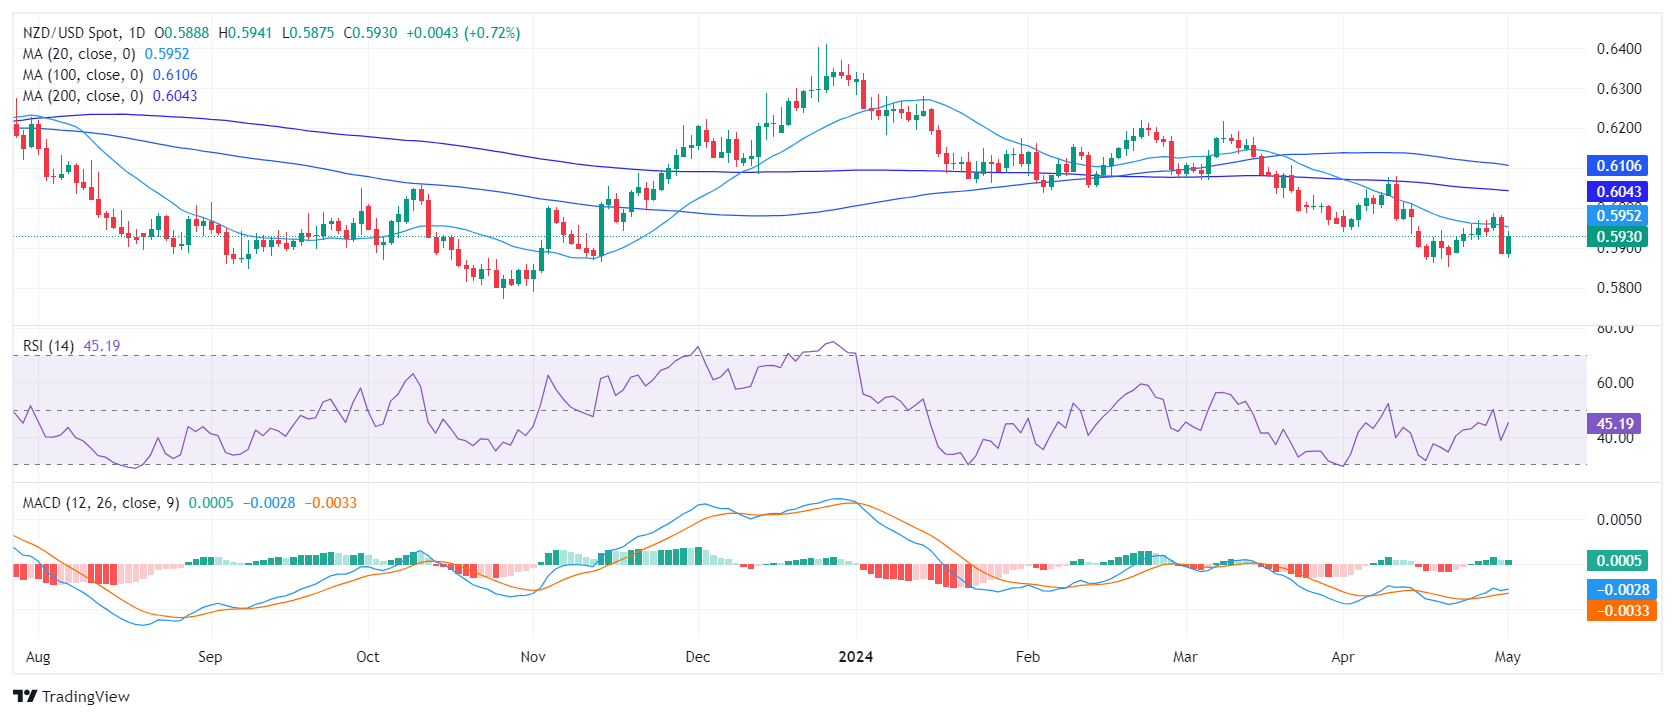
On the daily chart, the Relative Strength Index (RSI) stands in negative territory. The recent readings note an uptick to 44 which shows some light for the bulls but that they remain beneath the positive line. In addition, the Moving Average Convergence Divergence (MACD) histogram marks flat green bars, indicating a slight positive momentum.
NZD/USD daily chart
Shifting to the hourly chart display, the RSI shows diverse readings with an overbought condition at 70 followed by a drop to 55. Concurrently, the hourly MACD charts flat green bars, similar to the daily forecast, hinting at prospective positive impulse in the short-term.
NZD/USD hourly chart
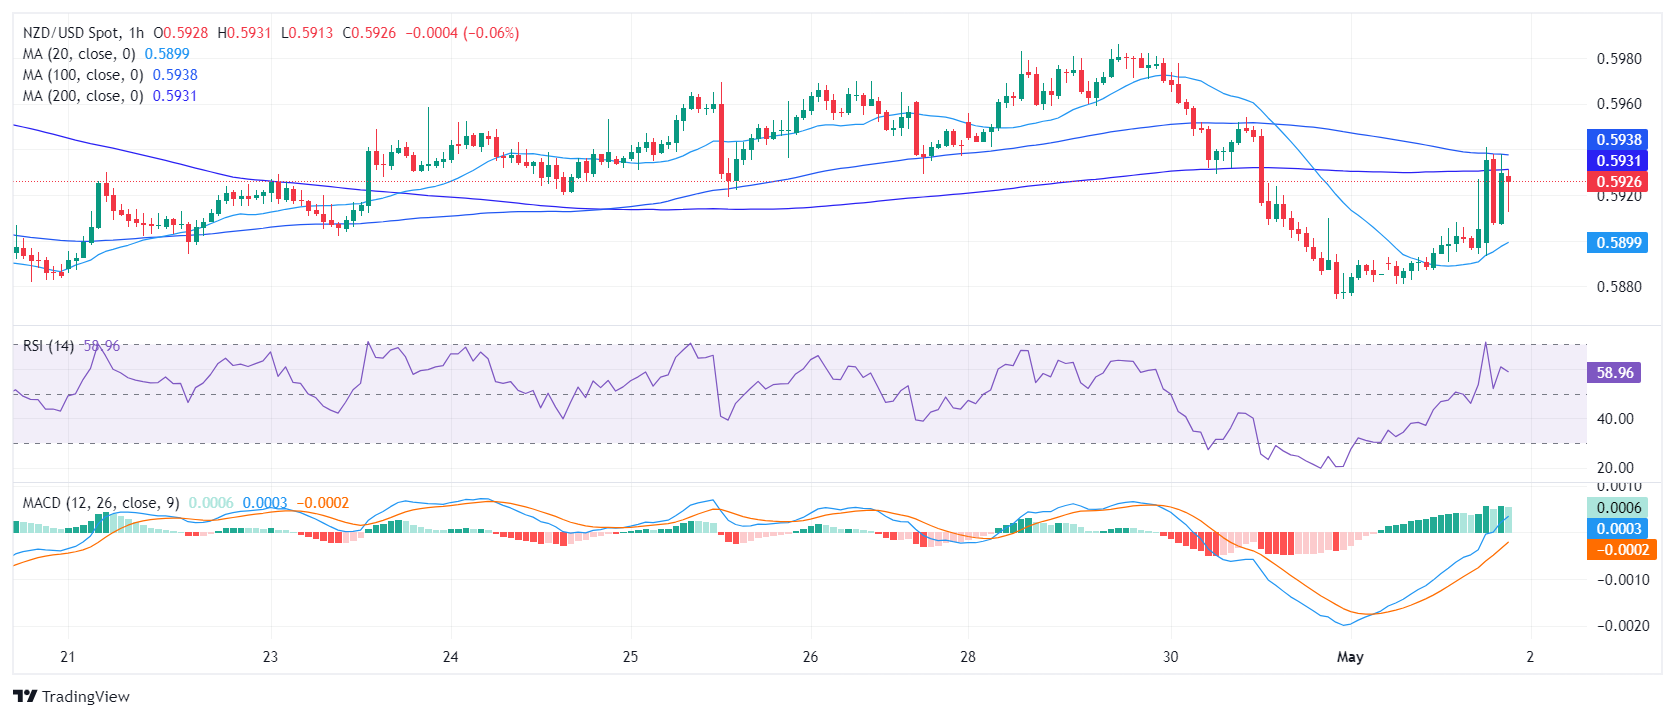
In assessing the wider picture, the NZD/USD is under significant downward pressure as it is currently positioned below the 20, 100, and 200-day Simple Moving Averages (SMAs).
Overall, the NZD/USD exhibits a mixed picture. Despite an hourly overbought signal tempering prospective bearish conditions, the key SMAs, coupled with the daily RSI readings, lean towards the bearish side, deprecating the NZD/USD pair. Current conditions suggest that sellers may continue to dominate, particularly as the pair trails below the important SMAs but buyers might make another stride at the 20-day SMA at 0.5950 which could brighten the outlook.
- WTI slips back below $80 per barrel.
- Crude Oil markets unsettled by latest Fed rate call.
- Supplies continue to overwhelm Crude Oil demand.
West Texas Intermediate (WTI) US Crude Oil fell below $80.00 per barrel on Wednesday as US Crude Oil supply continues to overwhelm demand, and the US Federal Reserve (Fed) remains hobbled on the path forward toward rate cuts.
With most global markets focused on the Fed’s latest rate call, the Energy Information Administration (EIA) printed its latest week-on-week barrel counts for US Crude Oil supply. According to the EIA, US barrel counts grew by 7.265 million for the week ended April 26, well below the forecast -2.3 million decline, and entirely engulfing the -6.368 million decline reported the week before.
The EIA’s upside barrel buildup adds to the same scenario unfolding in American Petroleum Institute (API) numbers published earlier this week. This week’s EIA print represents the highest WoW Crude Oil buildup since the week ended February 9. EIA US Crude Oil Stocks are up 9.473 million barrels in the month of April, and US Crude Oil production tracked by the EIA has oversupplied nearly 30 million barrels since the beginning of the year.
The Fed’s latest rate call held interest rates steady as markets broadly expected, but bumpy progress on dragging inflation lower has hobbled the Fed’s ability to reduce interest rates, and markets will be pivoting to focus on Friday’s US Nonfarm Payrolls (NFP) labor report for a hard look at developments in the domestic US economy.
WTI technical outlook
Wednesday’s decline drag WTI back below $80.00 per barrel and dropping out of a firm demand zone between $82.00 and $80.00. WTI is not trading into the 200-day Exponential Moving Average (EMA) near $79.17, and US Crude Oil is now trading down nearly 10% from the last swing high of $81.25 in early April.
WTI hourly chart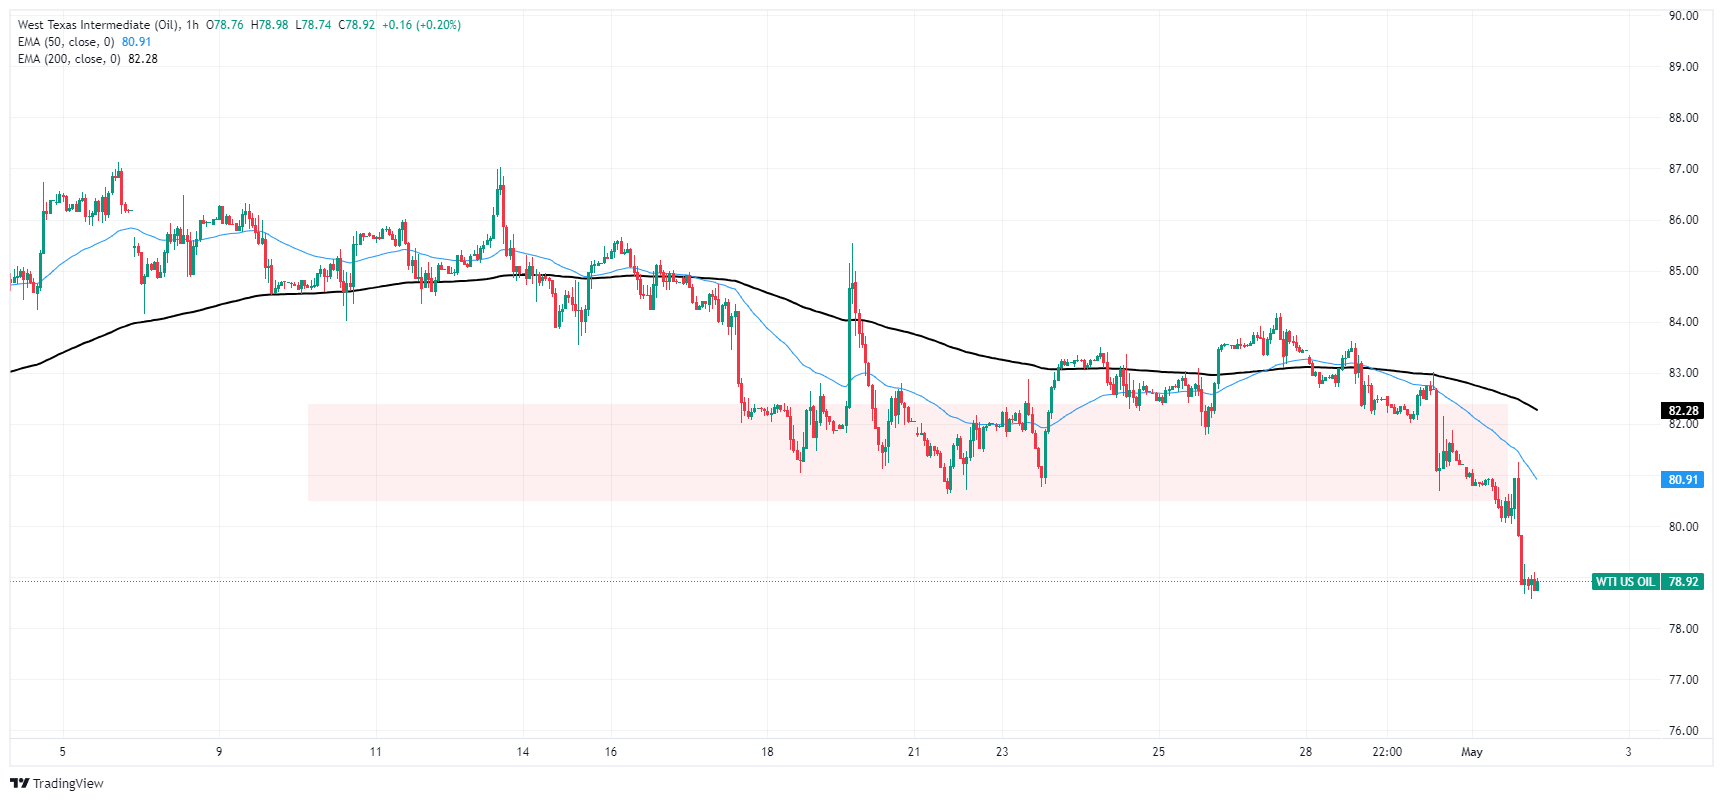
WTI daily chart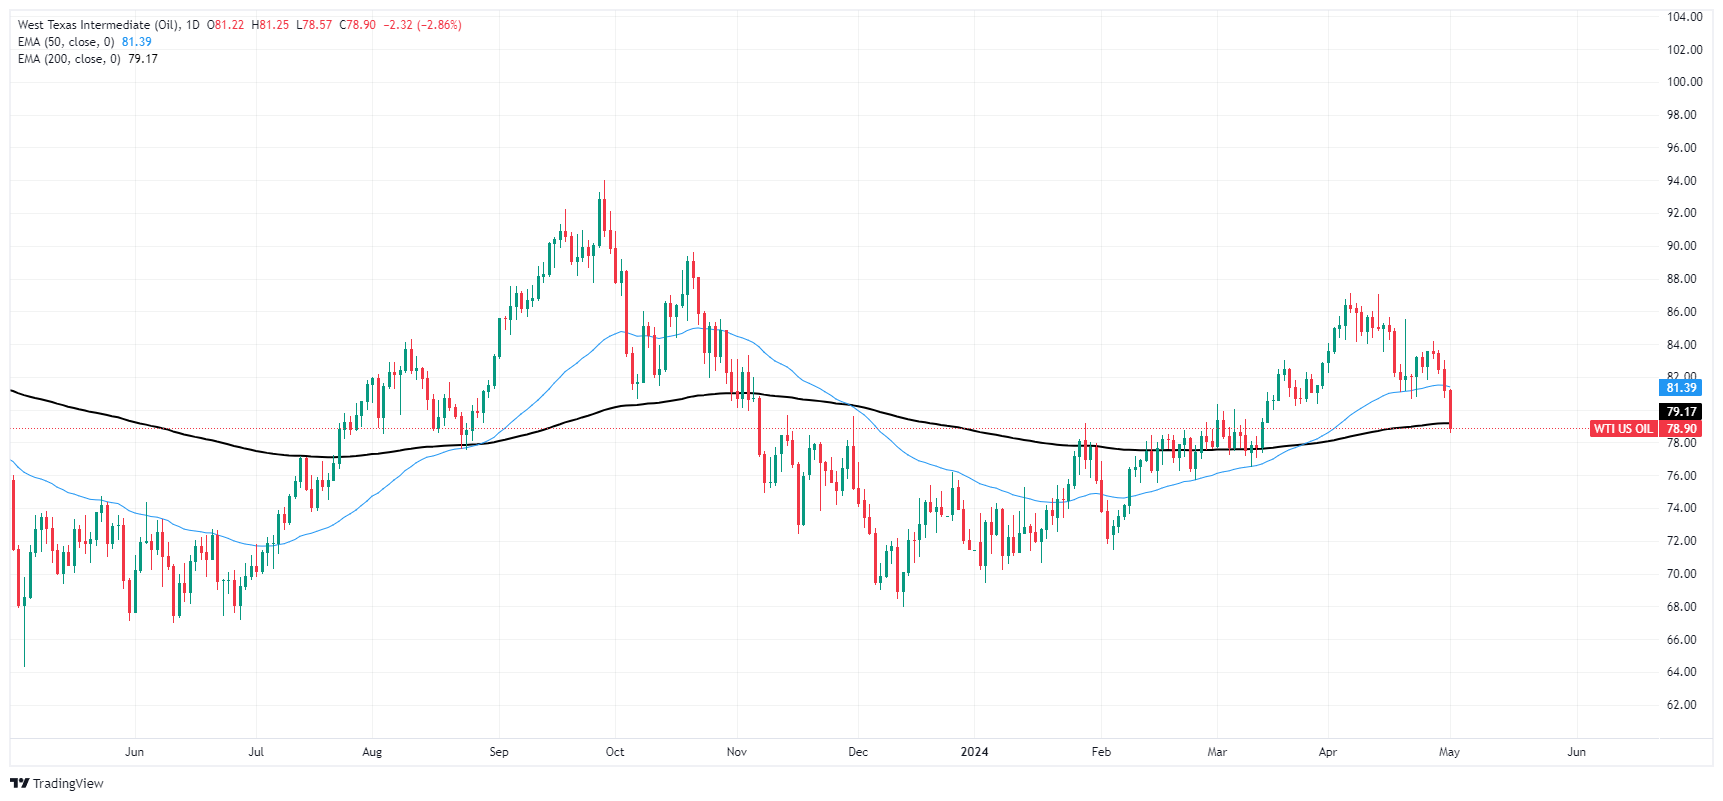
- Jerome Powell pointed out that the progress on inflation stagnated but that it was on track to the 2% target.
- He also pointed out that monetary policy needs more time to do its job and that a rate hike is highly unlikely.
- Markets are pushing rate cuts to year-end.
The US Dollar Index (DXY) tumbled to 105.45 on Wednesday following the Federal Reserve (Fed) decision to hold rates at 5.25-5.50% and Chair Powell’s cautious comments.
The US economy, despite facing inflationary pressures and a tightening labor market, maintains robust domestic demand as per Powell's observations. While registering progress, inflation remains high, leading to the Fed's cautious stance on its future trajectory. As for now investors are giving up their hopes on three rate cuts this year and are instead delaying the start of the easing cycle to Q4.
Daily digest market movers: DXY drops as markets digest Powell’s comments
- The Federal Reserve (Fed) emphasized that progress on inflation stagnated and that they need more confidence to start cutting.
- During the press conference, Jerome Powell acknowledged significant progress toward the Fed's dual goals, but that inflation is still above target, with further progress uncertain.
- He also presented different case scenarios where he basically stated that if data continues coming strong, they will hold their monetary policy for longer. If data gives the bank more confidence, they will start cutting.
- However, the basically took of the table the posibility of a rate cut.
- Currently, the likelihood of a rate cut by the Fed in June and July is low while those odd for the September meeting dipped below 55%.
DXY technical analysis: DXY is poised for a downward move, despite slight bullish indicators
On the daily chart, the Relative Strength Index (RSI) is on a negative slope even as it remains in positive territory, implying that despite the buying momentum, there is increasing bearish pressure. The Moving Average Convergence Divergence (MACD) showcases flat red bars indicating the possibility of a bearish crossover soon. This signals that the selling force could pick up steam in the coming trading sessions.
Additionally, the DXY's position above its Simple Moving Averages (SMAs) suggests a slightly bullish tone in the short term. Although showing a negative short-term outlook, the fact that it remains above the 20, 100, and 200-day SMAs insinuates the undercurrent of the bull forces that could balance out the bear camp.
US Dollar FAQs
The US Dollar (USD) is the official currency of the United States of America, and the ‘de facto’ currency of a significant number of other countries where it is found in circulation alongside local notes. It is the most heavily traded currency in the world, accounting for over 88% of all global foreign exchange turnover, or an average of $6.6 trillion in transactions per day, according to data from 2022. Following the second world war, the USD took over from the British Pound as the world’s reserve currency. For most of its history, the US Dollar was backed by Gold, until the Bretton Woods Agreement in 1971 when the Gold Standard went away.
The most important single factor impacting on the value of the US Dollar is monetary policy, which is shaped by the Federal Reserve (Fed). The Fed has two mandates: to achieve price stability (control inflation) and foster full employment. Its primary tool to achieve these two goals is by adjusting interest rates. When prices are rising too quickly and inflation is above the Fed’s 2% target, the Fed will raise rates, which helps the USD value. When inflation falls below 2% or the Unemployment Rate is too high, the Fed may lower interest rates, which weighs on the Greenback.
In extreme situations, the Federal Reserve can also print more Dollars and enact quantitative easing (QE). QE is the process by which the Fed substantially increases the flow of credit in a stuck financial system. It is a non-standard policy measure used when credit has dried up because banks will not lend to each other (out of the fear of counterparty default). It is a last resort when simply lowering interest rates is unlikely to achieve the necessary result. It was the Fed’s weapon of choice to combat the credit crunch that occurred during the Great Financial Crisis in 2008. It involves the Fed printing more Dollars and using them to buy US government bonds predominantly from financial institutions. QE usually leads to a weaker US Dollar.
Quantitative tightening (QT) is the reverse process whereby the Federal Reserve stops buying bonds from financial institutions and does not reinvest the principal from the bonds it holds maturing in new purchases. It is usually positive for the US Dollar.
The Greenback gave away Tuesday’s advance amidst declining US yields across the curve, all after the Fed left its interest rates unchanged, as expected, and Chief Powell ruled out an interest rate hike as the Fed’s next move.
Here is what you need to know on Thursday, May 2:
The USD Index (DXY) tumbled below the 106.00 support in the wake of the FOMC gathering along with the retracement in US yields. On May 2, weekly Initial Jobless Claims are due seconded by Balance of Trade results and Factory Orders.
EUR/USD reversed Tuesday’s pullback and returned beyond 1.0700 the figure in response to the marked sell-off in the Greenback following the FOMC event. The final HCOB Manufacturing PMI in both Germany and the euro area will be in the spotlight in the domestic docket on May 2.
GBP/USD regained the 1.2500 hurdle and above following the strong decline in the US Dollar after the fed matched consensus, leaving its rates unchanged. There will be no data releases on the UK docket on May 2.
USD/JPY partially trimmed Tuesday’s firm performance on the back of the renewed and strong selling bias in the Greenback and diminishing US yields across the curve. The BoJ will publish its Minutes on May 2 followed by weekly Foreign Bond Investment figures and the Consumer Confidence gauge.
AUD/USD managed to stage a sharp comeback, retaking the 0.6500 barrier and beyond following the weak tone in the Greenback. In Australia, the Balance of Trade and preliminary Building Permits are expected on May 2.
Prices of WTI remained on the back foot and dropped to multi-week lows below the $79.00 mark per barrel.
Gold prices edged higher and surpassed the $2,300 mark per troy ounce following renewed weakness in the Dollar and lower yields. By the same token, Silver regained some upside traction and trimmed part of the recent intense drop.
Federal Reserve Chairman Jerome Powell explains the decision to leave the policy rate, federal funds rate, unchanged at the range of 5.25-5.5% and responds to questions in the post-meeting press conference.
Key quotes
"We are at peace that we will do what we think is right when we think it is right."
"We will not take into account political events in our decisions."
"Pending elections are not part of our thinking."
"We've seen pretty consistent progress on slowing wage growth, but it's bumpy."
"If wages are running higher than productivity would warrant, that would boost inflation."
"We've seen progress on wages but it's inconsistent, ways to go on that."
"Restrictive monetary policy is doing what it is supposed to do."
"Reversal of supply and demand distortions and restrictive policy are bringing down inflation; have made lots of progress but a ways to go."
"Market rents are barely going up at all now."
"Market rents take years to get all the way into rents for rollover tenants."
"So it takes some time, I am confident that this will show up in measured inflation is market rents remain low."
"But we think it will take significantly longer than we thought."
About Jerome Powell (via Federalreserve.gov)
"Jerome H. Powell first took office as Chair of the Board of Governors of the Federal Reserve System on February 5, 2018, for a four-year term. He was reappointed to the office and sworn in for a second four-year term on May 23, 2022. Mr. Powell also serves as Chairman of the Federal Open Market Committee, the System's principal monetary policymaking body. Mr. Powell has served as a member of the Board of Governors since taking office on May 25, 2012, to fill an unexpired term. He was reappointed to the Board and sworn in on June 16, 2014, for a term ending January 31, 2028."
Fed FAQs
Monetary policy in the US is shaped by the Federal Reserve (Fed). The Fed has two mandates: to achieve price stability and foster full employment. Its primary tool to achieve these goals is by adjusting interest rates. When prices are rising too quickly and inflation is above the Fed’s 2% target, it raises interest rates, increasing borrowing costs throughout the economy. This results in a stronger US Dollar (USD) as it makes the US a more attractive place for international investors to park their money. When inflation falls below 2% or the Unemployment Rate is too high, the Fed may lower interest rates to encourage borrowing, which weighs on the Greenback.
The Federal Reserve (Fed) holds eight policy meetings a year, where the Federal Open Market Committee (FOMC) assesses economic conditions and makes monetary policy decisions. The FOMC is attended by twelve Fed officials – the seven members of the Board of Governors, the president of the Federal Reserve Bank of New York, and four of the remaining eleven regional Reserve Bank presidents, who serve one-year terms on a rotating basis.
In extreme situations, the Federal Reserve may resort to a policy named Quantitative Easing (QE). QE is the process by which the Fed substantially increases the flow of credit in a stuck financial system. It is a non-standard policy measure used during crises or when inflation is extremely low. It was the Fed’s weapon of choice during the Great Financial Crisis in 2008. It involves the Fed printing more Dollars and using them to buy high grade bonds from financial institutions. QE usually weakens the US Dollar.
Quantitative tightening (QT) is the reverse process of QE, whereby the Federal Reserve stops buying bonds from financial institutions and does not reinvest the principal from the bonds it holds maturing, to purchase new bonds. It is usually positive for the value of the US Dollar.
Federal Reserve Chairman Jerome Powell explains the decision to leave the policy rate, federal funds rate, unchanged at the range of 5.25-5.5% and responds to questions in the post-meeting press conference.
Key quotes
"I don't know if productivity will run persistently above trend."
"Could have significant increase in potential economic output."
"We believe our policy stance is in a good place given current situation."
"We are not satisfied with 3% inflation, we will return inflation to 2% over time."
"Our stance we think is appropriate to do that."
"Policy focus has been on what to do about holding current level of restriction; that was meeting discussion."
"Restrictive monetary policy needs more time to do its job."
"How long that will take, how patient we need to be, will depend on data."
About Jerome Powell (via Federalreserve.gov)
"Jerome H. Powell first took office as Chair of the Board of Governors of the Federal Reserve System on February 5, 2018, for a four-year term. He was reappointed to the office and sworn in for a second four-year term on May 23, 2022. Mr. Powell also serves as Chairman of the Federal Open Market Committee, the System's principal monetary policymaking body. Mr. Powell has served as a member of the Board of Governors since taking office on May 25, 2012, to fill an unexpired term. He was reappointed to the Board and sworn in on June 16, 2014, for a term ending January 31, 2028."
Central banks FAQs
Central Banks have a key mandate which is making sure that there is price stability in a country or region. Economies are constantly facing inflation or deflation when prices for certain goods and services are fluctuating. Constant rising prices for the same goods means inflation, constant lowered prices for the same goods means deflation. It is the task of the central bank to keep the demand in line by tweaking its policy rate. For the biggest central banks like the US Federal Reserve (Fed), the European Central Bank (ECB) or the Bank of England (BoE), the mandate is to keep inflation close to 2%.
A central bank has one important tool at its disposal to get inflation higher or lower, and that is by tweaking its benchmark policy rate, commonly known as interest rate. On pre-communicated moments, the central bank will issue a statement with its policy rate and provide additional reasoning on why it is either remaining or changing (cutting or hiking) it. Local banks will adjust their savings and lending rates accordingly, which in turn will make it either harder or easier for people to earn on their savings or for companies to take out loans and make investments in their businesses. When the central bank hikes interest rates substantially, this is called monetary tightening. When it is cutting its benchmark rate, it is called monetary easing.
A central bank is often politically independent. Members of the central bank policy board are passing through a series of panels and hearings before being appointed to a policy board seat. Each member in that board often has a certain conviction on how the central bank should control inflation and the subsequent monetary policy. Members that want a very loose monetary policy, with low rates and cheap lending, to boost the economy substantially while being content to see inflation slightly above 2%, are called ‘doves’. Members that rather want to see higher rates to reward savings and want to keep a lit on inflation at all time are called ‘hawks’ and will not rest until inflation is at or just below 2%.
Normally, there is a chairman or president who leads each meeting, needs to create a consensus between the hawks or doves and has his or her final say when it would come down to a vote split to avoid a 50-50 tie on whether the current policy should be adjusted. The chairman will deliver speeches which often can be followed live, where the current monetary stance and outlook is being communicated. A central bank will try to push forward its monetary policy without triggering violent swings in rates, equities, or its currency. All members of the central bank will channel their stance toward the markets in advance of a policy meeting event. A few days before a policy meeting takes place until the new policy has been communicated, members are forbidden to talk publicly. This is called the blackout period.
Federal Reserve Chairman Jerome Powell explains the decision to leave the policy rate, federal funds rate, unchanged at the range of 5.25-5.5% and responds to questions in the post-meeting press conference.
Key quotes
"Since December, goods and housing inflation has been higher than expected."
"My expectation is over the course of this year, inflation will move back down but my confidence in that is lower than it was before."
"Looks like substantial lags in when lower market rents will turn up in the data."
"Active tool of monetary policy is interest rates."
"Plan to slow balance sheet runoff is aimed at making it smooth, avoiding market turmoil."
"Balance sheet slowdown now is to ensure a smooth process and not market turmoil like last time."
"Economy has been very hard for forecasters to predict."
"There are paths to not cutting, and paths to cutting -- it will depend on the data."
"As inflation has come down to below 3%, the Fed's employment goal comes back into focus."
"I don't know if inflation will fall enough, or won't fall enough, to merit rate cuts."
About Jerome Powell (via Federalreserve.gov)
"Jerome H. Powell first took office as Chair of the Board of Governors of the Federal Reserve System on February 5, 2018, for a four-year term. He was reappointed to the office and sworn in for a second four-year term on May 23, 2022. Mr. Powell also serves as Chairman of the Federal Open Market Committee, the System's principal monetary policymaking body. Mr. Powell has served as a member of the Board of Governors since taking office on May 25, 2012, to fill an unexpired term. He was reappointed to the Board and sworn in on June 16, 2014, for a term ending January 31, 2028."
Interest rates FAQs
Interest rates are charged by financial institutions on loans to borrowers and are paid as interest to savers and depositors. They are influenced by base lending rates, which are set by central banks in response to changes in the economy. Central banks normally have a mandate to ensure price stability, which in most cases means targeting a core inflation rate of around 2%. If inflation falls below target the central bank may cut base lending rates, with a view to stimulating lending and boosting the economy. If inflation rises substantially above 2% it normally results in the central bank raising base lending rates in an attempt to lower inflation.
Higher interest rates generally help strengthen a country’s currency as they make it a more attractive place for global investors to park their money.
Higher interest rates overall weigh on the price of Gold because they increase the opportunity cost of holding Gold instead of investing in an interest-bearing asset or placing cash in the bank. If interest rates are high that usually pushes up the price of the US Dollar (USD), and since Gold is priced in Dollars, this has the effect of lowering the price of Gold.
The Fed funds rate is the overnight rate at which US banks lend to each other. It is the oft-quoted headline rate set by the Federal Reserve at its FOMC meetings. It is set as a range, for example 4.75%-5.00%, though the upper limit (in that case 5.00%) is the quoted figure. Market expectations for future Fed funds rate are tracked by the CME FedWatch tool, which shapes how many financial markets behave in anticipation of future Federal Reserve monetary policy decisions.
Federal Reserve Chairman Jerome Powell explains the decision to leave the policy rate, federal funds rate, unchanged at the range of 5.25-5.5% and responds to questions in the post-meeting press conference.
Key quotes
"Our decisions depend on incoming data."
"We think policy is well positioned to address different paths the economy might take."
"If inflation proves more persistent and labor market remains strong, then it could be appropriate to hold off on rate cuts."
"But there are other paths which would point to rate cuts."
"That would be if we gain greater confidence and unexpected weakening in labor market."
"Data will have to answer question of if this is peak rate."
"To reduce rates, we want to be confident inflation is moving down."
"Incoming inflation data will be at the very heart of that decision."
"Not obvious connection between easing in financial conditions and inflation."
"Wouldn't rule out that we could still have strong growth or labor market and inflation continue to fall."
"We will probably have to see wage growth ease to more sustainable levels to reach inflation goal."
"I don't know how long it will take before we can cut rates."
"We do need to take a signal from three worse-than-expected inflation readings."
"Will take us longer to get ourselves sufficiently confident to change policy rate."
About Jerome Powell (via Federalreserve.gov)
"Jerome H. Powell first took office as Chair of the Board of Governors of the Federal Reserve System on February 5, 2018, for a four-year term. He was reappointed to the office and sworn in for a second four-year term on May 23, 2022. Mr. Powell also serves as Chairman of the Federal Open Market Committee, the System's principal monetary policymaking body. Mr. Powell has served as a member of the Board of Governors since taking office on May 25, 2012, to fill an unexpired term. He was reappointed to the Board and sworn in on June 16, 2014, for a term ending January 31, 2028."
Fed FAQs
Monetary policy in the US is shaped by the Federal Reserve (Fed). The Fed has two mandates: to achieve price stability and foster full employment. Its primary tool to achieve these goals is by adjusting interest rates. When prices are rising too quickly and inflation is above the Fed’s 2% target, it raises interest rates, increasing borrowing costs throughout the economy. This results in a stronger US Dollar (USD) as it makes the US a more attractive place for international investors to park their money. When inflation falls below 2% or the Unemployment Rate is too high, the Fed may lower interest rates to encourage borrowing, which weighs on the Greenback.
The Federal Reserve (Fed) holds eight policy meetings a year, where the Federal Open Market Committee (FOMC) assesses economic conditions and makes monetary policy decisions. The FOMC is attended by twelve Fed officials – the seven members of the Board of Governors, the president of the Federal Reserve Bank of New York, and four of the remaining eleven regional Reserve Bank presidents, who serve one-year terms on a rotating basis.
In extreme situations, the Federal Reserve may resort to a policy named Quantitative Easing (QE). QE is the process by which the Fed substantially increases the flow of credit in a stuck financial system. It is a non-standard policy measure used during crises or when inflation is extremely low. It was the Fed’s weapon of choice during the Great Financial Crisis in 2008. It involves the Fed printing more Dollars and using them to buy high grade bonds from financial institutions. QE usually weakens the US Dollar.
Quantitative tightening (QT) is the reverse process of QE, whereby the Federal Reserve stops buying bonds from financial institutions and does not reinvest the principal from the bonds it holds maturing, to purchase new bonds. It is usually positive for the value of the US Dollar.
Federal Reserve Chairman Jerome Powell explains the decision to leave the policy rate, federal funds rate, unchanged at the range of 5.25-5.5% and responds to questions in the post-meeting press conference.
Key quotes
"I do think policy is restrictive and is weighing on demand."
"You can see that with the labor market."
"Saw evidence of that today in the JOLTS report."
"Quits and hiring rates have normalized."
"We believe over time policy is sufficiently restrictive to bring inflation back down to 2%."
"The data will show if that's so."
"Unlikely that next policy rate move would be a hike."
"Policy focus is on how long to keep policy restrictive."
"To hike, we'd need to see evidence policy is not sufficiently restrictive -- that's not what we see."
About Jerome Powell (via Federalreserve.gov)
"Jerome H. Powell first took office as Chair of the Board of Governors of the Federal Reserve System on February 5, 2018, for a four-year term. He was reappointed to the office and sworn in for a second four-year term on May 23, 2022. Mr. Powell also serves as Chairman of the Federal Open Market Committee, the System's principal monetary policymaking body. Mr. Powell has served as a member of the Board of Governors since taking office on May 25, 2012, to fill an unexpired term. He was reappointed to the Board and sworn in on June 16, 2014, for a term ending January 31, 2028."
Interest rates FAQs
Interest rates are charged by financial institutions on loans to borrowers and are paid as interest to savers and depositors. They are influenced by base lending rates, which are set by central banks in response to changes in the economy. Central banks normally have a mandate to ensure price stability, which in most cases means targeting a core inflation rate of around 2%. If inflation falls below target the central bank may cut base lending rates, with a view to stimulating lending and boosting the economy. If inflation rises substantially above 2% it normally results in the central bank raising base lending rates in an attempt to lower inflation.
Higher interest rates generally help strengthen a country’s currency as they make it a more attractive place for global investors to park their money.
Higher interest rates overall weigh on the price of Gold because they increase the opportunity cost of holding Gold instead of investing in an interest-bearing asset or placing cash in the bank. If interest rates are high that usually pushes up the price of the US Dollar (USD), and since Gold is priced in Dollars, this has the effect of lowering the price of Gold.
The Fed funds rate is the overnight rate at which US banks lend to each other. It is the oft-quoted headline rate set by the Federal Reserve at its FOMC meetings. It is set as a range, for example 4.75%-5.00%, though the upper limit (in that case 5.00%) is the quoted figure. Market expectations for future Fed funds rate are tracked by the CME FedWatch tool, which shapes how many financial markets behave in anticipation of future Federal Reserve monetary policy decisions.
Federal Reserve Chairman Jerome Powell explains the decision to leave the policy rate, federal funds rate, unchanged at the range of 5.25-5.5% and responds to questions in the post-meeting press conference.
Key quotes
"The economic outlook is uncertain."
"We do not expect it will be appropriate to cut rates until have greater confidence on inflation moving toward 2%."
"So far this year, inflation readings have not given us that greater confidence."
"Likely that gaining greater confidence will take longer than previously expected."
"Reducing policy too soon or too much or too late or too little both have risks."
"Policy is well positioned to deal with risks and uncertainties we face."
"We will make decisions meeting by meeting."
"Slowing pace of QT does not mean our balance sheet will shrink less than it would otherwise."
"Slowing the pace of runoff will ensure a smooth transition for money markets."
"The decision to slow runoff will reduce the possibility of money market stress."
About Jerome Powell (via Federalreserve.gov)
"Jerome H. Powell first took office as Chair of the Board of Governors of the Federal Reserve System on February 5, 2018, for a four-year term. He was reappointed to the office and sworn in for a second four-year term on May 23, 2022. Mr. Powell also serves as Chairman of the Federal Open Market Committee, the System's principal monetary policymaking body. Mr. Powell has served as a member of the Board of Governors since taking office on May 25, 2012, to fill an unexpired term. He was reappointed to the Board and sworn in on June 16, 2014, for a term ending January 31, 2028."
US Dollar FAQs
The US Dollar (USD) is the official currency of the United States of America, and the ‘de facto’ currency of a significant number of other countries where it is found in circulation alongside local notes. It is the most heavily traded currency in the world, accounting for over 88% of all global foreign exchange turnover, or an average of $6.6 trillion in transactions per day, according to data from 2022. Following the second world war, the USD took over from the British Pound as the world’s reserve currency. For most of its history, the US Dollar was backed by Gold, until the Bretton Woods Agreement in 1971 when the Gold Standard went away.
The most important single factor impacting on the value of the US Dollar is monetary policy, which is shaped by the Federal Reserve (Fed). The Fed has two mandates: to achieve price stability (control inflation) and foster full employment. Its primary tool to achieve these two goals is by adjusting interest rates. When prices are rising too quickly and inflation is above the Fed’s 2% target, the Fed will raise rates, which helps the USD value. When inflation falls below 2% or the Unemployment Rate is too high, the Fed may lower interest rates, which weighs on the Greenback.
In extreme situations, the Federal Reserve can also print more Dollars and enact quantitative easing (QE). QE is the process by which the Fed substantially increases the flow of credit in a stuck financial system. It is a non-standard policy measure used when credit has dried up because banks will not lend to each other (out of the fear of counterparty default). It is a last resort when simply lowering interest rates is unlikely to achieve the necessary result. It was the Fed’s weapon of choice to combat the credit crunch that occurred during the Great Financial Crisis in 2008. It involves the Fed printing more Dollars and using them to buy US government bonds predominantly from financial institutions. QE usually leads to a weaker US Dollar.
Quantitative tightening (QT) is the reverse process whereby the Federal Reserve stops buying bonds from financial institutions and does not reinvest the principal from the bonds it holds maturing in new purchases. It is usually positive for the US Dollar.
Federal Reserve Chairman Jerome Powell explains the decision to leave the policy rate, federal funds rate, unchanged at the range of 5.25-5.5% and responds to questions in the post-meeting press conference.
Key quotes
"The economy has made considerable progress toward dual goals."
"Inflation eased substantially over the past year but it's still too high."
"Further progress on inflation is not assured; the path is uncertain."
"Restrictive stance has put downward pressure in inflation, economy."
"Risks to achieving dual goals have moved into better balance over the past year but inflation has shown lack of progress."
"We are highly attentive to inflation risks."
"Private domestic final purchases were as strong as second half of last year."
"That is an important underlying signal for demand."
"Labor market remains relatively tight."
"Nominal wage growth has eased over the past year but labor demand still exceeds supply."
"Inflation data received this year have been higher than expected."
"Longer term inflation expectations remain well anchored though."
"Our policy actions are guided by our goals."
"Monetary policy actions are guided by dual mandate."
About Jerome Powell (via Federalreserve.gov)
"Jerome H. Powell first took office as Chair of the Board of Governors of the Federal Reserve System on February 5, 2018, for a four-year term. He was reappointed to the office and sworn in for a second four-year term on May 23, 2022. Mr. Powell also serves as Chairman of the Federal Open Market Committee, the System's principal monetary policymaking body. Mr. Powell has served as a member of the Board of Governors since taking office on May 25, 2012, to fill an unexpired term. He was reappointed to the Board and sworn in on June 16, 2014, for a term ending January 31, 2028."
Fed FAQs
Monetary policy in the US is shaped by the Federal Reserve (Fed). The Fed has two mandates: to achieve price stability and foster full employment. Its primary tool to achieve these goals is by adjusting interest rates. When prices are rising too quickly and inflation is above the Fed’s 2% target, it raises interest rates, increasing borrowing costs throughout the economy. This results in a stronger US Dollar (USD) as it makes the US a more attractive place for international investors to park their money. When inflation falls below 2% or the Unemployment Rate is too high, the Fed may lower interest rates to encourage borrowing, which weighs on the Greenback.
The Federal Reserve (Fed) holds eight policy meetings a year, where the Federal Open Market Committee (FOMC) assesses economic conditions and makes monetary policy decisions. The FOMC is attended by twelve Fed officials – the seven members of the Board of Governors, the president of the Federal Reserve Bank of New York, and four of the remaining eleven regional Reserve Bank presidents, who serve one-year terms on a rotating basis.
In extreme situations, the Federal Reserve may resort to a policy named Quantitative Easing (QE). QE is the process by which the Fed substantially increases the flow of credit in a stuck financial system. It is a non-standard policy measure used during crises or when inflation is extremely low. It was the Fed’s weapon of choice during the Great Financial Crisis in 2008. It involves the Fed printing more Dollars and using them to buy high grade bonds from financial institutions. QE usually weakens the US Dollar.
Quantitative tightening (QT) is the reverse process of QE, whereby the Federal Reserve stops buying bonds from financial institutions and does not reinvest the principal from the bonds it holds maturing, to purchase new bonds. It is usually positive for the value of the US Dollar.
- GBP/USD trades between 1.2480 and 1.2512, reacting to the Federal Reserve's decision to hold rates unchanged.
- The Fed adopts a more balanced approach to achieving employment and inflation targets, noting a stall in progress towards the 2% inflation goal.
- The Fed will slow the pace of reduction of its securities holdings in June.
The GBP/USD seesaws after the Federal Reserve held rates unchanged but announced that it would slow the pace of its balance sheet reduction beginning in June. The major trades volatile within the 1.2480/1.2512 range at the time of writing,
Summary of monetary policy statement
Fed officials commented on its monetary policy statement that the risks to achieving employment and inflation goals “have moved toward better balance over the past year.” They acknowledged that despite inflation having been trending lower, “there has been a lack of further progress toward the Committee’s 2 percent inflation objective.”
Regarding the balance sheet reduction, Fed officials noted, “Beginning in June, the Committee will slow the pace of decline of its securities holdings by reducing the monthly redemption cap on Treasury securities from $60 billion to $25 billion. The Committee will maintain the monthly redemption cap on agency debt and agency mortgage-backed securities at $35 billion and will reinvest any principal payments in excess of this cap into Treasury securities.”
GBP/USD Reaction to Federal Reserve’s decision
Initially, the GBP/USD edged towards its daily high of 1.2512 before retreating beneath 1.2500. Due to the lack of follow-through, the pair could be testing the lows of the day at 1.2466 if the Fed Chairman Jerome Powell delivers some hawkish remarks. The next key support level beneath that would be the April 26 low at 1.2448, followed by the 1.2400 figure. On the upside lies the 200-day moving average (DMA) at 1.2552.
GBP/USD Price Action – Hourly Chart

- The Fed left interest rates unchanged at 5.25%-5.5% as expected.
- The statement acknowledged a stagnation of progress on inflation and the need for more confidence to start cutting.
- The bank seemed to have embraced the idea of less than three cuts in 2024.
The USD/JPY trades at 157.42 holding daily losses on Wednesday after the Federal Reserve (Fed) decision to hold rates at 5.25%-5.5%.
In the statement, the Federal Reserve has acknowledged that there has been no significant progress in the battle against inflation recently, noting a "lack of further progress toward the 2% inflation goal in recent months." This observation formed the core of their hawkish stance, which was anticipated by markets. Despite this, the Fed decided to slow down the pace of Quantitative Tightening, a move that was expected. They now view the risks to inflation as more balanced, leading to a unanimous vote among the members.
As for now, the odds of cuts in June and July remain low, while those probabilities still remain far to be priced in for the September meeting. Markets are starting to place bets on only one cut in 2024, which would come by year-end. Powell’s presser will be key for markets to get additional guidance.
USD/JPY technical analysis
On the daily chart, the Relative Strength Index (RSI) for USD/JPY illustrates a downward motion from overbought territory, indicating a potential bearish reversal. The Moving Average Convergence Divergence (MACD) histogram also suggests a possible bearish momentum as it prints flat green bars, reflecting a slowing of the upward momentum.
When analyzing on a wider spectrum, the USD/JPY sits comfortably above the 20-day Simple Moving Average (SMA), signaling a potential short-term upward momentum. In addition, as it also holds above the 100 and 200-day SMAs, the longer-term trend also remains bullish.
USD/JPY daily chart

- EUR/USD bumped higher after Fed acknowledged easing inflation pressures.
- Rate markets still see November as a likely first rate cut.
- US NFP Friday to provide key labor figures.
EUR/USD bumped slightly higher after the Federal Reserve (Fed) released its latest rate outlook, with the US central bank citing an improvement in inflationary conditions, though targets remain unhit and progress has slowed. The US Dollar (USD) eased broadly and risk appetite is taking a cautious step forward.
Read more: Fed keeps interest rate unchanged at 5.25%-5.5% as forecast
Markets will be awaiting key statements from the Federal Open Market Committee's (FOMC) press conference due to begin at 18:30 GMT, presided over by Fed Chair Jerome Powell.
EUR/USD technical outlook
EUR/USD found some early bidding post-Fed monetary policy report, ticking closer to 1.0700 as the pair springboards off intraday technical support from the 200-period Exponential Moving Average (EMA) near 1.0675 on five-minute charts.
A near-term technical ceiling remains firmly baked in at the 200-hour EMA at 1.0695, and a heavy supply zone is priced in above 1.0730 after last week's peak near 1.0750.
EUR/USD five-minute chart
EUR/USD hourly chart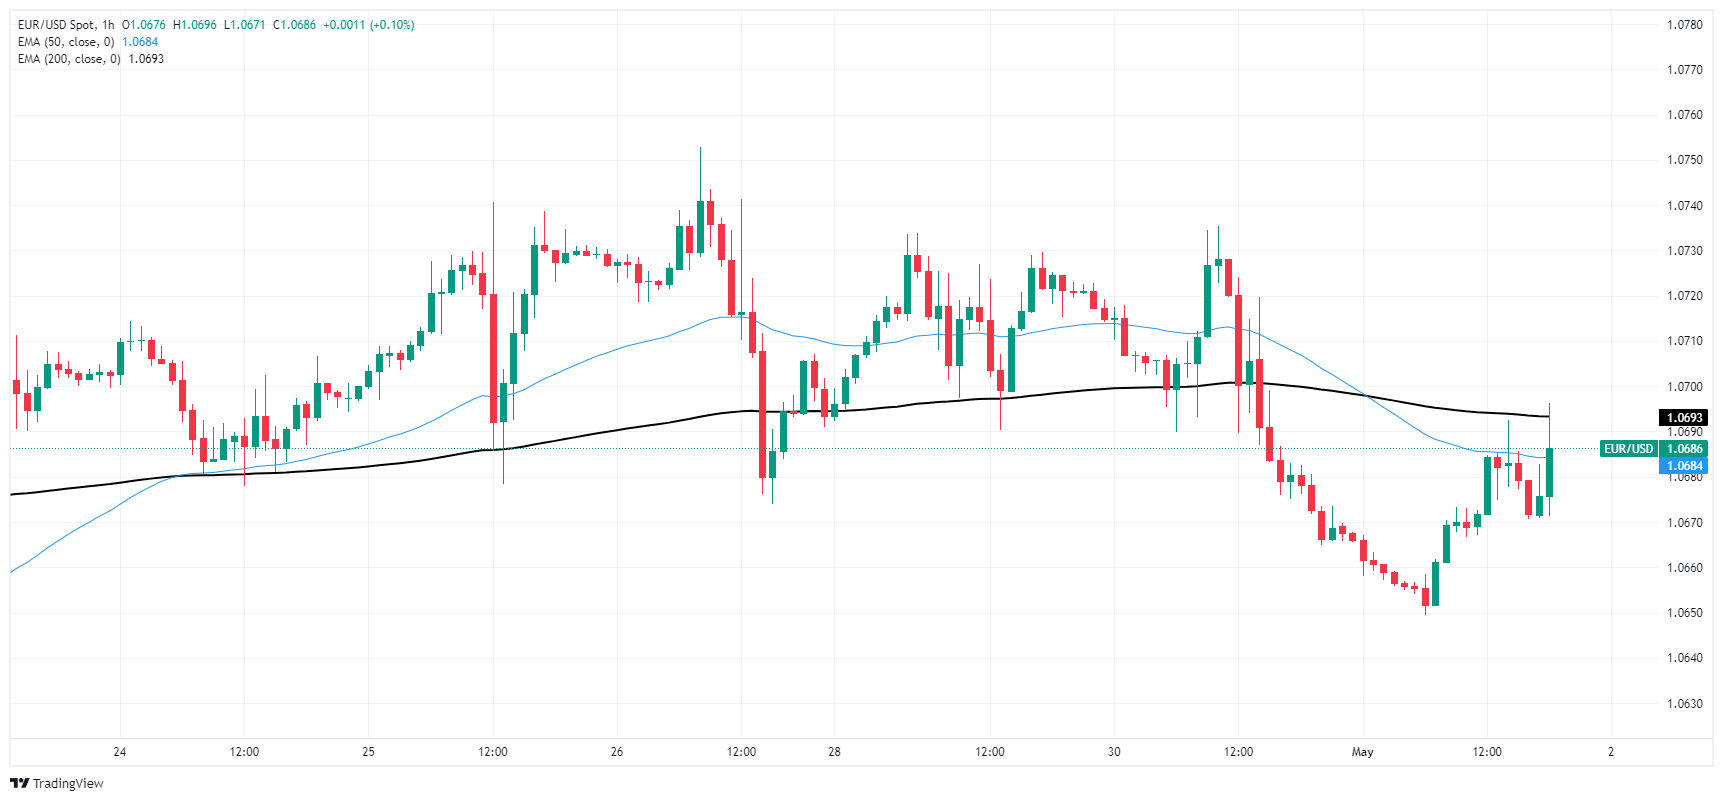
- Gold prices rallied 0.84% as they bounced back from a two-week low, buoyed by mixed US economic data.
- US manufacturing reports from S&P Global and ISM were mixed, complicating the economic outlook.
- Jobs data from the US was mixed as ADP reported rising employment, while job openings experienced a sharp decline.
Gold price reclaimed the $2,300 milestone on Wednesday after dropping to a two-week low of $2,281, sponsored by a rise in the Employment Cost Index (ECI) in April. However, buyers emerged following the release of two reports showing mixed readings on business activity in the manufacturing sector and in the labor market.
The XAU/USD trades with gains of 0.84% at $2,304 amid falling US Treasury yields and a weak US Dollar. Manufacturing activity expanded in April, according to S&P Global. However, the Institute for Supply Management (ISM) revealed a contraction for the same period in the economy of the United States (US), which could put pressure on the US Federal Reserve (Fed), which has lately adopted a more restrictive stance regarding the latest media appearances.
Further data from Automatic Data Processing (ADP) revealed that the economy added more people to the workforce. However, US job openings missed estimates and dropped to their lowest level in three years, an indication that the labor market is cooling.
Daily digest market movers: Gold price stays firm amid steady US Dollar, falling US yields
- Gold price climbs as US Treasury bond yields drop. The US 10-year Treasury bond yield has fallen three basis points (bps) to 4.653%, boosting the golden metal. At the same time, the Greenback, as measured by the US Dollar Index (DXY), is virtually unchanged, down 0.03% at 106.20.
- US manufacturing business activity showed mixed results recently. The S&P Global Manufacturing PMI registered at 50.0, which was above expectations but lower than the previous month's 51.9, indicating a stabilization in manufacturing activity.
- Contrarily, the ISM Manufacturing PMI indicated a contraction in the sector with a reading of 49.2, falling short of the expected 50.0 and down from March's expansionary figure of 50.3.
- April’s ADP Employment Change reported an increase of 192,000 jobs, surpassing estimates of 175,000 but still below the upwardly revised March figure of 208,000. Additionally, the JOLTS Job Openings for March dropped to 8.488 million, marking the lowest level of job openings reported, down from 8.813 million.
- The US economy continues to print mixed readings. Last week, the Gross Domestic Product (GDP) missed the mark. Still, inflationary data linked to the first quarter of 2024 sounded the alarm that the price trend is shifting to the upside, which might prevent the Fed from easing policy sooner than expected.
- On May 3, the US Bureau of Labor Statistics (BLS) is expected to reveal April’s Nonfarm Payrolls figures, which are expected to come at 243K, below March’s 303K. The Unemployment Rate is estimated to stay at 3.8%, while Average Hourly Earnings would likely remain unchanged at 0.3% MoM.
- Data from the Chicago Board of Trade (CBOT) suggests that traders expect the fed funds rate to finish 2024 at 5.100%, up from 5.080% on Tuesday.
Technical analysis: Gold price climbs and stabilizes above $2,300

Gold price uptrend remains intact, and once traders lifted the golden metal spot price above $2,300 that could open the door for further gains. If buyers push prices above the April 26 high of $2,352, that could open the door to challenging $2,400. Further upside is seen at the April 19 high at $2,417 and the all-time high of $2,431.
Otherwise, if Gold tumbles below $2,300 that could open the door for a pullback. Once sellers push prices below the April 23 daily low of $2,291, subsequent losses are expected. The next support would be $2,223, followed by $2,200.
Gold FAQs
Gold has played a key role in human’s history as it has been widely used as a store of value and medium of exchange. Currently, apart from its shine and usage for jewelry, the precious metal is widely seen as a safe-haven asset, meaning that it is considered a good investment during turbulent times. Gold is also widely seen as a hedge against inflation and against depreciating currencies as it doesn’t rely on any specific issuer or government.
Central banks are the biggest Gold holders. In their aim to support their currencies in turbulent times, central banks tend to diversify their reserves and buy Gold to improve the perceived strength of the economy and the currency. High Gold reserves can be a source of trust for a country’s solvency. Central banks added 1,136 tonnes of Gold worth around $70 billion to their reserves in 2022, according to data from the World Gold Council. This is the highest yearly purchase since records began. Central banks from emerging economies such as China, India and Turkey are quickly increasing their Gold reserves.
Gold has an inverse correlation with the US Dollar and US Treasuries, which are both major reserve and safe-haven assets. When the Dollar depreciates, Gold tends to rise, enabling investors and central banks to diversify their assets in turbulent times. Gold is also inversely correlated with risk assets. A rally in the stock market tends to weaken Gold price, while sell-offs in riskier markets tend to favor the precious metal.
The price can move due to a wide range of factors. Geopolitical instability or fears of a deep recession can quickly make Gold price escalate due to its safe-haven status. As a yield-less asset, Gold tends to rise with lower interest rates, while higher cost of money usually weighs down on the yellow metal. Still, most moves depend on how the US Dollar (USD) behaves as the asset is priced in dollars (XAU/USD). A strong Dollar tends to keep the price of Gold controlled, whereas a weaker Dollar is likely to push Gold prices up.
- Dow Jones stuck near recent lows as Fed looms.
- Equities are mixed as markets await Fed policy guidance.
- NFP Friday will solidify market outlook on US labor market.
After this week's backslide, the Dow Jones Industrial Average (DJIA) is stuck in a rut, dragging the index below 38,000.00 as investors buckle down for another rate call from the US Federal Reserve (Fed). With rates broadly expected to hold steady this week, investors will be looking for firmer clues about when the Fed could be expected to begin cutting interest rates.
US Interest Rate Decision: Fed set to keep policy steady as markets reassess timing of rate cuts
The US ISM Manufacturing Purchasing Managers Index (PMI) for April came in softer than expected, but Wednesday morning’s April ADP Employment Change came in above forecasts. Despite a declining US economic outlook, a tight labor market makes it difficult for the Fed to adjust policy rates without drastic knock-on effects that could include re-igniting inflation, which still remains higher than many hoped.
Read more:
- US ADP Employment Change increases above consensus in April
- US ISM Manufacturing PMI drops to 49.2 in April vs 50.0 expected
Dow Jones news
Of the 30 securities that comprise the Dow Jones, around half of them are trading in the red on Wednesday as markets pull into the midrange ahead of the latest Federal Open Market Committee (FOMC) appearance. Nike Inc. (NKE) is down around 1.8% on the day, with Johnson & Johnson (JNJ) and 3M Co. (MMM) dragging the index higher, up 4.3% and 2.5%, respectively.
Dow Jones technical outlook
The Dow Jones continues to struggle with the 38,000.00 handle, kicking Wednesday off with a dip to 37,708.46 before recovering into the previous day’s closing bids. The major equity index continues to trade into the low side, eating away at chart paper as the Dow Jones heads back towards the 200-day Exponential Moving Average (EMA) at 36,780.70.
Dow Jones five-minute chart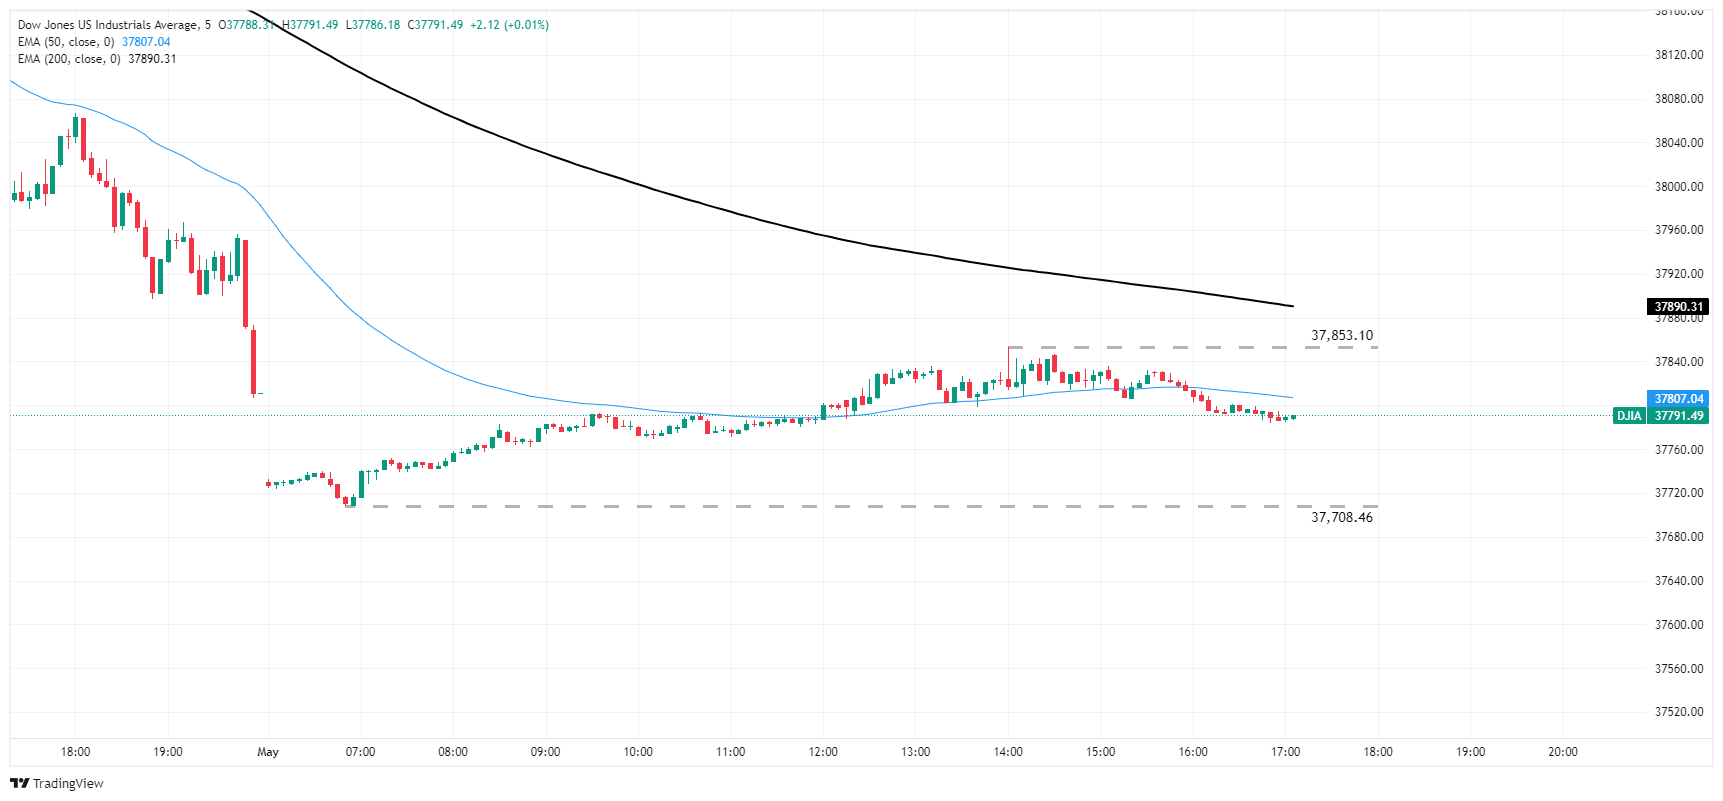
Dow Jones daily chart
Dow Jones FAQs
The Dow Jones Industrial Average, one of the oldest stock market indices in the world, is compiled of the 30 most traded stocks in the US. The index is price-weighted rather than weighted by capitalization. It is calculated by summing the prices of the constituent stocks and dividing them by a factor, currently 0.152. The index was founded by Charles Dow, who also founded the Wall Street Journal. In later years it has been criticized for not being broadly representative enough because it only tracks 30 conglomerates, unlike broader indices such as the S&P 500.
Many different factors drive the Dow Jones Industrial Average (DJIA). The aggregate performance of the component companies revealed in quarterly company earnings reports is the main one. US and global macroeconomic data also contributes as it impacts on investor sentiment. The level of interest rates, set by the Federal Reserve (Fed), also influences the DJIA as it affects the cost of credit, on which many corporations are heavily reliant. Therefore, inflation can be a major driver as well as other metrics which impact the Fed decisions.
Dow Theory is a method for identifying the primary trend of the stock market developed by Charles Dow. A key step is to compare the direction of the Dow Jones Industrial Average (DJIA) and the Dow Jones Transportation Average (DJTA) and only follow trends where both are moving in the same direction. Volume is a confirmatory criteria. The theory uses elements of peak and trough analysis. Dow’s theory posits three trend phases: accumulation, when smart money starts buying or selling; public participation, when the wider public joins in; and distribution, when the smart money exits.
There are a number of ways to trade the DJIA. One is to use ETFs which allow investors to trade the DJIA as a single security, rather than having to buy shares in all 30 constituent companies. A leading example is the SPDR Dow Jones Industrial Average ETF (DIA). DJIA futures contracts enable traders to speculate on the future value of the index and Options provide the right, but not the obligation, to buy or sell the index at a predetermined price in the future. Mutual funds enable investors to buy a share of a diversified portfolio of DJIA stocks thus providing exposure to the overall index.
- Mexican Peso edges up 0.50% against the US Dollar as traders await the Federal Reserve's policy announcement.
- Mexico's Q1 2024 GDP growth slows to 1.6% year-over-year, falling short of expectations and the previous quarter's growth rate.
- Mixed US PMI data contrasts with stronger-than-expected ADP employment figures.
The Mexican Peso recovered some ground against the US Dollar on Wednesday as traders braced for a busy economic docket in the United States (US). The highlight of the day would be the Federal Reserve's monetary policy decision and Fed Chair Jerome Powell's press conference. The USD/MXN trades with losses of around 0.50% on the day, at 17.03.
Mexico’s economy is slowing, the Instituto Nacional de Estadistica Geografia e Informatica (INEGI) revealed on Tuesday. The Gross Domestic Product (GDP) for Q1 2024 grew by 1.6% YoY, missing estimates of 2.1% and trailing 2023’s last quarter at 2.5%. On a quarterly basis, the growth rate showed an improvement from 0.1% to 0.2%, exceeding forecasts for no growth.
Across the border, US Purchasing Managers Index (PMI) figures from S&P Global and the Institute for Supply Management (ISM) were mixed. ADP data exceeded estimates, and job openings showed the labor market is cooling.
Daily digest market movers: Mexican Peso appreciates on mixed US data
- Data published in April showed that Mexico’s inflation was mixed. Headline inflation rose, mostly attributed to a jump in Oil prices. Conversely, underlying prices dipped, justifying the Bank of Mexico’s (Banxico) decision to lower rates.
- Although most analysts estimate Banxico will keep rates unchanged at 11.00%, new data could prompt heated discussions among Banxico’s Governing Council members on May 9.
- Last week, Banxico Governor Victoria Rodriguez Ceja said the central bank would be data dependent. However, weak GDP data could lead to a “live meeting” on May 9.
- Citibanamex Survey showed that most analysts expect Banxico to hold rates unchanged at the May meeting. The median foresees a rate cut in June, while they estimate the main reference rate to end the year at 10.00%, up from 9.63% previously.
- Measures of business activity in the US were mixed, as S&P Global Manufacturing PMI came at 50.0, higher than expected but trailing March’s 51.9. Contrarily, the ISM Manufacturing PMI came at 49.2, below estimates of 50.0, and signaling contraction in the sector once again after March’s expansion of 50.3
- ADP Employment Change rose by 192K in April, exceeding estimates of 175K but below March’s 208K upwardly revised figure. Further jobs data showed the JOLTS Job openings fell in March to their lowest level, from 8.813 million to 8.488 million.
- Fed is expected to keep rates unchanged at May 1 meeting, though traders will be eyeing Fed Chair Jerome Powell’s press conference. A hawkish tilt could trigger a jump in favor of the Greenback; otherwise, the USD/MXN could resume its downtrend.
- Data from the Chicago Board of Trade (CBOT) suggests that traders expect the fed funds rate to finish 2024 at 5.100%, up from 5.080% on Tuesday.
USD/MXN technical analysis: Mexican Peso regains control, USD/MXN dives below 200-day SMA
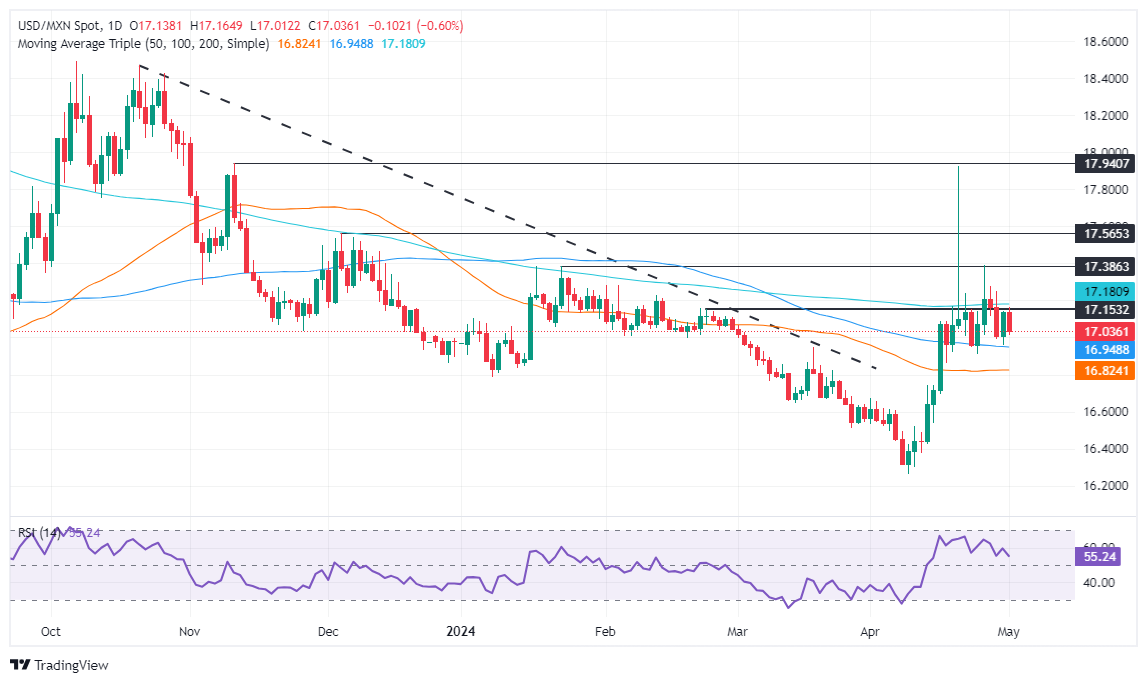
The Mexican Peso trims some of its Tuesday’s losses, as the USD/MXN struggled to crack the 200-day Simple Moving Average (SMA) at 17.17, turning lower toward the 17.00 figure. If sellers push the price below that level, immediate support emerges at the 100-day SMA at 16.94, followed by the 50-day SMA at 16.81 before challenging last year’s low of 16.62.
Conversely, if buyers regain the 200-day SMA, it will pave the way to test the weekly high of 17.24, followed by the January 23 swing high of 17.38, and the year-to-date (YTD) high of 17.92, ahead of 18.00.
Mexican Peso FAQs
The Mexican Peso (MXN) is the most traded currency among its Latin American peers. Its value is broadly determined by the performance of the Mexican economy, the country’s central bank’s policy, the amount of foreign investment in the country and even the levels of remittances sent by Mexicans who live abroad, particularly in the United States. Geopolitical trends can also move MXN: for example, the process of nearshoring – or the decision by some firms to relocate manufacturing capacity and supply chains closer to their home countries – is also seen as a catalyst for the Mexican currency as the country is considered a key manufacturing hub in the American continent. Another catalyst for MXN is Oil prices as Mexico is a key exporter of the commodity.
The main objective of Mexico’s central bank, also known as Banxico, is to maintain inflation at low and stable levels (at or close to its target of 3%, the midpoint in a tolerance band of between 2% and 4%). To this end, the bank sets an appropriate level of interest rates. When inflation is too high, Banxico will attempt to tame it by raising interest rates, making it more expensive for households and businesses to borrow money, thus cooling demand and the overall economy. Higher interest rates are generally positive for the Mexican Peso (MXN) as they lead to higher yields, making the country a more attractive place for investors. On the contrary, lower interest rates tend to weaken MXN.
Macroeconomic data releases are key to assess the state of the economy and can have an impact on the Mexican Peso (MXN) valuation. A strong Mexican economy, based on high economic growth, low unemployment and high confidence is good for MXN. Not only does it attract more foreign investment but it may encourage the Bank of Mexico (Banxico) to increase interest rates, particularly if this strength comes together with elevated inflation. However, if economic data is weak, MXN is likely to depreciate.
As an emerging-market currency, the Mexican Peso (MXN) tends to strive during risk-on periods, or when investors perceive that broader market risks are low and thus are eager to engage with investments that carry a higher risk. Conversely, MXN tends to weaken at times of market turbulence or economic uncertainty as investors tend to sell higher-risk assets and flee to the more-stable safe havens.
- Canadian Dollar middles as investors await key Fed appearance.
- Canada PMI missed the mark, to little effect.
- US labor preview worrying bellwether for Friday NFP.
The Canadian Dollar (CAD) is largely flat on Wednesday as broader markets await a key appearance from the US Federal Reserve. Investors have broadly baked in a rate hold from the US central bank today, but markets are looking for a more solid policy guidance stance from the Fed as inflation continues to plague rate cut hopes.
Canada saw a minor tick down in its S&P Global Manufacturing Purchasing Managers Index early in the American trading session, but market momentum remains tepid. US data stands front and center in the midweek market session, with another US Nonfarm Payrolls (NFP) Friday looming at the end of the week.
Daily digest market movers: All eyes on the Fed
- Canada’s April Manufacturing PMI eased to 49.4 from the previous 49.8, missing the forecast improvement to 50.2.
- US ISM Manufacturing PMI also eased to 49.2 from the previous month’s 50.3, falling below the forecast 50.0.
- US ADP Employment Change for April came in at 192K, slightly down from the previous 208K (revised up from 184K), but beating the forecast 175K.
- Fed broadly expected to hold rates on Wednesday, but investors are hoping for signs the Fed will get pushed towards rates sooner rather than later.
- Employment figures could throw a wrench in rate cut hopes with Friday’s US NFP labor data wrapping up the trading week.
- US Interest Rate Decision: Fed set to keep policy steady as markets reassess timing of rate cuts
Canadian Dollar price today
The table below shows the percentage change of Canadian Dollar (CAD) against listed major currencies today. Canadian Dollar was the weakest against the New Zealand Dollar.
| USD | EUR | GBP | CAD | AUD | JPY | NZD | CHF | |
| USD | -0.08% | 0.08% | -0.08% | -0.23% | -0.05% | -0.33% | 0.05% | |
| EUR | 0.07% | 0.15% | 0.01% | -0.15% | 0.03% | -0.25% | 0.12% | |
| GBP | -0.08% | -0.15% | -0.16% | -0.30% | -0.13% | -0.41% | -0.03% | |
| CAD | 0.08% | -0.03% | 0.16% | -0.15% | 0.02% | -0.25% | 0.13% | |
| AUD | 0.23% | 0.14% | 0.30% | 0.14% | 0.16% | -0.10% | 0.27% | |
| JPY | 0.06% | -0.03% | 0.11% | -0.03% | -0.18% | -0.27% | 0.11% | |
| NZD | 0.33% | 0.25% | 0.40% | 0.25% | 0.10% | 0.28% | 0.37% | |
| CHF | -0.06% | -0.14% | 0.02% | -0.14% | -0.28% | -0.15% | -0.38% |
The heat map shows percentage changes of major currencies against each other. The base currency is picked from the left column, while the quote currency is picked from the top row. For example, if you pick the Euro from the left column and move along the horizontal line to the Japanese Yen, the percentage change displayed in the box will represent EUR (base)/JPY (quote).
Technical analysis: Canadian Dollar mixed as markets focus elsewhere
The Canadian Dollar (CAD) is trading tightly on Wednesday, gaining around a tenth of a percent against the US Dollar (USD) ahead of the latest Fed appearance. The CAD is down a quarter of a percent against the New Zealand Dollar (NZD), early Wednesday’s best-performing currency.
USD/CAD is down slightly from a near-term high around 1.3780, with an immediate technical floor at the 1.3700 handle. The 200-hour Exponential Moving Average (EMA) also provides topside technical support from 1.3707.
USD/CAD remains on the bullish side of the chart despite near-term pullbacks from the last swing high into 1.3850, with the pair trading on the high side of the 200-day EMA at 1.3533. The USD is up 4.4% against the CAD from the December swing low into 1.3175.
USD/CAD hourly chart
USD/CAD daily chart
Canadian Dollar FAQs
The key factors driving the Canadian Dollar (CAD) are the level of interest rates set by the Bank of Canada (BoC), the price of Oil, Canada’s largest export, the health of its economy, inflation and the Trade Balance, which is the difference between the value of Canada’s exports versus its imports. Other factors include market sentiment – whether investors are taking on more risky assets (risk-on) or seeking safe-havens (risk-off) – with risk-on being CAD-positive. As its largest trading partner, the health of the US economy is also a key factor influencing the Canadian Dollar.
The Bank of Canada (BoC) has a significant influence on the Canadian Dollar by setting the level of interest rates that banks can lend to one another. This influences the level of interest rates for everyone. The main goal of the BoC is to maintain inflation at 1-3% by adjusting interest rates up or down. Relatively higher interest rates tend to be positive for the CAD. The Bank of Canada can also use quantitative easing and tightening to influence credit conditions, with the former CAD-negative and the latter CAD-positive.
The price of Oil is a key factor impacting the value of the Canadian Dollar. Petroleum is Canada’s biggest export, so Oil price tends to have an immediate impact on the CAD value. Generally, if Oil price rises CAD also goes up, as aggregate demand for the currency increases. The opposite is the case if the price of Oil falls. Higher Oil prices also tend to result in a greater likelihood of a positive Trade Balance, which is also supportive of the CAD.
While inflation had always traditionally been thought of as a negative factor for a currency since it lowers the value of money, the opposite has actually been the case in modern times with the relaxation of cross-border capital controls. Higher inflation tends to lead central banks to put up interest rates which attracts more capital inflows from global investors seeking a lucrative place to keep their money. This increases demand for the local currency, which in Canada’s case is the Canadian Dollar.
Macroeconomic data releases gauge the health of the economy and can have an impact on the Canadian Dollar. Indicators such as GDP, Manufacturing and Services PMIs, employment, and consumer sentiment surveys can all influence the direction of the CAD. A strong economy is good for the Canadian Dollar. Not only does it attract more foreign investment but it may encourage the Bank of Canada to put up interest rates, leading to a stronger currency. If economic data is weak, however, the CAD is likely to fall.
- Markets foresee a hawkish hold stance by the FOMC, influencing the DXY Index in the upcoming sessions.
- US Job Openings and ISM PMI figures reported on Wednesday came in weak.
- The session highlight will be Fed Chair Jerome Powell’s presser.
The US Dollar Index (DXY) is trading mildly lower on the day at 106.2 ahead of the highly-anticipated Federal Open Market Committee (FOMC) monetary policy decision. Markets are betting on a hawkish hold stance from the Federal Reserve (Fed), which could make investors adjust their expectations on interest rates. Earlier in the session, mixed data pushed the index down.
Overall, the US economy exhibits robust growth and persistent inflation, putting upward pressure on US yields, which acted as a tailwind for the Greenback in the last sessions. A hawkish Fed has created a favorable environment for the Dollar due to policy divergences against its peers.
Daily digest market movers: DXY mildly down as markets digest mid-tier data
- The US Bureau of Labor Statistics (BLS) announced the number of job openings on the last working day of March to be 8.488M, below the anticipated 8.690M mark.
- The US Manufacturing sector showed signs of contraction in April per the Institute for Supply Management (ISM) Manufacturing Purchasing Managers Index (PMI), registering a decline from the previous month.
- According to Automatic Data Processing (ADP), private sector jobs in the US increased by 192K in April, slightly surpassing the projected increase of 175K jobs.
- Although ADPreading surpassed expectations, was lower than March's 208K job gain, indicating a potential slowdown in employment growth.
- Regarding expectations for the next Fed meetings, the odds of a cut in June fell below 10%, dipped below 25% in July, and reduced to less than 55% in September.
- US Treasury bond yields are declining, with the 2-year yield at 5.01%, the 5-year yield at 4.70%, and the 10-year yield at 4.65%.
DXY technical analysis: DXY outlook remains neutral as markets await directions
The indicators on the DXY daily chart reflect conflicting signals. The Relative Strength Index (RSI), which is in positive territory, has a negative slope suggesting downward price momentum. The Moving Average Convergence Divergence (MACD) indicator, though showing flat red bars, is also indicating sell signals representing potential bearish sentiment.
However, this potential selling momentum has not yet translated into a definitive price trend, possibly due to market participants awaiting clearer directions. Yet, the fact that the US Dollar Index is comfortably situated above its 20, 100, and 200-day Simple Moving Averages (SMAs) signals that upward pressure is still in play, pointing toward a continued presence of buyers in the market.
US Dollar FAQs
The US Dollar (USD) is the official currency of the United States of America, and the ‘de facto’ currency of a significant number of other countries where it is found in circulation alongside local notes. It is the most heavily traded currency in the world, accounting for over 88% of all global foreign exchange turnover, or an average of $6.6 trillion in transactions per day, according to data from 2022. Following the second world war, the USD took over from the British Pound as the world’s reserve currency. For most of its history, the US Dollar was backed by Gold, until the Bretton Woods Agreement in 1971 when the Gold Standard went away.
The most important single factor impacting on the value of the US Dollar is monetary policy, which is shaped by the Federal Reserve (Fed). The Fed has two mandates: to achieve price stability (control inflation) and foster full employment. Its primary tool to achieve these two goals is by adjusting interest rates. When prices are rising too quickly and inflation is above the Fed’s 2% target, the Fed will raise rates, which helps the USD value. When inflation falls below 2% or the Unemployment Rate is too high, the Fed may lower interest rates, which weighs on the Greenback.
In extreme situations, the Federal Reserve can also print more Dollars and enact quantitative easing (QE). QE is the process by which the Fed substantially increases the flow of credit in a stuck financial system. It is a non-standard policy measure used when credit has dried up because banks will not lend to each other (out of the fear of counterparty default). It is a last resort when simply lowering interest rates is unlikely to achieve the necessary result. It was the Fed’s weapon of choice to combat the credit crunch that occurred during the Great Financial Crisis in 2008. It involves the Fed printing more Dollars and using them to buy US government bonds predominantly from financial institutions. QE usually leads to a weaker US Dollar.
Quantitative tightening (QT) is the reverse process whereby the Federal Reserve stops buying bonds from financial institutions and does not reinvest the principal from the bonds it holds maturing in new purchases. It is usually positive for the US Dollar.
- Labor data from April from the US came in mixed and ISM PMIs disappointed.
- The FOMC is anticipated to deliver a hawkish hold, setting a vital economic direction for markets.
- In case the Fed shows itself hawkish, the markets could adjust its expectations further, fuelling additional gains to the USD.
The EUR/USD pair is trading mildly higher at 1.0682, with a daily variation of 0.12% on Wednesday’s session. The US reported soft ISM PMIs and Job Openings figures which seem to be weighing on the Greenback. However, the short-term direction of the pair will be dictated by the Federal Reserve (Fed) decision and messaging later in the session.
The latest data from the US Bureau of Labor Statistics revealed a decrease in Job Openings. In the last business day of March, openings dropped to 8.488M, down from March's revised figure of 8.813M and below the anticipated 8.680 M. Meanwhile, the US manufacturing sector experienced a decline in April, with the ISM Manufacturing PMI falling to 49.2 from 50.3 in March, missing the expected mark of 50.0, indicating a contraction in business activity.
On the positive side, private sector employment showed growth, according to data released by Automatic Data Processing. In April, the sector added 192K jobs, surpassing the forecast of 175K but still below March's revised increase of 208K jobs.
Regarding the Federal Reserve, it is anticipated to maintain a hawkish acknowledging persistent inflation and strong economic indicators. In addition, despite not updating its macroeconomic projections until June, the Fed is expected to point out recent deteriorations in the inflation outlook. Chair Powell's press conference will be crucial, with the potential to drop earlier guidance on easing, signaling a more cautious approach to monetary policy adjustments. Market expectations have shifted, significantly reducing the likelihood of rate cuts in the near future, and pushing the start of the easing cycle towards September of 2024.
EUR/USD technical analysis
On the daily chart, the Relative Strength Index (RSI) stands in negative territory with a recent reading of 44 indicating sustained bearish momentum. This coincides with the bearish atmosphere observed in the past sessions since early April, where all readings remained within the negative territory, none reaching passing above 50, signifying ongoing sellers' dominance in the market. That being said, the Moving Average Convergence Divergence (MACD) shows positive momentum, displaying green bars that currently remain flat which points out that there is some buying action.
However, the EUR/USD is trading below its 20, 100, and 200-day SMA. This implies sustained short-term, intermediate, and long-term selling pressure and as long as the buyers keep the pair below this level the outlook will be bearish.
EUR/USD daily chart
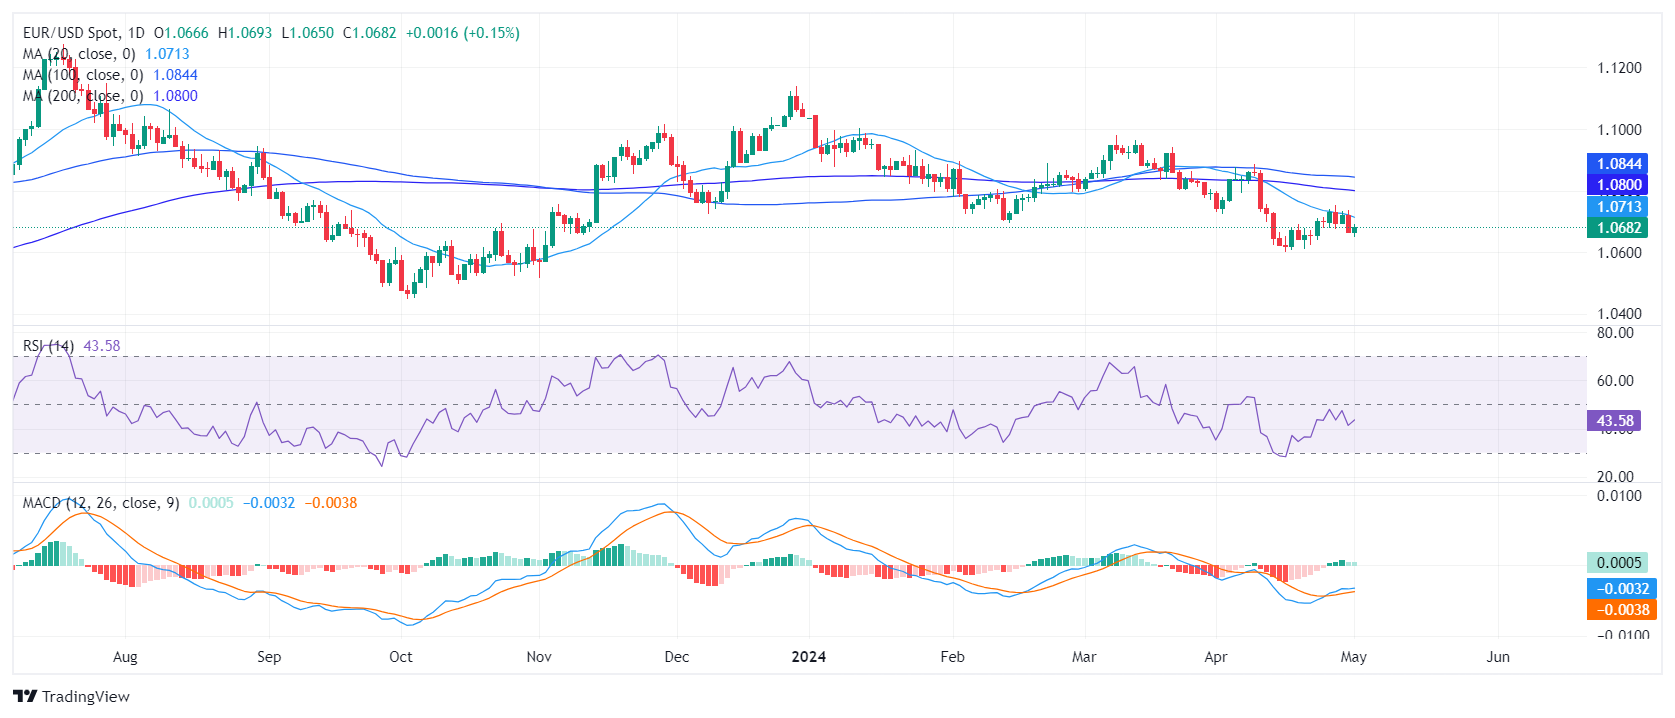
- GBP/USD remains steady, slightly down by 0.05% following mixed US PMI data from S&P Global and ISM.
- The two-candle chart pattern, the bearish harami suggests further downside is seen.
- Key support levels lie at the April 29 low of 1.2474 could lead to retesting the yearly low at 1.2299.
The Pound Sterling is virtually unchanged against the US Dollar following the release of mixed Purchasing Managers Index (PMI) data from S&P Global and the Institute for Supply Management (ISM). The data showed that the economy is slowing down, amid higher interest rates set by the Federal Reserve. The GBP/USD seesaws around 1.2486, down 0.05%.
GBP/USD Price Analysis: Technical outlook
The GBP/USD remains downward biased despite registering an upward impulse that lifted the exchange rate from yearly lows of 1.2299 to April’s high of 1.2569. the advance was capped by strong resistance provided by the 200-day moving average (DMA) at 1.2552, triggering a two-candle bearish formation – bearish harami. This pattern needs a confirmation past the April 29 low of 1.2474, which would exacerbate a test of the latest swing low of 1.2299.
On the other hand, if buyers achieve a daily close above 1.2500, subsequent gains are seen if they challenge the 200-DMA. Once surpassed, the next stop would be the 1.2600 mark.
GBP/USD Price Action – Daily Chart
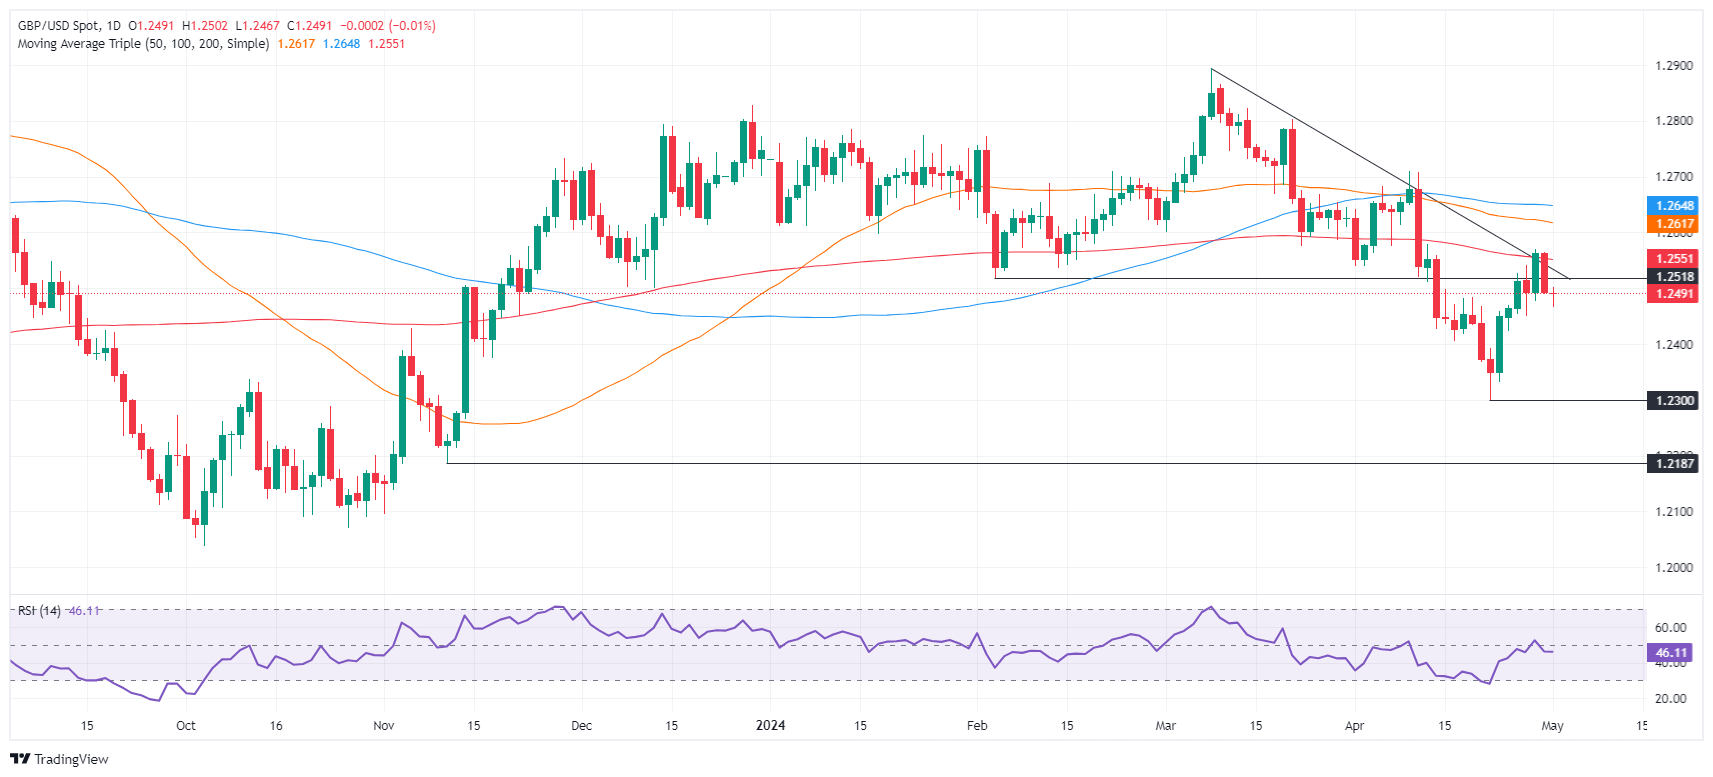
- Silver price rebounds sharply from $26.30 as US Manufacturing PMI contracted in April.
- The speculation for Fed’s hawkish interest rate outlook remains firm as Manufacturing Price Paid rise above 60.0.
- Investors await the Fed’s policy decision for meaningful guidance.
Silver price (XAG/USD) recovers strongly from four-month low of $26.30 as the United States Institute of Supply Management (ISM) has reported a weak Manufacturing PMI report for April. The ISM reported that the Manufacturing PMI falls sharply to 49.2 from the consensus of 50.0 and the prior reading of 50.3. The factory data remained below the 50.0 threshold, which itself is a sign of contraction.
New Order Inflows drop significantly to 49.1 from 51.4 in March, suggesting a weak demand outlook, which could be considered as the consequence of higher interest rates by the Federal Reserve (Fed).
Despite a sharp decline in the Manufacturing PMI, the Fed is expected to support the “higher for longer interest rates” argument as Manufacturing Price Paid rose significantly to 60.9 from the estimates of 55.0. Higher Manufacturing Prices Paid are generally driven by an increase in input prices and wages paid to workers, which suggests stubborn price pressures.
Weak Manufacturing PMI has weighed on the US Dollar. The US Dollar Index (DXY) edges down from fresh three-week high of 106.50.
Meanwhile, the major event for investors will be the interest rate decision by the Federal Reserve, which will be announced at 18:00 GMT. Investors see the Fed holding interest rates steady in the range of 5.25%-5.50% for the sixth time in a row. As the Fed is widely anticipated to maintain the status quo, investors will keenly focus on the interest rate guidance.
The CME FedWatch tool shows that policymakers will favor unwinding the restrictive monetary policy framework from the September meeting. Therefore, the Fed will maintain a hawkish stance on interest rates in the near-term. Investors would keenly focus on whether the Fed will remain committed to its three-rate cut projections for this year, indicated by Marchs dot plot.
Silver technical analysis
Silver price declines toward the horizontal support plotted from 14 April 2023 high around $26.09 on a daily timeframe. The above-mentioned support was earlier a major resistance for the Silver price bulls. The uncertainty over Silver’s near-term outlook deepens as it has slipped below the 20-period Exponential Moving Average (EMA), which trades around $27.20.
The 14-period Relative Strength Index (RSI) slips into the 40.00-60.00, suggesting the bullish momentum has faded. However, the long-term outlook is still stable.
Silver daily chart
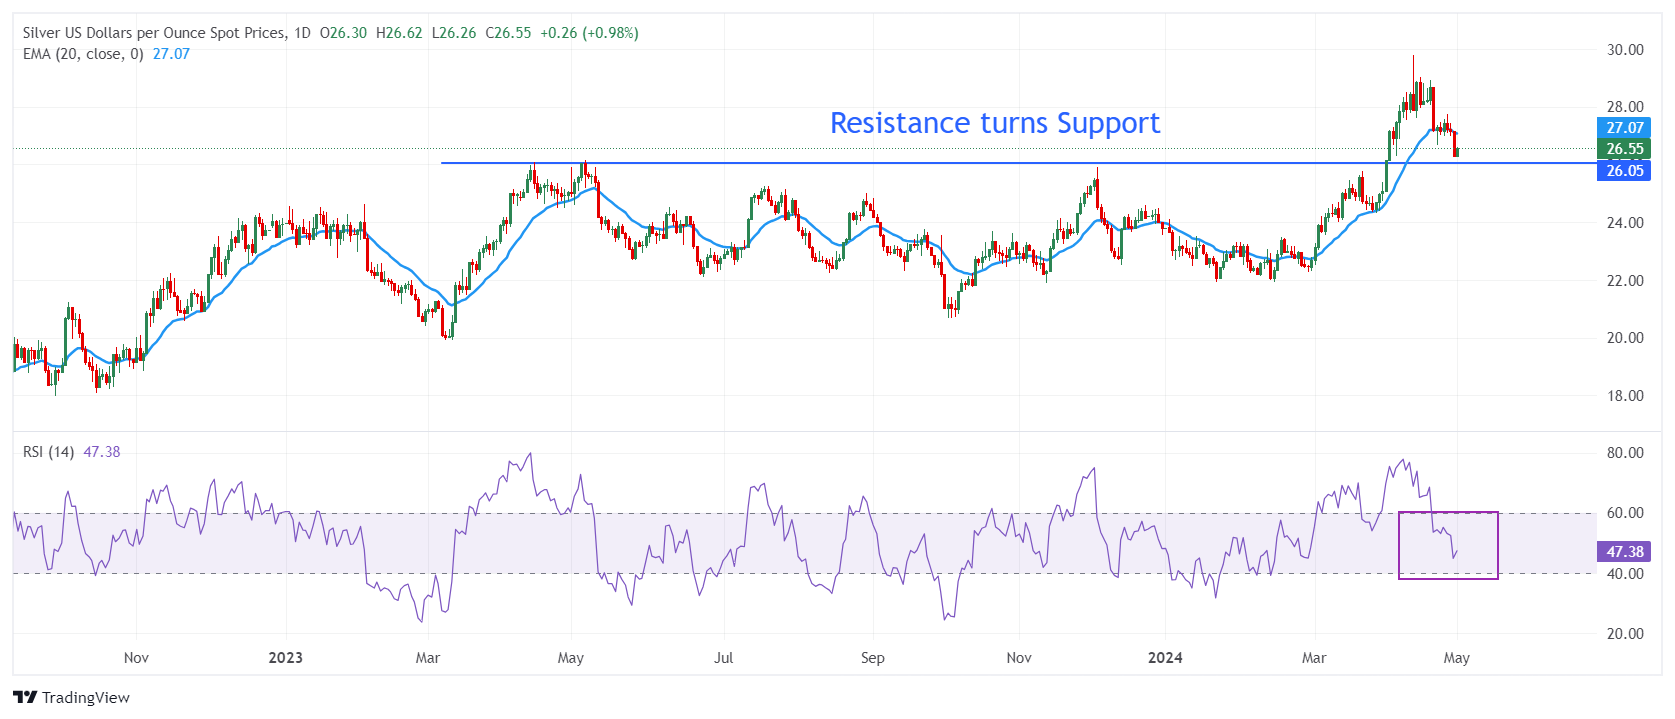
The US Bureau of Labor Statistics (BLS) revealed in its Job Openings and Labor Turnover Survey (JOLTS) on Wednesday that on the final business day of March, the number of job openings reached 8.488 million. This figure was 325K below March's revised count of 8.813 million (previously reported as 8.756 million) and came in short of market's expectation of 8.680 million.

According to the press release, "In March, the number of hires was little changed at 5.5 million but was down by 455,000 over the year. The rate, at 3.5 percent, changed little in March."
Market reaction to JOLTS Job Openings data
The US Dollar (USD) Index extended its daily corrective decline and approaches the 106.00 support ahead of the FOMC gathering.
- ISM Manufacturing PMI fell into contraction territory in April.
- US Dollar Index fluctuates in its daily range above 106.00.
The business activity in the US manufacturing sector contracted in April, with the ISM Manufacturing PMI dropping to 49.2 from 50.3 in March. This reading came in below the market expectation of 50.0.
The Employment Index of the PMI survey improved to 48.6 from 47.4 in the same period, while the New Orders Index fell to 49.1 from 51.4. Finally, the Prices Paid Index, the inflation component, rose sharply to 60.9 from 55.8.
Commenting on the survey's findings, "the US manufacturing sector dropped back into contraction after growing in March, the first time since September 2022 that the sector reported expansion," said Timothy R. Fiore, Chair of the Institute for Supply Management (ISM) Manufacturing Business Survey Committee.
"The Prices Index moved further upward into strong expansion (or ‘increasing’) territory, as commodity driven costs continue to climb. Imports continued to grow, at a slower rate in April," Fiore added.
Market reaction
This report doesn't seem to be having a significant impact on the US Dollar's (USD) valuation. At the time of press, the USD Index was down 0.08% on the day at 106.20.
- EUR/USD finds a temporary support near 1.0650 though dismal market sentiment keeps the downside bias intact.
- Uncertainty ahead of the Fed’s policy has dampened the appeal of risk-sensitive assets.
- The ECB is widely anticipated to begin reducing interest rates from June.
The EUR/USD pair finds a provisional support near 1.0650 in Wednesday’s European session. The near-term outlook for the major currency pair remains bearish as investors are cautious ahead of the Federal Reserve’s (Fed) monetary policy announcement at 18:00 GMT.
Investors see the Fed keeping interest rates steady in the range of 5.25%-5.50% as inflationary pressures are significantly higher than the desired rate of 2%. Therefore, rate cuts at this stage could revamp price pressures again.
The Fed is expected to endorse a restrictive interest rate policy for longer due to a slew of hotter-than-expected inflation readings in the January-March period. The Q1 Employment Cost Index released on Tuesday was also stronger than consensus, deepened fears of inflation remaining persistent ahead. The index rose strongly by 1.2% in comparison with the estimates of 1.0% and the prior reading of 0.9%.
Meanwhile, the market sentiment is extremely cautious ahead of Fed’s policy meeting. S&P 500 futures have posted significant losses in the London session, exhibiting a sharp decline in the risk-appetite of the market participants. 10-year US Treasury yields rise to 4.69% on expectations of a hawkish guidance from the Fed. The US Dollar Index (DXY), which tracks the US Dollar’s value against six major currencies rose to 106.35.
On the Eurozone front, the long-term outlook of the Euro is vulnerable as investors see the European Central Bank (ECB) starting to reduce interest rates from the June meeting. On Tuesday, ECB policymaker Pablo Hernandez de Cos supported for ECB pivoting to interest rate cuts from June if inflation continues to decline gradually. ECB Cos advised that the central bank should not commit a specific rate path and should use a data-dependent approach.
- NZD/USD recovers intraday losses but uncertainty remains with eyes on Fed’s policy announcement.
- The Fed may emphasize maintaining interest rates higher for a longer period.
- NZ Q1 wage growth rose expectedly while labor demand weakens.
The NZD/USD pair trades close to a nine-day low slightly below the round-level resistance of 0.5900 in Wednesday’s European session. The Kiwi asset recovers early losses in the aftermath of New Zealand Q1 Employment data.
The NZ labor market data showed that quarterly and annual Labor Cost Index grew in line with the consensus of 0.8% and 3.8%, respectively. This will deepen fears of NZ interest rates remaining higher for a longer period as high wage growth fuels inflationary pressures.
The labor demand was weaker than expected as Employment Change fell by 0.2% while investors forecasted the labor market to grow by 0.3%. The Unemployment Rate rose to 4.3% from the estimates of 4.2% and the prior reading of 4.0%.
Going forward, the Kiwi asset will dance to the tunes of the Federal Reserve’s (Fed) interest rate decision, which will be announced at 18:00 GMT. The Fed is expected to hold interest rates steady in the range of 5.25%-5.50% with a hawkish guidance as inflation has remained higher-than-expected in the first quarter this year. This has strengthened the US Dollar’s appeal. The US Dollar Index (DXY), which tracks the Greenback’s value against six major currencies, rose to 106.35.
NZD/USD trades in a downward-sloping channel on a four-hour timeframe. This a bearish pattern in which each pullback move is considered as a selling opportunity by the market participants. The near-term appeal is bearish as the asset is trading below the 20-period Exponential Moving Average (EMA), which trades around 0.5924.
The 14-period Relative Strength Index (RSI) oscillates in the bearish range of 20.00-40.00, suggesting that momentum has leaned towards bears.
Fresh downside would appear if the asset breaks below April 16 low at 0.5860. This would drag the asset toward 8 September 2023 low at 0.5847, followed by the round-level support of 0.5900.
On the contrary, an upside above the psychological resistance of 0.6000 will drive the asset towards April 4 high around 0.6050 and the round-level resistance of 0.6100.
NZD/USD four-hour chart
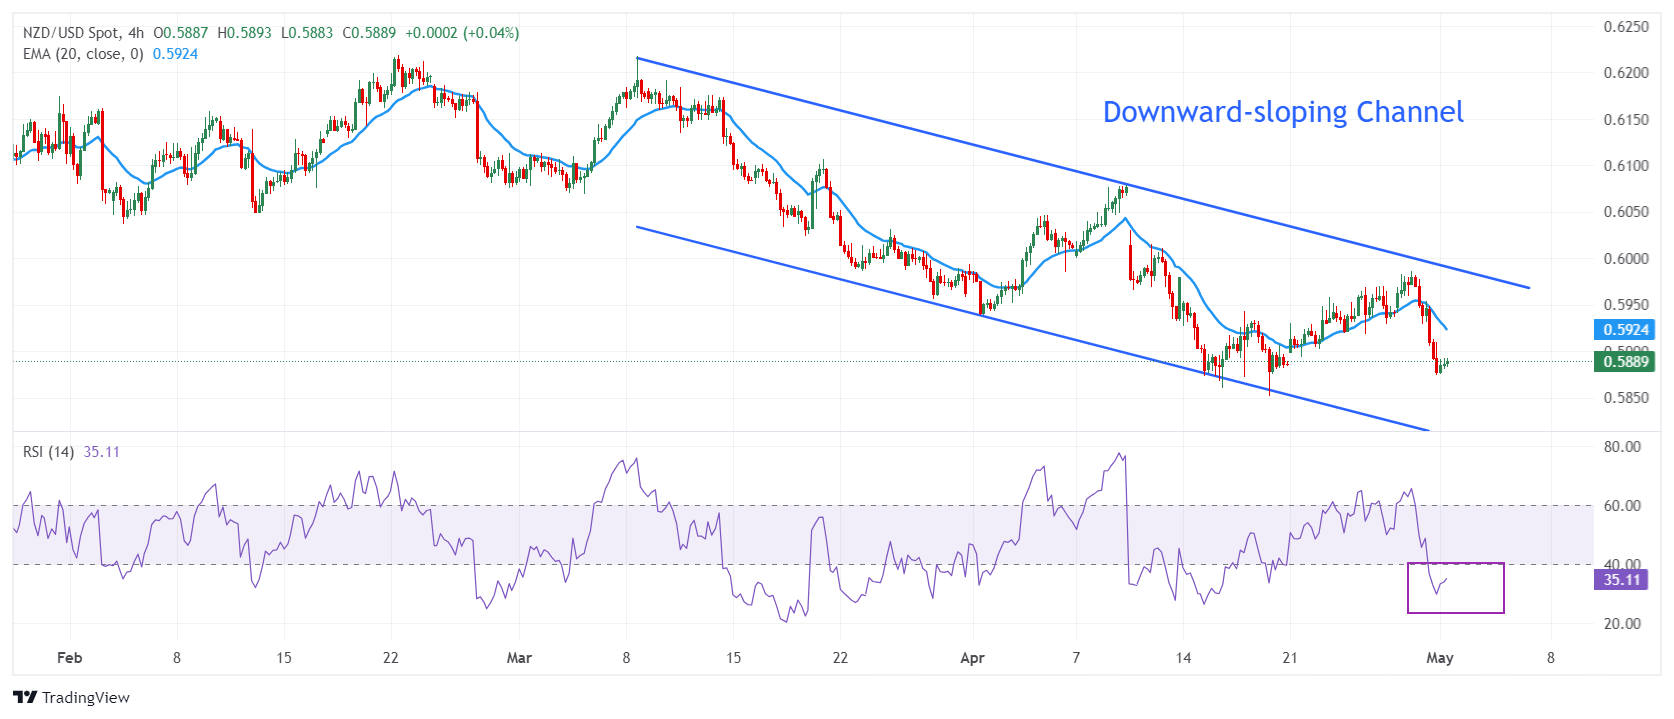
- The Federal Reserve is widely anticipated to keep interest rates unchanged.
- Fed Chairman Powell’s remarks could provide important clues about the timing of the policy pivot.
- Markets see a strong chance that the Fed will wait until September to lower the interest rate.
The US Federal Reserve (Fed) will announce monetary policy decisions following the April 30 - May 1 policy meeting on Wednesday. Market participants widely anticipate that the US central bank will leave the policy rate unchanged at 5.25%-5.5% for the sixth consecutive meeting.
The CME FedWatch Tool shows that markets see little to no chance of a rate cut in June. Hence, investors will scrutinize the changes in the statement language and comments from Fed Chairman Jerome Powell to figure out the timing of the policy pivot. According to the FedWatch Tool, there is a 30% and a 60% probability of the Fed lowering the policy rate in July or in September, respectively.
At the end of 2023, markets were expecting the Fed to cut the policy rate as early as March. Strong employment and growth figures in the first quarter of 2024, accompanied by data showing a lack of progress in disinflation, caused investors to shift their forecasts toward a policy pivot in the second half of the year.
Macroeconomic data releases since the December policy meeting showed that consumer and producer inflation started to edge higher in the first couple of months of the year. Additionally, the labor market remained relatively healthy while activity-related data, such as the forward-looking PMI surveys, suggested that the US is very likely to avoid a recession.
Previewing the Federal Open Market Committee (FOMC) meeting, “the FOMC is widely expected to keep the Fed funds target range unchanged at 5.25%-5.50% next week, with Chair Powell likely sounding more cautious than usual, with a hawkish bent, amid firmer than expected inflation data,” said TD Securities analysts.
"Higher for longer will likely remain the name of the game for now. We also expect the Fed to announce a preliminary plan to taper QT starting in June”, they added.
When will the Fed announce its interest rate decision and how could it affect EUR/USD?
The US Federal Reserve is scheduled to announce its interest rate decision and publish the monetary policy statement at 18:00 GMT. This will be followed by Chairman Powell's press conference starting at 18:30 GMT.
In his last public appearance, Chairman Powell noted that the performance of the US economy has been quite strong and said that the restrictive policy needs more time to work. Regarding the strong inflation readings, “the Fed took a cautious approach to not overreacting to declines last year; recent data have not given greater confidence,” he said.
In case Powell confirms that there won’t be a rate cut in June, the positioning suggests that the impact on the US Dollar (USD) is unlikely to last, with the CME FedWatch Tool showing markets already pricing in a nearly 90% probability of a policy hold. Following the March policy meeting, Powell argued that seasonal factors could be behind strong inflation figures seen at the beginning of the year, adding January and February together have not changed the overall story. If he adopts a more cautious tone regarding the inflation outlook and suggests they are still far from considering interest rate cuts, the initial reaction could help the USD gather strength against its rivals.
On the other hand, the USD could lose interest if Powell acknowledges the negative impact of tight policy on economic activity by signaling the disappointing 1.6% annualized Gross Domestic Product (GDP) growth recorded in the first quarter of the year. If Powell alludes to September as the possible timing of the policy pivot, the US Treasury bond yields could turn south and drag the USD lower.
Commenting on the Fed’s policy decisions’ potential impact on the USD’s valuation, “this week’s FOMC meeting should see a hawkish hold. In addition, the ongoing backdrop of persistent inflation and robust growth in the US should keep upward pressure on US yields, which in turn would be supportive of the Dollar,” said BBH analysts. “We believe that while market easing expectations have adjusted violently this month, there is still room to go. When the market finally capitulates on the Fed, the dollar should gain further”, they added.
Eren Sengezer, European Session Lead Analyst at FXStreet, provides a short-term technical outlook for EUR/USD:
“The Relative Strength Index (RSI) on the daily chart stays slightly below 50 despite the recovery seen in the last two weeks, suggesting that EUR/USD is yet to signal a bullish reversal. On the upside, the 200-day Simple Moving Average (SMA) aligns as key resistance at 1.0800. If the pair rises above that level and starts using it as support, it could target 1.0840 - 1.0860 (100-day SMA, Fibonacci 38.2% retracement of the October-January uptrend) and 1.0950 (Fibonacci 23.6% retracement).”
“Strong support is located at 1.0600 (Fibonacci 78.6% retracement) before 1.0500 (psychological level, static level) and 1.0450 (beginning point of the uptrend).”
Fed FAQs
Monetary policy in the US is shaped by the Federal Reserve (Fed). The Fed has two mandates: to achieve price stability and foster full employment. Its primary tool to achieve these goals is by adjusting interest rates. When prices are rising too quickly and inflation is above the Fed’s 2% target, it raises interest rates, increasing borrowing costs throughout the economy. This results in a stronger US Dollar (USD) as it makes the US a more attractive place for international investors to park their money. When inflation falls below 2% or the Unemployment Rate is too high, the Fed may lower interest rates to encourage borrowing, which weighs on the Greenback.
The Federal Reserve (Fed) holds eight policy meetings a year, where the Federal Open Market Committee (FOMC) assesses economic conditions and makes monetary policy decisions. The FOMC is attended by twelve Fed officials – the seven members of the Board of Governors, the president of the Federal Reserve Bank of New York, and four of the remaining eleven regional Reserve Bank presidents, who serve one-year terms on a rotating basis.
In extreme situations, the Federal Reserve may resort to a policy named Quantitative Easing (QE). QE is the process by which the Fed substantially increases the flow of credit in a stuck financial system. It is a non-standard policy measure used during crises or when inflation is extremely low. It was the Fed’s weapon of choice during the Great Financial Crisis in 2008. It involves the Fed printing more Dollars and using them to buy high grade bonds from financial institutions. QE usually weakens the US Dollar.
Quantitative tightening (QT) is the reverse process of QE, whereby the Federal Reserve stops buying bonds from financial institutions and does not reinvest the principal from the bonds it holds maturing, to purchase new bonds. It is usually positive for the value of the US Dollar.
- Gold price hovers below $2,300 as uncertainty ahead of the Fed’s policy announcements improves the appeal of the US Dollar and bond yields.
- The Fed is expected to support keeping interest rates at their current levels for a longer period.
- The strong US Q1 Employment Cost Index adds to evidence of the stubborn inflation outlook.
Gold price (XAU/USD) trades close to a more than three-week low around $2,285 in Wednesday’s European session. The precious metal weakens as the US Dollar and bond yields strengthen amid firm speculation that the Federal Reserve (Fed) will opt for maintaining a restrictive interest rate environment for a longer period due to inflation remaining persistently higher than expected in the first quarter of the year.
In this context, 10-year US Treasury yields move higher to 4.69%. The US Dollar Index (DXY), which tracks the US Dollar’s value against six major currencies and is negatively correlated to the Gold price, jumps to a two-week high of around 106.50. The US Dollar remained on the backfoot last week after weak growth in Q1 Gross Domestic Product (GDP) raised concerns over the country’s economic outlook. However, it bounced back strongly on Tuesday after the US Bureau of Economic Analysis (BEA) reported strong Q1 Employment Cost Index numbers.
The US Employment Cost Index is generally driven by a strong wage growth environment in which labor demand remains strong. The index rose by 1.2% in the first quarter, against the consensus of 1.0% and the prior reading of 0.9%. It is another indication that price pressures have remained hot in the January-March period.
Daily digest market movers: Gold price weakens while US Dollar hovers near almost four-week high
- Gold price falls sharply, below the crucial support of $2,285, on expectations that the Federal Reserve will maintain a hawkish guidance on interest rates in its monetary policy meeting after keeping interest rates steady in the range of 5.25%-5.50% for the sixth straight time.
- A slew of hotter-than-expected inflation readings so far this year indicate that the disinflation process has stalled. It suggests that the Fed should keep interest rates high for a longer period until policymakers gain confidence that price pressures will sustainably return to the desired rate of 2%.
- Prospects of interest rates remaining higher bode poorly for Gold as it increases the opportunity cost of holding an investment in it. Meanwhile, investors are keen to know about rate-cut timing and the current status of the Fed’s three rate-cut projections, indicated by March’s dot plot. The CME FedWatch tool shows that traders see the Fed begin reducing interest rates from the September meeting.
- In Wednesday’s session, before the Fed’s interest rate decision, ADP Employment Change and the ISM Manufacturing PMI data for April will be published in the early New York session. Economists have forecasted that fresh US private payrolls increased by 175K, slightly lower than the prior advance of 184K. The Manufacturing PMI is estimated to have dropped to 50.0 from 50.3 in March.
- From the Manufacturing PMI report, investors will keenly focus on the New Orders subcomponent. The preliminary PMI survey by S&P Global for April reported that output growth cooled in line with demand weakness as new orders decreased for the first time in six months, albeit dropping only modestly. Falling new business was signalled among manufacturers and service providers alike. Upbeat employment and factory data would improve the US economic outlook, while weak numbers will deepen concerns over a slowdown.
Technical Analysis: Gold price slips below $2,300
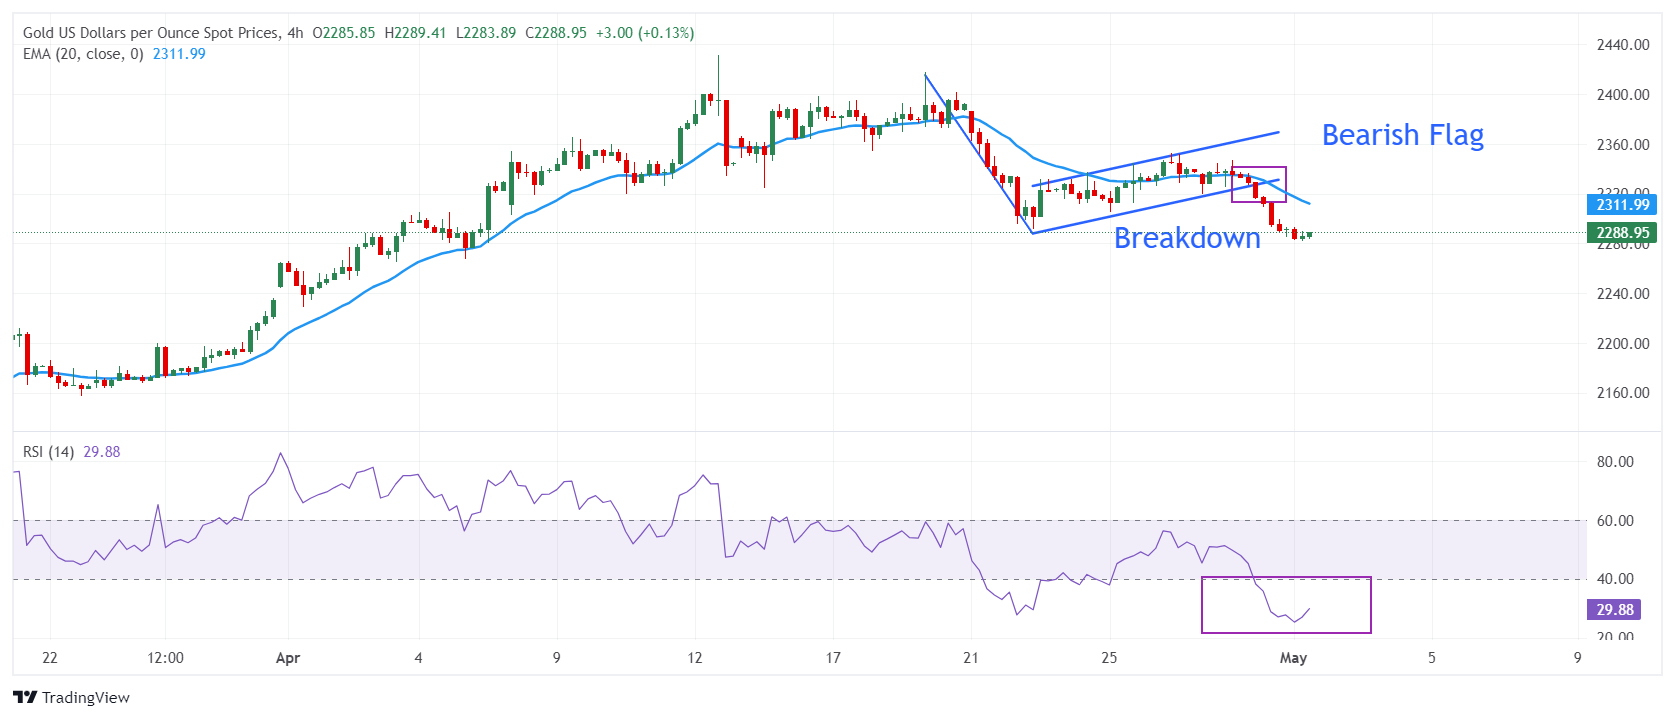
Gold reported steep losses after a breakdown of the Bearish Flag formation in the four-hour time frame. The Bearish Flag formation demonstrates a consolidation move after a sharp correction, generally following the ongoing trend. The near-term outlook is bearish as the Gold price is trading below the 20-period Exponential Moving Average (EMA), which is at $2,312.
On the downside, March 23 high at $2,223 will be the major support for the Gold price. The 14-period Relative Strength Index (RSI) oscillates in the bearish range of 20.00-40.00, suggesting that momentum has leaned towards bears.
Gold FAQs
Gold has played a key role in human’s history as it has been widely used as a store of value and medium of exchange. Currently, apart from its shine and usage for jewelry, the precious metal is widely seen as a safe-haven asset, meaning that it is considered a good investment during turbulent times. Gold is also widely seen as a hedge against inflation and against depreciating currencies as it doesn’t rely on any specific issuer or government.
Central banks are the biggest Gold holders. In their aim to support their currencies in turbulent times, central banks tend to diversify their reserves and buy Gold to improve the perceived strength of the economy and the currency. High Gold reserves can be a source of trust for a country’s solvency. Central banks added 1,136 tonnes of Gold worth around $70 billion to their reserves in 2022, according to data from the World Gold Council. This is the highest yearly purchase since records began. Central banks from emerging economies such as China, India and Turkey are quickly increasing their Gold reserves.
Gold has an inverse correlation with the US Dollar and US Treasuries, which are both major reserve and safe-haven assets. When the Dollar depreciates, Gold tends to rise, enabling investors and central banks to diversify their assets in turbulent times. Gold is also inversely correlated with risk assets. A rally in the stock market tends to weaken Gold price, while sell-offs in riskier markets tend to favor the precious metal.
The price can move due to a wide range of factors. Geopolitical instability or fears of a deep recession can quickly make Gold price escalate due to its safe-haven status. As a yield-less asset, Gold tends to rise with lower interest rates, while higher cost of money usually weighs down on the yellow metal. Still, most moves depend on how the US Dollar (USD) behaves as the asset is priced in dollars (XAU/USD). A strong Dollar tends to keep the price of Gold controlled, whereas a weaker Dollar is likely to push Gold prices up.
Silver prices (XAG/USD) rose on Wednesday, according to FXStreet data. Silver trades at $26.38 per troy ounce, up 0.32% from the $26.30 it cost on Tuesday.
Silver prices have increased by 3.57% since the beginning of the year.
| Unit measure | Today Price |
|---|---|
| Silver price per troy ounce | $26.38 |
| Silver price per gram | $0.85 |
The Gold/Silver ratio, which shows the number of troy ounces of Silver needed to equal the value of one troy ounce of Gold, stood at 86.59 on Wednesday, down from 86.93 on Tuesday.
Investors might use this ratio to determine the relative valuation of Gold and Silver. Some may consider a high ratio as an indicator that Silver is undervalued – or Gold is overvalued – and might buy Silver or sell Gold accordingly. Conversely, a low ratio might suggest that Gold is undervalued relative to Silver.
Silver FAQs
Silver is a precious metal highly traded among investors. It has been historically used as a store of value and a medium of exchange. Although less popular than Gold, traders may turn to Silver to diversify their investment portfolio, for its intrinsic value or as a potential hedge during high-inflation periods. Investors can buy physical Silver, in coins or in bars, or trade it through vehicles such as Exchange Traded Funds, which track its price on international markets.
Silver prices can move due to a wide range of factors. Geopolitical instability or fears of a deep recession can make Silver price escalate due to its safe-haven status, although to a lesser extent than Gold's. As a yieldless asset, Silver tends to rise with lower interest rates. Its moves also depend on how the US Dollar (USD) behaves as the asset is priced in dollars (XAG/USD). A strong Dollar tends to keep the price of Silver at bay, whereas a weaker Dollar is likely to propel prices up. Other factors such as investment demand, mining supply – Silver is much more abundant than Gold – and recycling rates can also affect prices.
Silver is widely used in industry, particularly in sectors such as electronics or solar energy, as it has one of the highest electric conductivity of all metals – more than Copper and Gold. A surge in demand can increase prices, while a decline tends to lower them. Dynamics in the US, Chinese and Indian economies can also contribute to price swings: for the US and particularly China, their big industrial sectors use Silver in various processes; in India, consumers’ demand for the precious metal for jewellery also plays a key role in setting prices.
Silver prices tend to follow Gold's moves. When Gold prices rise, Silver typically follows suit, as their status as safe-haven assets is similar. The Gold/Silver ratio, which shows the number of ounces of Silver needed to equal the value of one ounce of Gold, may help to determine the relative valuation between both metals. Some investors may consider a high ratio as an indicator that Silver is undervalued, or Gold is overvalued. On the contrary, a low ratio might suggest that Gold is undervalued relative to Silver.
Here is what you need to know on Wednesday, May 1:
The US Dollar (USD) preserves its strength on the first trading day of May as investors gear up for key data releases and the Federal Reserve's monetary policy decisions. The ADP will release the private sector employment report for April ahead of the US Bureau of Labor Statistics's JOLTS Job Openings data for March and the ISM Manufacturing PMI Survey for April. The Fed's policy announcement will be followed by Chairman Jerome Powell's press conference. European markets will remain closed in observance of the Labor Day holiday.
ADP Employment Change Preview: US private sector expected to add 179K new jobs in April.
The USD registered impressive gains against its major rivals on Tuesday, boosted by the latest data releases and safe-haven flows. The Employment Cost Index rose 1.2% in the first quarter of the year. This reading followed the 0.9% increase recorded in the previous quarter and came in above the market expectation of 1%. Meanwhile, Wall Street's main indexes suffered heavy losses on Tuesday, with the Nasdaq Composite Index falling nearly 2%. The USD Index rose over 0.6% on Tuesday and was last seen fluctuating in positive territory at around 106.50. In the meantime, the benchmark 10-year US Treasury bond yield stays near 4.7% after gaining more than 1% on Tuesday.
US Dollar price this week
The table below shows the percentage change of US Dollar (USD) against listed major currencies this week. US Dollar was the strongest against the New Zealand Dollar.
| USD | EUR | GBP | CAD | AUD | JPY | NZD | CHF | |
| USD | 0.44% | 0.21% | 0.87% | 1.03% | -0.21% | 1.04% | 0.84% | |
| EUR | -0.44% | -0.23% | 0.43% | 0.59% | -0.64% | 0.61% | 0.39% | |
| GBP | -0.20% | 0.23% | 0.66% | 0.82% | -0.41% | 0.83% | 0.63% | |
| CAD | -0.88% | -0.43% | -0.67% | 0.15% | -1.08% | 0.18% | -0.06% | |
| AUD | -1.02% | -0.58% | -0.81% | -0.15% | -1.22% | 0.03% | -0.19% | |
| JPY | 0.21% | 0.64% | 0.40% | 1.06% | 1.21% | 1.24% | 1.03% | |
| NZD | -1.07% | -0.59% | -0.85% | -0.18% | -0.03% | -1.27% | -0.23% | |
| CHF | -0.84% | -0.38% | -0.64% | 0.04% | 0.19% | -1.00% | 0.22% |
The heat map shows percentage changes of major currencies against each other. The base currency is picked from the left column, while the quote currency is picked from the top row. For example, if you pick the Euro from the left column and move along the horizontal line to the Japanese Yen, the percentage change displayed in the box will represent EUR (base)/JPY (quote).
After spending the first half of the day above 1.0700 on Tuesday, EUR/USD turned south in the American session and registered its lowest daily close in a week. The pair continues to edge lower early Wednesday and was last seen trading at around 1.0650.
GBP/USD came under bearish pressure and lost over 0.5% on Tuesday, erasing Monday's gains in the process. The pair struggles to stage a rebound in the European morning and trades in the red at around 1.2470.
The data from New Zealand showed that the Unemployment Rate climbed to 4.3% in the first quarter from 4%. The Employment Change for this period arrived at -0.2% following the 0.4% increase recorded in the last quarter of 2023. Pressured by the broad USD strength and disappointing data, NZD/USD lost 1.5% on Tuesday and was last seen trading below 0.5900.
USD/JPY posted strong gains on Tuesday and retraced a large portion of the decline that was triggered by Japan's suspected intervention in currency markets at the beginning of the week. At the time of press, the pair was trading in a tight channel slightly below 158.00.
Gold lost more 2% on Tuesday and dropped to its lowest level in over three weeks below $2,300. XAU/USD stays in a consolidation phase above $2,280 in the European morning.
Fed FAQs
Monetary policy in the US is shaped by the Federal Reserve (Fed). The Fed has two mandates: to achieve price stability and foster full employment. Its primary tool to achieve these goals is by adjusting interest rates. When prices are rising too quickly and inflation is above the Fed’s 2% target, it raises interest rates, increasing borrowing costs throughout the economy. This results in a stronger US Dollar (USD) as it makes the US a more attractive place for international investors to park their money. When inflation falls below 2% or the Unemployment Rate is too high, the Fed may lower interest rates to encourage borrowing, which weighs on the Greenback.
The Federal Reserve (Fed) holds eight policy meetings a year, where the Federal Open Market Committee (FOMC) assesses economic conditions and makes monetary policy decisions. The FOMC is attended by twelve Fed officials – the seven members of the Board of Governors, the president of the Federal Reserve Bank of New York, and four of the remaining eleven regional Reserve Bank presidents, who serve one-year terms on a rotating basis.
In extreme situations, the Federal Reserve may resort to a policy named Quantitative Easing (QE). QE is the process by which the Fed substantially increases the flow of credit in a stuck financial system. It is a non-standard policy measure used during crises or when inflation is extremely low. It was the Fed’s weapon of choice during the Great Financial Crisis in 2008. It involves the Fed printing more Dollars and using them to buy high grade bonds from financial institutions. QE usually weakens the US Dollar.
Quantitative tightening (QT) is the reverse process of QE, whereby the Federal Reserve stops buying bonds from financial institutions and does not reinvest the principal from the bonds it holds maturing, to purchase new bonds. It is usually positive for the value of the US Dollar.
- USD/CAD may continue to advance as technical analysis suggests a resurgence of bullish sentiment.
- A break above the 1.3800 level might propel the pair to revisit its five-month high of 1.3846.
- The pair could find support around the psychological level of 1.3700 and the 23.6% Fibonacci retracement level of 1.3688.
USD/CAD trades around 1.3780 during the early European hours on Wednesday, hovering within an ascending channel on the daily chart. The 14-day Relative Strength Index (RSI) also positioned above 50, indicating a resurgence of bullish sentiment.
Additionally, the Moving Average Convergence Divergence (MACD) line is above the centerline, suggesting bullish momentum, although it remains below the signal line. Traders might seek confirmation from the MACD, a lagging indicator, to validate the trend direction.
The USD/CAD pair could encounter resistance around the psychological level of 1.3800. If it surpasses this level, it may revisit its five-month high of 1.3846, followed by the upper boundary of the ascending channel near 1.3899, the highest level not seen since November.
Conversely, on the downside, the USD/CAD pair could navigate the region around the psychological level of 1.3700, followed by the 23.6% Fibonacci retracement level of 1.3688, which is drawn between the levels of 1.3178 and 1.3846. A break below this level could lead the pair to test the lower boundary of the channel around the 1.3640 level.
USD/CAD: Daily Chart
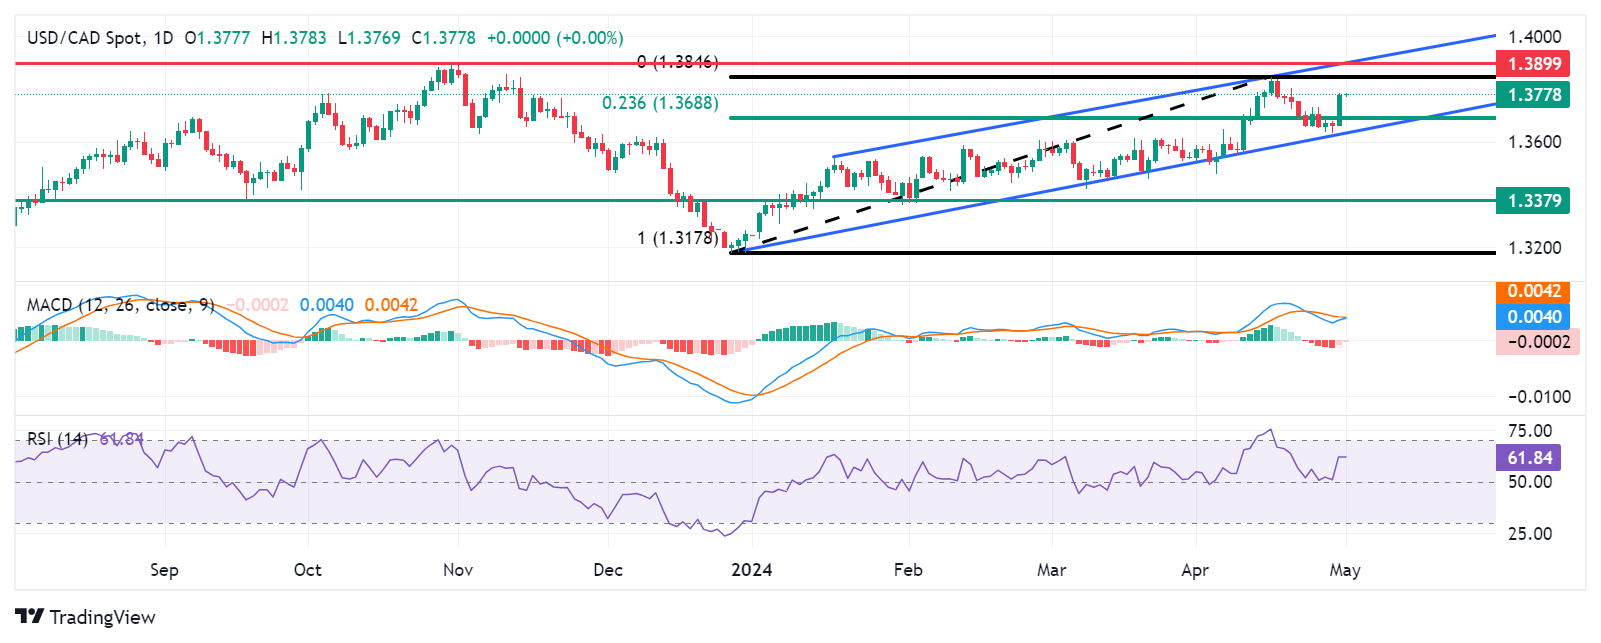
- The Pound Sterling drops below 1.2500 as the US Dollar strengthens ahead of the announcement of the latest Fed policy decision.
- In a light economic calendar week in the UK, speculation for BoE rate cuts is expected to drive the Pound Sterling.
- Investors expect that the Fed will emphasize the need to maintain the current interest rate framework for longer.
The Pound Sterling (GBP) extends its downside below the psychological support of 1.2500 against the US Dollar (USD) during Wednesday’s London session. Due to the light economic calendar in the United Kingdom, the volatility in the GBP/USD pair all comes from the side of the US Dollar as the United States faces a data-packed week, starting with the Federal Reserve decision (Fed) later on Wednesday.
The Pound Sterling’s valuation will solely be impacted by expectations for interest-rate cuts by the Bank of England (BoE). Financial markets speculate that the BoE could opt to cut borrowing costs in the June or August meetings. Traders have priced in rate cuts soon as BoE Governor Andrew Bailey said he is confident that headline inflation will come down to 2% in April. In March, UK inflation stood at 3.2%.
The recent steep correction in the GBP/USD pair reflects uncertainty among investors ahead of the Fed interest rate decision, which will be announced at 18:00 GMT. The Fed is expected to maintain interest rates steady and to give hawkish rhetoric, as recent inflation data suggests persisting price pressures, making it difficult for policymakers to gain confidence that price growth will sustainably return to the 2% target. This scenario of higher interest rates in the US improves the appeal of the US Dollar and weighs on other currencies whose central banks are seen cutting rates earlier than the Fed.
The US Dollar Index (DXY), which tracks the Greenback’s value against six major currencies, advances to a two-week high of around 106.50.
Daily digest market movers: Pound Sterling faces pressure as Fed looks set to maintain hawkish rhetoric
- The Pound Sterling corrects sharply to 1.2480 against the US Dollar as investors brace for the Federal Reserve’s monetary policy decision. The CME FedWatch tool shows that traders see interest rates remaining unchanged in the range of 5.25%-5.50% for the sixth time in a row. Though no action is expected on borrowing rates, investors will keenly watch for the interest rate outlook by looking at the Fed’s statement and Chairman Jerome Powell's press conference.
- The Fed is expected to support the “higher for longer interest rates” argument as a recent batch of inflation indicators has suggested that progress in inflation declining to the 2% target has stalled.
- After higher-than-expected Consumer Price Index (CPI) and core Personal Consumption Expenditure Price Index (PCE) for March, Q1 Employment Cost Index also beat estimates by a strong margin. The index rose by 1.2%, higher than the consensus of 1.0% and the prior reading of 0.9%. Higher Employment Cost is generally driven by strong wage growth, which leads to an increase in consumer spending and fuels inflationary pressures.
- Before the Fed’s policy meeting, investors will keenly focus on the ADP Employment Change and the ISM Manufacturing PMI data for April, which will be released in the early New York session. The consensus shows that private employers recruited 175K jobs, slightly lower from 184K in March. The Manufacturing PMI is forecasted to drop to the borderline of 50.0 in April from 50.3 in March. The 50.0 figure is the threshold that separates expansion from contraction. A weaker-than-expected Manufacturing PMI will indicate that US factory activity contracted in April.
Technical Analysis: Pound Sterling faces pressure near 1.2570
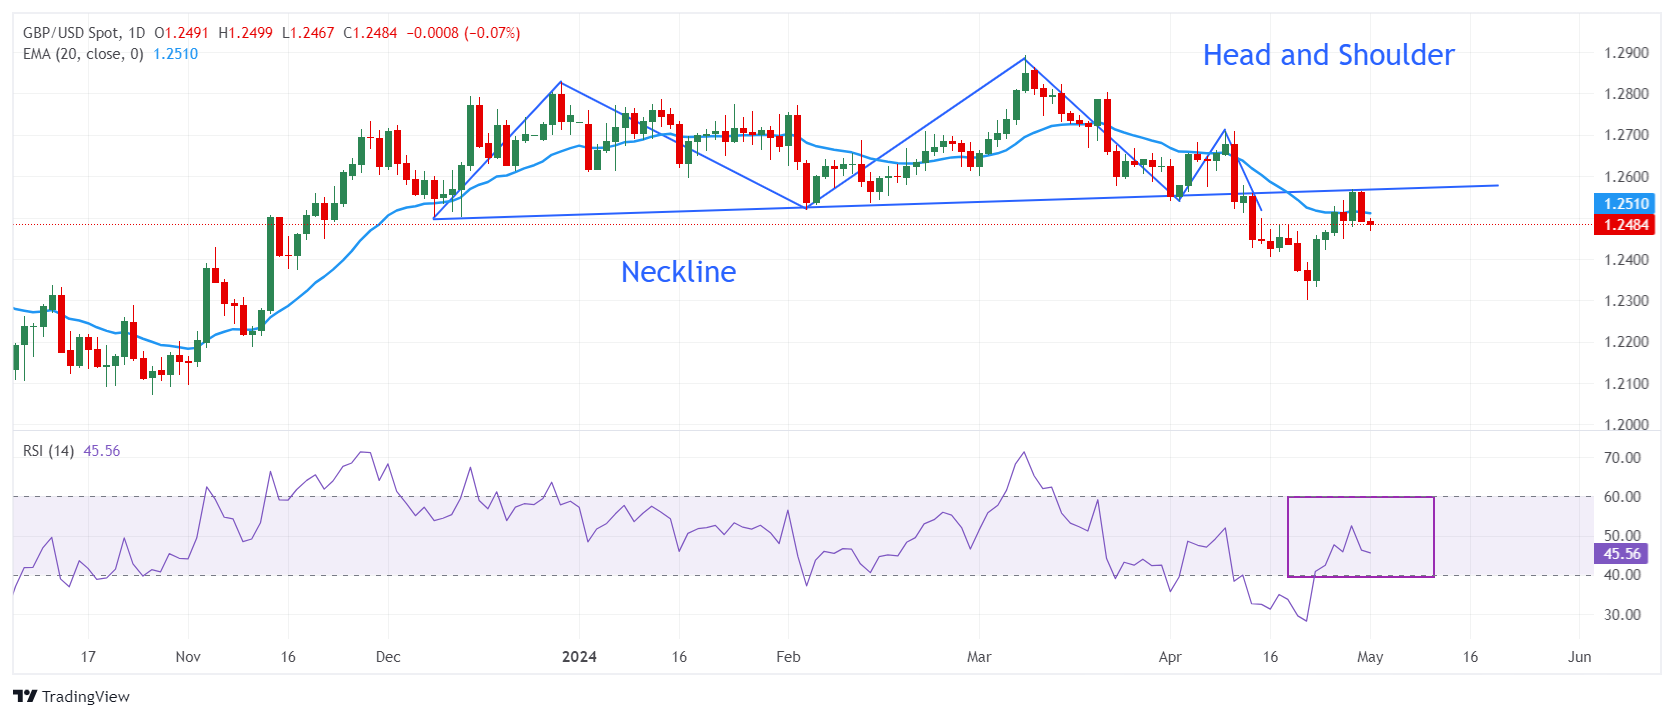
The Pound Sterling falls sharply against the US Dollar after failing to extend its upside above the crucial resistance of 1.2570. The GBP/USD pair also fails to sustain above the 20-day Exponential Moving Average (EMA) around 1.2510, indicating that the near-term outlook is still uncertain.
The neckline of the Head and Shoulders (H&S) pattern has acted as a strong barrier for the Pound Sterling bulls. On April 12, the Cable experienced an intense sell-off after breaking below the neckline of the H&S pattern plotted from December 8 low around 1.2500.
The 14-period Relative Strength Index (RSI) oscillates in the 40.00-60.00 range, suggesting indecisiveness among market participants.
Pound Sterling FAQs
The Pound Sterling (GBP) is the oldest currency in the world (886 AD) and the official currency of the United Kingdom. It is the fourth most traded unit for foreign exchange (FX) in the world, accounting for 12% of all transactions, averaging $630 billion a day, according to 2022 data. Its key trading pairs are GBP/USD, aka ‘Cable’, which accounts for 11% of FX, GBP/JPY, or the ‘Dragon’ as it is known by traders (3%), and EUR/GBP (2%). The Pound Sterling is issued by the Bank of England (BoE).
The single most important factor influencing the value of the Pound Sterling is monetary policy decided by the Bank of England. The BoE bases its decisions on whether it has achieved its primary goal of “price stability” – a steady inflation rate of around 2%. Its primary tool for achieving this is the adjustment of interest rates. When inflation is too high, the BoE will try to rein it in by raising interest rates, making it more expensive for people and businesses to access credit. This is generally positive for GBP, as higher interest rates make the UK a more attractive place for global investors to park their money. When inflation falls too low it is a sign economic growth is slowing. In this scenario, the BoE will consider lowering interest rates to cheapen credit so businesses will borrow more to invest in growth-generating projects.
Data releases gauge the health of the economy and can impact the value of the Pound Sterling. Indicators such as GDP, Manufacturing and Services PMIs, and employment can all influence the direction of the GBP. A strong economy is good for Sterling. Not only does it attract more foreign investment but it may encourage the BoE to put up interest rates, which will directly strengthen GBP. Otherwise, if economic data is weak, the Pound Sterling is likely to fall.
Another significant data release for the Pound Sterling is the Trade Balance. This indicator measures the difference between what a country earns from its exports and what it spends on imports over a given period. If a country produces highly sought-after exports, its currency will benefit purely from the extra demand created from foreign buyers seeking to purchase these goods. Therefore, a positive net Trade Balance strengthens a currency and vice versa for a negative balance.
- The ADP report is expected to show the US private sector added 179K jobs in April.
- A tight labour market and sticky inflation support the Fed’s tight stance.
- The US Dollar seems to have entered a consolidative phase.
On Wednesday, the United States (US) Automatic Data Processing (ADP) Research Institute is set to unveil private employment data for April. This survey offers insights into job creation within the private sector and typically precedes the official jobs report by the Bureau of Labor Statistics (BLS), which includes Nonfarm Payrolls (NFP) data and is due on May 3.
Market analysts anticipate the ADP survey to reveal the addition of 179K new positions during the last month, slightly below the 184K jobs reported in March. However, it's important to note that previous figures are subject to revisions, and while a robust ADP survey may hint at a similar trend in the NFP report, the correlation between the two reports has been inconsistent.
Nevertheless, the significance of the ADP survey is heightened by the US releasing various employment-related data in the days leading up to the Nonfarm Payrolls release. Collectively, these insights assist market participants in deciphering potential monetary policy moves by the Federal Reserve (Fed).
Many of the Federal Reserve’s (Fed) policymakers have been vocal in the past few weeks regarding the resilience of the US labour market, highlighting at the same time the good health of the whole US economy.
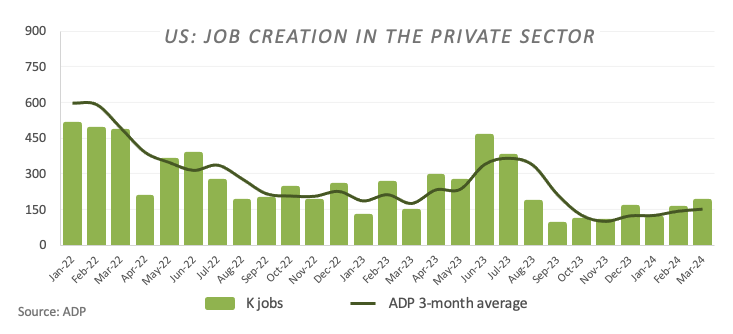
That said, US Treasury Secretary Janet Yellen asserted that they currently have a robust job market and see no indication that labour market conditions are contributing to inflation. Austan Goolsbee, President of the Chicago Fed, emphasized the need to assess whether strong GDP and job numbers signal overheating that might be fueling inflation, noting that not all data suggests overheating in the labour market. Fed Chair Jerome Powell remarked that the labour market is progressing towards a healthier equilibrium despite ongoing strength, and broader wage pressures are gradually easing. In addition, San Francisco Fed Mary Daly remarked that the labour market remains strong, although inflation is not declining as rapidly as it did last year.
When will the ADP Survey be released, and how could it affect the USD Index?
The upcoming release of the ADP job creation survey, scheduled for Wednesday, May 1, is anticipated to reveal an addition of 179K new positions in the private sector for April. Should the actual figure significantly exceed this estimate, it may indicate a persistently robust labour market. Coupled with rising wages, such results are likely to stimulate demand for the USD. Conversely, if job creation falls short of expectations and wages show signs of moderation, it could hurt the sentiment around the Greenback and probably exert some downside pressure on the US Dollar Index (DXY).
Speaking about techs around the USD Index (DXY), Pablo Piovano, Senior Analyst at FXStreet, argues: “If downward pressure intensifies, the USD Index (DXY) is anticipated to encounter initial support around the critical 200-day Simple Moving Average (SMA) at 104.13, followed by the April low at 103.88 (April 9). Further weakness could breach this level, leading to a test of the temporary 100-day SMA at 103.77, preceding the March low of 102.35 (March 8).”
On the other hand, Pablo notes that the resumption of bullish momentum may seek to retest the 2024 peak of 106.51 (April 16). Surpassing this level could encourage market participants to contemplate a move towards the November high at 107.11 (November 1), just prior to the 2023 top at 107.34 (October 3).
Considering the broader perspective, the prevailing constructive tone is expected to remain as long as DXY maintains its business above the 200-day SMA.
Economic Indicator
ADP Employment Change
The ADP Employment Change is a gauge of employment in the private sector released by the largest payroll processor in the US, Automatic Data Processing Inc. It measures the change in the number of people privately employed in the US. Generally speaking, a rise in the indicator has positive implications for consumer spending and is stimulative of economic growth. So a high reading is traditionally seen as bullish for the US Dollar (USD), while a low reading is seen as bearish.
Read more.Next release: Wed May 01, 2024 12:15
Frequency: Monthly
Consensus: 175K
Previous: 184K
Source: ADP Research Institute
Traders often consider employment figures from ADP, America’s largest payrolls provider, report as the harbinger of the Bureau of Labor Statistics release on Nonfarm Payrolls (usually published two days later), because of the correlation between the two. The overlaying of both series is quite high, but on individual months, the discrepancy can be substantial. Another reason FX traders follow this report is the same as with the NFP – a persistent vigorous growth in employment figures increases inflationary pressures, and with it, the likelihood that the Fed will raise interest rates. Actual figures beating consensus tend to be USD bullish.
Employment FAQs
Labor market conditions are a key element to assess the health of an economy and thus a key driver for currency valuation. High employment, or low unemployment, has positive implications for consumer spending and thus economic growth, boosting the value of the local currency. Moreover, a very tight labor market – a situation in which there is a shortage of workers to fill open positions – can also have implications on inflation levels and thus monetary policy as low labor supply and high demand leads to higher wages.
The pace at which salaries are growing in an economy is key for policymakers. High wage growth means that households have more money to spend, usually leading to price increases in consumer goods. In contrast to more volatile sources of inflation such as energy prices, wage growth is seen as a key component of underlying and persisting inflation as salary increases are unlikely to be undone. Central banks around the world pay close attention to wage growth data when deciding on monetary policy.
The weight that each central bank assigns to labor market conditions depends on its objectives. Some central banks explicitly have mandates related to the labor market beyond controlling inflation levels. The US Federal Reserve (Fed), for example, has the dual mandate of promoting maximum employment and stable prices. Meanwhile, the European Central Bank’s (ECB) sole mandate is to keep inflation under control. Still, and despite whatever mandates they have, labor market conditions are an important factor for policymakers given its significance as a gauge of the health of the economy and their direct relationship to inflation.
- EUR/JPY gains ground near 168.25 in Wednesday’s early European session.
- The Eurozone GDP numbers came in better than expected, expanding 0.3% QoQ in Q1 2024.
- The risk-off mood might boost the safe-haven JPY and cap the cross’s upside.
The EUR/JPY cross trades in positive territory for the second consecutive day around 168.25 during the early European trading hours on Wednesday. The upside of the cross is bolstered by stronger-than-expected Eurozone economic data, which may suggest a less urgent need for more accommodative monetary policy from the European Central Bank (ECB).
Eurozone economy has escaped the mild recession suffered in Q4 of last year, according to Eurostat on Tuesday. The Eurozone Gross Domestic Product (GDP) grew by 0.3% QoQ in the first quarter (Q1) of 2024, with France and Germany both expanding by 0.2% QoQ. Meanwhile, the Eurozone headline Harmonized Index of Consumer Prices (HICP) climbed by 2.4% YoY in April, in line with the estimation. The Core CPI figure rose by 2.7% year over year in April, above the market consensus of 2.6%.
The stronger-than-expected Eurozone economic data indicated that the need for the ECB to cut the interest rate is less urgent than previously expected. This, in turn, provides some support to the Euro (EUR) and creates a tailwind for the EUR/JPY cross.
The divergence in monetary policy between the ECB and the Bank of Japan (BoJ) weighs on the Japanese Yen (JPY) against the Euro. The BoJ kept interest rates steady around zero last week. However, uncertainty about future rate hikes led to a further decline in the JPY. On the other hand, the risk-off mood and the safe-haven flows amid the ongoing geopolitical tensions in the Middle East might lift the JPY and cap the upside of the cross.
FX option expiries for May 1 NY cut at 10:00 Eastern Time, via DTCC, can be found below
- EUR/USD: EUR amounts
- 1.0610 620m
- 1.0650 1.2b
- 1.0700 584m
- 1.0795 521m
- 1.0800 689m
- GBP/USD: GBP amounts
- 1.2335 552m
- 1.2350 816m
- USD/JPY: USD amounts
- 154.00 1.3b
- 154.50 570m
- 155.75 671m
- AUD/USD: AUD amounts
- 0.6495 455m
- 0.6500 600m
- 0.6950 545m
- NZD/USD: NZD amounts
- 0.5940 2.2b
- EUR/GBP: EUR amounts
- 0.8600 461m
- Silver price edges higher despite the hawkish sentiment surrounding the Fed.
- The prolonged higher interest rates could dampen the demand for non-yielding assets like silver.
- The stronger Employment Cost Index bolstered the strength of the US Dollar.
Silver price recovers its recent losses registered in the previous session, trading around $26.50 per troy ounce during the Asian trading hours on Wednesday. However, US Dollar (USD) strengthened on the back of rising US Treasury yields. Market participants adopt a cautious stance ahead of the Federal Reserve's (Fed) policy decision.
The stronger labor cost data from the United States (US) has reignited discussions about the Federal Reserve potentially delaying rate cuts due to inflationary pressures. The US Employment Cost Index surged by 1.2% in the first quarter, marking its largest increase in a year and surpassing both expectations of 1.0% and the previous figure of 0.9%. This data underscores existing wage pressures, which could exacerbate the impact of persistent inflation within the US economy.
Traders have been scaling back expectations for Fed rate cuts this year, buoyed by robust US economic data and persistent inflation. According to the CME FedWatch Tool, the probability of the Federal Reserve maintaining interest rates at their current level of 5.5% in June has surged to 91.6%, up from 81.2% a week ago. The prospect of higher interest rates increases the opportunity cost of holding non-yielding assets like Silver, dampening its appeal.
Investors are expected to monitor the release of the ADP Employment Change and ISM Manufacturing PMI from the United States on Wednesday, ahead of the Fed's Monetary Policy Statement. These data releases are likely to provide further insights into the current state of the US economy, influencing market expectations regarding future monetary policy decisions.
- USD/CHF trades on a stronger note around 0.9210 ahead of the Fed rate decision on Wednesday.
- The pair keeps the bullish vibe with the overbought RSI condition.
- The first upside barrier is seen at 0.9245; the initial support level is located at 0.9155.
The USD/CHF pair extends its upside to 0.9210 on Wednesday during the early European session. A renewed US Dollar (USD) demand creates a tailwind to a major pair. Furthermore, the Fed is widely expected to keep the policy rate in its current 5.25%–5.50% range on Wednesday and continue to maintain the hawkish stance, which provides some support to the Greenback.
Technically, USD/CHF maintains the bullish outlook unchanged on the four-hour chart as the cross is above the key 50- and 100-period Exponential Moving Averages (EMAs). The Relative Strength Index (RSI) holds in bullish territory above the midline. However, the overbought RSI condition indicates that further consolidation cannot be ruled out before positioning for any near-term USD/CHF appreciation.
A decisive break above the upper boundary of the Bollinger Band at 0.9210 will see a rally to a high of October 3, 2023, at 0.9245. Any follow-through buying above this level will expose the 0.9300 psychological round mark. The next upside target is seen at a high of March 16, 2023, at 0.9340.
On the flip side, the initial support level for the cross will emerge near a high of April 29 at 0.9155. The additional downside filter to watch is the 50-period EMA at 0.9134. The key contention level is located at the 0.9100–0.9110 zone, representing the psychological figure and the 100-period EMA. A breach of the mentioned level will see a drop to the lower limit of the Bollinger Band at 0.9075.
USD/CHF four-hour chart
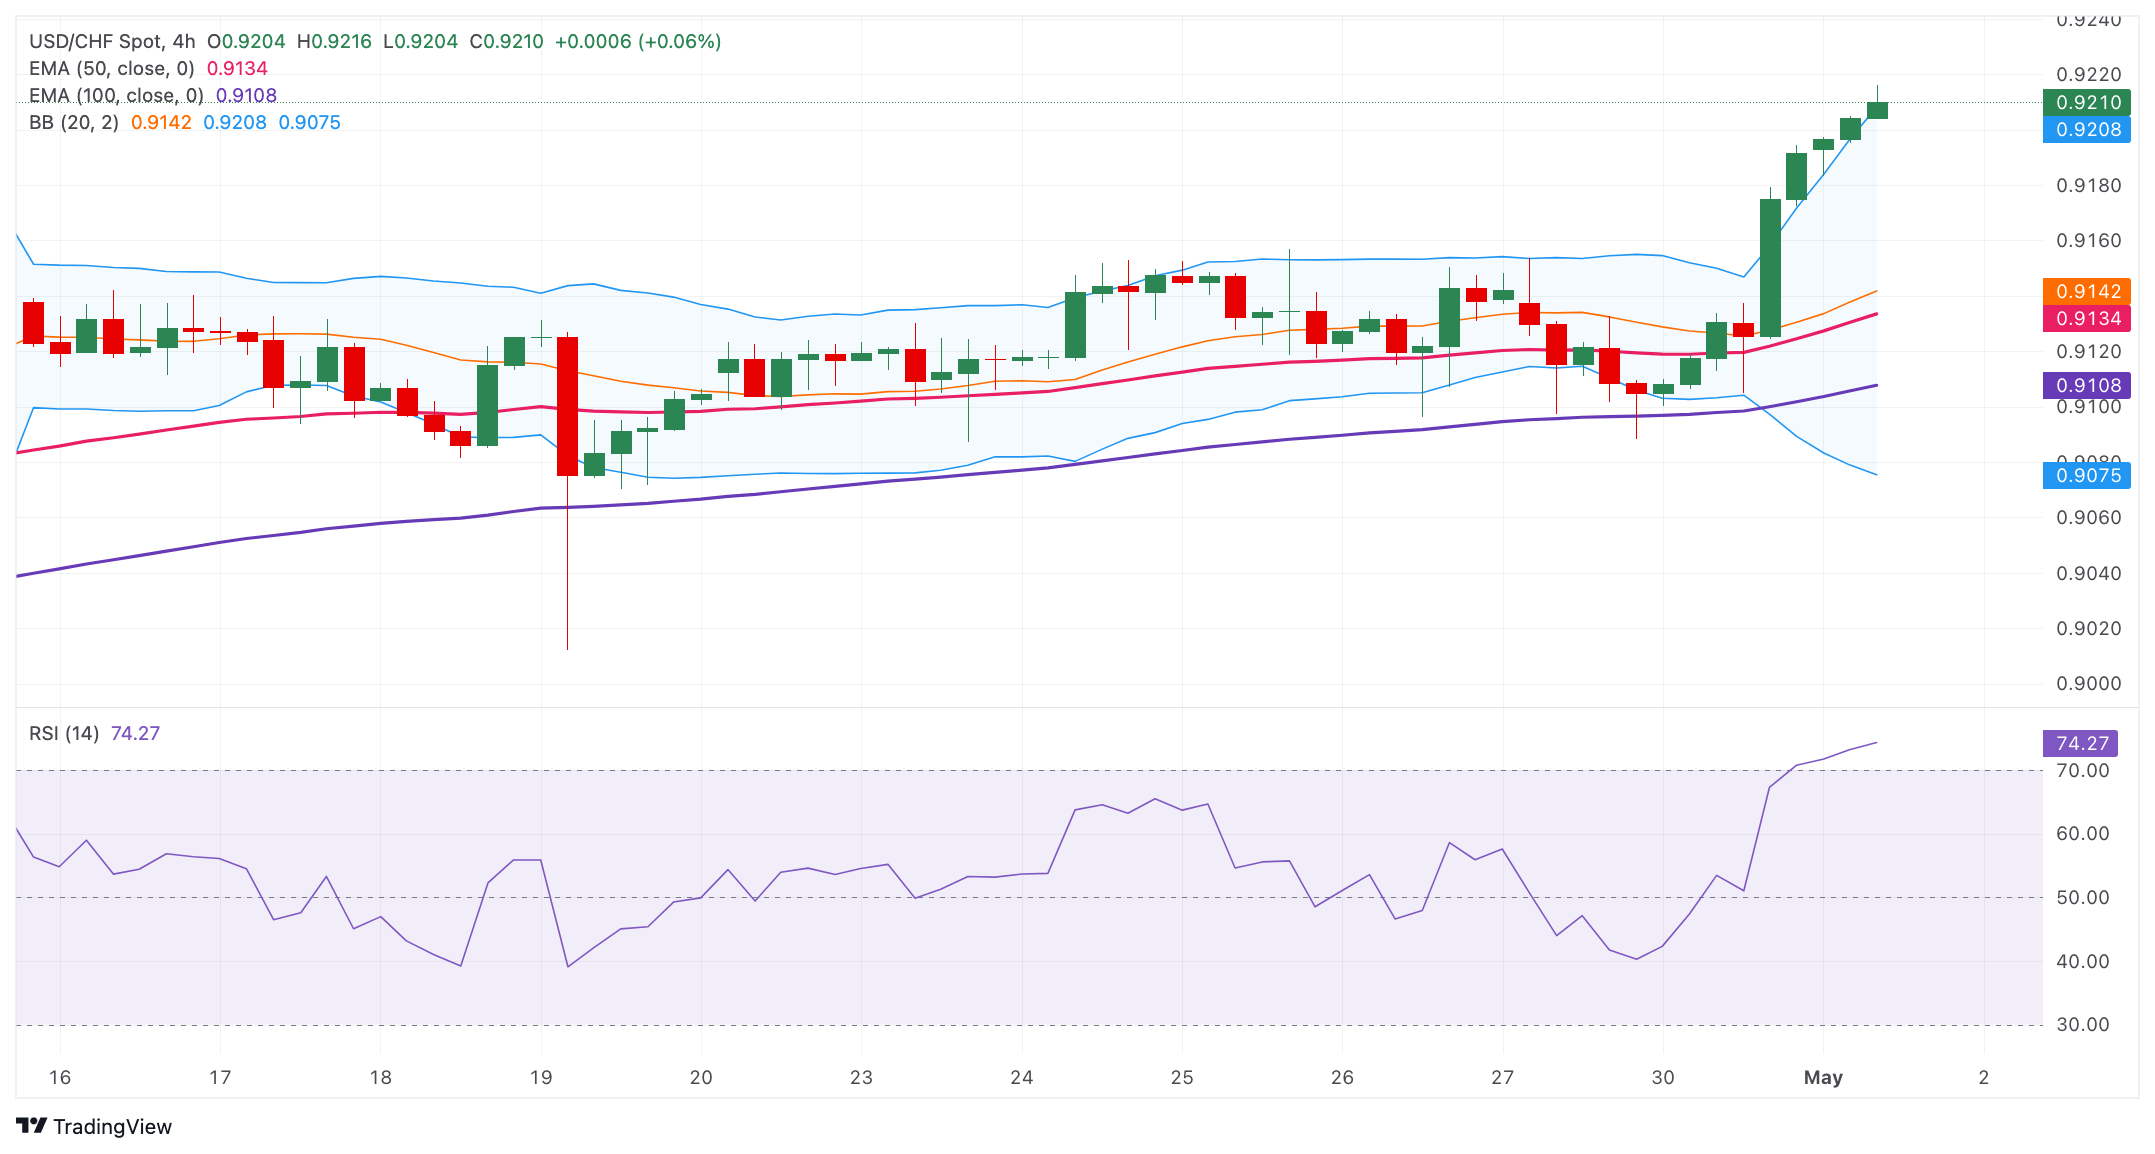
- EUR/USD depreciates due to risk-off sentiment ahead of the Fed interest rate decision on Wednesday.
- The stronger Employment Cost Index bolstered the strength of the US Dollar.
- The Euro failed to appreciate the robust Eurozone data released on Tuesday.
EUR/USD continues its decline for the second consecutive day, hovering around 1.0650 during Asian trading hours on Wednesday. With European markets largely closed for Labour Day, investors are expecting the Federal Reserve's (Fed) latest policy decision.
The US Dollar Index (DXY), which gauges the performance of the US Dollar (USD) against six major currencies, continues its rally following higher than expected Employment Cost Index data released on Tuesday. Additionally, hawkish remarks from Fed officials, signaling no immediate need for rate cuts, undermined the EUR/USD pair.
In the first quarter, the US Employment Cost Index surged by 1.2%, representing the largest increase in a year and exceeding both expectations of 1.0% and the previous figure of 0.9%. This recent data underscores prevailing wage pressures, which have the potential to magnify the impact of persistent inflation within the US economy.
Traders are anticipated to closely monitor the release of the ADP Employment Change and ISM Manufacturing PMI from the United States (US) on Wednesday, preceding the Fed's Monetary Policy Statement. These releases are likely to offer additional insights into the current state of the US economy.
On the Eurozone front, the Euro failed to sustain its gains despite robust Eurozone data released on Tuesday. The Eurozone Gross Domestic Product (GDP) expanded by a higher than expected 0.3% in the first quarter.
Furthermore, the Harmonized Index of Consumer Prices (HICP) has shown steady growth year-over-year, meeting expectations, while core HICP, excluding food and energy prices, has softened but still exceeded estimates.
Investor confidence remains strong regarding the European Central Bank (ECB) potentially implementing interest rate cuts in June, as a majority of ECB policymakers have expressed support for such a move.
- The Australian Dollar extended losses after weaker domestic data this week.
- The Australian Industry Index indicated prevailing contractionary conditions in private business activity.
- The US Dollar continues gains after a stronger Employment Cost Index released on Tuesday.
The Australian Dollar (AUD) remains under pressure following the release of the AiG Industry Index on Wednesday, indicating a prevailing contraction in private business activity in Australia during March. However, with the Reserve Bank of Australia’s (RBA) meeting scheduled for next week, it is widely anticipated to maintain interest rates at the current level of 4.35%.
The Australian Dollar lost ground after lower than expected Aussie Retail Sales data released on Tuesday, potentially affecting the RBA's hawkish stance on interest rates. However, higher than expected domestic inflation data released last week has raised expectations that the central bank may delay interest rate cuts.
The US Dollar Index (DXY), which gauges the performance of the US Dollar (USD) against six major currencies, continues its rally ahead of the US Federal Reserve (Fed) policy meeting scheduled for Wednesday. US bond yields surged following higher than expected Employment Cost Index data, further bolstering the USD. Additionally, hawkish remarks from Fed officials, signaling no immediate need for rate cuts, undermined the AUD/USD pair.
Traders are expected to observe the release of the ADP Employment Change and ISM Manufacturing PMI from the United States (US) on Wednesday, ahead of the Fed's Monetary Policy Statement. These releases will likely provide further insights into the state of the United States (US) economy.
Daily Digest Market Movers: Australian Dollar extends losses after weaker Aussie data
- The AiG Australian Industry Index decreased by 3.6 points to hit -8.9 points in April, marking continued contractionary trends over the past two years. March's figure stood at -5.3.
- The ASX 200 began Wednesday trading lower, with all 11 sectors experiencing a decline. This drop followed robust US employment data that rattled Wall Street, raising concerns about sustained inflation and the potential for the US Federal Reserve (Fed) to prolong higher interest rates.
- According to the Financial Review, ANZ predicts the Reserve Bank of Australia will start reducing interest rates in November, spurred by last week's inflation data surpassing expectations. Likewise, Commonwealth Bank, Australia's largest mortgage lender, has revised its forecast for the RBA's first interest rate cut timing, now projecting a single cut in November.
- During the first quarter, the US Employment Cost Index surged by 1.2%, marking the highest increase in a year and surpassing expectations of 1.0% as well as the previous figure of 0.9%. This latest data highlights enduring wage pressures, which could amplify the effects of persistent inflation within the US economy.
- In March, the seasonally adjusted Australian Retail Sales experienced a decrease, failing to meet expectations. This marked the first decline since last December, with turnover decreasing across all industries.
- According to the CME FedWatch Tool, the likelihood of the Federal Reserve maintaining interest rates at their current level during the June meeting has risen to 91.6%, climbing from 81.2% a week ago. This narrative of prolonged higher rates from the Fed is bolstering the US Dollar and posing a hurdle for the AUD/USD pair.
- The Economic Times reported on Monday that Fed Chair Jerome Powell mentioned it would likely take "longer than expected" to gain confidence that inflation is progressing towards the central bank's 2% target. Powell added that the central bank can maintain rates at a high level "as long as needed." Fed Governor Michelle Bowman expressed her view of "upside risks" to inflation. Meanwhile, Minneapolis Fed President Neel Kashkari raised the possibility of no rate cuts occurring this year.
Technical Analysis: Australian Dollar moves below 0.6500
The Australian Dollar trades around 0.6470 on Wednesday. The pair has breached the lower boundary of a symmetrical triangle and the significant level of 0.6480. Additionally, the 14-day Relative Strength Index (RSI) is below the 50-level, indicating a bearish sentiment.
The AUD/USD pair could potentially move toward the vicinity of the psychological level of 0.6400, followed by April's low of 0.6362. A further decline below this level might prompt a test of the lower boundary of the descending channel, around the major level of 0.6350.
If there's an upward movement, the AUD/USD pair might challenge the symmetrical triangle's lower boundary near the psychological level of 0.6500. A breakthrough above this level could bolster the pair to revisit the upper boundary, situated around the level of 0.6585.
AUD/USD: Daily Chart
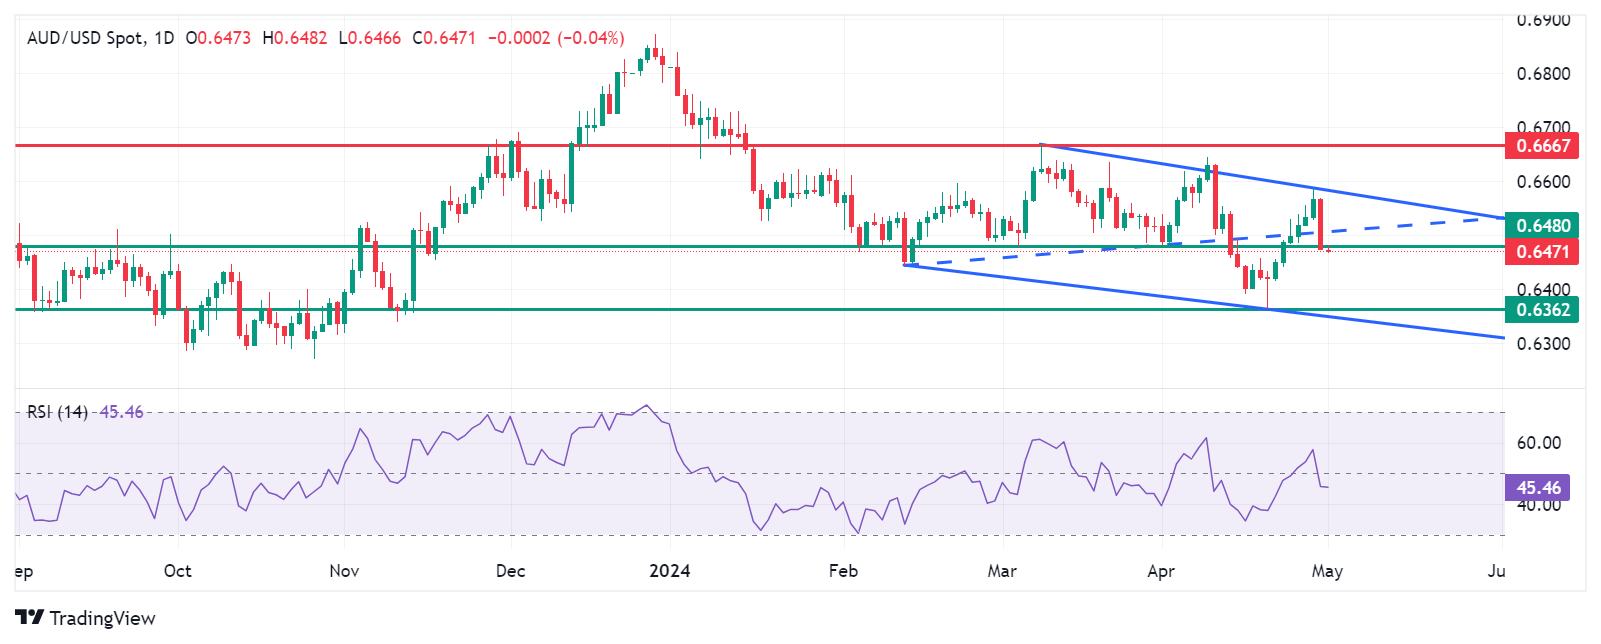
Australian Dollar price today
The table below shows the percentage change of the Australian Dollar (AUD) against listed major currencies today. The Australian Dollar was the weakest against the New Zealand Dollar.
| USD | EUR | GBP | CAD | AUD | JPY | NZD | CHF | |
| USD | 0.09% | 0.06% | 0.00% | 0.06% | 0.10% | -0.14% | 0.07% | |
| EUR | -0.06% | -0.02% | -0.08% | 0.01% | 0.05% | -0.21% | -0.01% | |
| GBP | -0.06% | 0.01% | -0.06% | 0.04% | 0.05% | -0.19% | 0.02% | |
| CAD | 0.01% | 0.08% | 0.06% | 0.10% | 0.10% | -0.13% | 0.07% | |
| AUD | -0.06% | -0.02% | -0.04% | -0.09% | 0.01% | -0.23% | -0.02% | |
| JPY | -0.10% | -0.03% | -0.04% | -0.11% | -0.01% | -0.23% | -0.03% | |
| NZD | 0.14% | 0.21% | 0.19% | 0.13% | 0.23% | 0.24% | 0.20% | |
| CHF | -0.08% | 0.01% | -0.01% | -0.07% | 0.02% | 0.03% | -0.20% |
The heat map shows percentage changes of major currencies against each other. The base currency is picked from the left column, while the quote currency is picked from the top row. For example, if you pick the Euro from the left column and move along the horizontal line to the Japanese Yen, the percentage change displayed in the box will represent EUR (base)/JPY (quote).
Australian Dollar FAQs
One of the most significant factors for the Australian Dollar (AUD) is the level of interest rates set by the Reserve Bank of Australia (RBA). Because Australia is a resource-rich country another key driver is the price of its biggest export, Iron Ore. The health of the Chinese economy, its largest trading partner, is a factor, as well as inflation in Australia, its growth rate and Trade Balance. Market sentiment – whether investors are taking on more risky assets (risk-on) or seeking safe-havens (risk-off) – is also a factor, with risk-on positive for AUD.
The Reserve Bank of Australia (RBA) influences the Australian Dollar (AUD) by setting the level of interest rates that Australian banks can lend to each other. This influences the level of interest rates in the economy as a whole. The main goal of the RBA is to maintain a stable inflation rate of 2-3% by adjusting interest rates up or down. Relatively high interest rates compared to other major central banks support the AUD, and the opposite for relatively low. The RBA can also use quantitative easing and tightening to influence credit conditions, with the former AUD-negative and the latter AUD-positive.
China is Australia’s largest trading partner so the health of the Chinese economy is a major influence on the value of the Australian Dollar (AUD). When the Chinese economy is doing well it purchases more raw materials, goods and services from Australia, lifting demand for the AUD, and pushing up its value. The opposite is the case when the Chinese economy is not growing as fast as expected. Positive or negative surprises in Chinese growth data, therefore, often have a direct impact on the Australian Dollar and its pairs.
Iron Ore is Australia’s largest export, accounting for $118 billion a year according to data from 2021, with China as its primary destination. The price of Iron Ore, therefore, can be a driver of the Australian Dollar. Generally, if the price of Iron Ore rises, AUD also goes up, as aggregate demand for the currency increases. The opposite is the case if the price of Iron Ore falls. Higher Iron Ore prices also tend to result in a greater likelihood of a positive Trade Balance for Australia, which is also positive of the AUD.
The Trade Balance, which is the difference between what a country earns from its exports versus what it pays for its imports, is another factor that can influence the value of the Australian Dollar. If Australia produces highly sought after exports, then its currency will gain in value purely from the surplus demand created from foreign buyers seeking to purchase its exports versus what it spends to purchase imports. Therefore, a positive net Trade Balance strengthens the AUD, with the opposite effect if the Trade Balance is negative.
- Gold price trades on a positive note near $2,288 on Wednesday.
- The Federal Reserve is widely expected to keep rates steady; Fed’s Powell is anticipated to maintain a hawkish stance.
- The rising geopolitical risks could boost traditional safe-haven assets like gold.
Gold price (XAU/USD) posts modest gains around $2,288 on Wednesday during the Asian session. The precious metal edges higher as markets turn to a cautious mood ahead of the Federal Reserve's (Fed) monetary policy meeting on Wednesday. Elsewhere, the US ISM Manufacturing PMI and ADP Employment Change are due later in the day.
Meanwhile, the US Dollar Index (DXY), a measure of the value of the USD against a weighted basket of currencies used by US trade partners, recovers to a weekly high of 106.40. The US Treasury bond yields edge lower, with the 10-year yield falling to 4.67%.
The US Fed is expected to hold interest rates steady at its May meeting on Wednesday and maintain its hawkish stance. Fed easing expectations have been pushed out further, with the odds of a June cut falling to around 10% and the chance of September rate cuts dropping below 75%, according to the CME FedWatch tool. Investors will take more cues from the Press Conference after the Fed meeting. The hawkish tone of the Fed might lift the Greenback and diminish the appeal of non-yielding metals.
On the other hand, China, the world's top gold consumer, has bought gold steadily since October 2022, marking its longest buildup of the precious metal since at least 2000. This, in turn, helps boost the further upside of the precious metal.
Furthermore, China's massive and ongoing central bank gold purchases are increasing suspicions that the government may not only be strengthening its currency but also laying the economic groundwork for a full-scale invasion of Taiwan, a Telegraph report reported Tuesday. Gold traders will monitor the developments surrounding the China-Taiwan tension, along with the geopolitical tensions in the Middle East. Any escalating tension risks might boost safe-haven flows and benefit the gold price.
- The Japanese Yen continues to be undermined by the divergent BoJ-Fed policy expectations.
- Bets that the Fed will keep rates higher for longer, lift the USD, and lend support to USD/JPY.
- The risk-off impulse underpins the safe-haven JPY and caps gains ahead of the FOMC decision.
The Japanese Yen (JPY) registered heavy losses against its American counterpart on Tuesday and reversed a major part of the previous day's sharp gains led by a possible intervention by Japanese authorities. The main driver of the JPY weakness is the interest-rate differential between Japan and the United States (US), which is expected to remain wide for some time. This, along with a goodish pickup in the US Dollar (USD) demand, provided an additional lift to the USD/JPY pair and contributed to the strong intraday move up.
The USD buying remained unabated during the Asian session on Wednesday amid growing acceptance that the Federal Reserve (Fed) will keep interest rates higher for longer, bolstered by incoming US macro data that pointed to still sticky inflation. That said, the risk-off impulse – as depicted by the overnight slump in the US equity markets and a sea of red across the Asian equity markets – lends some support to the safe-haven JPY. This, in turn, acts as a headwind for the USD/JPY pair ahead of the crucial FOMC policy decision later today.
Daily Digest Market Movers: Japanese Yen fails to capitalize on possible intervention-led gains amid BoJ’s uncertain rate outlook
- The Japanese Yen remains on the defensive on Wednesday amid the Bank of Japan's cautious approach towards further policy tightening and uncertain rate outlook, albeit the risk-off impulse helps limit deeper losses.
- The headline au Jibun Bank Japan Manufacturing PMI was finalized at 49.6 for April, which was noticeably higher than the previous month's reading of 48.2 and also marked the slowest contraction in eight months.
- Reports suggest that Japan may provide tax breaks for companies converting foreign profits into the JPY, though this does little to provide respite to bulls or any meaningful impetus to the USD/JPY pair amid a stronger US Dollar.
- From the US, the Labor Department reported on Tuesday that labor costs increased more than expected during the first quarter amid a rise in wages and benefits, confirming the surge in inflation early in the year.
- This comes on top of Friday's release of the US Personal Consumption Expenditures (PCE) Price Index, which pointed to still sticky inflation, and reaffirmed bets that the Federal Reserve will delay cutting interest rates.
- The data reaffirmed market bets that the US central bank will begin the rate-cutting cycle only in September, lifting the US Dollar to over a two-week high and providing a strong boost to the USD/JPY pair on Tuesday.
- The USD bulls, meanwhile, seem unaffected by the Conference Board's survey, showing that the Consumer Confidence Index fell to 97.0 in April – the lowest level since July 2022 – from a downwardly revised 103.1 in March.
- Adding to this, the Chicago PMI remained in negative territory for the fifth straight month and dropped sharply from 41.4 to 37.9 in April, or the lowest level since November 2022, albeit does little to hinder the USD rise.
- The focus, meanwhile, remains on the crucial FOMC policy decision, scheduled to be announced later during the US session, which will influence the USD and provide a fresh directional impetus to the USD/JPY pair.
- Heading into the key central bank event risk, traders on Wednesday will take cues from the US macroeconomic releases – the ADP report on private-sector employment, JOLTS Job Openings and ISM Manufacturing PMI.
Technical Analysis: USD/JPY bulls now await strength beyond the 158.00 mark before positioning for any further appreciating move
From a technical perspective, the suspected intervention-inspired slump on Monday showed some resilience below the 200-hour Simple Moving Average (SMA). The subsequent move up, along with positive oscillators on hourly charts, suggests that the path of least resistance for the USD/JPY pair is to the upside. Bulls, however, might prefer to wait for a move beyond the 158.00 mark, or the 50% Fibonacci retracement level of the early week steep decline, before placing fresh bets. Spot prices might then surpass an intermediate hurdle near the 158.40-158.45 region and aim to reclaim the 159.00 mark.
On the flip side, any downfall below the 157.50-157.45 immediate support might now attract fresh buyers and remain limited by the 157.00 mark. The latter should act as a key pivotal point, which, if broken decisively, could drag the USD/JPY pair to the 156.35 region ahead of the 156.00 mark. The downward trajectory could extend further towards the 155.35 region en route to the 155.00 psychological mark and the weekly swing low, around mid-154.00s, touched on Monday.
Japanese Yen FAQs
The Japanese Yen (JPY) is one of the world’s most traded currencies. Its value is broadly determined by the performance of the Japanese economy, but more specifically by the Bank of Japan’s policy, the differential between Japanese and US bond yields, or risk sentiment among traders, among other factors.
One of the Bank of Japan’s mandates is currency control, so its moves are key for the Yen. The BoJ has directly intervened in currency markets sometimes, generally to lower the value of the Yen, although it refrains from doing it often due to political concerns of its main trading partners. The current BoJ ultra-loose monetary policy, based on massive stimulus to the economy, has caused the Yen to depreciate against its main currency peers. This process has exacerbated more recently due to an increasing policy divergence between the Bank of Japan and other main central banks, which have opted to increase interest rates sharply to fight decades-high levels of inflation.
The BoJ’s stance of sticking to ultra-loose monetary policy has led to a widening policy divergence with other central banks, particularly with the US Federal Reserve. This supports a widening of the differential between the 10-year US and Japanese bonds, which favors the US Dollar against the Japanese Yen.
The Japanese Yen is often seen as a safe-haven investment. This means that in times of market stress, investors are more likely to put their money in the Japanese currency due to its supposed reliability and stability. Turbulent times are likely to strengthen the Yen’s value against other currencies seen as more risky to invest in.
| Raw materials | Closed | Change, % |
|---|---|---|
| Silver | 26.272 | -3.11 |
| Gold | 2285.81 | -2.15 |
| Palladium | 953.25 | -2.41 |
- The Australian Dollar loses ground after the release of the weaker AiG Industry Index on Wednesday.
- The Australian Industry Index indicated prevailing contractionary conditions for the past twenty-four months.
- Traders will monitor for any potential Japanese intervention, following recent reports suggesting Tokyo's involvement in the currency market.
AUD/JPY extends its losing streak for the third consecutive session. The Australian Dollar (AUD) faced pressure following the release of the AiG Industry Index on Wednesday, a leading indicator measuring private business activity in Australia, which continued its decline in March.
The softer Aussie Retail Sales released on Tuesday could potentially impact the Reserve Bank of Australia's (RBA) hawkish stance on interest rate trajectory. However, higher-than-expected domestic inflation data released last week raised expectations that the RBA may delay interest rate cuts. The central bank is scheduled to meet next week, and it is widely anticipated to maintain interest rates at the current level of 4.35%
In Japan, market participants are closely monitoring for potential intervention following reports of Tokyo's involvement in the currency market on Monday, which boosted the Japanese Yen (JPY), according to Reuters. Additionally, expectations for a sustained significant interest rate differential between Japan and other nations suggest that the trajectory of the JPY is biased toward further depreciation.
The Bank of Japan (BoJ) is set to release its Monetary Policy Meeting Minutes on Thursday. These minutes provide insight into economic developments in Japan following the actual meeting. Changes in this report can influence JPY volatility.
Daily Digest Market Movers: AUD/JPY edges lower after weaker Aussie data
- In April, the AiG Australian Industry Index declined by 3.6 points to reach -8.9 points, indicating prevailing contractionary conditions for the past twenty-four months. The previous reading was -5.3 in March.
- The benchmark ASX 200 opened lower on Wednesday, with all 11 sectors in the red. This decline followed hot US labor data that unsettled Wall Street, sparking concerns that persistent inflation may prompt the US Federal Reserve (Fed) to maintain higher interest rates for an extended period.
- As reported by the Financial Review, ANZ anticipates that the RBA will commence cutting interest rates in November, following last week’s stronger-than-expected inflation data. In a similar vein, Australia's largest mortgage lender, Commonwealth Bank, has adjusted its forecast for the timing of the first interest rate cut by the RBA. They are now projecting only one cut in November.
- The seasonally adjusted Australian Retail Sales released on Tuesday, showed a drop in March, compared to the expected increase and the previous growth.
- Japan’s Retail Trade increased by 1.2% year-over-year in March, which was lower than the expected increase of 2.5% and the previous increase of 4.7%. The seasonally adjusted Retail Trade (MoM) decreased by 1.2%, against the expected rise of 0.6%.
- Masato Kanda, Japan's senior currency diplomat, made pointed comments regarding the currency's impact on import prices, emphasizing its significant influence. He highlighted the readiness of authorities to take action around the clock to address currency-related matters, as per a Reuters report.
- BoJ Governor Kazuo Ueda provided insights into the central bank's decision to maintain the status quo during the post-policy meeting press conference on Friday. Ueda outlined that the BoJ will adjust the degree of monetary easing if the underlying inflation rate rises.
Technical Analysis: AUD/JPY hovers around the psychological level of 102.00
The AUD/JPY trades around 102.10 on Wednesday, breaking below the lower boundary of a rising wedge pattern on the daily chart, which typically indicates a bearish reversal. This decline could weaken bullish sentiment; however, traders may await confirmation from the 14-day Relative Strength Index (RSI), which is still above the 50-level.
Immediate resistance is observed at the lower boundary of the wedge around the psychological level of 103.00. A rebound back into the ascending wedge could potentially improve the bullish sentiment and push the AUD/JPY pair toward the psychological level of 105.00, coinciding with the upper boundary of the wedge.
On the downside, immediate support for the AUD/JPY pair is seen at the psychological level of 102.00, followed by the nine-day Exponential Moving Average (EMA) at 101.56.
AUD/JPY: Daily Chart
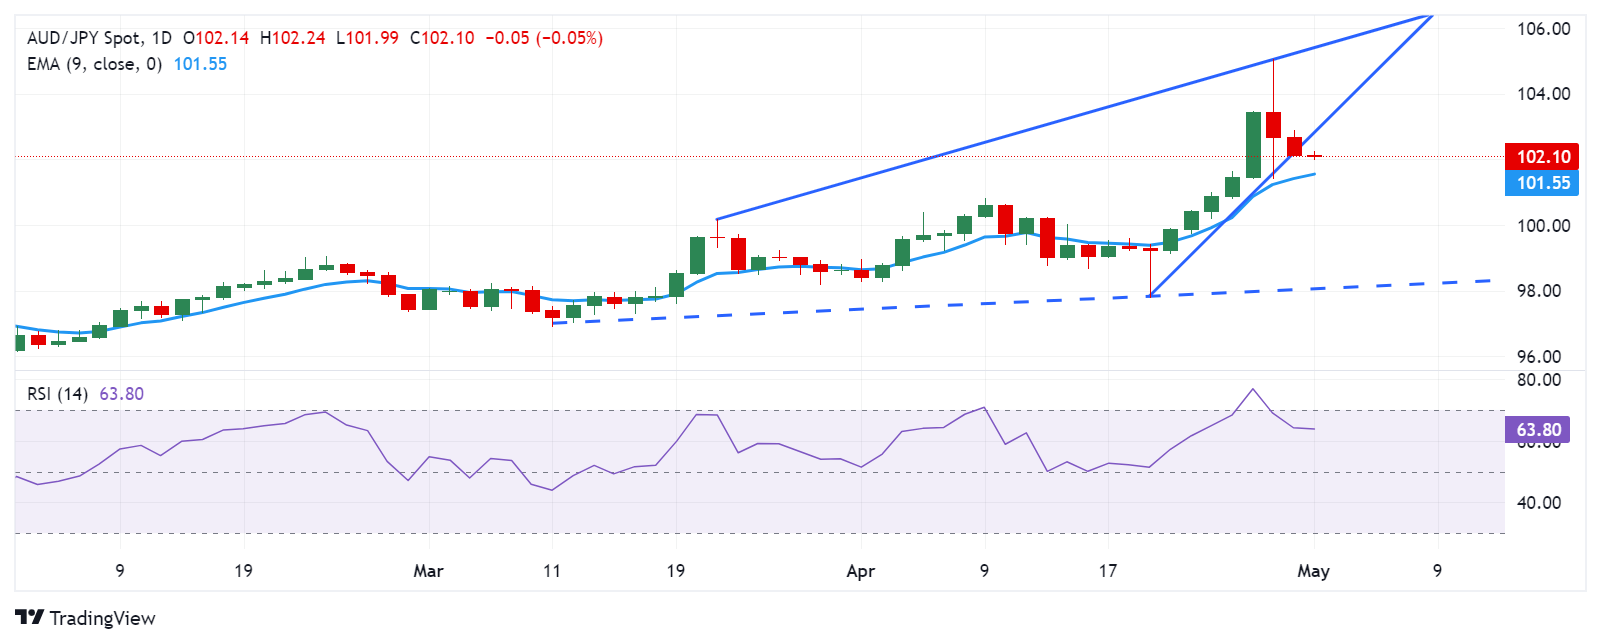
Australian Dollar price today
The table below shows the percentage change of the Australian Dollar (AUD) against listed major currencies today. The Australian Dollar was the weakest against the New Zealand Dollar.
| USD | EUR | GBP | CAD | AUD | JPY | NZD | CHF | |
| USD | 0.08% | 0.09% | 0.02% | 0.11% | 0.06% | -0.12% | 0.08% | |
| EUR | -0.07% | 0.00% | -0.06% | 0.04% | -0.01% | -0.20% | 0.00% | |
| GBP | -0.09% | 0.00% | -0.06% | 0.04% | -0.01% | -0.20% | 0.00% | |
| CAD | -0.02% | 0.06% | 0.07% | 0.10% | 0.05% | -0.14% | 0.06% | |
| AUD | -0.12% | -0.04% | -0.04% | -0.10% | -0.07% | -0.24% | -0.04% | |
| JPY | -0.05% | 0.00% | 0.00% | -0.06% | 0.06% | -0.20% | 0.04% | |
| NZD | 0.12% | 0.20% | 0.20% | 0.14% | 0.24% | 0.19% | 0.20% | |
| CHF | -0.09% | 0.00% | 0.00% | -0.06% | 0.04% | -0.06% | -0.20% |
The heat map shows percentage changes of major currencies against each other. The base currency is picked from the left column, while the quote currency is picked from the top row. For example, if you pick the Euro from the left column and move along the horizontal line to the Japanese Yen, the percentage change displayed in the box will represent EUR (base)/JPY (quote).
Australian Dollar FAQs
One of the most significant factors for the Australian Dollar (AUD) is the level of interest rates set by the Reserve Bank of Australia (RBA). Because Australia is a resource-rich country another key driver is the price of its biggest export, Iron Ore. The health of the Chinese economy, its largest trading partner, is a factor, as well as inflation in Australia, its growth rate, and Trade Balance. Market sentiment – whether investors are taking on more risky assets (risk-on) or seeking safe havens (risk-off) – is also a factor, with risk-on positive for AUD.
The Reserve Bank of Australia (RBA) influences the Australian Dollar (AUD) by setting the level of interest rates that Australian banks can lend to each other. This influences the level of interest rates in the economy as a whole. The main goal of the RBA is to maintain a stable inflation rate of 2-3% by adjusting interest rates up or down. Relatively high interest rates compared to other major central banks support the AUD, and the opposite for relatively low. The RBA can also use quantitative easing and tightening to influence credit conditions, with the former AUD-negative and the latter AUD-positive.
China is Australia’s largest trading partner so the health of the Chinese economy is a major influence on the value of the Australian Dollar (AUD). When the Chinese economy is doing well it purchases more raw materials, goods and services from Australia, lifting demand for the AUD, and pushing up its value. The opposite is the case when the Chinese economy is not growing as fast as expected. Positive or negative surprises in Chinese growth data, therefore, often have a direct impact on the Australian Dollar and its pairs.
Iron Ore is Australia’s largest export, accounting for $118 billion a year according to data from 2021, with China as its primary destination. The price of Iron Ore, therefore, can be a driver of the Australian Dollar. Generally, if the price of Iron Ore rises, AUD also goes up, as aggregate demand for the currency increases. The opposite is the case if the price of Iron Ore falls. Higher Iron Ore prices also tend to result in a greater likelihood of a positive Trade Balance for Australia, which is also positive of the AUD.
The Trade Balance, which is the difference between what a country earns from its exports versus what it pays for its imports, is another factor that can influence the value of the Australian Dollar. If Australia produces highly sought after exports, then its currency will gain in value purely from the surplus demand created from foreign buyers seeking to purchase its exports versus what it spends to purchase imports. Therefore, a positive net Trade Balance strengthens the AUD, with the opposite effect if the Trade Balance is negative.
- WTI trades in negative territory for the fourth consecutive day near $80.80 on Wednesday.
- The unexpected Crude oil stockpiles build in the US weigh on WTI prices.
- The rising Middle East tensions might raise the fear of oil supply disruption, lifting WTI.
Western Texas Intermediate (WTI), the US crude oil benchmark, is trading around $80.80 on Wednesday. The black gold edges lower on rising crude inventories in the United States and easing geopolitical tensions in the Middle East.
Crude oil inventories in the United States for the week ending April 26 rose by 4.906 million barrels from a 3.23 million barrel draw in the previous week. The market consensus estimated that stocks would decrease by 1.5 million barrels, according to the American Petroleum Institute (API) on Wednesday.
Traders increase their bets that the Federal Reserve (Fed) might delay the interest rate cut and maintain the current benchmark rate for longer amid the robust economy and sticky inflation in the US. This might lead to a stronger US Dollar (USD) and exert some selling pressure on the USD-denominated oil.
Furthermore, the hope that a ceasefire agreement between Israel and Hamas might be in reach, reduces the fear of a wider conflict in the Middle East. However, Israeli Prime Minister Benjamin Netanyahu downplayed expectations that a proposed hostage deal would prevent an attack on the southern Gaza city of Rafah, per CNBC. The escalating geopolitical tensions in the Middle East might raise concern about oil supply disruption in the region and boost the price of black gold.
The Reserve Bank of New Zealand (RBNZ) Deputy Governor Christian Hawkesby said on Wednesday that higher interest rates mean cooling jobs market. He further stated that high global inflation remains a key risk for financial stability.
Key quotes
“Employment data confirmation of trend we were expecting to see.”
“Higher interest rates will involve a cooling of the labour market.”
“High global inflation still remains a key risk for financial stability.”
Market reaction
The NZD/USD pair is trading higher by 0.01% on the day to trade at 0.5887, as of writing.
RBNZ FAQs
The Reserve Bank of New Zealand (RBNZ) is the country’s central bank. Its economic objectives are achieving and maintaining price stability – achieved when inflation, measured by the Consumer Price Index (CPI), falls within the band of between 1% and 3% – and supporting maximum sustainable employment.
The Reserve Bank of New Zealand’s (RBNZ) Monetary Policy Committee (MPC) decides the appropriate level of the Official Cash Rate (OCR) according to its objectives. When inflation is above target, the bank will attempt to tame it by raising its key OCR, making it more expensive for households and businesses to borrow money and thus cooling the economy. Higher interest rates are generally positive for the New Zealand Dollar (NZD) as they lead to higher yields, making the country a more attractive place for investors. On the contrary, lower interest rates tend to weaken NZD.
Employment is important for the Reserve Bank of New Zealand (RBNZ) because a tight labor market can fuel inflation. The RBNZ’s goal of “maximum sustainable employment” is defined as the highest use of labor resources that can be sustained over time without creating an acceleration in inflation. “When employment is at its maximum sustainable level, there will be low and stable inflation. However, if employment is above the maximum sustainable level for too long, it will eventually cause prices to rise more and more quickly, requiring the MPC to raise interest rates to keep inflation under control,” the bank says.
In extreme situations, the Reserve Bank of New Zealand (RBNZ) can enact a monetary policy tool called Quantitative Easing. QE is the process by which the RBNZ prints local currency and uses it to buy assets – usually government or corporate bonds – from banks and other financial institutions with the aim to increase the domestic money supply and spur economic activity. QE usually results in a weaker New Zealand Dollar (NZD). QE is a last resort when simply lowering interest rates is unlikely to achieve the objectives of the central bank. The RBNZ used it during the Covid-19 pandemic.
- NZD/USD remains under some selling pressure around 0.5880 on Wednesday.
- The New Zealand Unemployment Rate in Q1 2024 climbed to 4.3% from 4.0% in Q4.
- Traders will monitor the Fed rate decision on Wednesday, with no change in rate expected.
The NZD/USD pair attracts some sellers near 0.5880 on Wednesday during the early Asian session. The Kiwi edges lower following the worse-than-expected New Zealand employment data. Additionally, the cautious mood in the market ahead of the US Federal Reserve's (Fed) interest rate decision on Wednesday remains to underpin the Greenback for the time being.
The unemployment rate in New Zealand rose sharply in the first quarter of this year as the economy suffered an extended recession amid high-interest rates conditions. Statistics New Zealand revealed on Wednesday that the nation’s Unemployment Rate climbed to 4.3% in Q1 from 4.0% in Q4, compared to the market estimation of 4.2%. Meanwhile, Employment Change figure declined by 0.2% in Q1 from a 0.4% rise in the previous reading, worse than the expectation of a 0.3% increase.
The rise in the jobless rate might convince the Reserve Bank of New Zealand (RBNZ) to hold the rate high for a longer period to cool inflation. Markets expect the RBNZ to maintain a restrictive Official Cash Rate, and rate cuts are unlikely to be delivered until 2025.
On the other hand, the US Fed is widely expected to leave rates unchanged in its current 5.25%–5.50% range on Wednesday. The recent hotter-than-expected inflation and robust US economic data triggered speculation that the US central bank might delay the interest rate cut. Investors will keep an eye on the tone of the FOMC statement and press conference. Any hawkish comments from the Fed might strengthen the Greenback and attract more inflows, while the dovish tone might exert some selling on the USD and create a tailwind for the NZD/USD.
| Index | Change, points | Closed | Change, % |
|---|---|---|---|
| NIKKEI 225 | 470.9 | 38405.66 | 1.24 |
| Hang Seng | 16.12 | 17763.03 | 0.09 |
| KOSPI | 4.62 | 2692.06 | 0.17 |
| ASX 200 | 26.7 | 7664.1 | 0.35 |
| DAX | -186.15 | 17932.17 | -1.03 |
| CAC 40 | -80.22 | 7984.93 | -0.99 |
| Dow Jones | -570.17 | 37815.92 | -1.49 |
| S&P 500 | -80.48 | 5035.69 | -1.57 |
| NASDAQ Composite | -325.26 | 15657.82 | -2.04 |
| Pare | Closed | Change, % |
|---|---|---|
| AUDUSD | 0.64745 | -1.41 |
| EURJPY | 168.264 | 0.57 |
| EURUSD | 1.06678 | -0.5 |
| GBPJPY | 197.022 | 0.43 |
| GBPUSD | 1.24923 | -0.56 |
| NZDUSD | 0.58893 | -1.5 |
| USDCAD | 1.37709 | 0.82 |
| USDCHF | 0.91913 | 0.94 |
| USDJPY | 157.715 | 0.99 |
- USD/CAD trades on a positive note near 1.3778 in Wednesday’s early Asian session.
- The Fed is expected to leave its benchmark rate unchanged on Wednesday.
- The Canadian economy expanded by 0.2% MoM in February, compared to the previous reading of 0.5%.
The USD/CAD pair holds positive ground around 1.3778 on Wednesday during the early Asian trading hours. The weaker-than-expected Canada’s February Gross Domestic Product (GDP) data weighs on the Loonie. Meanwhile, the firmer US Dollar (USD) above 106.30 remains to support the pair for the time being.
Investors will closely monitor the US Federal Reserve's (Fed) interest rate decision on Wednesday, with no change in rate expected. Also, Fed Chair Jerome Powell’s press conference might offer some hints about the future monetary policy outlook. The higher-for-longer rate narrative might boost the Greenback further and create a tailwind for the USD/CAD pair. According to the CME FedWatch Tool, financial markets are now pricing in nearly 44% chance that the Fed will cut the rate in September, down from 60% at the start of the week.
Apart from the Fed rate decision on Wednesday, the US ADP Employment Change, US ISM Manufacturing PMI, and Canadian S&P Global Manufacturing PMI will be due. Data released on Tuesday showed that the US Conference Board's Consumer Confidence Index for April fell to the lowest level since July 2022 at 97.0 from 103.1 in March. Furthermore, the Employment Cost Index in the US rose by 1.2% YoY in the first quarter of 2024, compared to a 0.9% rise in Q4 of 2023. This figure came in above the market consensus of 1.0%.
On the CAD’s front, Canada's economy weakened in the first quarter of this year, prompting expectations that the Bank of Canada's (BoC) might cut interest rates in June. The Canadian Gross Domestic Product (GDP) grew at a slower pace of 0.2% MoM in February, compared to the previous reading of 0.5%, weaker than the market expectation of 0.3% expansion, according to Statistics Canada. Meanwhile, the decline of oil prices exerts some selling pressure on the commodity-linked Loonie, as Canada is the largest crude oil exporter to the US.


© 2000-2026. All rights reserved.
This site is managed by Teletrade D.J. LLC 2351 LLC 2022 (Euro House, Richmond Hill Road, Kingstown, VC0100, St. Vincent and the Grenadines).
The information on this website is for informational purposes only and does not constitute any investment advice.
The company does not serve or provide services to customers who are residents of the US, Canada, Iran, The Democratic People's Republic of Korea, Yemen and FATF blacklisted countries.
Making transactions on financial markets with marginal financial instruments opens up wide possibilities and allows investors who are willing to take risks to earn high profits, carrying a potentially high risk of losses at the same time. Therefore you should responsibly approach the issue of choosing the appropriate investment strategy, taking the available resources into account, before starting trading.
Use of the information: full or partial use of materials from this website must always be referenced to TeleTrade as the source of information. Use of the materials on the Internet must be accompanied by a hyperlink to teletrade.org. Automatic import of materials and information from this website is prohibited.
Please contact our PR department if you have any questions or need assistance at pr@teletrade.global.
transfers