- Analytics
- News and Tools
- Market News
CFD Markets News and Forecasts — 30-04-2024
- GBP/USD trades on a weaker note near 1.2490 on Wednesday.
- US Fed is anticipated to hold rates steady in its 5.25%–5.50% range for the sixth straight meeting on Wednesday.
- The dovish remarks of the BoE weigh on the Cable.
The GBP/USD pair holds below 1.2490 during the early Asian session on Wednesday. The downtick of the major pair is supported by the stronger US Dollar (USD) amid the cautious mood ahead of the US Federal Reserve's (Fed) interest rate decision later on Wednesday.
On Tuesday, the US Conference Board's (CB) Consumer Confidence dropped to 97.0 in April from 103.1 in the previous reading, the lowest level since July 2022. Meanwhile, the Chicago Purchasing Managers' Index fell to 37.9 in April from 41.4 in March, below the market consensus of 44.9. This figure registered the lowest level since November 2022. Finally, the US Employment Cost Index (ECI) rose by 1.2% QoQ in Q1 2024 from a 0.9% rise in Q4 of 2023, beating the estimation of 1%.
The US Fed is widely expected to hold rates steady for the sixth straight meeting on Wednesday. JPMorgan and Goldman Sachs anticipate the first cut in July, while Wells Fargo doesn’t expect the first cut until September. Investors are now pricing in nearly 44% odds that the Fed will cut the rate in September, down from 60% at the beginning of the week, according to the CME FedWatch Tool. Market players will take more cues from Fed Chair Jerome Powell's Press Conference. The hawkish tone from the Fed might boost the Greenback and weigh on the GBP/USD pair.
On the other hand, the dovish stance of the Bank of England (BoE) exerts some selling pressure on the Pound Sterling (GBP). BoE Governor Andrew Bailey is confident about cooling down inflation in the UK and sees market expectations for two or three rate cuts this year. Financial markets have priced in the first rate cut from the BoE in August, with 50 basis points (bps) expected.
- Euro slips to near-term lows as risk-off markets bid Greenback.
- European markets will be largely dark on Wednesday.
- Midweek Fed rate call on the cards.
EUR/USD slid below the 1.0670 level on Tuesday after an unexpected uptick in US wages growth reignited fears of sticky inflation, chopping down rate cut expectations and sending investors into safe haven bids.
With European markets broadly shuttered on Wednesday for Labour Day, investors will be left to focus on the Federal Reserve’s (Fed) latest rate call. Markets are broadly expecting the Fed to hold rates steady for the time being, but market participants will be actively looking for firmer policy guidance from the US central bank as inflation fears and a steep downturn in US economic growth figures plague market sentiment.
US housing prices and wage costs for businesses both showed acceleration on Tuesday, while consumer and business sentiment surveys turn sharply lower at the same time. Investors are grappling with the prospect of a stagnant economy with too-high inflation that will hobble the Fed’s ability to cut rates at the higher pace that investors have been hoping for since the start of 2024.
According to the CME’s FedWatch Tool, rate markets now only see a single rate quarter-point rate cut from the Fed for the year, with a 54% chance of no rate cut in September and only a 57% chance of a 25-basis-point rate trim at the Fed’s November policy meeting.
EUR/USD technical outlook
EUR/USD’s decline on Tuesday firmly knocked the pair below the 200-hour Exponential Moving Average (EMA) at 1.0800 as the pair tests into fresh weekly lows and in striking distance of a supply zone near 1.0660.
The pair is approaching April’s low bids near the 1.0600 handle, and EUR/USD is down around 2% from the last swing high at 1.0885.
EUR/USD hourly chart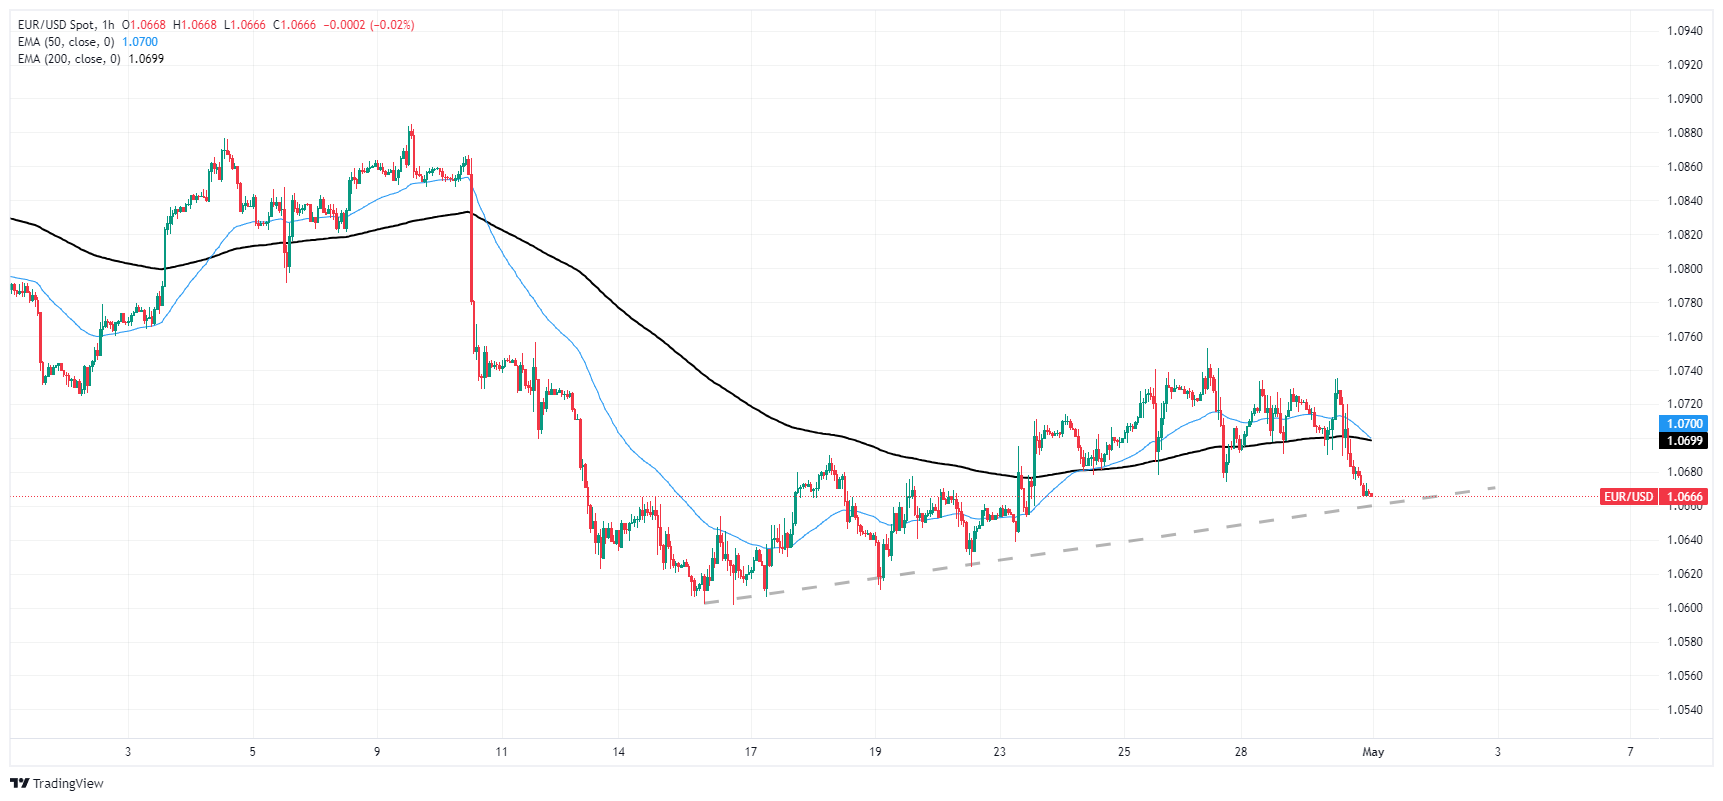
EUR/USD daily chart
The New Zealand Unemployment Rate in the first quarter (Q1) of 2024 climbed to 4.3% from 4.0% in the fourth quarter, according to data published by Statistics New Zealand on Wednesday. The market consensus was a 4.2% print in the reported period.
Additionally, the Employment Change dropped by 0.2% in the first quarter from a 0.4% rise in the previous reading. This figure came in worse than the expectation of a 0.3% increase.
Market reaction
Following the New Zealand (NZ) Q1 employment report, the NZD/USD pair is trading lower 0.19% on the day at 0.5875, as of writing.
About New Zealand's Unemployment Rate
The Unemployment Rate released by Statistics New Zealand is the percentage of unemployed workers in the total civilian labor force. If the rate goes up, it indicates a lack of expansion within the New Zealand labor market and weakness in the New Zealand economy. Generally, a decrease in the figure is seen as bullish for the New Zealand Dollar (NZD), while an increase is seen as negative bearish.
New Zealand Dollar FAQs
The New Zealand Dollar (NZD), also known as the Kiwi, is a well-known traded currency among investors. Its value is broadly determined by the health of the New Zealand economy and the country’s central bank policy. Still, there are some unique particularities that also can make NZD move. The performance of the Chinese economy tends to move the Kiwi because China is New Zealand’s biggest trading partner. Bad news for the Chinese economy likely means less New Zealand exports to the country, hitting the economy and thus its currency. Another factor moving NZD is dairy prices as the dairy industry is New Zealand’s main export. High dairy prices boost export income, contributing positively to the economy and thus to the NZD.
The Reserve Bank of New Zealand (RBNZ) aims to achieve and maintain an inflation rate between 1% and 3% over the medium term, with a focus to keep it near the 2% mid-point. To this end, the bank sets an appropriate level of interest rates. When inflation is too high, the RBNZ will increase interest rates to cool the economy, but the move will also make bond yields higher, increasing investors’ appeal to invest in the country and thus boosting NZD. On the contrary, lower interest rates tend to weaken NZD. The so-called rate differential, or how rates in New Zealand are or are expected to be compared to the ones set by the US Federal Reserve, can also play a key role in moving the NZD/USD pair.
Macroeconomic data releases in New Zealand are key to assess the state of the economy and can impact the New Zealand Dollar’s (NZD) valuation. A strong economy, based on high economic growth, low unemployment and high confidence is good for NZD. High economic growth attracts foreign investment and may encourage the Reserve Bank of New Zealand to increase interest rates, if this economic strength comes together with elevated inflation. Conversely, if economic data is weak, NZD is likely to depreciate.
The New Zealand Dollar (NZD) tends to strengthen during risk-on periods, or when investors perceive that broader market risks are low and are optimistic about growth. This tends to lead to a more favorable outlook for commodities and so-called ‘commodity currencies’ such as the Kiwi. Conversely, NZD tends to weaken at times of market turbulence or economic uncertainty as investors tend to sell higher-risk assets and flee to the more-stable safe havens.
- The daily indicators of the NZD/USD daily chart confirm a steady bearish momentum.
- Hourly indicators signal oversold conditions which could lead to a mild upwards correction.
- The failure to regain the 20-day SMA worsens the outlook of the buyers.
The NZD/USD pair plunged to 0.5890 on Tuesday as bears hit the gas and bulls seem to have given up their momentum gained in the last session. Selling conditions are more extreme in the hourly charts as indicators signal oversold conditions which could lead to an upwards correction in the near tearm.
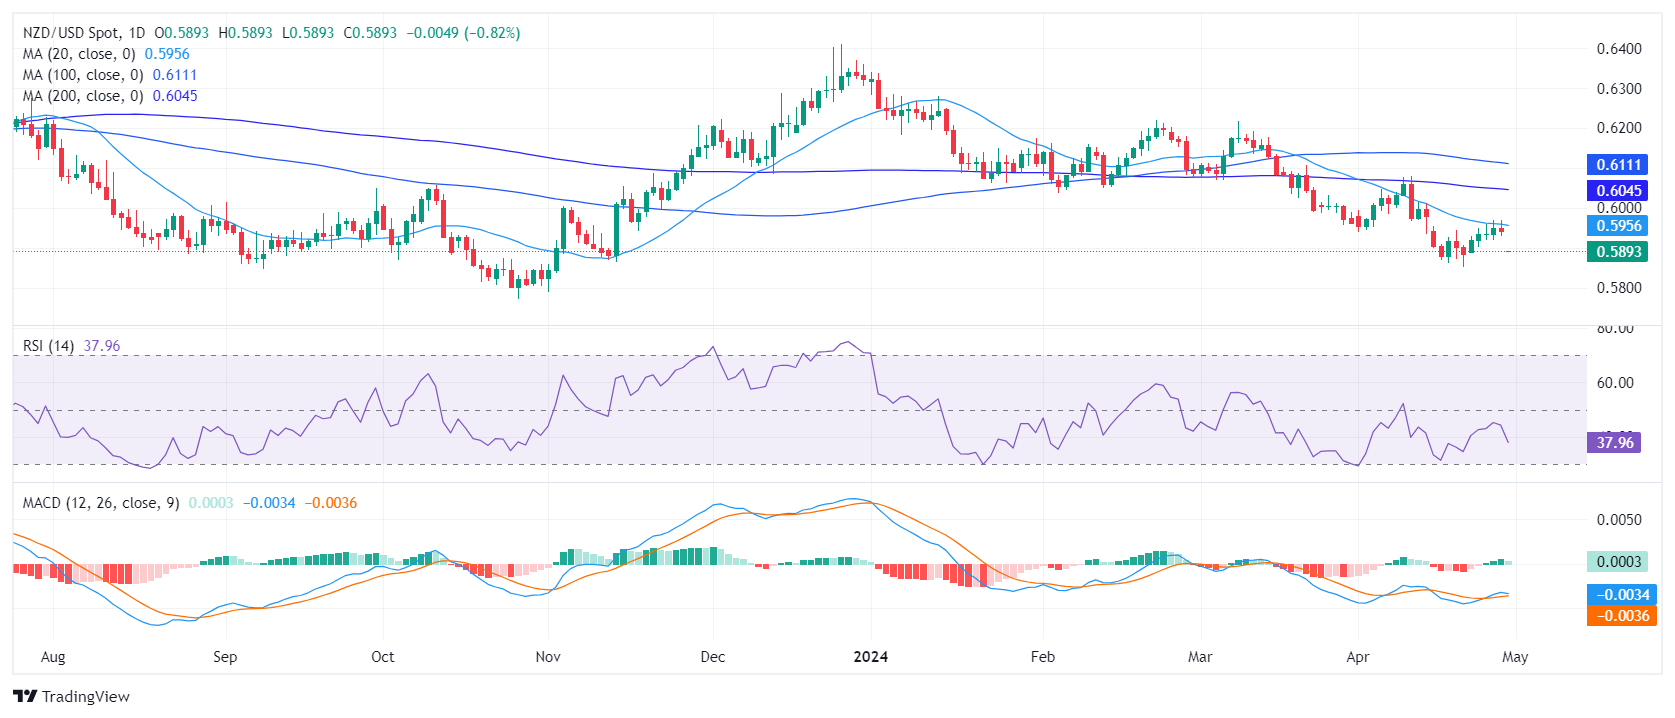
The daily Relative Strength Index (RSI) for the NZD/USD is in the negative territory. The most recent reading signals sellers are currently dominating the market, with a downward trend. Regarding the Moving Average Convergence Divergence (MACD), the decreasing green bars confirm this bearish momentum with the bullish impulse nowhere to be found.
NZD/USD daily chart
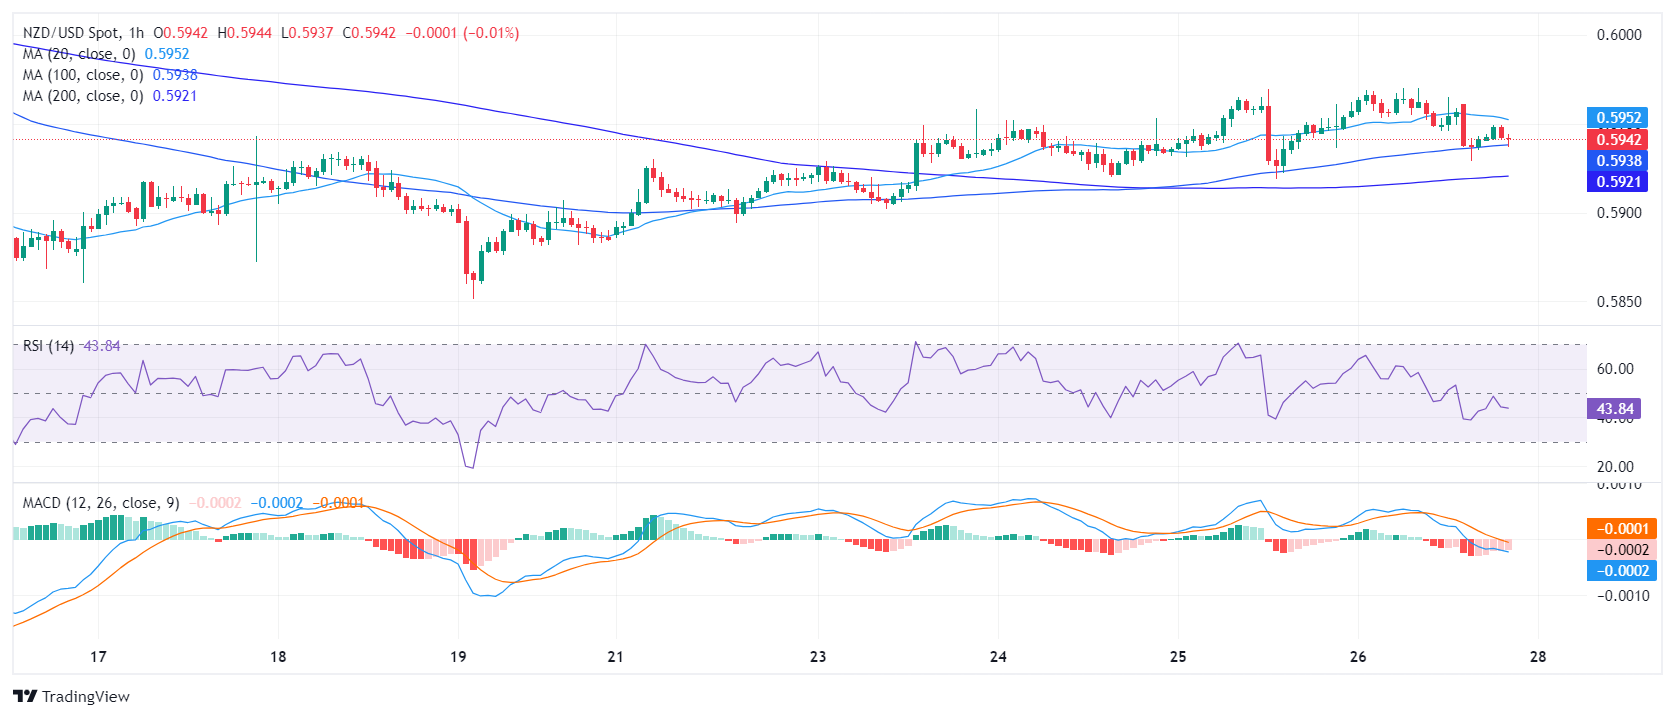
On the hourly chart, the RSI shows stronger oversold conditions in the most recent hours. However, the hourly MACD, indicated by flat red bars on the histogram, shows a flattening bearish momentum. Notably, despite the oversold condition, buyers have not yet stepped in with enough strength to shift the momentum toward the green zone but they might in the next hours.
NZD/USD hourly chart
Regarding the larger scope, the NZD/USD displays a bearish trend, evidenced by its position below the Simple Moving Averages (SMA) for the 20, 100, and 200-day periods. After getting rejected by the 20-day SMA multiple times in the last sessions, the outlook is confirmed to be bearish as the time of the buyers seems to be fading. In addition, after failing to conquer that crucial resistance, leaves the pair bound for additional downside. However, ahead of the Asian session, there could be a minor upward correction to consolidate the overextended downward movements seen on the hourly chart.
- WTI tumbles to $81.00 per barrel as risk appetite withers.
- US inflation remains problematic for rate cut hopes.
- API barrel counts climbed 4.906 million.
West Texas Intermediate (WTI) US Crude Oil fell on Tuesday, declining to $81.00 per barrel as investors pulled out of riskier assets and into safe havens like the US Dollar (USD) following an unexpected uptick in wages data, implying inflation will continue to eat away at chances for a near-term rate cut from the Federal Reserve.
The American Petroleum Insitute (API) reported a week-on-week increase of 4.906 million barrels in US Crude Oil supplies as US production continues to outpace demand. According to API data, US Crude Oil stocks through the week ended April 26th are up 6.514 million barrels for the month of April.
The US Chicago Purchasing Managers Index (PMI) unexpectedly declined to 37.9 in April, down from the forecast 44.9 and declining from the previous month’s 41.4. The downbeat activity outlook throws cold water on investors that are getting the worst of both worlds when it comes to rate cut hopes: the decline in US economic activity is picking up speed, boding poorly for equity markets, while inflation pressures remain stubbornly high, hobbling the Fed’s abilities to deliver rate cuts.
WTI technical outlook
WTI has fallen back to a familiar supply zone near $81.00 as bullish momentum in US Crude Oil remains limited. WTI pivoted into a selloff after failing to hold onto the $84.00 level last week, and a pattern of lower highs is plaguing the technical chart since the last swing high peaked near $87.00 at the beginning of April.
Daily candlesticks are poised for a return to the 200-day Exponential Moving Average (EMA) at $79.17. An extended downside push will see short sellers dragging WTI down to last December’s bottom bids near $68.00.
WTI hourly chart
WTI daily chart
- AUD/JPY declines 0.77% amid reactions to recent Bank of Japan interventions.
- Key support levels are at 101.35 and the April 25 low of 100.77, ahead of 100.00.
- Should the pair climb above 102.00, it might aim to retest resistance at 102.84 and potentially push towards the year-to-date high of 104.95.
The Aussie Dollar extends its losses against the Japanese Yen for the second straight day, following an intervention by the Bank of Japan (BoJ) on Monday, which kept the pair seesawing in the 101.37/104.95 range. Late in the North American session, the AUD/JPY trades at 102.18, down 0.77%.
AUD/JPY Price Analysis: Technical outlook
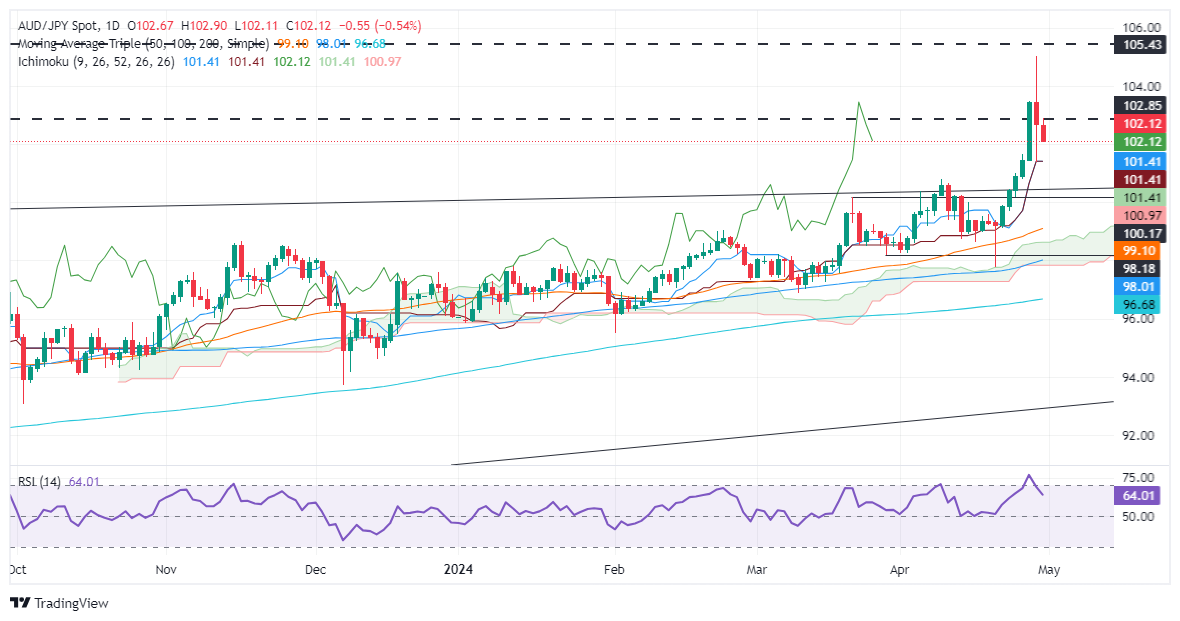
The AUD/JPY daily chart suggests the pair is upward biased despite retreating below the 103.00 figure. Subsequent losses are seen below the Tenkan and Kijun-Sen levels at 101.35, followed by the April 25 low at 100.77. A breach of the latter will expose the 100.00 threshold, followed by the April 22 low at 99.05.
On the other hand, the uptrend might resume if buyers hold the AUD/JPY exchange rate above 102.00. The first resistance would be the 2014 high at 102.84, followed by the 103.00 mark. Once cleared, the next stop would be the year-to-date (YTD) high at 104.95.
AUD/JPY Price Action – Daily Chart
The Reserve Bank of New Zealand's (RBNZ) latest Financial Stability Report (FSR) highlighted rising incomes aiding households to weather the current environment of higher interest rates, but admitted that many households are still reducing spending and extending payment periods in order to make ends meet.
The RBNZ also noted that New Zealand's domestic dairy industry is leaning on recent increases in dairy prices for survival, as well as a rise in non-performing business loans.
Eslewhere in the FSR, the RBNZ cautioned that there is a risk of long-term restrictive global interest rates due to persistent inflation.
About the RBNZ's Financial Stability Report
The Financial Stability Report, released by Reserve Bank of New Zealand, is published six-monthly. In the Financial Stability Report we assess and report on the soundness and efficiency of the New Zealand financial system.
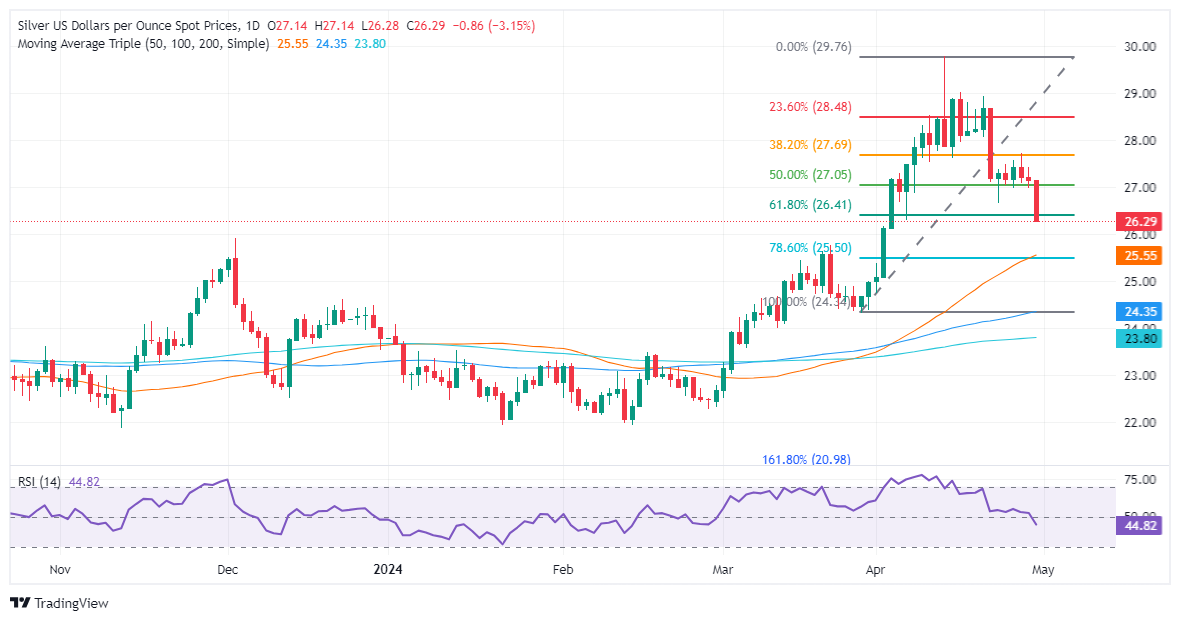
- Silver drops to $26.29 amid a strengthening US Dollar and rising Treasury yields, influenced by higher employment costs.
- Technical support is identified near $26.12, the high from May 5, 2023. Additional support might be found around the 78.6% Fibonacci retracement and the 50-day moving average at approximately $25.50/57.
- A rebound above $27.00 could set the stage for silver to target the recent high of $27.73 and challenge the $28.00 resistance level.
Silver's price dropped sharply late in the North American session, as the Greenback staged a comeback bolstered by the rise in US Treasury yields. The rise in the US Employment Cost Index (ECI) reignited talks that the Federal Reserve might delay its rate cuts due to inflation pressures. The XAG/USD trades at $26.29, down more than 3%.
XAG/USD Price Analysis: Technical outlook
The daily chart suggests the grey metal is upward biased despite Silver’s fall, which would likely see support emerging at $26.12, May 5, 2023, high. A breach of the latter will expose the confluence of the 78.6% Fibonacci retracement and the 50-day moving average (DMA) at around $25.50/57.
Otherwise, if XAG/USD recovers and edges back above the $27.00 figure, that could open the door to retesting higher prices. Subsequent gains are seen above the April 26 high at $27.73, followed by the $28.00 figure.
XAG/USD Price Action – Daily Chart
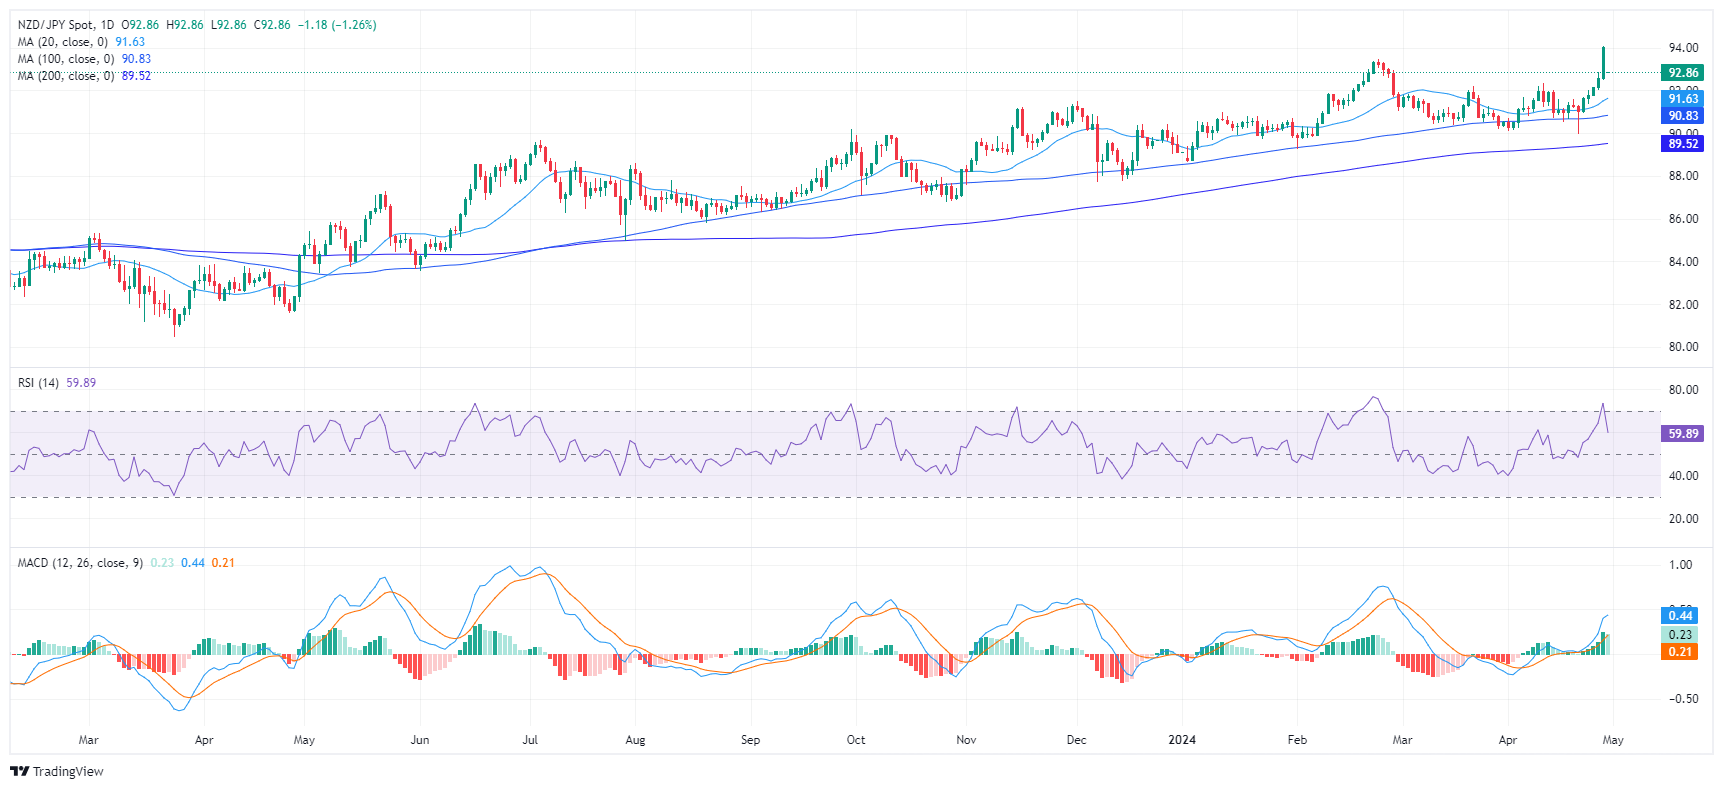
- The daily RSI for the NZD/JPY shows a decreasing trend, hinting at a growing bearish bias.
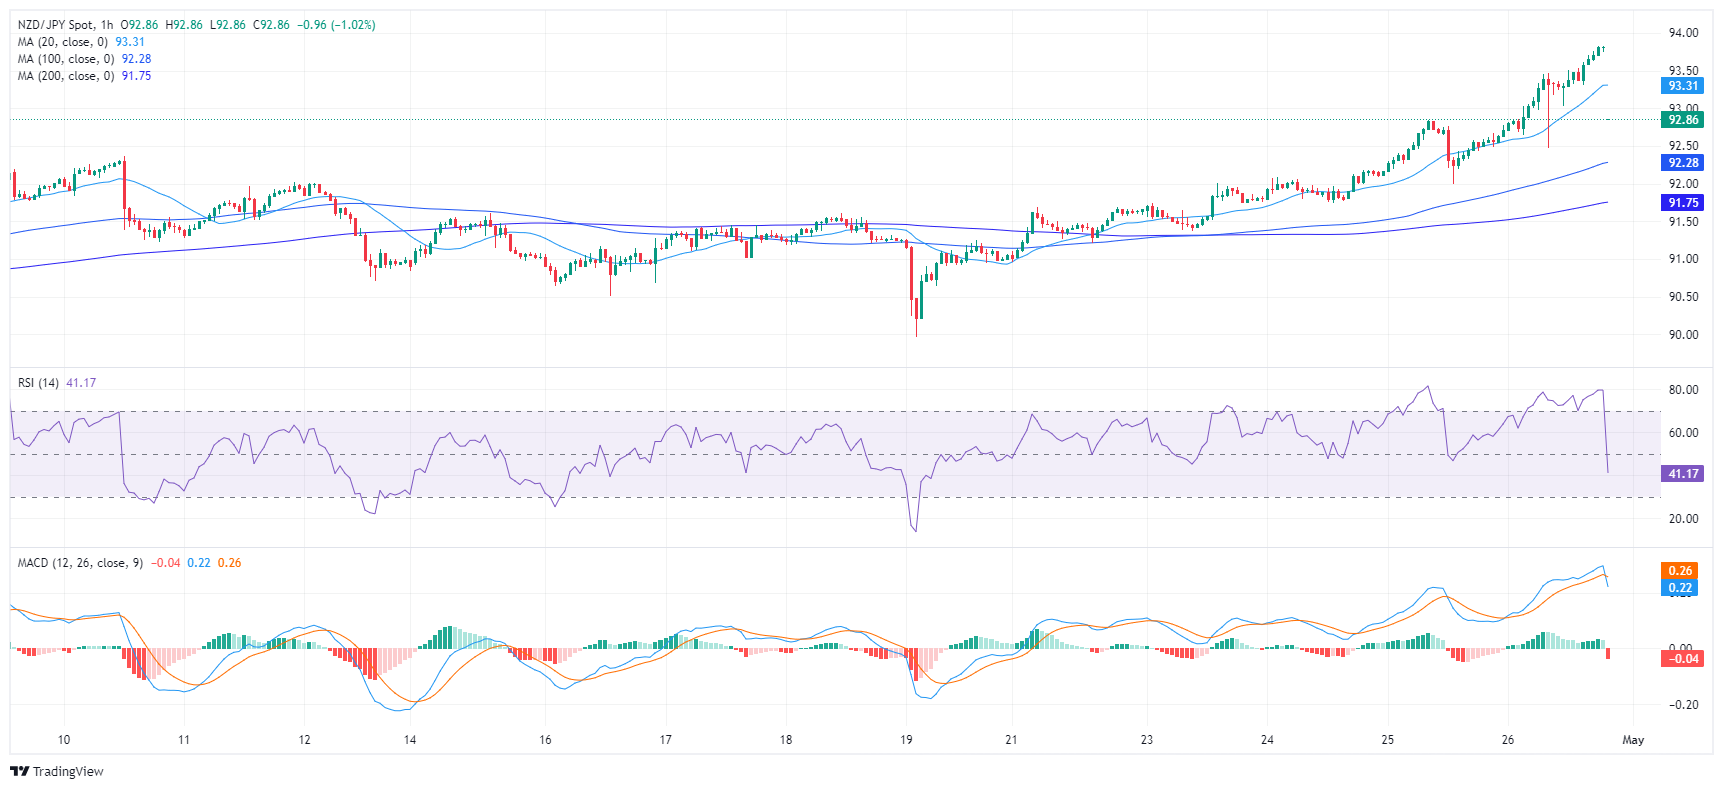
- On the hourly chart, both RSI and MACD reflect a growing bearish tendency, supporting the daily chart's sentiment.
- Any movements that leave the pair above its 20-day SMA won’t challenge the bullish outlook.
The NZD/JPY pair is down by 0.45% on Tuesday, trading at 92.99. Despite some bearish undertones, the NZD/JPY maintains a long-term bullish trend above its principal Simple Moving Averages (SMAs). There is potential for short-term momentum shifts, as investors are stepping back to take profits after propelling the pair to highs since 2015 on Monday.
On the daily chart, the Relative Strength Index (RSI) for NZD/JPY has decreased over the previous sessions. The index moved from overbought terrain to below 70 indicating a possible reversal or slowdown in the buyer’s traction.
NZD/JPY daily chart
Moving to an intraday basis, the hourly chart presents a similar scenario. The RSI plunged into negative territory. Simultaneously, the Moving Average Convergence Divergence (MACD) printed a red bars signaling a rising negative momentum. This indicates that investors continued taking profits on Tuesday and that the sellers commanded the trades during the session.
NZD/JPY hourly chart
From a broader perspective, NZD/JPY remains bullish despite the downside as it remains above its Simple Moving Averages (SMA) of 20,100, and 200-day periods. However, if the bears manage to gather additional momentum they might reclaim the 20-day SMA which may worsen the outlook for the pair in case of being lost.
- Gold dips sharply to $2,296 in response to US data showing an increase in employment costs, indicating persistent inflationary pressure.
- A stronger US Dollar and higher Treasury yields contribute to XAU/USD decline as market anticipates cautious Fed approach to rate adjustments.
- Upcoming economic events, including ISM Manufacturing PMI and Fed's policy decision are highly anticipated by traders for further market direction.
Gold prices drop below the $2,300 threshold on Tuesday as data from the United States (US) show that employment costs are rising, thus putting upward pressure on inflation. Consequently, the US Federal Reserve (Fed) would need to be patient when lowering rates as stated two weeks ago by Fed Chair Jerome Powell.
XAU/USD trades at $2,296, down by more than 1.50% on Tuesday, amid rising US Treasury bond yields and a stronger US Dollar. Data from the US Bureau of Labor Statistics (BLS) witnessed a jump in the Employment Cost Index (ECI) in April. Besides that, American consumer sentiment deteriorated further, as revealed by the Conference Board in its April report.
Ahead of the week, the US economic docket will remain busy. Still, traders will focus mainly on the ISM Manufacturing PMI, the Fed’s monetary policy decision, and the US Nonfarm Payrolls report.
Daily digest market movers: Gold price creeps lower on high US Treasury yields, strong USD
- Gold’s drop is courtesy of the jump in US Treasury bond yields, a soft US Dollar. The US 10-year Treasury bond yield has risen five basis points (bps) to 4.665%, a headwind for the golden metal. At the same time, the Greenback, as measured by the US Dollar Index (DXY), has reclaimed the 106.00 milestone, up 0.52% to trade at 106.48.
- US Employment Cost Index (ECI), a measure of wages and benefits, increased by 1.2% QoQ after rising 0.9% at the end of 2023, exceeding forecasts of 1%, according to the Bureau of Labor Statistics (BLS). That would keep the Fed on its holding pattern as fears of inflation reaccelerating loom.
- US Conference Board (CB) Consumer Confidence dropped in April from 103.1 to 97, its lowest level since mid-2022, as Americans’ view of the job market and the outlook for the economy deteriorated.
- US economy continues to print mixed readings. Last week, the Gross Domestic Product (GDP) missed the mark. Still, inflationary data linked to the first quarter of 2024 sounded the alarm that the price trend is shifting to the upside, which might deter the Federal Reserve from easing policy sooner than expected.
- On May 3, the US Bureau of Labor Statistics (BLS) is expected to reveal April’s Nonfarm Payrolls figures, which are expected to come at 243K, below March’s 303K. The Unemployment Rate is estimated to stay at 3.8%, while Average Hourly Earnings would likely remain unchanged at 0.3% MoM.
- Data from the Chicago Board of Trade (CBOT) suggests that traders expect the fed funds rate to finish 2024 at 5.035%, down from 5.050% last Friday.
Technical analysis: Gold price slides beneath $2,300, eyes on $2,223
Gold price uptrend remains intact, though diving below the $2,300 mark could open the door for a deeper correction. If sellers keep XAU/USD prices below the April 23 daily low of $2,291, that will clear the path to challenge the next cycle high turned support at $2,223. Once those levels are cleared, up next would be $2,200.
On the way up, if XAU/USD reclaims $2,300, that would open the door to challenge the April 26 high of $2,352, so they can remain hopeful of challenging higher prices. The next resistance would be the $2,400 mark, followed by the April 19 high at $2,417 and the all-time high of $2,431.

Gold FAQs
Gold has played a key role in human’s history as it has been widely used as a store of value and medium of exchange. Currently, apart from its shine and usage for jewelry, the precious metal is widely seen as a safe-haven asset, meaning that it is considered a good investment during turbulent times. Gold is also widely seen as a hedge against inflation and against depreciating currencies as it doesn’t rely on any specific issuer or government.
Central banks are the biggest Gold holders. In their aim to support their currencies in turbulent times, central banks tend to diversify their reserves and buy Gold to improve the perceived strength of the economy and the currency. High Gold reserves can be a source of trust for a country’s solvency. Central banks added 1,136 tonnes of Gold worth around $70 billion to their reserves in 2022, according to data from the World Gold Council. This is the highest yearly purchase since records began. Central banks from emerging economies such as China, India and Turkey are quickly increasing their Gold reserves.
Gold has an inverse correlation with the US Dollar and US Treasuries, which are both major reserve and safe-haven assets. When the Dollar depreciates, Gold tends to rise, enabling investors and central banks to diversify their assets in turbulent times. Gold is also inversely correlated with risk assets. A rally in the stock market tends to weaken Gold price, while sell-offs in riskier markets tend to favor the precious metal.
The price can move due to a wide range of factors. Geopolitical instability or fears of a deep recession can quickly make Gold price escalate due to its safe-haven status. As a yield-less asset, Gold tends to rise with lower interest rates, while higher cost of money usually weighs down on the yellow metal. Still, most moves depend on how the US Dollar (USD) behaves as the asset is priced in dollars (XAU/USD). A strong Dollar tends to keep the price of Gold controlled, whereas a weaker Dollar is likely to push Gold prices up.
Following a negative start to the week, the Greenback managed to regain traction and lifted the USD Index (DXY) back above the 106.00 hurdle sustained by data and cautious trade ahead of the Fed’s interest rate decision on Wednesday.
Here is what you need to know on Wednesday, May 1:
The US Dollar bounced strongly amidst persistent prudence ahead of the imminent FOMC event on Wednesday. On May 1, weekly Mortgage Applications are due in the first turn, seconded by the ADP Employment Change, the final S&P Global Manufacturing PMI, Construction Spending and the ISM Manufacturing PMI. Finally, the FOMC interest rate decision is due ahead of Chair Powell’s press conference.
EUR/USD came under strong downside pressure and retreated to multi-day lows near 1.0670. The euro calendar will be closed on May 1.
GBP/USD saw its recent upside trimmed and revisited lows near the 1.2500 region on the back of the stronger Dollar. Across the Channel, Nationwide Housing Prices are expected on May 1 prior to the final S&P Global Manufacturing PMI.
USD/JPY regained buying interest and rapidly surpassed the 157.00 hurdle, as traders seem to have already left behind Monday’s suspected FX intervention. There are no scheduled data releases in the Japanese docket on May 1.
AUD/USD collapsed to multi-day lows south of 0.6500 the figure in response to the pick-up in the Dollar and the generalized weakness in the commodity complex. In Oz, the Ai Group Industry Index and the final Judo Bank Manufacturing PMI are due on May 1.
Prices of WTI added to the recent negative price action and broke below the $81.00 mark amidst the firm Dollar and prospects of a tighter-for-longer Fed.
Higher US yields and the intense bounce in the Greenback sponsored the second consecutive daily decline in Gold prices, which revisited the $2,290 region per troy ounce. Silver, in the same line, plummeted nearly 3% and retested the low $26.00s for the first time since early April.
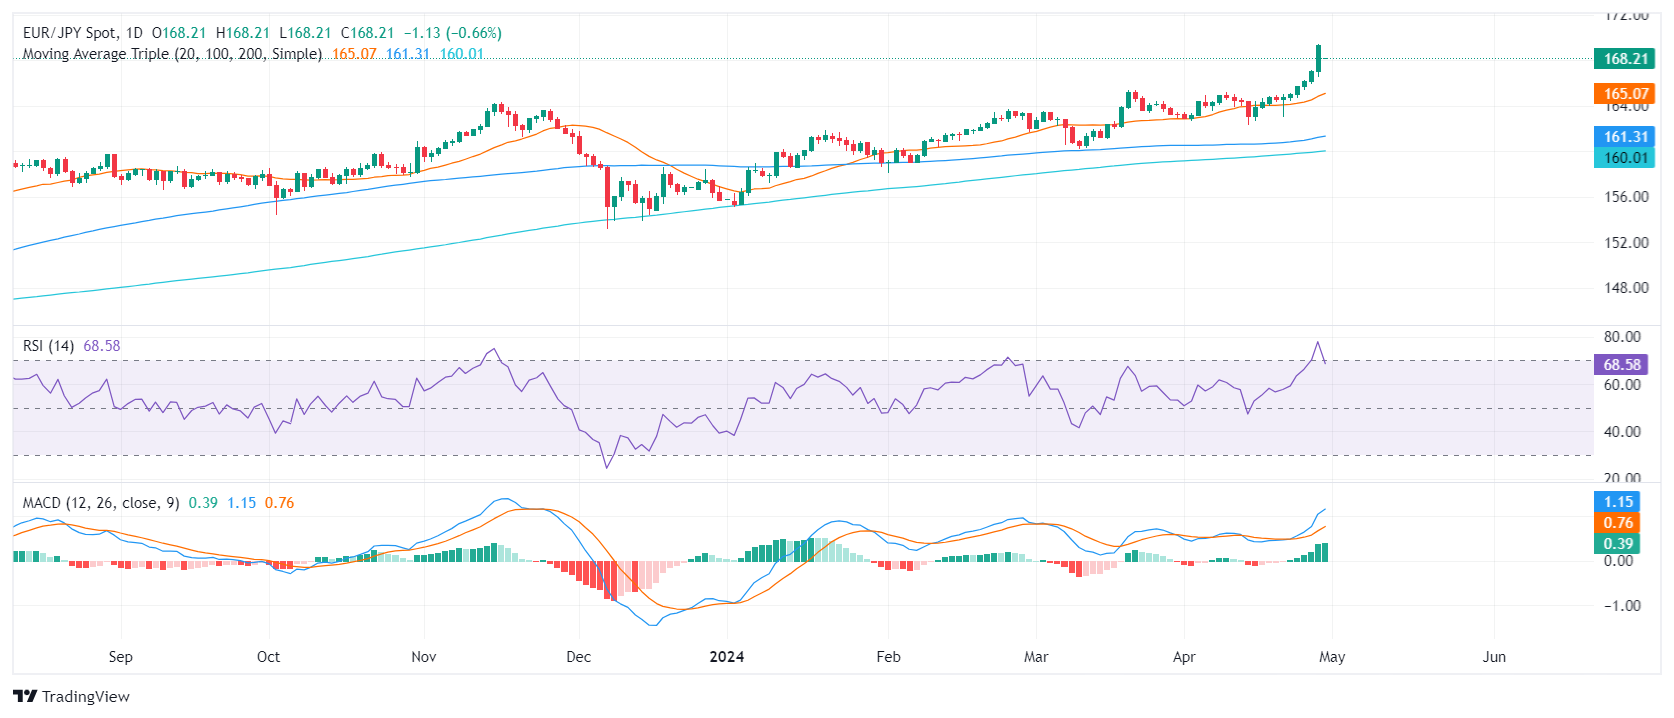
- Daily indicators are pulling back, but remain reem in positive zone.
- For the short-term, the hourly chart indicators reveal a continued bullish bias, with a possibility of minor retractions.
- Fundamentals favored the bears on Monday, and the Yen was one of the best-performing currencies.
The EUR/JPY pair stands at 168.11 under strong bull control, reflecting a steady uptrend with a 0.38% gain on Tuesday. Despite Monday’s sharp losses, the buyers are still in command with indicators near overbought territory on the daily chart, but bears are around the corner waiting their time.
On the daily chart, the Relative Strength Index (RSI) lies just below 70 while the Moving Average Convergence Divergence (MACD) histogram maintains a stable green outlook, signifying a stable positive momentum. Most recently, the RSI is deep in the positive territory, and along with a flat green MACD, indicates that buyers currently dominate the market; however, a near overbought signal suggests potential further consolidation or pullback in the next sessions.
EUR/JPY daily chart
Transitioning to the hourly chart, the RSI oscillates largely within a positive range. Together with the MACD printing decreasing green bars, it shows mild fluctuations but overall remains in favor of the buying force throughout the session. Compared to the daily chart, there appears to be a concordance of bullish sentiment, but with the hourly outlook hinting at possible minor retractions.
EUR/JPY hourly chart
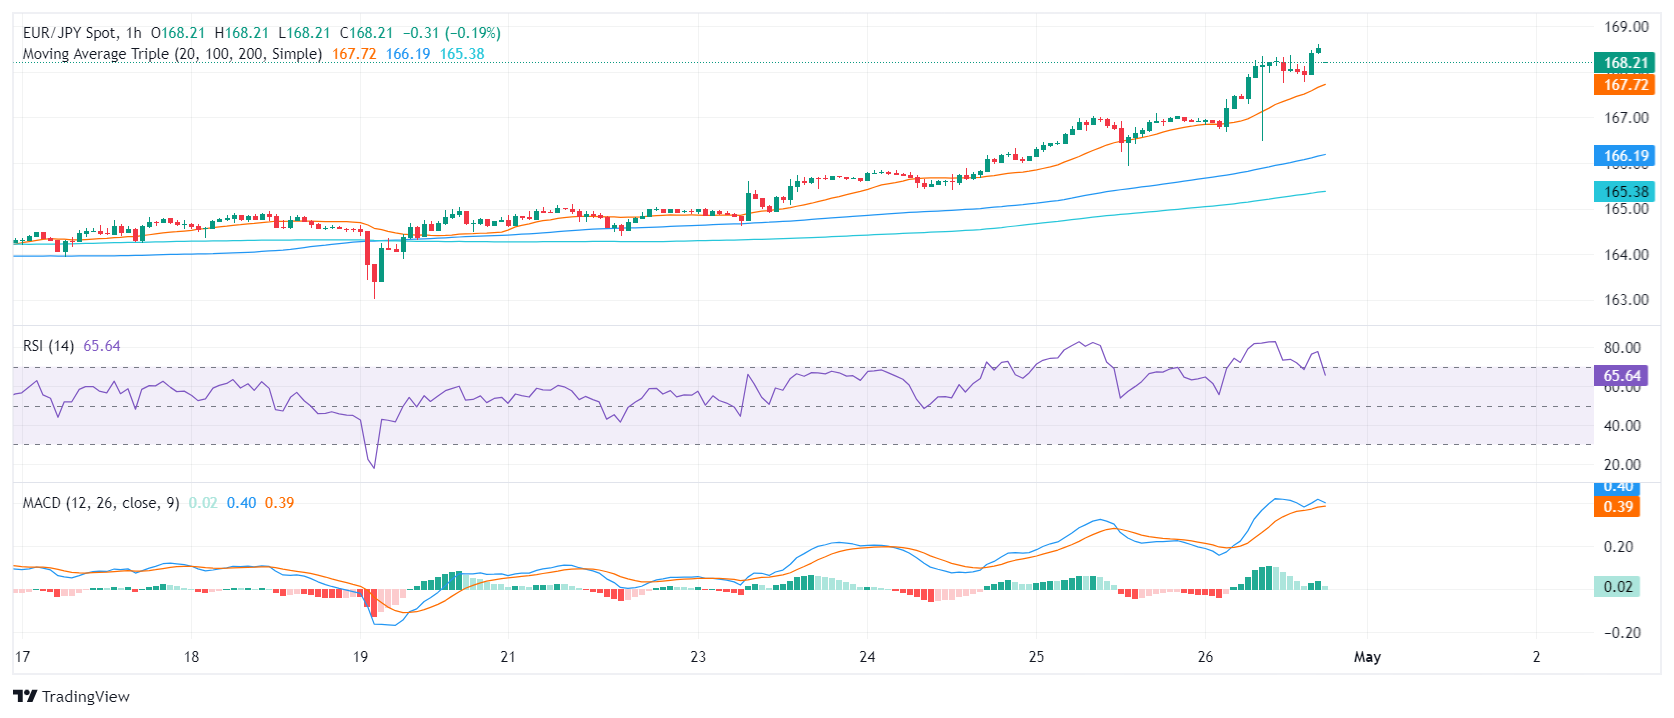
Regarding the broader outlook, it reveals that the EUR/JPY is trading above 20,100 and 200-day Simple Moving Averages (SMA). This still indicates the bull command not only in the short-term picture but significantly in the medium and long-term frames.
According to US Treasury Secretary Janet Yellen, inflation remains high but is assuring markets that data continues to point towards a recovery on US price growth and economic activity.
Key highlights
Yellen affirms it is "highly likely" that shelter inflation will fall in the next year.
Still-high inflation largely due to fading supply shocks.
People are generally better off despite price growth, but still have more work to do.
Higher steel tariffs on China seem appropriate.
The US needs to take "significant steps" to reduce budget deficit.
Yellen remains concerned about where the US is headed with deficit.
- BoJ rumored to intervene in FX markets, but no official confirmation.
- GBP/JPY slowly drifting higher after 700-pip tumble this week.
- Data remains thin for both the UK and Japan this week.
GBP/JPY is grinding its way back up the charts on Tuesday, testing chart territory north of 197.00 after the pair got knocked down from 34-year highs at 200.60 earlier this week. The pair settled near 193.75 and now bidders are returning to the fold, propping up the Guppy despite ongoing rumors that the Bank of Japan (BoJ) directly intervened in FX markets on behalf of the beleaguered Japanese Yen (JPY).
Yen sellers shrug off possible BoJ intervention
According to reporting by Bloomberg, it is likely the BoJ injected ¥5.5 trillion into currency markets after early Tuesday’s BoJ operations reporting showed a wide discrepancy between market forecasts and the BoJ’s reported current account. Investors expected BoJ market operations to amount to approximately ¥2.1 trillion, but the final report clocked in a wide gap, showing ¥7.56 trillion in financing operations.
Markets will be looking ahead to early Thursday’s latest Monetary Policy Meeting Minutes from the BoJ as investors look for signs the BoJ will finally be pushed off of its hyper-easy monetary policy perch and begin lifting interest rates.
GBP/JPY technical outlook
The Guppy continues to grind back bullish territory despite this week’s early plunge, and the pair is testing above the 197.00 handle after breaking through a firm demand zone near 193.00 last week. GBP/JPY’s 34-year peak at 200.60 remains a key target for bidders shrugging off possible BoJ intervention.
GBP/JPY remains in the green nearly 10% in 2024, and remains pinned deep in bull country after a bullish rejection from the 200-day Exponential Moving Average (EMA) in early January near 179.00.
GBP/JPY hourly chart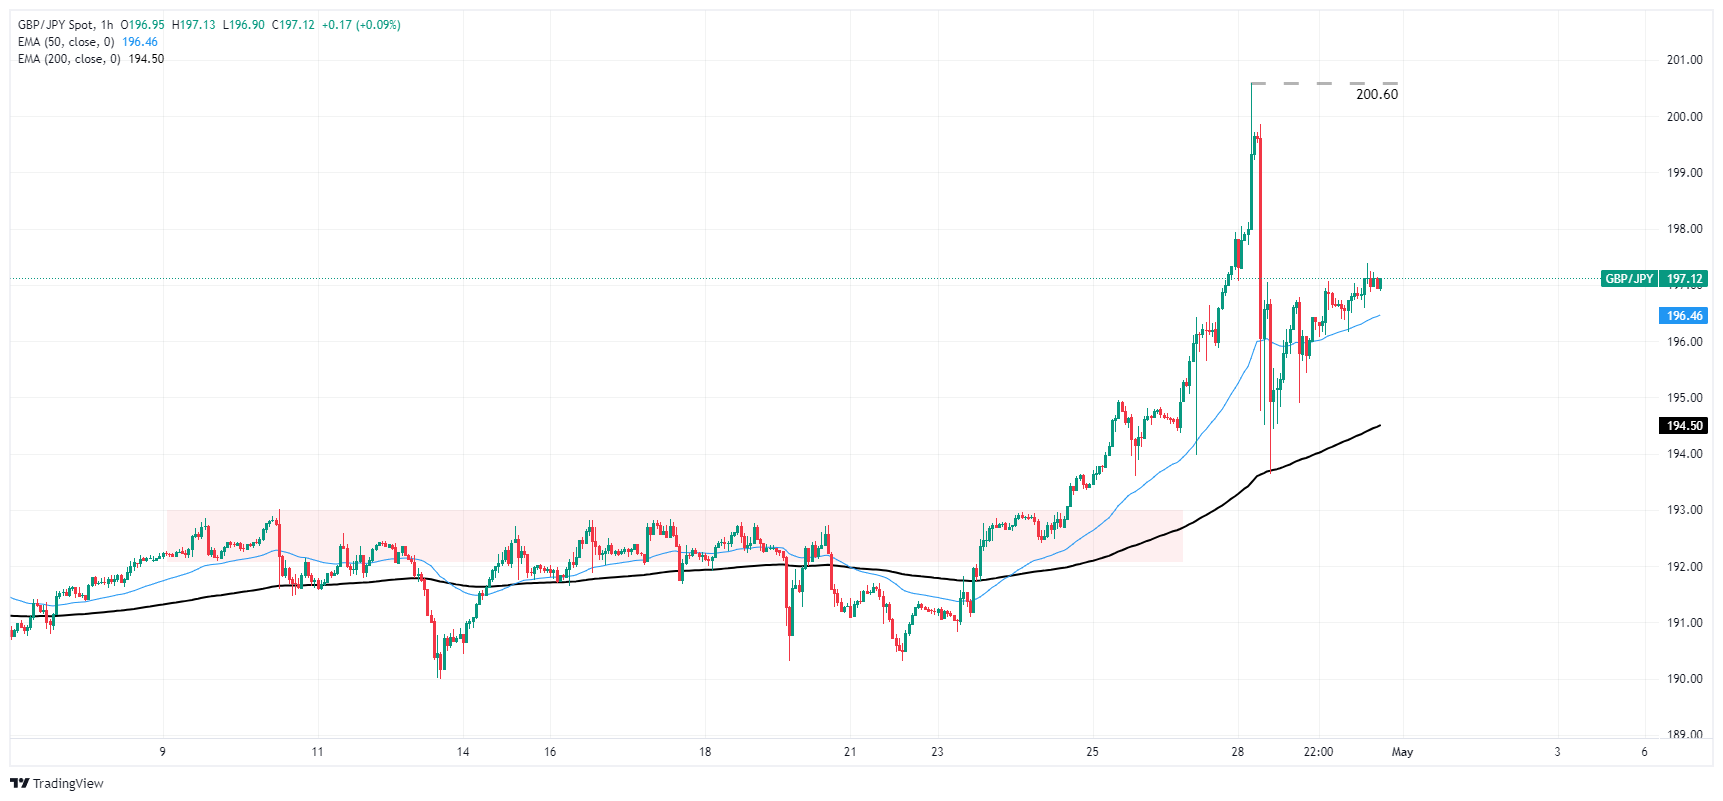
GBP/JPY daily chart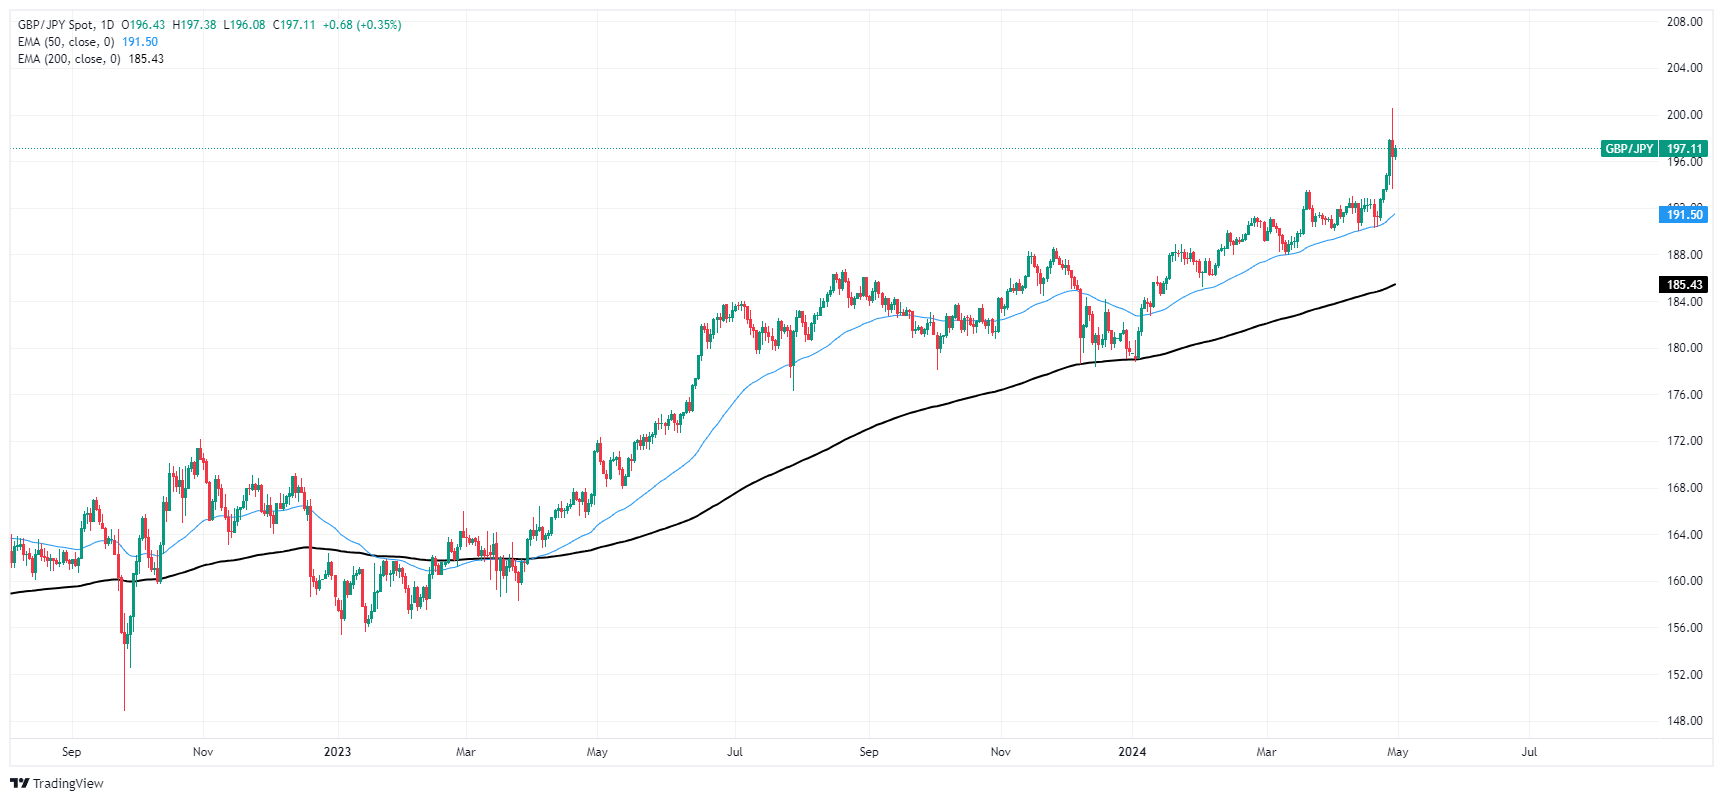
- Mexican Peso falls over 0.41% after Mexico's Q1 GDP growth underperforms expectations.
- Stronger-than-expected US Employment Cost Index bolsters US Dollar, diminishing prospect for imminent Fed rate cut.
- Despite quarterly GDP growth exceeding expectations in Mexico, annual figures fail to meet forecasts, contributing to Peso's decline.
The Mexican Peso tumbles more than 0.41% against the US Dollar on Tuesday, following the release of Mexico’s Gross Domestic Product (GDP) figures missing estimates for the first quarter on a yearly basis.
That alongside with a reacceleration of inflation, according to data revealed in the United States (US), weighed on the Mexican currency. The Greenback has recovered some ground though. At the time of writing, the USD/MXN trades at 17.08 after hitting a low of 16.95.
Mexico’s National Statistics Agency (INEGI) revealed that GDP for Q1 2024 grew 1.6% YoY, a slower pace than the 2.4% in the last quarter of 2023 and beneath estimates of 2.1%. However, on a quarterly basis, the country grew 0.2% higher than the previous reading of 0.1% and exceeded the consensus of 0%.
Across the border, the US economic docket was busy, as the Employment Cost Index (ECI) a measure used by the Federal Reserve to assess inflation on wages was higher than expected, decreasing the odds of a rate cut by Fed Chairman Jerome Powell and Co.
Recent data witnessed Consumer Confidence deteriorating in the US, according to April’s data by the Conference Board.
This week, the US economic docket will be busy, though the most significant events will be the releases of the ISM Manufacturing PMI and the Fed’s monetary policy decision on May 1, followed by the Nonfarm Payroll figures on Friday and the ISM Services PMI.
Daily digest market movers: Mexican Peso tumbles on soft GDP, strong US inflation data
- Data revealed in April showed that Mexico’s inflation was mixed as headline inflation rose, mostly attributed to a jump in Oil prices. Contrarily, underlying prices dipped, justifying the Bank of Mexico’s (Banxico) decision to lower rates.
- Although most analysts estimate Banxico will hold rates unchanged at 11.00%, new data could open the door for heated discussions among Banxico’s Governing Council members on May 9.
- Last week, Banxico Governor Victoria Rodriguez Ceja said the central bank would be data-dependent. However, weak GDP data could pave way for a “live meeting” on May 9.
- Citibanamex Survey showed that most analysts expect Banxico to hold rates unchanged at the May meeting. The median foresees a rate cut in June, while they estimate the main reference rate to end the year at 10.00%, up from 9.63% previously.
- A broad gauge of US labor costs closely watched by the Federal Reserve accelerated in the first quarter by more than forecast, illustrating persistent wage pressure that is keeping inflation elevated.
- US Employment Cost Index (ECI), a measure of wages and benefits, rose by 1.2% QoQ after rising 0.9% at the end of 2023, exceeding forecasts of 1%, according to Bureau of Labor Statistics (BLS). That would keep the Fed on its holding pattern as fears of inflation reaccelerating loom.
- US Conference Board (CB) Consumer Confidence dropped in April from 103.1 to 97, its lowest level since mid-2022 as Americans’ view of the job market and the outlook for the economy deteriorated.
- Fed is expected to keep rates unchanged at May 1 meeting, though traders will be eyeing Fed Chair Jerome Powell’s press conference. A hawkish tilt could trigger a jump in favor of the Greenback; otherwise, the USD/MXN could resume its downtrend.
- Data from the Chicago Board of Trade (CBOT) suggests that traders expect the fed funds rate to finish 2024 at 5.080%, up from 5.035% on Monday.
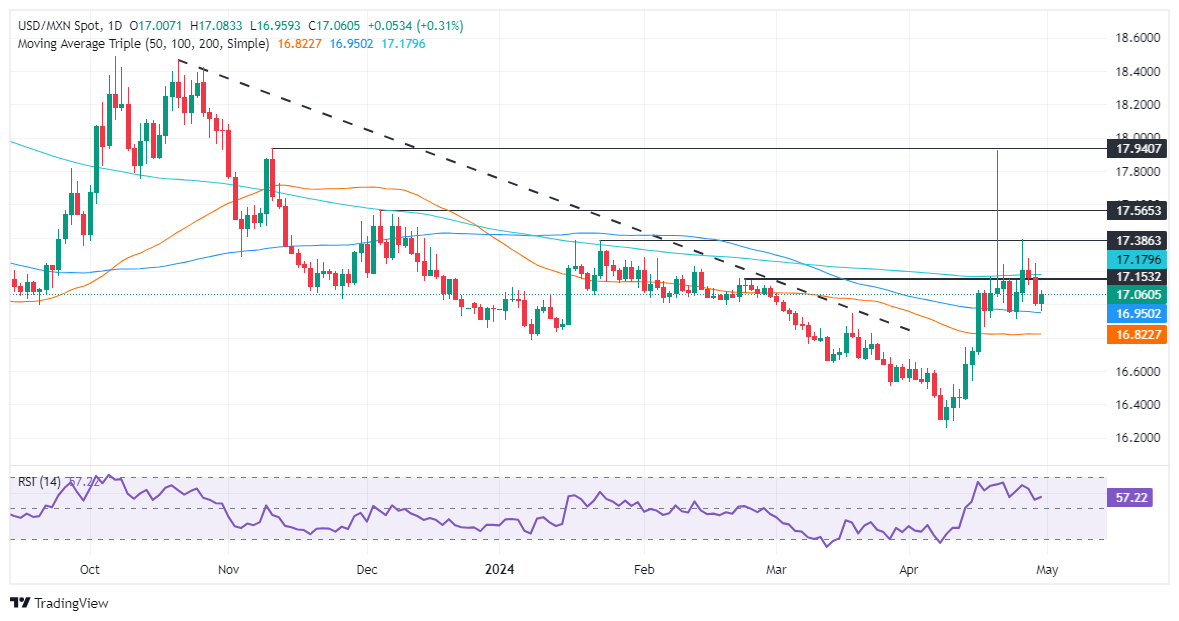
MXN technical analysis: Mexican Peso trips lower as USD/MXN edges toward 200-day SMA
The Mexican Peso is making a U-turn, depreciating on Tuesday as the USD/MXN edges up. Even though the pair sits below the weekly high of 17.24, it is approaching quickly toward the 200-day Simple Moving Average (SMA) at 17.17. Once surpassed, the next stop would be the January 23 swing high of 17.38, followed by the year-to-date (YTD) high of 17.92, ahead of 18.00.
On the other hand, if USD/MXN buyers fail to conquer the 200-day SMA, further losses are seen beneath the 17.00 threshold. Once cleared, the next stop would be the 50-day SMA at 16.81 before challenging last year’s low of 16.62.
Mexican Peso FAQs
The Mexican Peso (MXN) is the most traded currency among its Latin American peers. Its value is broadly determined by the performance of the Mexican economy, the country’s central bank’s policy, the amount of foreign investment in the country and even the levels of remittances sent by Mexicans who live abroad, particularly in the United States. Geopolitical trends can also move MXN: for example, the process of nearshoring – or the decision by some firms to relocate manufacturing capacity and supply chains closer to their home countries – is also seen as a catalyst for the Mexican currency as the country is considered a key manufacturing hub in the American continent. Another catalyst for MXN is Oil prices as Mexico is a key exporter of the commodity.
The main objective of Mexico’s central bank, also known as Banxico, is to maintain inflation at low and stable levels (at or close to its target of 3%, the midpoint in a tolerance band of between 2% and 4%). To this end, the bank sets an appropriate level of interest rates. When inflation is too high, Banxico will attempt to tame it by raising interest rates, making it more expensive for households and businesses to borrow money, thus cooling demand and the overall economy. Higher interest rates are generally positive for the Mexican Peso (MXN) as they lead to higher yields, making the country a more attractive place for investors. On the contrary, lower interest rates tend to weaken MXN.
Macroeconomic data releases are key to assess the state of the economy and can have an impact on the Mexican Peso (MXN) valuation. A strong Mexican economy, based on high economic growth, low unemployment and high confidence is good for MXN. Not only does it attract more foreign investment but it may encourage the Bank of Mexico (Banxico) to increase interest rates, particularly if this strength comes together with elevated inflation. However, if economic data is weak, MXN is likely to depreciate.
As an emerging-market currency, the Mexican Peso (MXN) tends to strive during risk-on periods, or when investors perceive that broader market risks are low and thus are eager to engage with investments that carry a higher risk. Conversely, MXN tends to weaken at times of market turbulence or economic uncertainty as investors tend to sell higher-risk assets and flee to the more-stable safe havens.
- Dow Jones tumbles as inflation concerns return to cloud rate cut hopes.
- US wage pressures increased, driving fresh inflation fears.
- Dow Jones backslides 300 points, at risk of falling below 38,000.
The Dow Jones Industrial Average (DJIA) declined alongside the other major US equity indexes as risk aversion strikes again just ahead of Wednesday’s latest Federal Reserve (Fed) rate call. The Fed’s two-day rate decision meetings started today, and investors are balking as the Fed kicks off rate discussions with a fresh batch of data suggesting inflation remains a sticky problem for the US.
US wage pressures and housing costs remain inflation risk
The US Employment Cost Index for the first quarter rose 1.2% QoQ, accelerating from the forecast uptick to 1.0% and the previous quarter’s 0.9%. The US S&P/Case-Shiller Home Price Indices for the year ended February rose 7.3%, above the forecast 6.7% and accelerating from the previous period’s 6.6%.
The Chicago Purchasing Managers Index (PMI) in April also fell to nearly a two-year low of 37.9, sharply lower than the forecast 44.9 and the previous month’s 41.4. The Consumer Board’s Consumer Confidence Index also declined to its lowest reading since July of 2022, falling to 97.0 from the previous month’s 103.1 (revised down from 104.7).
Read more: US CB Consumer Confidence declines to 97.0 in April
With housing inflation and wage growth continuing to outrun forecasts and expectations, hopes for near-term rate cuts from the Fed are evaporating, knocking risk appetite down at the knees. The Fed’s latest rate call is slated for 18:00 GMT on Wednesday, followed by a press conference at 18:30 and headed by Fed Chair Jerome Powell.
Dow Jones news
Market hopes for 2024 rate cuts have fallen steeply in the first half of the year. Investors kicked off January expecting around six rate cuts from the Fed through the year, and Tuesday’s inflation figures have knocked rate cut expectations all the way down to a single 25-basis-point cut in 2024. Markets now see a 51% chance of no rate cut in September, making November the current market favorite bet for a first rate trim.
Nearly all of the securities that make up the Dow Jones are in the red on Tuesday, with the only notable gainer in 3M Co. (MMM), which is up around 3.5% on the day after the company posted better-than-expected earnings. MMM is trading into $95.34 per share. Tuesday’s worst DJIA security is Caterpillar Inc. (CAT), which backslid nearly 4$ and traded down 13 points into $337.00 per share.
Dow Jones technical outlook
The Dow Jones set an early high of 38,385.32 on Tuesday before risk aversion gripped investors, dragging the DJIA down to a low of 38,028.81. The major equity index is poised for a continued decline below 38,000.00.
The Dow Jones faces a technical rejection from the 200-hour Exponential Moving Average (EMA) at 38,337.24. Downside pressures are clear until the last near-term swing low into 37,750.00, while the index remains down 1.3% from last week’s peak bids near 38,550.00.
Dow Jones five-minute chart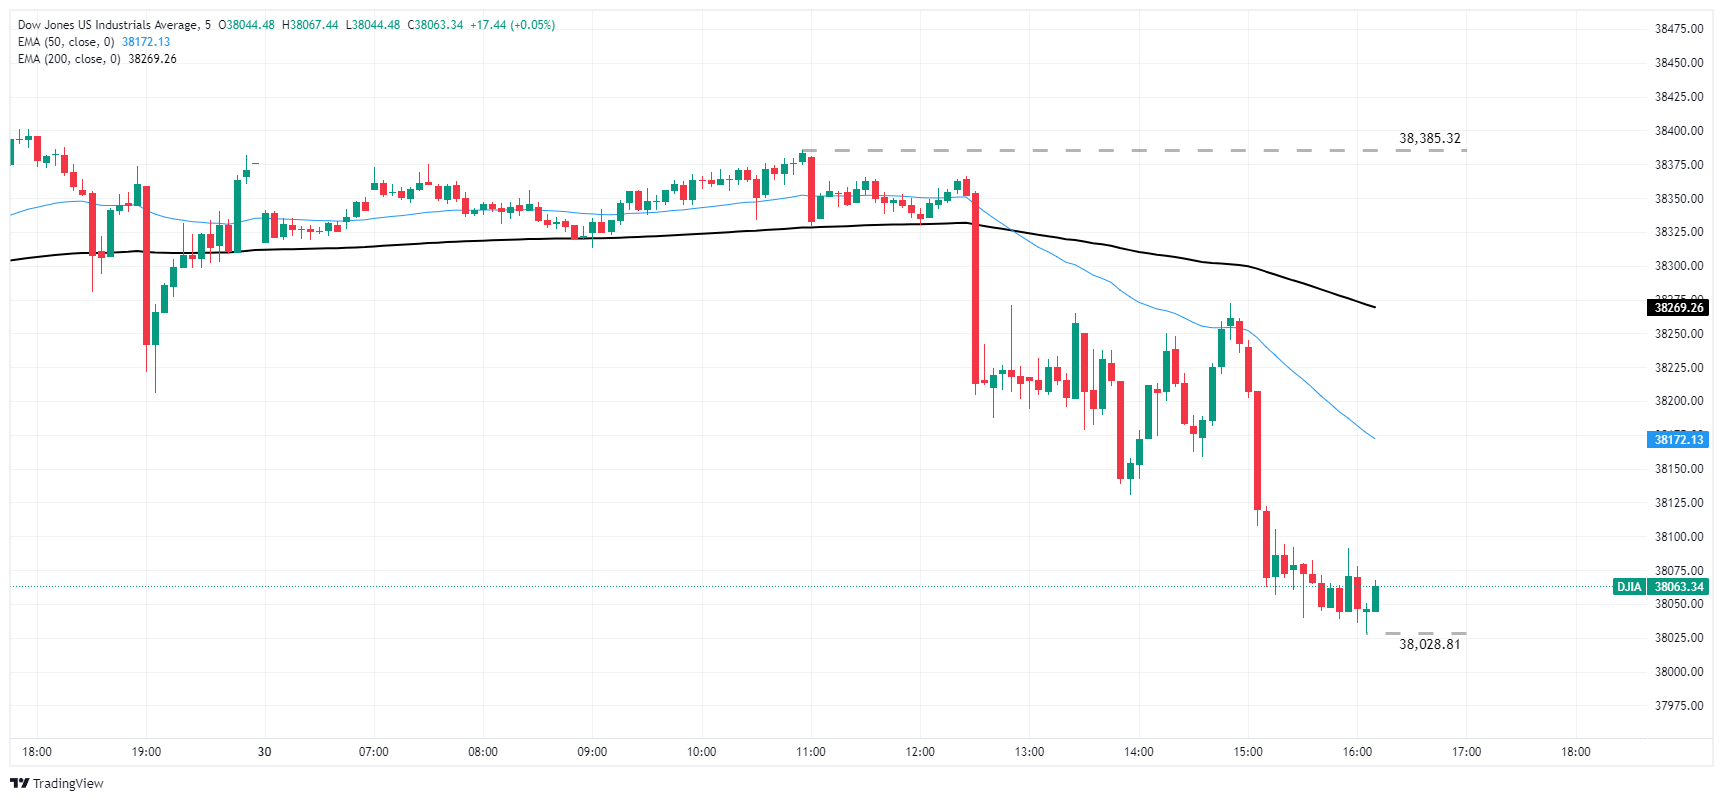
Dow Jones hourly chart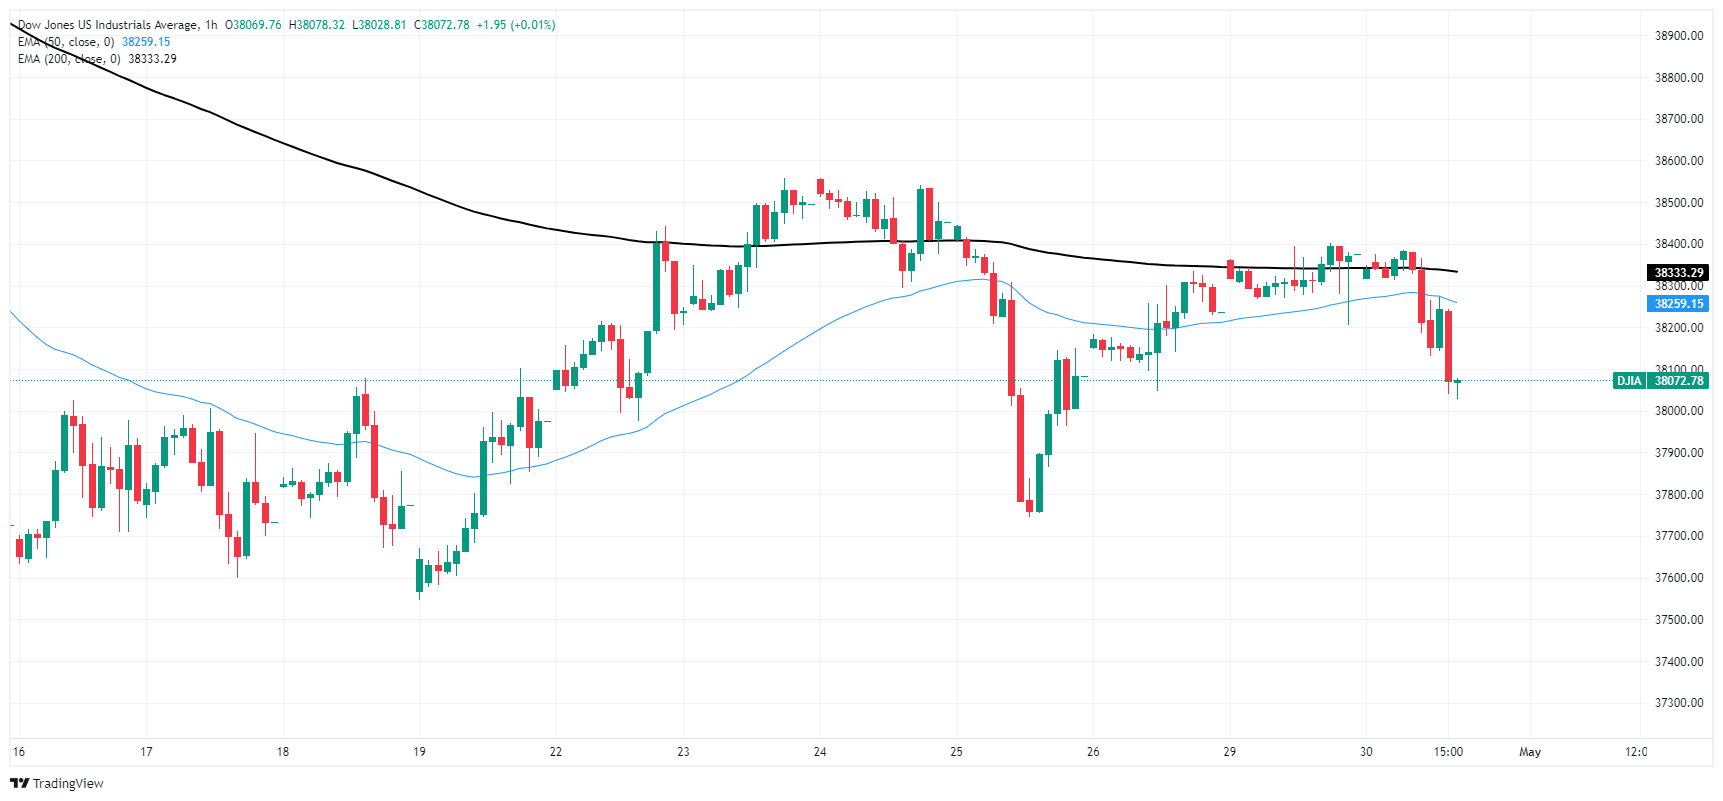
Dow Jones FAQs
The Dow Jones Industrial Average, one of the oldest stock market indices in the world, is compiled of the 30 most traded stocks in the US. The index is price-weighted rather than weighted by capitalization. It is calculated by summing the prices of the constituent stocks and dividing them by a factor, currently 0.152. The index was founded by Charles Dow, who also founded the Wall Street Journal. In later years it has been criticized for not being broadly representative enough because it only tracks 30 conglomerates, unlike broader indices such as the S&P 500.
Many different factors drive the Dow Jones Industrial Average (DJIA). The aggregate performance of the component companies revealed in quarterly company earnings reports is the main one. US and global macroeconomic data also contributes as it impacts on investor sentiment. The level of interest rates, set by the Federal Reserve (Fed), also influences the DJIA as it affects the cost of credit, on which many corporations are heavily reliant. Therefore, inflation can be a major driver as well as other metrics which impact the Fed decisions.
Dow Theory is a method for identifying the primary trend of the stock market developed by Charles Dow. A key step is to compare the direction of the Dow Jones Industrial Average (DJIA) and the Dow Jones Transportation Average (DJTA) and only follow trends where both are moving in the same direction. Volume is a confirmatory criteria. The theory uses elements of peak and trough analysis. Dow’s theory posits three trend phases: accumulation, when smart money starts buying or selling; public participation, when the wider public joins in; and distribution, when the smart money exits.
There are a number of ways to trade the DJIA. One is to use ETFs which allow investors to trade the DJIA as a single security, rather than having to buy shares in all 30 constituent companies. A leading example is the SPDR Dow Jones Industrial Average ETF (DIA). DJIA futures contracts enable traders to speculate on the future value of the index and Options provide the right, but not the obligation, to buy or sell the index at a predetermined price in the future. Mutual funds enable investors to buy a share of a diversified portfolio of DJIA stocks thus providing exposure to the overall index.
- The Two-day FOMC meeting kicks off on Tuesday with a hold priced in for Wednesday’s interest rate decision.
- US consumer sentiment declined in April, while Q1 Employment Cost Index increased.
- Hawkish bets on the Fed continue to favor the USD.
The US Dollar Index (DXY) is presently trading higher at 105.95, while the two-day Federal Reserve (Fed) meeting kicked off. Markets are expecting a hawkish hold by the central bank, but messaging by Jerome Powell will be key. On Tuesday, positive mid-tier data is acting as a tailwind for the Greenback.
The US economy is witnessing resilience and persistent inflation, which makes a case for a hawkish hold by the Federal Open Market Committee (FOMC), which will likely show their lack of confidence in the progress being made.
Daily digest market movers: DXY rises as markets gear up for Fed decision, mid-tier data supports Greenback
- Conference Board's Consumer Confidence Index in the US dropped in April to the lowest level since July 2022, at 97.0, falling from March’s figure of 103.1.
- Elsewhere, the Employment Cost Index in the US rose by 1.2% YoY in the first quarter.
- Market expectations show a 10% chance of a rate cut in June by the Fed, with odds decreasing to 33% for July, and remaining below 75% for September.
- For Wednesday, there are growing expectations for a hawkish surprise due to key Fed officials advocating for patience before initiating easing measures.
DXY technical analysis: DXY recovers as bulls make a stride, bears around the corner
The technical outlook of DXY indicates predominantly bullish momentum. The Relative Strength Index (RSI) presents a positive slope in positive territory, indicating the dominance of the buying side. The flat green bars viewed in the Moving Average Convergence Divergence (MACD) align closely with this bullish sentiment but warn of flattening momentum.
That being said, the index remains above its 20, 100, and 200-day Simple Moving Averages (SMAs). This points consistently toward a dominating bullish backdrop. Hence, even as short-term challenges are dense, the larger trend appears to lean in favor of bulls.
US Dollar FAQs
The US Dollar (USD) is the official currency of the United States of America, and the ‘de facto’ currency of a significant number of other countries where it is found in circulation alongside local notes. It is the most heavily traded currency in the world, accounting for over 88% of all global foreign exchange turnover, or an average of $6.6 trillion in transactions per day, according to data from 2022. Following the second world war, the USD took over from the British Pound as the world’s reserve currency. For most of its history, the US Dollar was backed by Gold, until the Bretton Woods Agreement in 1971 when the Gold Standard went away.
The most important single factor impacting on the value of the US Dollar is monetary policy, which is shaped by the Federal Reserve (Fed). The Fed has two mandates: to achieve price stability (control inflation) and foster full employment. Its primary tool to achieve these two goals is by adjusting interest rates. When prices are rising too quickly and inflation is above the Fed’s 2% target, the Fed will raise rates, which helps the USD value. When inflation falls below 2% or the Unemployment Rate is too high, the Fed may lower interest rates, which weighs on the Greenback.
In extreme situations, the Federal Reserve can also print more Dollars and enact quantitative easing (QE). QE is the process by which the Fed substantially increases the flow of credit in a stuck financial system. It is a non-standard policy measure used when credit has dried up because banks will not lend to each other (out of the fear of counterparty default). It is a last resort when simply lowering interest rates is unlikely to achieve the necessary result. It was the Fed’s weapon of choice to combat the credit crunch that occurred during the Great Financial Crisis in 2008. It involves the Fed printing more Dollars and using them to buy US government bonds predominantly from financial institutions. QE usually leads to a weaker US Dollar.
Quantitative tightening (QT) is the reverse process whereby the Federal Reserve stops buying bonds from financial institutions and does not reinvest the principal from the bonds it holds maturing in new purchases. It is usually positive for the US Dollar.
- Canadian Dollar retreats after US morning session’s risk-off jitters.
- Canada GDP prints below expectations, erodes CAD further.
- US wage growth accelerates again, crimping rate cut hopes.
The Canadian Dollar (CAD) eased against the Greenback on Tuesday after the American market session kicked the day off with a risk-off push after US wages outpaced expectations. Investors are gearing up for the US Federal Reserve’s (Fed) latest rate call, slated for Wednesday.
Canada saw a further slowing in Gross Domestic Product (GDP) figures in February, further hampering the Canadian Dollar. Declines in the Antipodeans gave the CAD a boost in Pacific markets, sending the Canadian Dollar into another mixed trading day.
Daily digest market movers: Canadian Dollar retreats in wake of Greenback jump
- Canadian MoM GDP in February rose 0.2%, below the forecast for 0.3% and falling back from January’s 0.5% (revised down from 0.6%).
- US Q1 Employment Cost Index accelerated to 1.2%, beating the forecast of 1.0% and the previous quarter’s 0.9% wage growth.
- Accelerating labor costs continue to plague rate-cut-hungry markets as inflation remains above Fed targets and progress on reducing price growth has stalled.
- April’s Chicago Purchasing Managers Index (PMI) eased to 37.9, the indicator’s lowest print since November 2022.
- The Consumer Board’s Consumer Confidence Index declined to 97.0, nearly a two-year low in aggregate consumer survey responses.
- Read more: US CB Consumer Confidence declines to 97.0 in April
- US ADP Employment Change for April will print on Wednesday, forecast to tick down to 179K from 184K.
- Fed’s latest rate call and Monetary Policy Statement are scheduled for 18:00 GMT on Wednesday. Fed Chair Jerome Powell will hold a press conference 30 minutes after that.
- Fed is expected to hold rates steady, and investors will be looking for signs of firmer policy guidance from the Fed on when rate cuts could come.
- According to CME’s FedWatch Tool, rate cut hopes for September have been dashed, and rate markets are pricing in 51.1% odds of no cut until the November rate meeting.
Canadian Dollar price today
The table below shows the percentage change of Canadian Dollar (CAD) against listed major currencies today. Canadian Dollar was the strongest against the Australian Dollar.
| USD | EUR | GBP | CAD | AUD | JPY | NZD | CHF | |
| USD | 0.22% | 0.32% | 0.59% | 1.03% | 0.68% | 0.94% | 0.70% | |
| EUR | -0.21% | 0.09% | 0.37% | 0.79% | 0.44% | 0.72% | 0.48% | |
| GBP | -0.32% | -0.08% | 0.25% | 0.72% | 0.33% | 0.63% | 0.38% | |
| CAD | -0.59% | -0.34% | -0.26% | 0.47% | 0.07% | 0.37% | 0.13% | |
| AUD | -1.07% | -0.82% | -0.75% | -0.47% | -0.40% | -0.10% | -0.34% | |
| JPY | -0.68% | -0.41% | -0.33% | -0.08% | 0.40% | 0.28% | 0.05% | |
| NZD | -0.93% | -0.72% | -0.63% | -0.39% | 0.11% | -0.30% | -0.24% | |
| CHF | -0.68% | -0.48% | -0.39% | -0.13% | 0.35% | -0.04% | 0.24% |
The heat map shows percentage changes of major currencies against each other. The base currency is picked from the left column, while the quote currency is picked from the top row. For example, if you pick the Euro from the left column and move along the horizontal line to the Japanese Yen, the percentage change displayed in the box will represent EUR (base)/JPY (quote).
Technical analysis: Canadian Dollar mixed as broader market flows push CAD around
The Canadian Dollar is broadly mixed on Tuesday, shedding half a percent against the US Dollar (USD) and around a third of a percent against the Euro (EUR). Pacific market weakness saw the CAD climb around four-tenths of a percent against the Antipodeans.
USD/CAD broke into a fresh five-day high during Tuesday’s US market session, challenging the 1.3750 region as the pair bounces from a heavy supply zone between 1.3680 and 1.3630. Bids are still down from the last swing high into 1.3845, but buyers are pushing back into chart territory north of the 200-hour Exponential Moving Average (EMA) at 1.3688.
USD/CAD hourly chart
USD/CAD daily chart
Canadian Dollar FAQs
The key factors driving the Canadian Dollar (CAD) are the level of interest rates set by the Bank of Canada (BoC), the price of Oil, Canada’s largest export, the health of its economy, inflation and the Trade Balance, which is the difference between the value of Canada’s exports versus its imports. Other factors include market sentiment – whether investors are taking on more risky assets (risk-on) or seeking safe-havens (risk-off) – with risk-on being CAD-positive. As its largest trading partner, the health of the US economy is also a key factor influencing the Canadian Dollar.
The Bank of Canada (BoC) has a significant influence on the Canadian Dollar by setting the level of interest rates that banks can lend to one another. This influences the level of interest rates for everyone. The main goal of the BoC is to maintain inflation at 1-3% by adjusting interest rates up or down. Relatively higher interest rates tend to be positive for the CAD. The Bank of Canada can also use quantitative easing and tightening to influence credit conditions, with the former CAD-negative and the latter CAD-positive.
The price of Oil is a key factor impacting the value of the Canadian Dollar. Petroleum is Canada’s biggest export, so Oil price tends to have an immediate impact on the CAD value. Generally, if Oil price rises CAD also goes up, as aggregate demand for the currency increases. The opposite is the case if the price of Oil falls. Higher Oil prices also tend to result in a greater likelihood of a positive Trade Balance, which is also supportive of the CAD.
While inflation had always traditionally been thought of as a negative factor for a currency since it lowers the value of money, the opposite has actually been the case in modern times with the relaxation of cross-border capital controls. Higher inflation tends to lead central banks to put up interest rates which attracts more capital inflows from global investors seeking a lucrative place to keep their money. This increases demand for the local currency, which in Canada’s case is the Canadian Dollar.
Macroeconomic data releases gauge the health of the economy and can have an impact on the Canadian Dollar. Indicators such as GDP, Manufacturing and Services PMIs, employment, and consumer sentiment surveys can all influence the direction of the CAD. A strong economy is good for the Canadian Dollar. Not only does it attract more foreign investment but it may encourage the Bank of Canada to put up interest rates, leading to a stronger currency. If economic data is weak, however, the CAD is likely to fall.
- GBP/USD declines 0.36% from its daily peak, under pressure from indications of rising US inflation.
- The pair struggles above the 200-day moving average at 1.2564, hinting at potential further declines.
- Support levels are seen at: November 14, 2023, high of 1.2506; breaching this could lead to further support tests at 1.2448 and the year-to-date low of 1.2299.
- A recovery above the 200-DMA could reignite bullish momentum, aiming for 1.2600, with additional resistance at the 50-DMA and 100-DMA at 1.2619 and 1.2645.
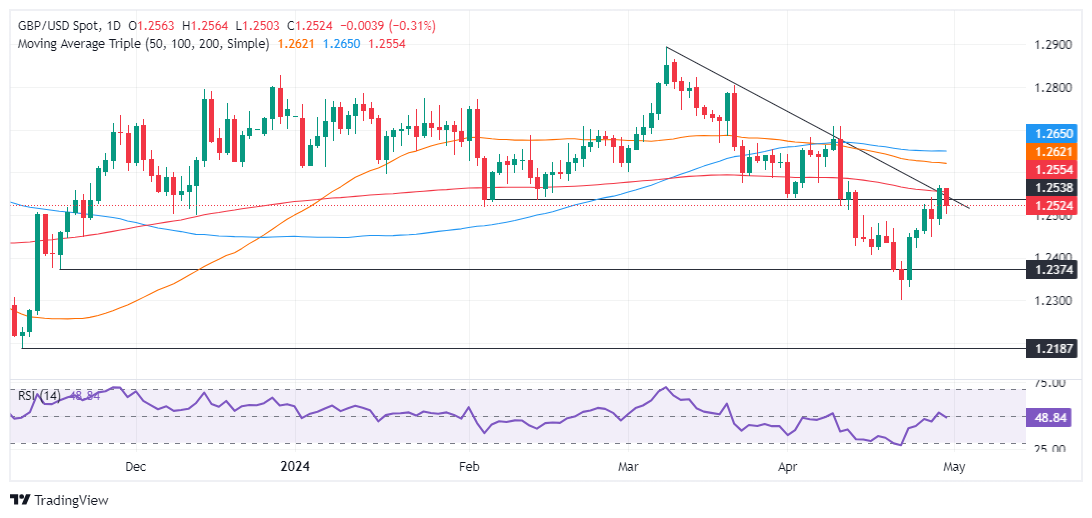
The Pound Sterling reverses its course against the US Dollar, after extending its gains past the 200-day moving average (DMA). However, data from the United States (US), showing that inflation could be picking up, as shown by the Employment Cost Index (ECI), bolstered the Greenback. Therefore, the GBP/USD trades at 1.2517 down by some 0.36%, after hitting a daily high of 1.2563.
GBP/USD Price Analysis: Technical outlook
The GBP/USD is neutral biased, though failure to cling above the 200-DMA at 1.2564 might open the door for a pullback, with traders eyeing a test of the November 14, 2023, high at 1.2506. In the event of a drop below that level, further downside is seen at the April 26 intermediate support at 1.2448, before the major plunges to the year-to-date (YTD) low of 1.2299.
On the other hand, if the pair edges above the 200-DMA that would pave the way for testing 1.2600. Once surpassed, key resistance levels emerge. The 50-DMA is up next at 1.2619, followed by the 100-DMA at 1.2645. Subsequent gains are seen above those levels, exacerbating a rally toward 1.2700.
GBP/USD Price Action – Daily Chart
- CB Consumer Confidence Index declined sharply in April.
- US Dollar Index clings to daily gains near 106.00.
Consumer sentiment in the US weakened in April, with the Conference Board's Consumer Confidence Index dropping to 97.0, the lowest reading since July 2022, from 103.1 (revised from 104.7) in March.
"The Present Situation Index—based on consumers’ assessment of current business and labor market conditions—declined to 142.9 in April from a downwardly revised 146.8 in March," the Conference Board said in its press release.
The Expectations Index dropped to 66.4 from 74.0, while the 12-month inflation expectation remained stable at 5.3%.
Market reaction
The US Dollar Index retreated from session highs after this data and was last seen rising 0.25% on the day at 105.88.
- GBP/JPY rises steadily as market mood brightens, reducing flows to the safe-haven Yen.
- Positive lending data in the UK shows credit remains ample.
- BRC Shop Price Index shows disinflation in the UK but not enough to prompt BoE into action, say BBH analysts.
GBP/JPY trades over a third of a percentage point higher at just above 197 on Tuesday, drifting up after the steep correction of the previous day which saw the pair fall from a peak of 200 to a low of the day in the 193s.
The sudden one-day decline was put down to the Japanese authorities intervening in Forex markets to prop up the depreciating Japanese Yen (JPY).
Yet Japan's top currency diplomat, Masato Kanda, refused to confirm this was the case on Tuesday morning, saying simply that the Ministry of Finance will release figures on currency intervention at the end of May.
He also repeated his warnings about the risks of an excessive weakening of the Japanese Yen (JPY), adding “Excessive FX moves could impact on daily lives,” and, we “Need to take appropriate actions on FX.”
GBP/JPY floats higher on “mean reversion” and buoyant market sentiment
GBP/JPY's bounce on tuesday seems more due to a “mean reversion” effect than anything driven by any macro-economic data releases, and the bounce in GBP/JPY echoes similar rebounds in most Yen pairs.
As a safe-haven currency, JPY tends to weaken when market sentiment is upbeat and on Tuesday the market mood was overall positive, buoyed by the recent run of tech earnings, positive GDP releases in Europe and overall easing geopolitical concerns.
The continued interest rate differential between the UK and Japan creates an overall bullish backdrop for the GBP/JPY.
The BoE is in no rush to cut interest rates with services inflation still rampant in the UK and in Japan the most recent batch of Tokyo CPI showed disinflation in the capital, which makes it even less likely the BoJ will raise super-low interest rates in Japan. As long as investors see more of a return parking in Pounds than Yen, the pair is destined to rise.
Minor data causes minor effects
The release of Japanese housing data during the Asian session on Tuesday appeared to have little noticeable effect on JPY. Housing Starts fell a bigger-than-expected minus 12.8% in March than the negative 7.6% expected but Construction Orders rose 31.4% from minus 11.0% in the previous month. Annualized Housing Starts moderated slightly to 0.76 million.
UK lending data out a few hours later also had little immediate impact on GBP but GBP/JPY did float higher in the hours that followed.
It is possible the UK data reflected an environment of fairly ample lending and loose credit conditions which might make it less likely that the Bank of England (BoE) will rush to cut interest rates. Keeping interest rates higher for longer is favorable for the Pound as it attracts capital inflows.
UK Net Lending to Individuals in March came out higher than expected at 1.8 billion (GBP) when 1.7B (GBP) had been expected. The February figure was also revised up from 2.8B (GBP) to 3.0B (GBP), according to data from the BoE.
UK Consumer Credit data out at the same time showed British shoppers borrowing more – a slightly higher 1.577 billion (GBP) in March compared to February’s 1.429B (GBP).
UK Mortgage Approvals also rose slightly higher than expected to 61.325K when 61K had been forecast, and Money Supply (M4) rose by 0.7% in March, which was above the 0.4% forecast and the 0.6% of the previous month.
UK inflation data unlikely to persuade BoE
At the same time a fresh batch of UK inflation data, in the form of the Consortium of British Industry’s (CBI) Shop Price Index, showed disinflationary forces at work in April. This might have been expected to weaken GBP, given lower inflation is more likely to bring forward the time when the BoE could decide to cut interest rates.
“Shop Price annual inflation eased to 0.8% in April, down from 1.3% in March. This is below the three-month average rate of 1.4%...its lowest since December 2021,” said the BRC report.
Additionally, non-food items entered deflationary territory, falling 0.6% in April compared to a 0.2% rise in March and a higher 0.2% three-month average.
Food inflation in the UK decelerated to 3.4% in April, down from 3.7% in March. This was below the three-month average rate of 3.9%. It was the twelfth consecutive deceleration in the food category, according to the report.
Although the BRC data painted a deflationary picture, analysts were quick to dismiss any impact on BoE decision-making from the report.
“While the data is welcome, shop price disinflation is unlikely to convince the BoE to move early with policy rate cuts, as it is more concerned with high and sticky services inflation. The first cut is still seen in August,” remarked analysts at Brown Brothers Harriman.
- USD/CAD moves higher above 1.0700 on multiple tailwinds.
- The US Dollar rebounds after upbeat Q1 Employment Cost Index data.
- Weaker-than-expected Canadian GDP weighs on the Canadian Dollar.
The USD/CAD pair rises above the crucial resistance of 1.3700 in Tuesday’s early American session. The Loonie asset strengthens as the US Dollar extends recovery after the United States Bureau of Labor Statistics (BLS) reported stronger-than-expected Q1 Employment Cost Index data.
The agency reported that the Labor Cost Index rose sharply by 1.2% from the consensus of 1.0% and the prior reading of 0.9%. The US Dollar Index (DXY) rebounds to near 106.00. The Highest Labor Cost index is broadly driven by strong wage growth, which eventually leads to an increase in households’ spending, suggesting a stubborn inflation outlook.
This is expected to allow the Federal Reserve (Fed) to keep rate cuts off the table and maintain the restrictive interest rate framework for a longer period. For more concrete interest rate outlook, investors will focus on the Fed’s monetary policy announcement on Wednesday. The Fed is expected to keep interest rates steady in the range of 5.25%-5.50%. For the interest rate guidance, the Fed reiterates the need to keep interest rates higher for a long time until it gains confidence that inflation will sustainably return to the desired rate of 2%.
Apart from a rebound in the US Dollar, the weak Canadian Dollar has also exerted pressure on the Loonie asset. The monthly Canadian Gross Domestic Product (GDP) grew at a slower pace of 0.2% from the estimates of 0.3% and the prior reading of 0.5%, downwardly revised from 0.6%. This indicates the consequences of higher interest rates by the Bank of Canada (BoC). The BoC may start reducing interest rates sooner due to weak growth and consistently softening price pressures. Traders have priced in the June meeting from when the BoC could pivot to interest rate cuts.
- Employment Cost Index rose at a faster pace than expected in Q1.
- US Dollar Index stays in positive territory near 106.00 after the data.
The Employment Cost Index in the US rose 1.2% in the first quarter, the US Bureau of Labor Statistics (BLS) reported on Tuesday. This reading followed the 0.9% increase recorded in the last quarter of 2023 and came in above the market expectation of 1%.
"Compensation costs for civilian workers increased 4.2% for the 12-month period ending in March 2024 and increased 4.8% in March 2023," the BLS said in the press release. "Wages and salaries increased 4.4% for the 12-month period ending in March 2024 and increased 5.0% for the 12-month period ending in March 2023."
Market reaction
The US Dollar gathered strength against its rivals with the immediate reaction. At the time of press, the US Dollar Index was u p 0.35% on the day at 106.00.
- EUR/GBP price has fallen to the floor of a multi-month range and rebounded off support.
- It is now poised to begin rising back up inside the channel continuing the sideways trend.
- The MACD indicator is poised to cross its signal line giving a buy signal, reinforcing the new up move.
EUR/GBP price has fallen to 0.8530, one pip above the base of a multi-month range at 0.8530.
The pair has bounced off the support from the range low and is trading back up at 0.8547 at the time of publication.
EUR/GBP 4-hour Chart
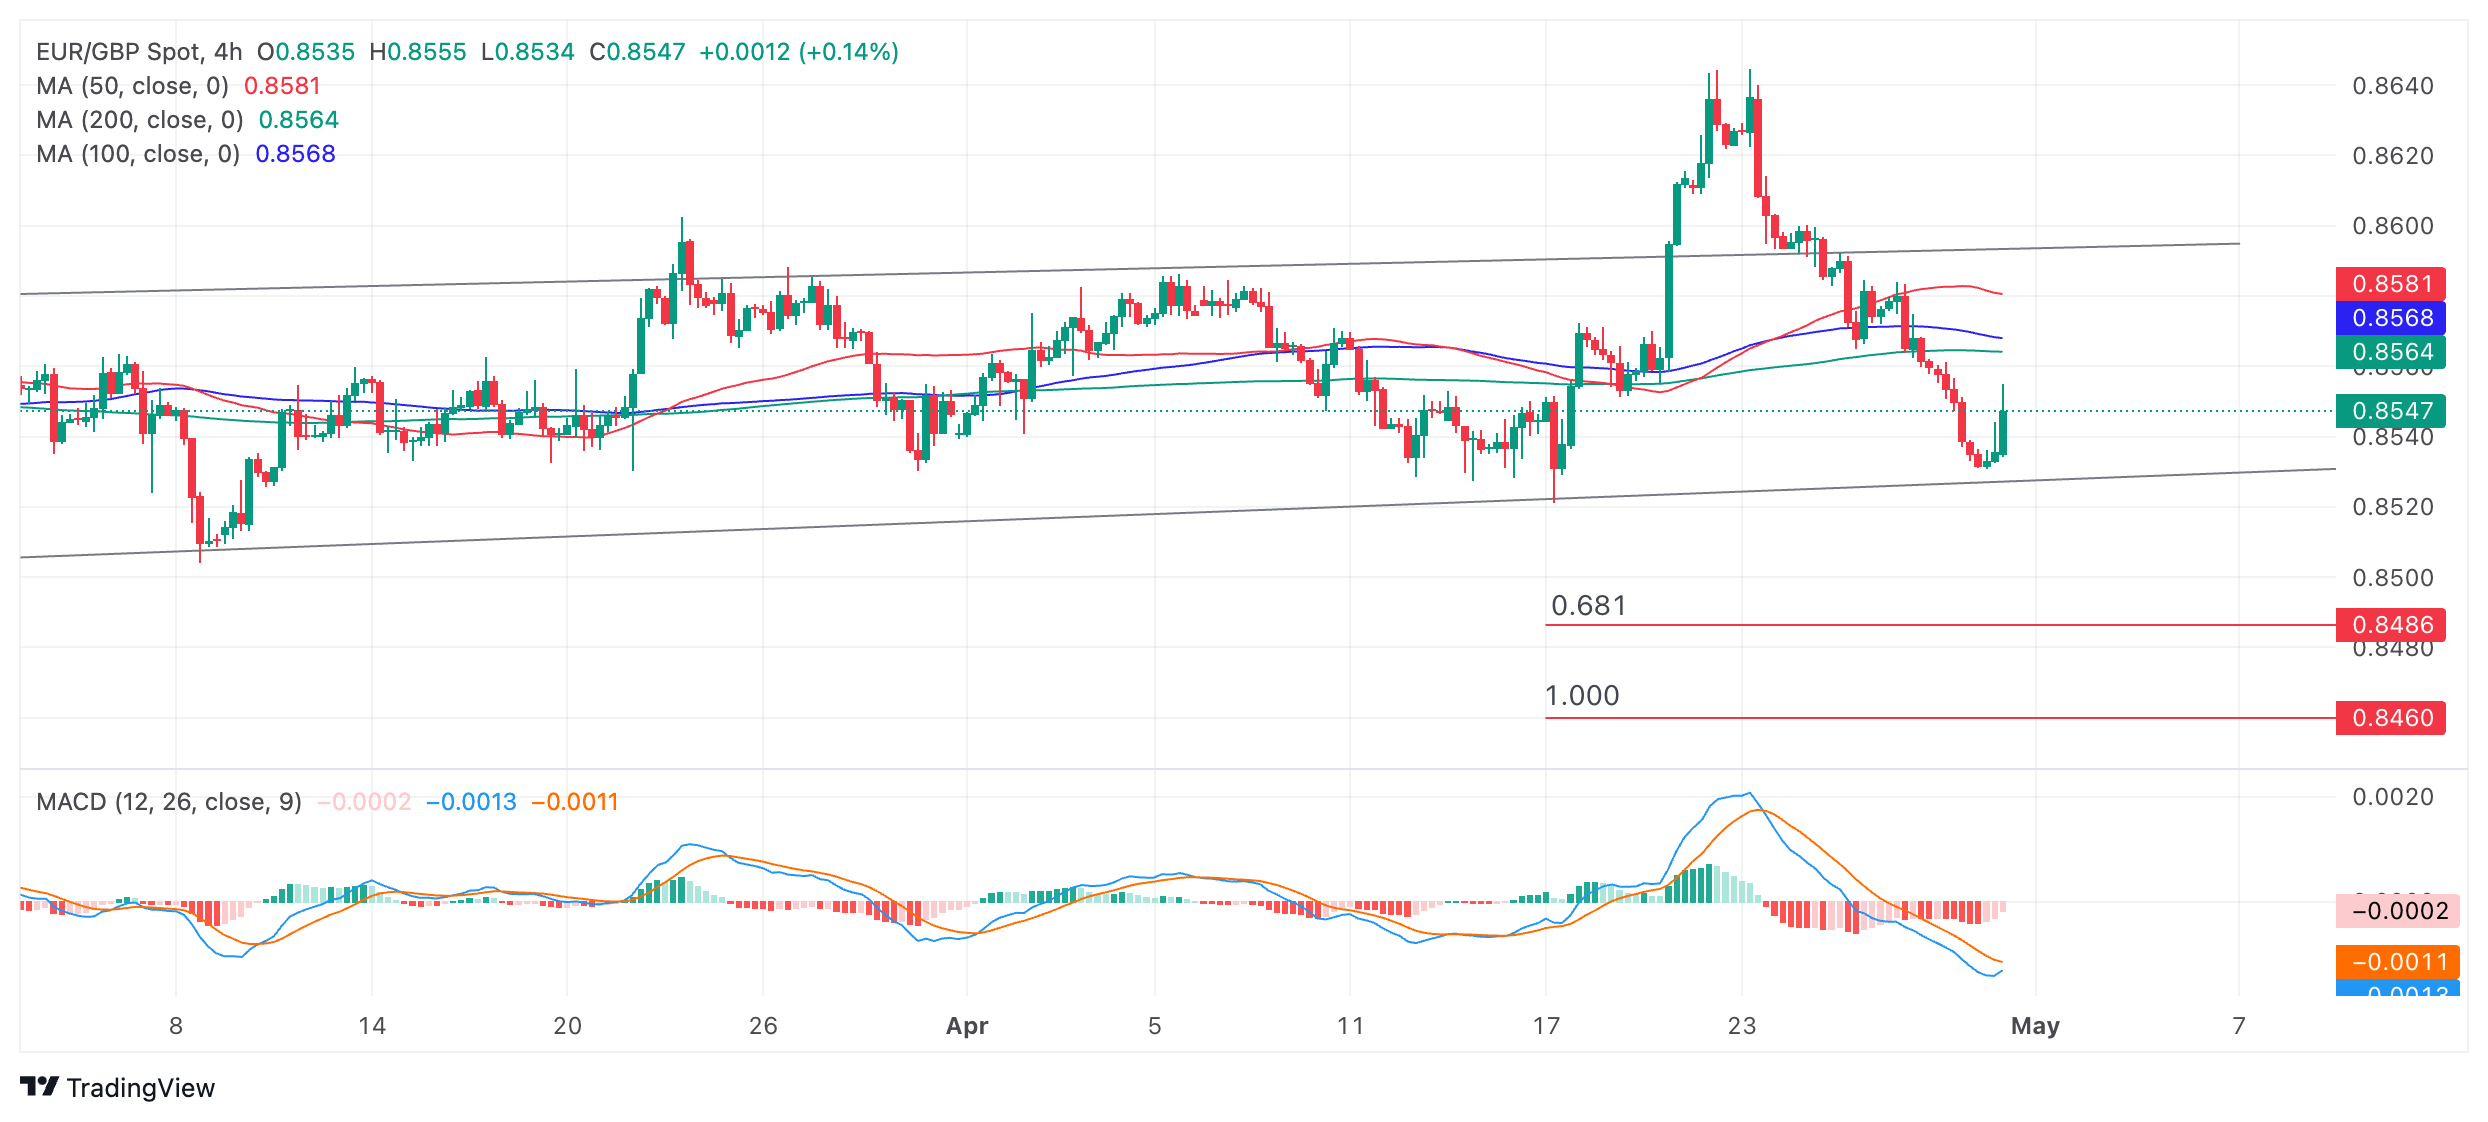
EUR/GBP is in a sideways trend which is forecast to continue until a directional bias proves otherwise. It will now probably start rising back up inside the range towards resistance from the cluster of Moving Averages in the 0.8560s. If it successfully breaks above them it will probably continue up to the ceiling of the range at roughly 0.8595.
The Moving Average Convergence Divergence (MACD) indicator looks like it is poised to cross above its signal line. If it does it will give a buy signal and suggest more upside increasing the probability of a rally within the range. The signal would be improved by the fact the pair is in a sideways trend and MACD is proven to be a more reliable indicator in non-trending markets.
A decisive break below the range low would open the way for more downside to the next target at 0.8486. This is the 0.681 Fibonacci ratio of the height of the range extrapolated lower from the channel’s base. This is the method used by technical analysts to estimate range breakouts. Further weakness could even see price reach the next target at 0.8460, the full height of the range extrapolated lower (1.000).
A decisive break would be one characterized by a long red candlestick that broke completely below the range floor and closed near its low, or three consecutive red candlesticks that broke clearly below the level.
- AUD/USD has broken out of the neat rising channel it was rallying within on the 4-hr chart.
- The pair is likely to go lower, falling to an initial target calculated from the channel breakout.
- The short-term trend remains bullish overall, however, suggesting a recovery is possibly thereafter.
AUD/USD has decisively broken out of the rising channel it was rallying within on the 4-hour chart and more weakness is expected in the near-term.
AUD/USD 4-hour Chart
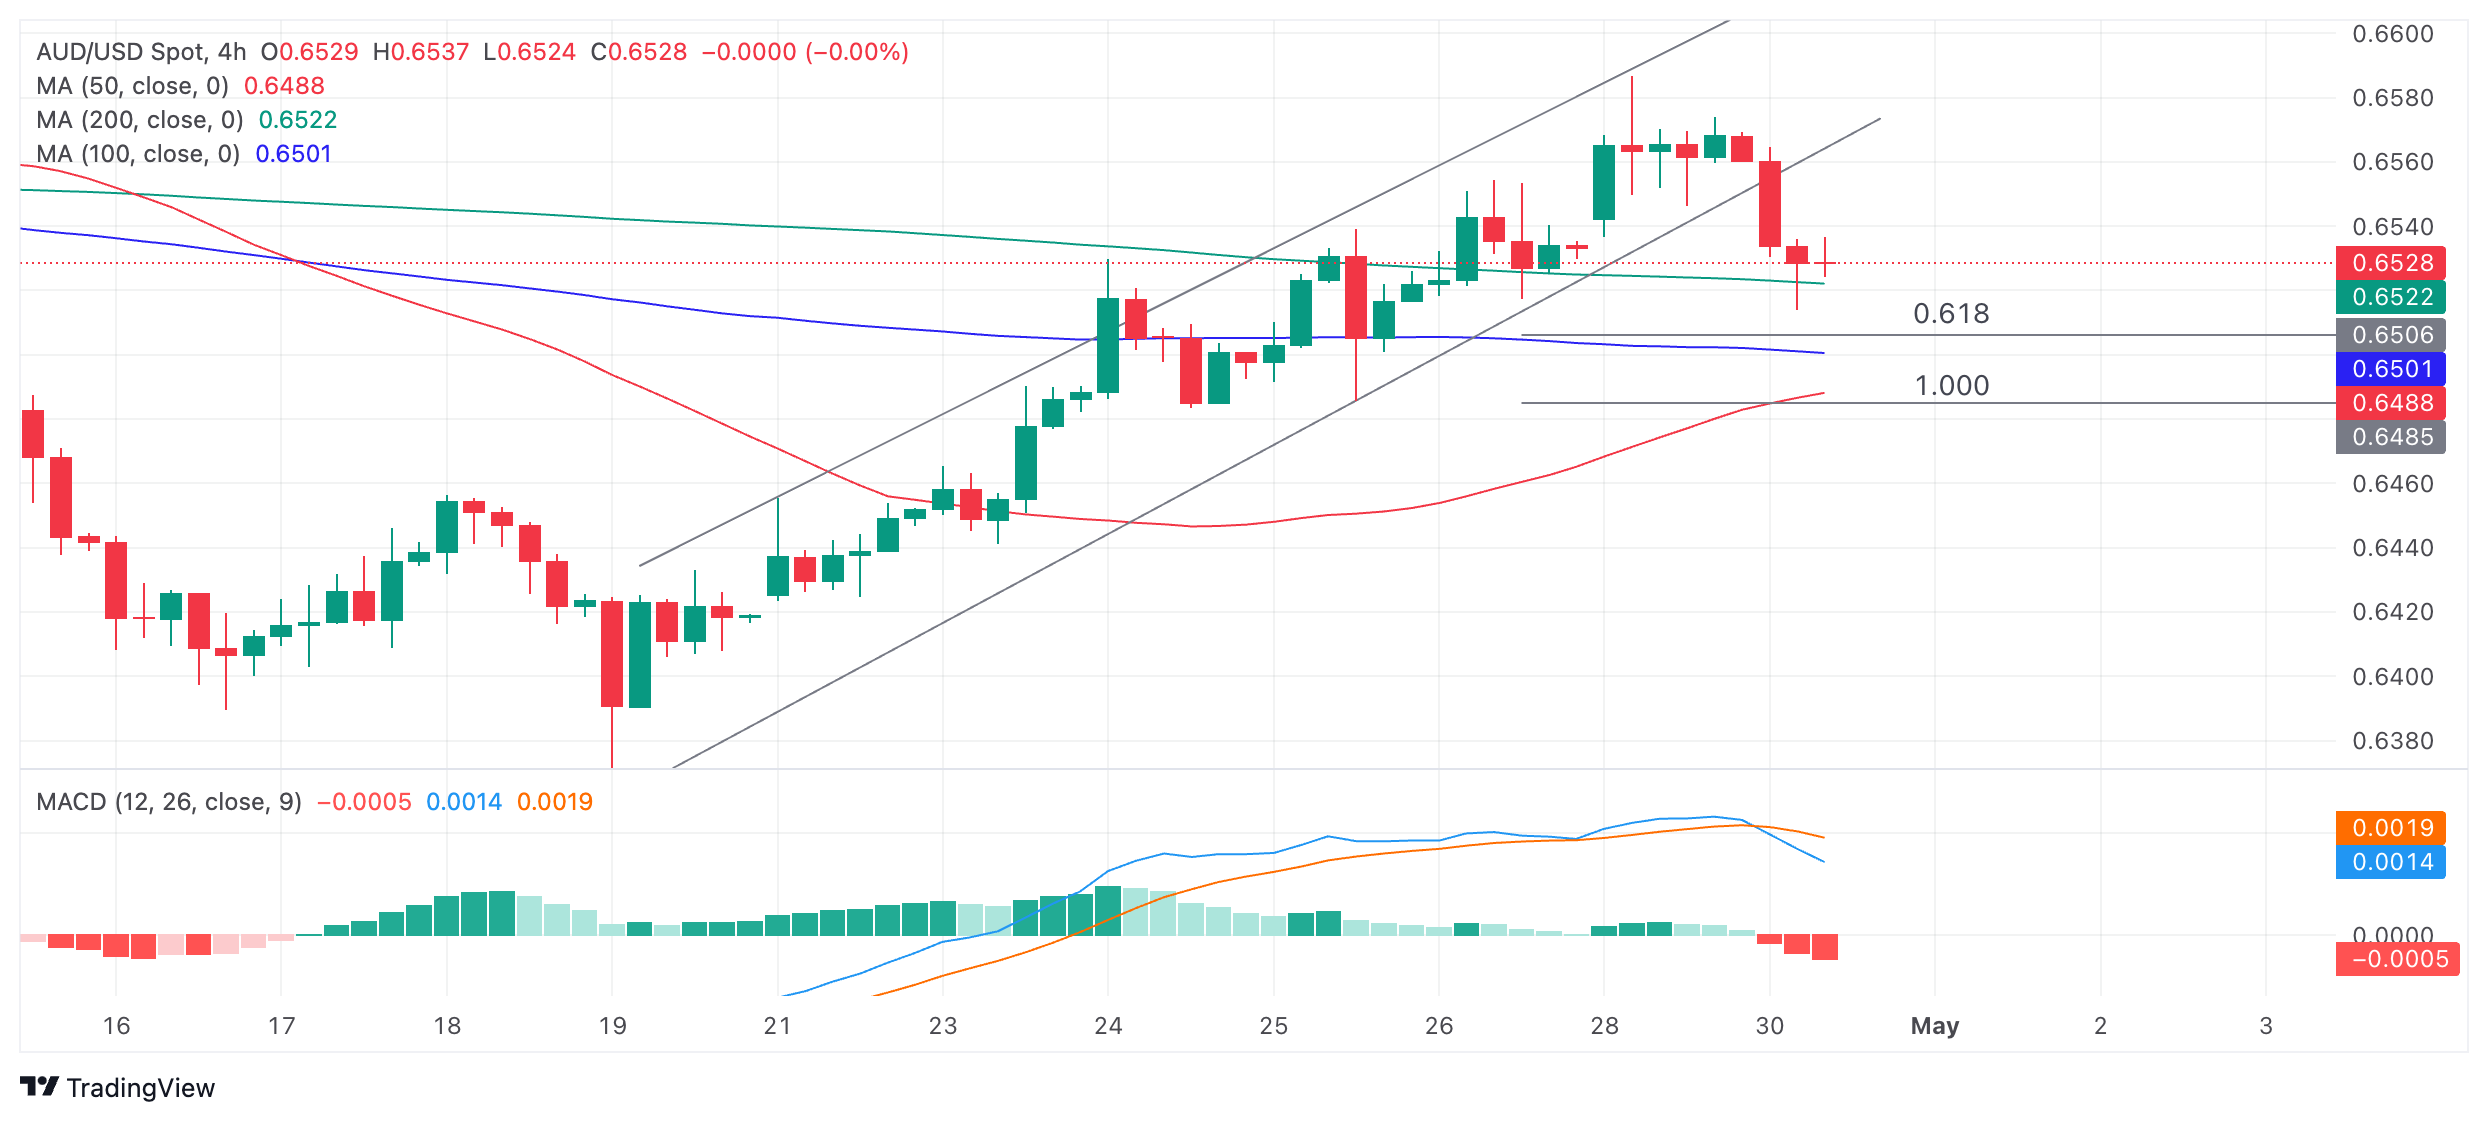
Despite the breakout there is still insufficient evidence to indicate that the bullish short-term trend has reversed.
AUD/USD will probably now fall to the target generated by the channel-breakout, estimated to lie at 0.6506. This is the conservative target for the breakout based on the 0.618 Fibonacci ratio of the height of the channel extrapolated lower. This is the usual method used by technical analysts to forecast channel breakouts.
Further bearishness could lead to a move down to the next target for the breakout at 0.6485, which is equal to the full height of the channel extrapolated lower from the breakout point (1.000).
Despite the breakout there remains a possibility the pair could recover and the current weakness may only be a pullback within the dominant uptrend. A move above the 0.6574 high would add confidence and suggest a continuation up to around the April 29 peak at 0.6587.
A break above that level would confirm the uptrend as still intact since it would generate a higher high, continuing the sequence of rising peaks and troughs on the 4-hour timeframe. This in turn would tilt the bias to a continuation of the trend higher towards new highs for the pair.
- EUR/JPY recovers sharply above 168.00 amid fresh concerns over ECB rate cuts from June.
- The Eurozone inflation rose higher than estimates, and Q1 GDP outperformed expectations.
- The Japanese Yen edges down but holds significant gains reported on Monday.
The EUR/JPY pair recovers further above the crucial resistance of 168.00 in Tuesday’s European session. The cross rises 0.36% after the Eurostat reported that strong preliminary Consumer Price Index (CPI) for April and Q1 Gross Domestic Product (GDP) data.
The agency showed that annual Harmonized Index of Consumer Prices (HICP) rose by 2.4%, remained in line with estimates and the prior reading. The core CPI that strips of volatile food and energy prices grew higher by 2.7% from the consensus of 2.6%.
Meanwhile, the GDP growth in the first quarter was 0.3%, significantly higher from the estimates of 0.1%. The economy remains stagnant in the last quarter of 2023. Sticky inflation combined with robust growth has raised concerns over European Central Bank (ECB) plans of announcing an end to the restrictive monetary policy framework.
The speculation for the ECB pivoting to rate cuts in the June meeting was firm due to consistently declining price pressures. Also, majority of ECB policymakers were comfortable with rate-cut expectations for June while they were divided over whether the rate cut cycle should continue straight after June meeting.
On the Tokyo front, the Japanese Yen has come down slightly against all major currencies after rallying on Monday. Financial markets anticipated that the upside move in the Japanese Yen was the outcome of Japan’s probable intervention. However, Japan’s top currency diplomat didn't confirm any FX intervention in his speech in the European session. Kanda said, "Speculative, rapid and abnormal FX moves have had a bad impact on the economy, so are unacceptable.". Kanda refrained from providing an appropriate level when asked about what could be the probable zone where the administration could intervene if authorities have not stepped yet.
European Central Bank (ECB) policymaker Pablo Hernandez de Cos said on Tuesday that the ECB should start cutting rates in June if inflation continues to slow down as expected, per Reuters.
"Given the high uncertainty, the ECB will follow a data-dependent approach where decisions are taken at each meeting," de Cos added. He also noted that the Spanish central bank was considering setting a positive level for banks' countercyclical buffer.
Market reaction
These comments don't seem to be having a noticeable impact on the Euro's valuation. At the time of press, EUR/USD was up 0.1% on the day at 1.0730.
- USD/JPY rebounds after the heavy sell-off on Monday.
- US Dollar traders are buying the dip after possible intervention by the authorities pulled USD/JPY down.
- The interest rate differential between Japan and the US is likely to maintain a bullish pressure on the pair.
USD/JPY is trading up about a third of a percentage point in the 156.90s on Tuesday as traders buy the dip after the rumored currency-intervention sell-off on the previous day.
USD/JPY peaked at a 34-year high of 160.32 on Monday but then rolled over and fell following a rumored currency intervention by the Japanese authorities who have been warning about the Yen weakening excessively ever since USD/JPY rose above 150.00 in March.
Japan's top currency diplomat, Masato Kanda, refused to confirm whether the authorities had intervened when questioned by the media on Tuesday morning, saying simply that the Ministry of Finance will release figures on currency intervention at the end of May.
He did, however, repeat his warnings about the risks of an excessive weakening of the Japanese Yen (JPY), saying “Currency impact has a bigger impact on import prices now,” and that “Excessive FX moves could impact on daily lives,” and we “Need to take appropriate actions on FX.”
The US Dollar Index (DXY) has recovered and is trading marginally higher at the time of writing as USD bulls undertake some mild buying ahead of the US Federal Reserve’s (Fed) policy meeting on Wednesday.
The Fed is not expected to make any changes to its monetary policy settings at the meeting, though rhetoric from Federal Reserve Chairman Jermome Powell may impact expectations. According to market based gauges of Fed policy such as the CME FedWatch tool there is only a 2.7% probability the Fed will implement an interest-rate cut.
As such the Fed will probably maintain the key Fed Funds Rate at its current 5.25% - 5.5% level. This is still substantially higher than the Bank of Japan’s cash rate of 0.0% - 0.1%. The difference favors the US Dollar as investors like to park their money where it can earn more interest. This in turn is likely to continue pressuring gains in USD/JPY regardless of whether the Japanese authorities intervene.
Most analysts see intervention attempts as futile without support from higher interest rates. But higher interest rates are unlikely given trend inflation continues to track below the BoJ’s 2.0% target and recent Tokyo CPI data showed CPI inflation falling well below expectations in April further lessening the likelihood of the BoJ rushing to support its currency with higher interest rates.
- EUR/USD recovers sharply from below 1.0700 after upbeat Eurozone Q1 GDP, stubborn inflation data.
- Strong Eurozone data has raised concerns over ECB rate cuts from June.
- The US Dollar recovers amid caution ahead of the Fed’s policy decision.
EUR/USD bounces back strongly from below 1.0700 in Tuesday’s European session as the Eurozone preliminary inflation data for April and Gross Domestic Product (GDP) data for the first quarter have beat the consensus. Annually, the Harmonized Index of Consumer Prices (HICP) rose steadily and met estimates while core HCPI, that excludes food and energy prices, softened on a slower pace.
The Eurozone economy expanded at a stronger rate of 0.3% in the first quarter even though the European Central Bank (ECB) is maintaining its Main Refinancing Operations Rate at historic highs of 4.5%.
A sharp recovery in the Euro after the release of the key economic indicators suggests that investors’ confidence about the ECB pivoting to interest rate cuts from June would be significantly impacted. The speculation for the ECB reducing interest rates from June would be impacted in such a time when policymakers were divided over extending the rate-cut campaign to following meetings this year.
Daily digest market movers: EUR/USD rebounds after upbeat Eurozone data
- EUR/USD rebounds sharply from the crucial support of 1.0700 after the Eurostat reported that inflation remained hotter than expected in April and Q1 GDP outperformed estimates. Eurozone’s headline inflation rose in line with the consensus and the prior reading of 2.4%. The annual core inflation, which strips off volatile food and energy prices, grew at a higher pace of 2.7% from the estimates of 2.6% but decelerated from the prior reading of 2.9%.
- Monthly headline and core inflation rose by 0.6% and 0.7%, respectively. The Eurozone economy expanded at a strong rate of 0.3% in Q1, beating expectations of 0.1% and a stagnant performance in the last quarter of 2023. Annually, the Q1 GDP growth rate was double the expectations of 0.2%.
- Stronger-than-expected preliminary inflation for April, combined with robust Q1 GDP growth, is not expected to significantly impact expectations of rate cuts by the European Central Bank, which financial markets are expected to start in June.
- On the other side of the Atlantic, The US Dollar rebounds sharply as the market sentiment remains risk-off ahead of the Federal Reserve’s monetary policy decision, which will be announced on Wednesday. The US Dollar Index (DXY) recovers from 105.50 but remains inside two-week’s trading range of 105.40-106.50. The Fed is expected to keep interest rates unchanged in the range of 5.25%-5.50% for the sixth time in a row as price pressures in the United States remain stubbornly higher due to strong wage growth.
- The Fed will likely endorse keeping interest rates on hold at their current level for longer until it gets greater confidence that inflation will sustainably return to the desired rate of 2% target. Investors would look for whether the Fed will remain committed to its three rate-cut projections for this year provided in March’s dot plot.
- Apart from Wednesday’s Fed policy decision, investors will also focus on the US ADP Employment Change and the ISM Manufacturing Purchasing Managers Index (PMI) report for April.
Technical Analysis: EUR/USD finds strong buying interest near 1.0700
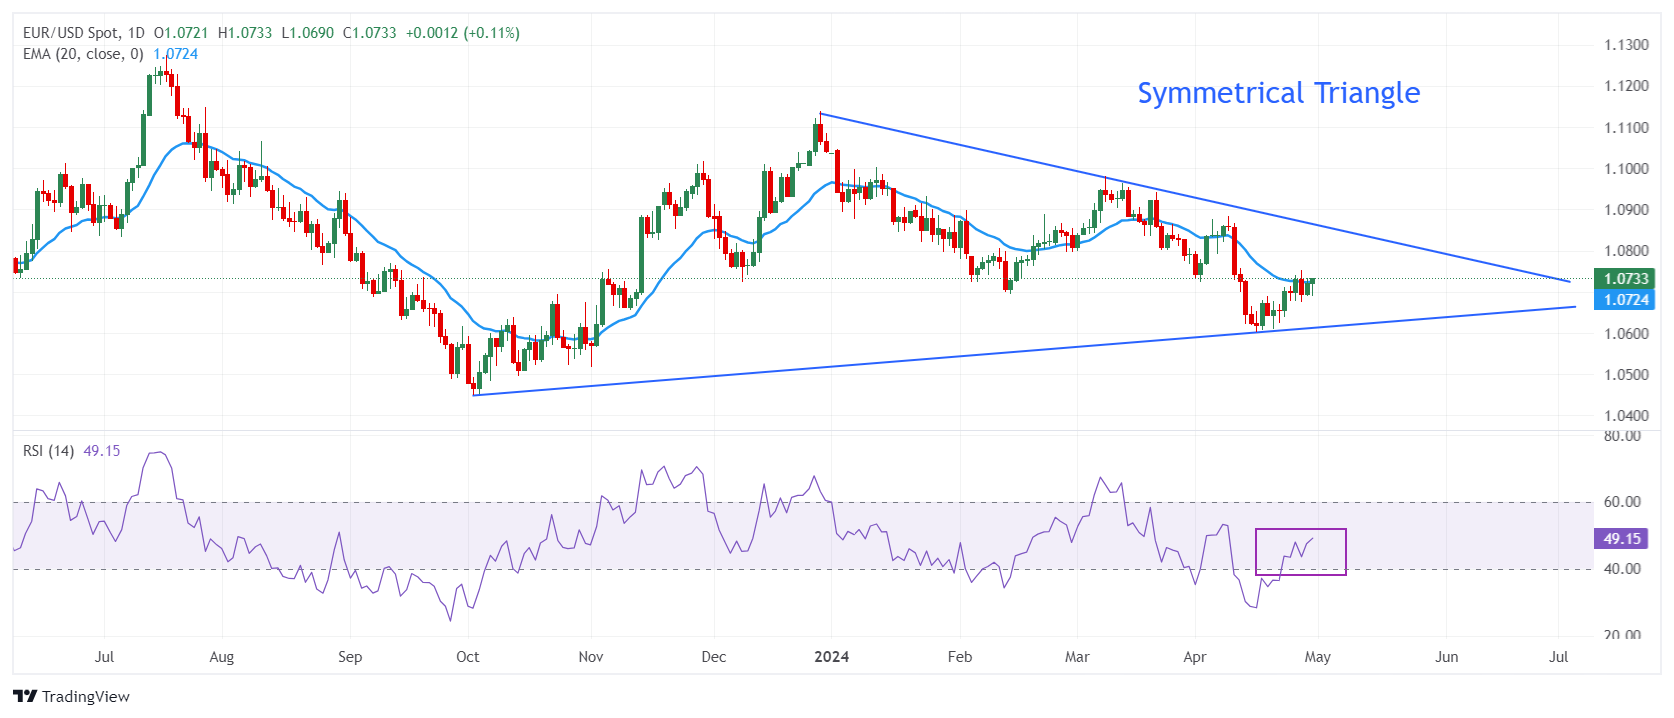
EUR/USD bounces back strongly from above the round-level support of 1.0700. The major currency pair attempts to break above the 20-day Exponential Moving Average (EMA), which trades around 1.0725.
The panoramic view of the EUR/USD pair indicates a sharp volatility contraction due to a Symmetrical Triangle formation on a daily timeframe. The upward-sloping border of the triangle pattern is plotted from October 3 low at 1.0448 and the downward-sloping border is placed from December 28 high around 1.1140.
The 14-period Relative Strength Index (RSI) shifts into the 40.00-60.00 range, suggesting indecisiveness among market participants.
Euro FAQs
The Euro is the currency for the 20 European Union countries that belong to the Eurozone. It is the second most heavily traded currency in the world behind the US Dollar. In 2022, it accounted for 31% of all foreign exchange transactions, with an average daily turnover of over $2.2 trillion a day. EUR/USD is the most heavily traded currency pair in the world, accounting for an estimated 30% off all transactions, followed by EUR/JPY (4%), EUR/GBP (3%) and EUR/AUD (2%).
The European Central Bank (ECB) in Frankfurt, Germany, is the reserve bank for the Eurozone. The ECB sets interest rates and manages monetary policy. The ECB’s primary mandate is to maintain price stability, which means either controlling inflation or stimulating growth. Its primary tool is the raising or lowering of interest rates. Relatively high interest rates – or the expectation of higher rates – will usually benefit the Euro and vice versa. The ECB Governing Council makes monetary policy decisions at meetings held eight times a year. Decisions are made by heads of the Eurozone national banks and six permanent members, including the President of the ECB, Christine Lagarde.
Eurozone inflation data, measured by the Harmonized Index of Consumer Prices (HICP), is an important econometric for the Euro. If inflation rises more than expected, especially if above the ECB’s 2% target, it obliges the ECB to raise interest rates to bring it back under control. Relatively high interest rates compared to its counterparts will usually benefit the Euro, as it makes the region more attractive as a place for global investors to park their money.
Data releases gauge the health of the economy and can impact on the Euro. Indicators such as GDP, Manufacturing and Services PMIs, employment, and consumer sentiment surveys can all influence the direction of the single currency. A strong economy is good for the Euro. Not only does it attract more foreign investment but it may encourage the ECB to put up interest rates, which will directly strengthen the Euro. Otherwise, if economic data is weak, the Euro is likely to fall. Economic data for the four largest economies in the euro area (Germany, France, Italy and Spain) are especially significant, as they account for 75% of the Eurozone’s economy.
Another significant data release for the Euro is the Trade Balance. This indicator measures the difference between what a country earns from its exports and what it spends on imports over a given period. If a country produces highly sought after exports then its currency will gain in value purely from the extra demand created from foreign buyers seeking to purchase these goods. Therefore, a positive net Trade Balance strengthens a currency and vice versa for a negative balance.
- Gold price has fallen almost a percentage point lower on the back of improving risk sentiment.
- Positive gains in Asia, strong US earnings and robust European GDP data have all helped boost sentiment.
- Gold price may be unfolding a Measured Move price pattern lower on the charts.
The Gold price (XAU/USD) trades lower by one percent on Tuesday, in the $2,310s at the time of writing, as a positive market mood dents safe-haven demand for the precious metal.
Markets in Asia-Pacific closed on the whole in positive territory, with the Nikkie posting a 1.24% gain, Australia’s ASX200 up 0.35% and the Hang Seng rising 0.1% at the close.
Although stock markets on mainland China edged lower to close in negative territory, this may have been on the back of traders booking profits ahead of the May 1 holiday after a run of up days. Indeed data out of China was on the whole positive, showing that the Caixin Chinese Manufacturing PMI hit a 14-month high in April, whilst in Europe, French and Spanish GDP growth beat estimates in the first quarter.
Gold price rally driven by Central Banks and OTC buying – World Gold Council
The Gold price rally in Q1 was driven by a combination of strong central bank and OTC buying, according to a recent report by the World Gold Council (WGC).
Total demand during the period was estimated at 1,238.3 tonnes compared to 1,269.7t in the previous quarter.
Over-the-Counter, or OTC buying – which is not conducted via exchanges and so can only be estimated – rose by 136.4t compared to 126.9t in Q4.
Heavy buying by central banks was a contributing factor in the rally in Gold price, with 289.7t of Gold bought by this market compared to 219.6t in the previous quarter.
“Q1 saw no let-up in the pace of central bank gold buying: 290t (net) was added to official holdings,” said the report.
Further details from the WGC report are as follows:
- Gold mine production increased 4.0% YoY to 893t – a record first quarter for the WGC data series.
- Gold recycling climbed 12% YoY to 351t, the highest quarter since Q3 of 2020.
- Eastern investors exhibited different behavior to Western investors, whilst Western gold buying experienced healthy levels of profit-taking. “This contrasted with strong buying into the price surge in Eastern markets,” said the WGC report.
- Global Gold ETF holdings fell by 114t, with Europe and North America experiencing quarterly outflows.
- Demand from the jewelry sector remained healthy, given the price rally. Global jewelry consumption fell just 2.0%.
- Gold demand from the technology sector rose 10.0% YoY as the AI boom boosted buying from the tech sector.
Technical Analysis: Gold price possibly unfolding Measured Move
Gold price (XAU/USD) is potentially unfolding the final down wave of a Measured Move price pattern, most clearly visible on the 4-hour chart, which technical analysts use to analyze the short-term trend.
XAU/USD 4-hour Chart
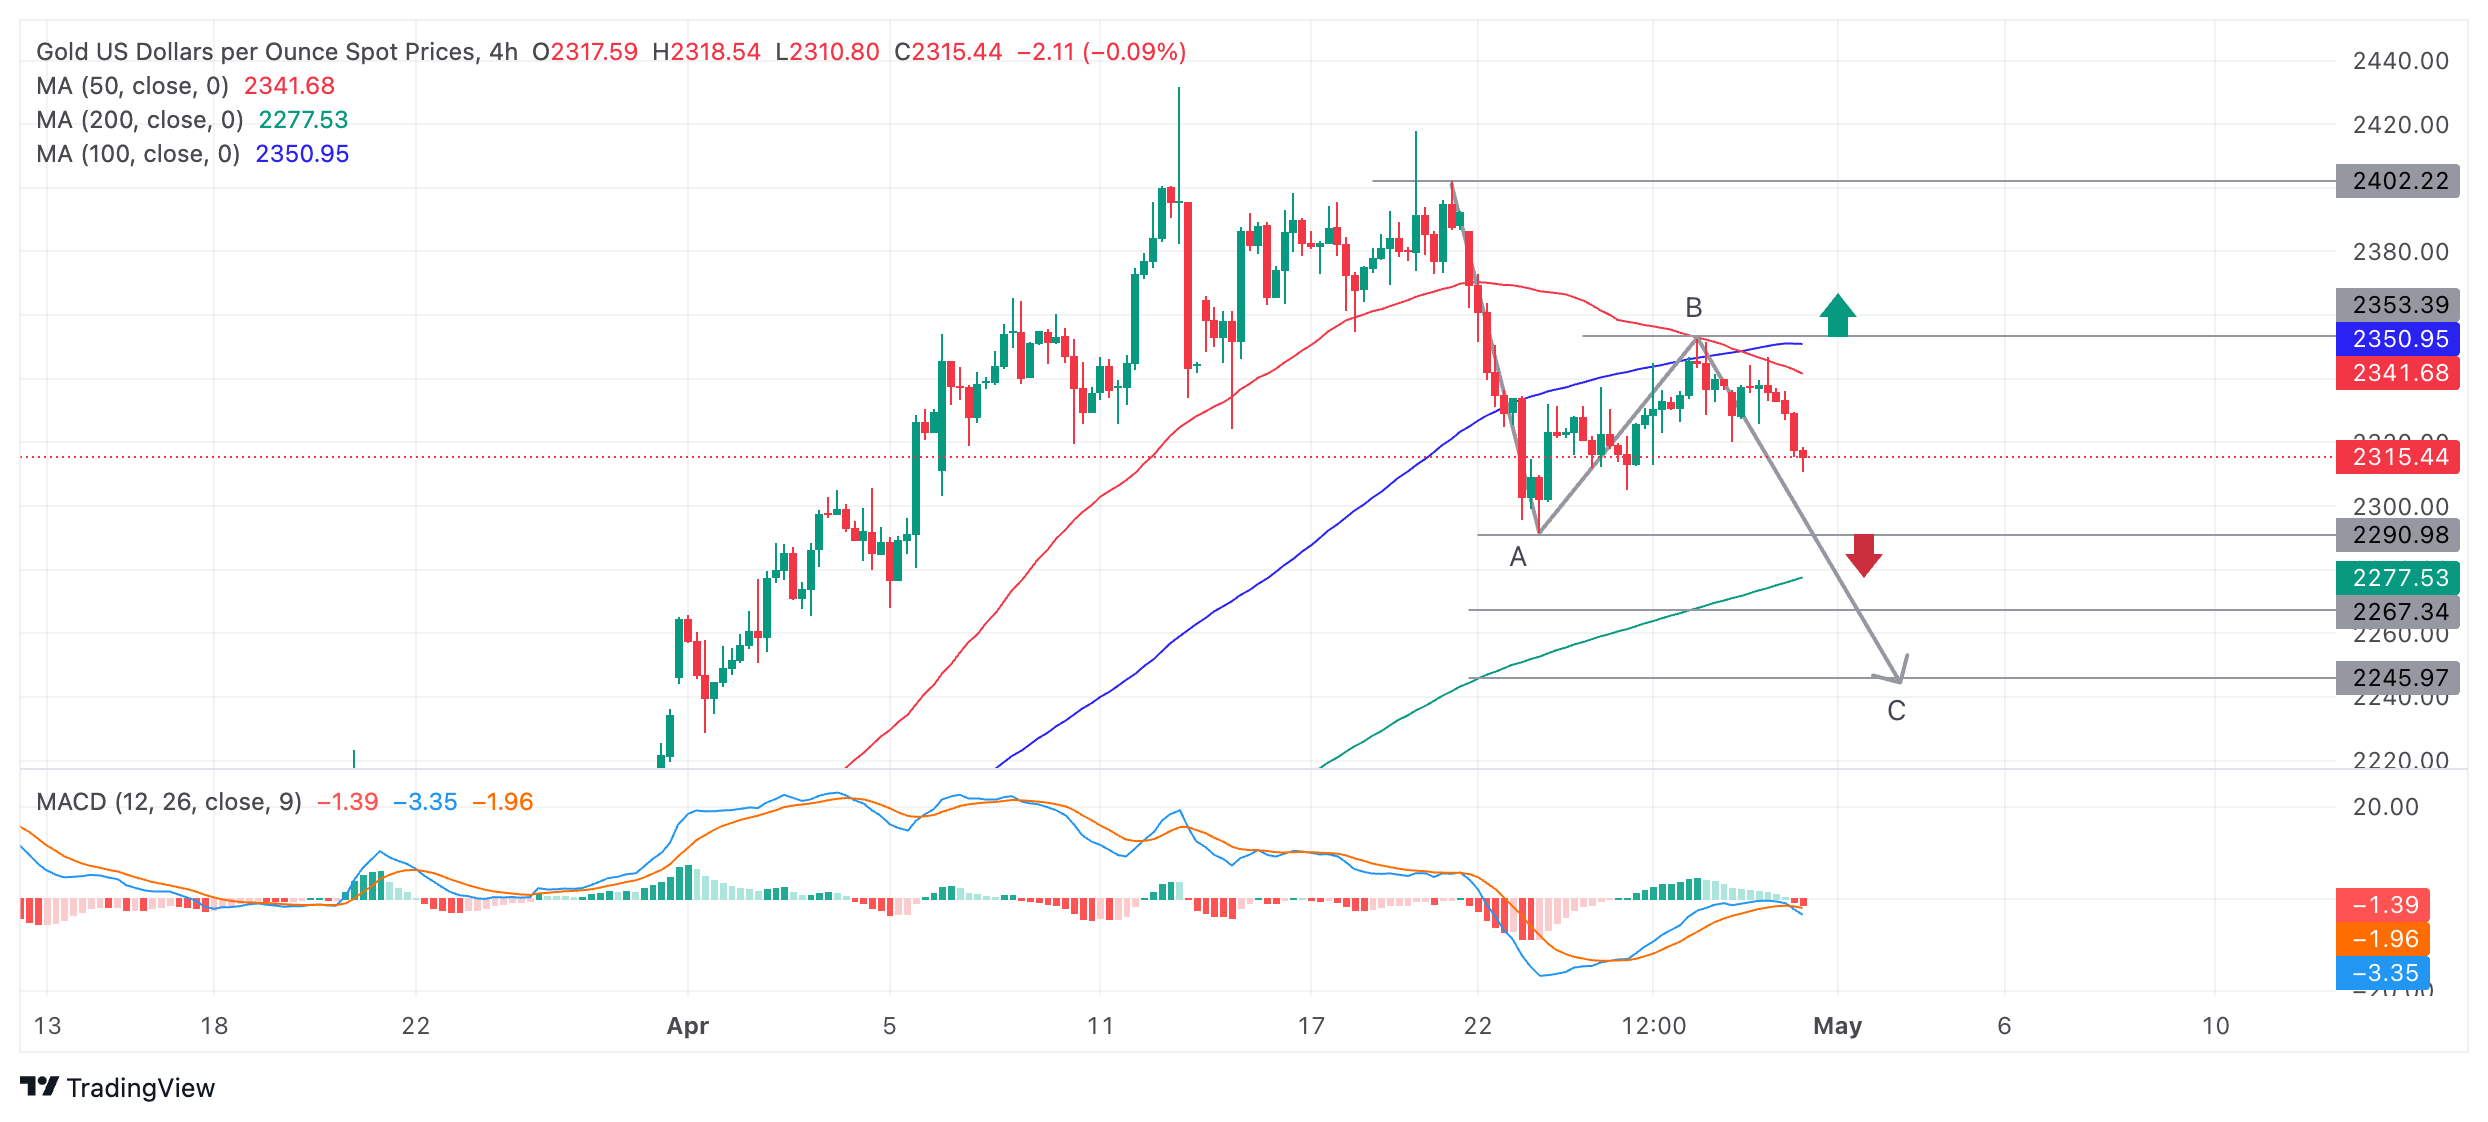
Measured Move patterns are composed of three waves that trace out a zig-zag pattern. The waves are often labeled A, B and C. The end of the final C wave can be estimated based on the length of wave A. It is usually either equal in length to A or a Fibonacci 0.681 ratio of A.
A break below $2,290, however, would confirm the pattern is a Measured Move and lead to more downside as wave C unfolds, with targets at $2,267 (the 0.681 target) and $2,245 (A=C).
The Moving Average Convergence Divergence (MACD) momentum indicator has started printing bearish red histogram bars and has crossed below its signal line lending the chart a negative tone.
Until the pattern is confirmed, however, there is still a chance Gold price could rally. A break above the cluster of Moving Averages and the peak of wave B at $2,350 would potentially usher in a new more bullish environment. This could then see a retest of the $2,400 highs.
Additionally, the trend for Gold price is up both in the medium and long-term, overall supporting the outlook for bulls.
Gold FAQs
Gold has played a key role in human’s history as it has been widely used as a store of value and medium of exchange. Currently, apart from its shine and usage for jewelry, the precious metal is widely seen as a safe-haven asset, meaning that it is considered a good investment during turbulent times. Gold is also widely seen as a hedge against inflation and against depreciating currencies as it doesn’t rely on any specific issuer or government.
Central banks are the biggest Gold holders. In their aim to support their currencies in turbulent times, central banks tend to diversify their reserves and buy Gold to improve the perceived strength of the economy and the currency. High Gold reserves can be a source of trust for a country’s solvency. Central banks added 1,136 tonnes of Gold worth around $70 billion to their reserves in 2022, according to data from the World Gold Council. This is the highest yearly purchase since records began. Central banks from emerging economies such as China, India and Turkey are quickly increasing their Gold reserves.
Gold has an inverse correlation with the US Dollar and US Treasuries, which are both major reserve and safe-haven assets. When the Dollar depreciates, Gold tends to rise, enabling investors and central banks to diversify their assets in turbulent times. Gold is also inversely correlated with risk assets. A rally in the stock market tends to weaken Gold price, while sell-offs in riskier markets tend to favor the precious metal.
The price can move due to a wide range of factors. Geopolitical instability or fears of a deep recession can quickly make Gold price escalate due to its safe-haven status. As a yield-less asset, Gold tends to rise with lower interest rates, while higher cost of money usually weighs down on the yellow metal. Still, most moves depend on how the US Dollar (USD) behaves as the asset is priced in dollars (XAU/USD). A strong Dollar tends to keep the price of Gold controlled, whereas a weaker Dollar is likely to push Gold prices up.
- NZD/USD meets with a fresh supply on Tuesday amid a goodish pickup in the USD demand.
- Rejection near the ascending channel hurdle and the subsequent slide favors bearish traders.
- Investors now look to US macro data for some impetus ahead of NZ jobs data on Wednesday.
The NZD/USD pair comes under heavy selling pressure on Tuesday and moves away from over a two-week high, around the 0.5985 region touched the previous day. Spot prices remain depressed through the first half of the European session and currently trade near the lower end of the daily range, around the 0.5940 area amid a goodish pickup in the US Dollar (USD) demand.
Growing acceptance that the Federal Reserve (Fed) will begin its rate-cutting cycle only in September, along with a slightly softer risk tone, turn out to be key factors underpinning the safe-haven buck and weighing on the risk-sensitive Kiwi. Bulls, meanwhile, seem rather unimpressed by mixed Chinese PMI prints released earlier today as the focus remains squarely on the crucial FOMC decision, scheduled to be announced on Wednesday. In the meantime, the US macro data – the Chicago PMI and the Conference Board's Consumer Confidence Index – might provide some impetus ahead of the quarterly New Zealand employment details on Wednesday.
From a technical perspective, the recent recovery from the mid-0.5850 region, or the YTD low touched earlier this month, faced rejection near a resistance marked by the top boundary of a downward-sloping channel extending from early March. The said barrier is currently pegged near the 0.5980-0.5985 region and is closely followed by the 0.6000 psychological mark. A sustained strength beyond will suggest that the NZD/USD pair has bottomed out in the near term and pave the way for some meaningful upside. Spot prices might then aim to surpass the 50-day Simple Moving Average (SMA), around the 0.6040 area, and reclaim the 0.6100 mark.
On the flip side, any further decline is likely to find some support near the 0.5920 area ahead of the 0.5900 round figure. Failure to defend the latter might expose the YTD trough, around the 0.5850 region, before the NZD/USD pair eventually drops to challenge the descending channel support, currently pegged near the 0.5815-0.5810 region. This is followed by the 0.5800 mark, which if broken will be seen as a fresh trigger for bearish traders. That said, mixed oscillators on the daily chart warrant some caution before placing aggressive bets ahead of the key data/central bank event risks and positioning for any further depreciating move.
NZD/USD daily chart
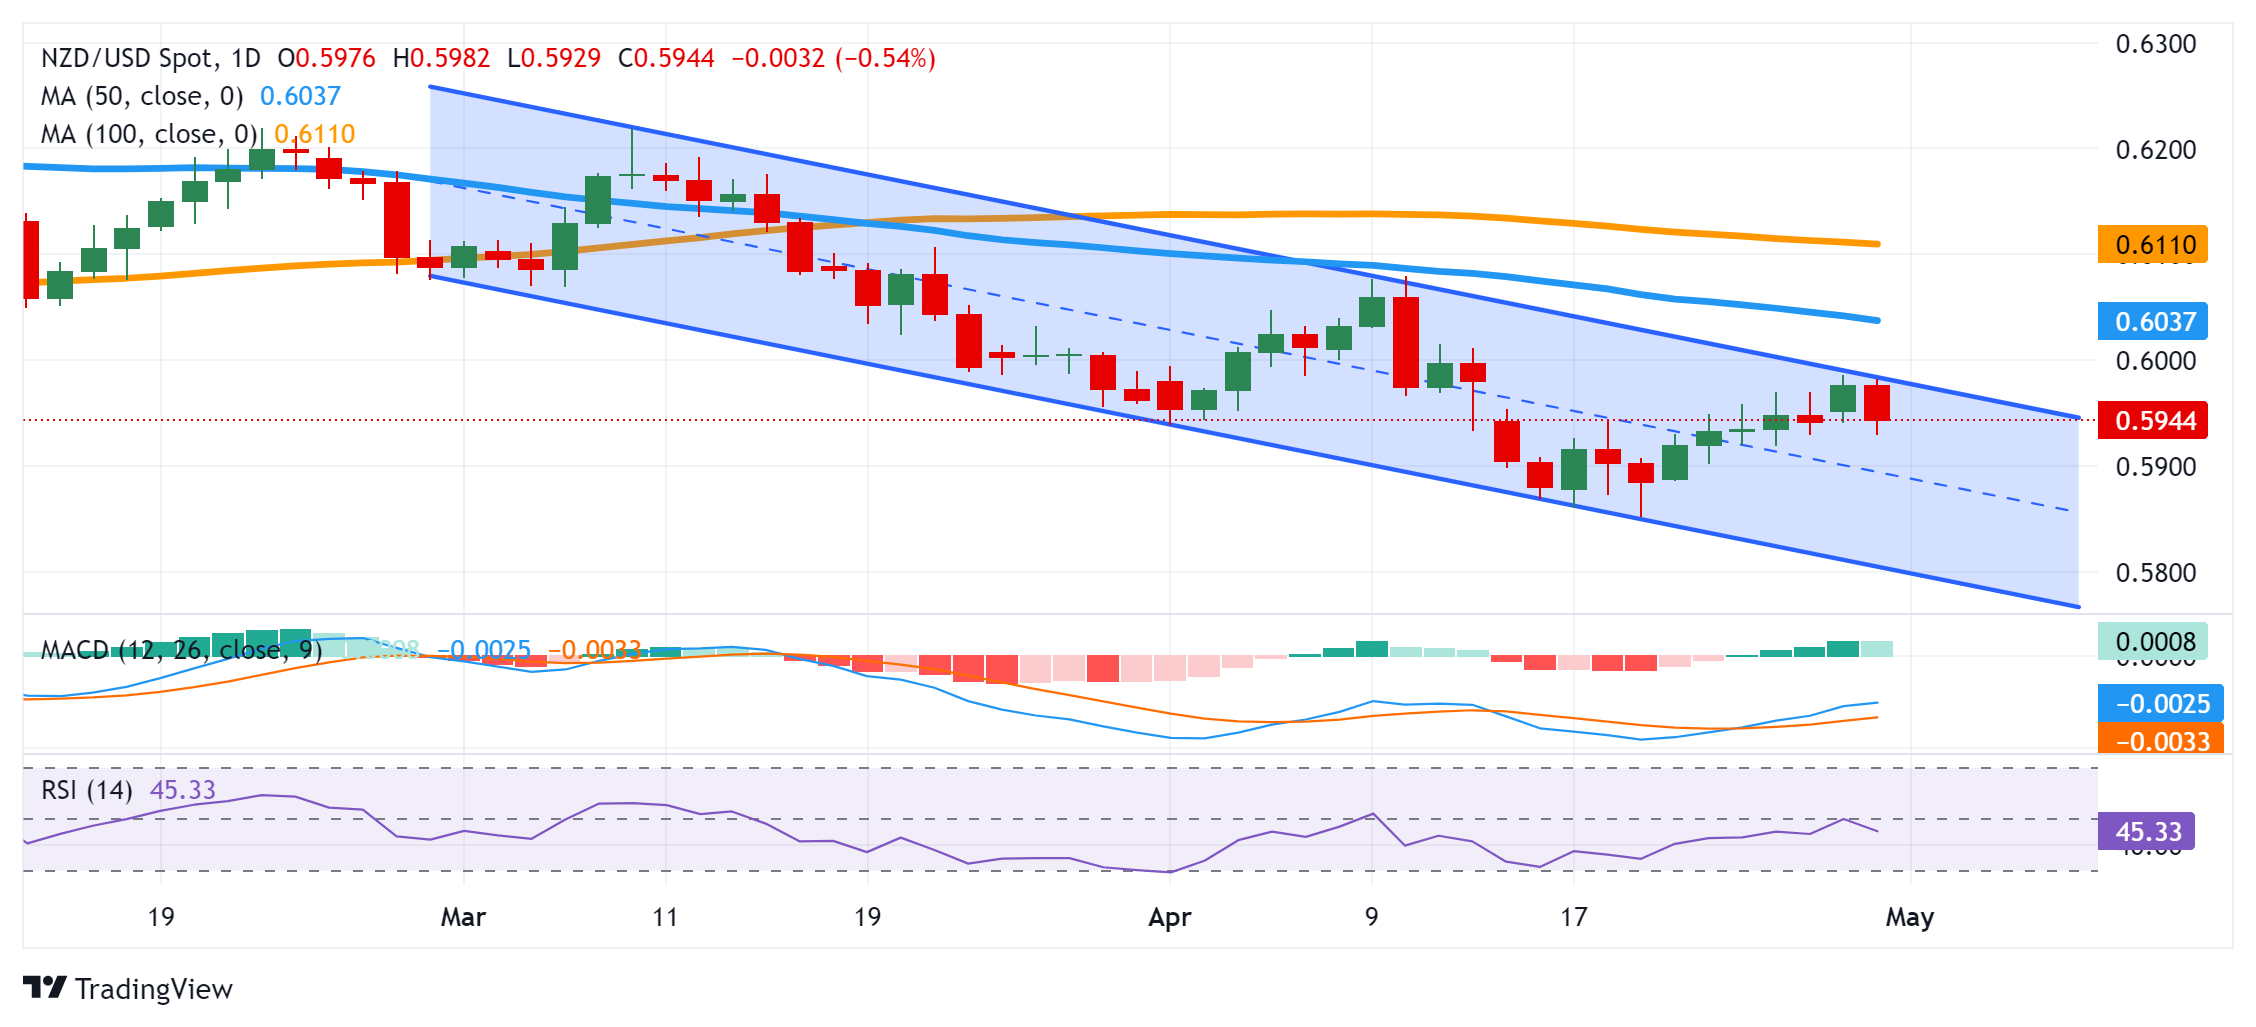
- USD/CAD could gain ground as technical analysis indicates a recovery of bullish sentiment.
- A break above 1.3800 could lead the pair to revisit its five-month high of 1.3846.
- A breach below the channel’s lower boundary around 1.3630 could weaken the bullish sentiment.
USD/CAD consolidates within the ascending channel on the daily chart, with the 14-day Relative Strength Index (RSI) positioned above 50, indicating a recovery of bullish sentiment. The pair edges higher to near 1.3700 during the European session on Tuesday.
Moreover, the Moving Average Convergence Divergence (MACD) line is above the centerline, signaling bullish momentum, although it remains below the signal line. Traders may look for confirmation from the MACD, a lagging indicator, to ascertain the direction of the trend.
The USD/CAD pair may encounter resistance near the psychological level of 1.3800. A breakthrough above this level could pave the way for the pair to revisit its five-month high of 1.3846, followed by the upper boundary of the ascending channel and the psychological barrier of 1.3900.
On the downside, the USD/CAD pair might test the lower boundary of the channel around the 1.3630 level. A breach below this level could exert downward pressure on the pair, leading it toward the region around the psychological support at 1.3600 and the 38.2% Fibonacci retracement level of 1.3591, plotted between the levels of 1.3178 and 1.3846.
The next significant support level lies at 1.3478, should the USD/CAD pair experience further depreciation, followed by December’s low at 1.3178.
USD/CAD: Daily Chart
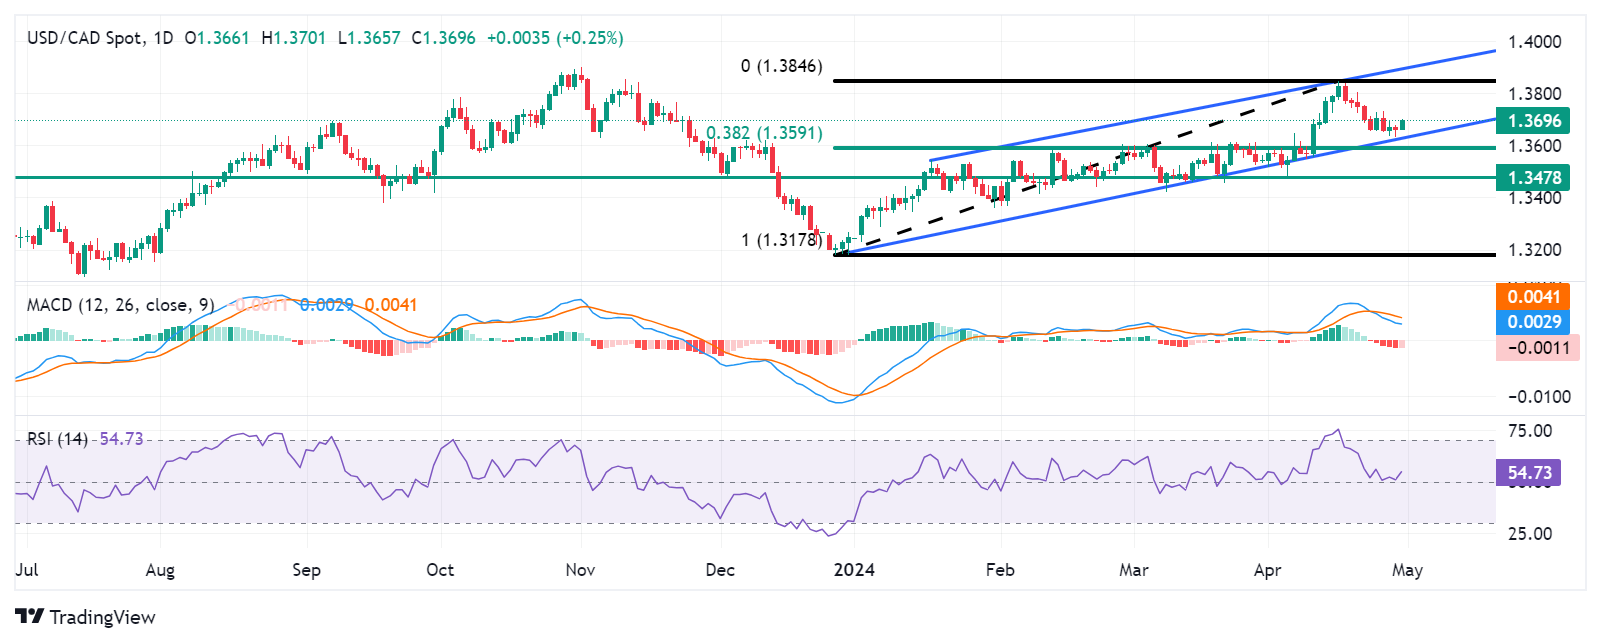
The Eurozone economy expanded in the three months to March of 2024, rebounding 0.3% from no growth reported in the final quarter of 2023, the preliminary estimate released by Eurostat showed Tuesday.
The GDP data beat the market’s expectations for a 0.1% growth.
The bloc’s GDP expanded at an annual pace of 0.4% in Q1 vs. 0.1%% in Q4 while beating the estimated 0.2% reading.
EUR/USD reaction to the Eurozone GDP report
EUR/USD drew bids on the upbeat Eurozone growth data and was last seen trading at 1.0723, bouncing off from near 1.0700 while modestly flat on the day.
Euro price today
The table below shows the percentage change of Euro (EUR) against listed major currencies today. Euro was the weakest against the US Dollar.
| USD | EUR | GBP | CAD | AUD | JPY | NZD | CHF | |
| USD | -0.06% | 0.09% | 0.17% | 0.45% | 0.40% | 0.48% | 0.07% | |
| EUR | 0.06% | 0.15% | 0.23% | 0.51% | 0.52% | 0.54% | 0.13% | |
| GBP | -0.09% | -0.15% | 0.08% | 0.43% | 0.31% | 0.32% | -0.02% | |
| CAD | -0.17% | -0.23% | -0.08% | 0.26% | 0.22% | 0.31% | -0.10% | |
| AUD | -0.45% | -0.58% | -0.42% | -0.26% | -0.05% | 0.03% | -0.36% | |
| JPY | -0.39% | -0.46% | -0.25% | -0.22% | 0.14% | 0.08% | -0.35% | |
| NZD | -0.40% | -0.47% | -0.32% | -0.24% | 0.04% | -0.01% | -0.34% | |
| CHF | -0.05% | -0.13% | 0.02% | 0.10% | 0.37% | 0.36% | 0.40% |
The heat map shows percentage changes of major currencies against each other. The base currency is picked from the left column, while the quote currency is picked from the top row. For example, if you pick the Euro from the left column and move along the horizontal line to the Japanese Yen, the percentage change displayed in the box will represent EUR (base)/JPY (quote).
The Eurozone Harmonized Index of Consumer Prices (HICP) rose at an annual pace of 2.4% in April, the same as that seen in March, according to the official data released by Eurostat on Tuesday. The market forecast was for a 2.4% growth in the reported period.
The Core HICP inflation fell to 2.7% YoY in April, as against March’s 2.9% rise while outpacing the anticipated 2.6% figure.
Meanwhile, the bloc’s HICP increased 0.6% over the month in April after rising 0.8% in March. The core HICP inflation arrived at 0.7% MoM in the same period, compared to a 1.1% raise seen previously.
The European Central Bank’s (ECB) inflation target is 2.0%. The old continent’s HICP inflation data have a major bearing on the market’s pricing of the ECB interest rate outlook.
Key details from the Eurozone inflation report (via Eurostat)
“Looking at the main components of euro area inflation, services are expected to have the highest annual rate in April (3.7%, compared with 4.0% in March), followed by food, alcohol & tobacco (2.8%, compared with 2.6% in March), non-energy industrial goods (0.9%, compared with 1.1% in March) and energy (-0.6%, compared with -1.8% in March).”
EUR/USD reaction to the Eurozone inflation report
The Euro catches a fresh bid on mixed Eurozone inflation data. EUR/USD is trading almost unchanged on the day at 1.0721, at the press time, having erased early losses.
Euro price today
The table below shows the percentage change of Euro (EUR) against listed major currencies today. Euro was the weakest against the US Dollar.
| USD | EUR | GBP | CAD | AUD | JPY | NZD | CHF | |
| USD | -0.02% | 0.14% | 0.21% | 0.52% | 0.40% | 0.48% | 0.13% | |
| EUR | 0.00% | 0.14% | 0.21% | 0.53% | 0.46% | 0.48% | 0.13% | |
| GBP | -0.13% | -0.15% | 0.08% | 0.39% | 0.26% | 0.34% | 0.00% | |
| CAD | -0.21% | -0.23% | -0.07% | 0.30% | 0.18% | 0.27% | -0.08% | |
| AUD | -0.53% | -0.53% | -0.37% | -0.30% | -0.12% | -0.05% | -0.38% | |
| JPY | -0.41% | -0.42% | -0.27% | -0.20% | 0.12% | 0.07% | -0.30% | |
| NZD | -0.46% | -0.44% | -0.33% | -0.27% | 0.05% | -0.07% | -0.34% | |
| CHF | -0.11% | -0.15% | 0.01% | 0.08% | 0.39% | 0.30% | 0.34% |
The heat map shows percentage changes of major currencies against each other. The base currency is picked from the left column, while the quote currency is picked from the top row. For example, if you pick the Euro from the left column and move along the horizontal line to the Japanese Yen, the percentage change displayed in the box will represent EUR (base)/JPY (quote).
Silver prices (XAG/USD) fell on Tuesday, according to FXStreet data. Silver trades at $26.61 per troy ounce, down 1.96% from the $27.14 it cost on Monday.
Silver prices have increased by 4.48% since the beginning of the year.
| Unit measure | Today Price |
|---|---|
| Silver price per troy ounce | $26.61 |
| Silver price per gram | $0.86 |
The Gold/Silver ratio, which shows the number of troy ounces of Silver needed to equal the value of one troy ounce of Gold, stood at 86.93 on Tuesday, up from 86.06 on Monday.
Investors might use this ratio to determine the relative valuation of Gold and Silver. Some may consider a high ratio as an indicator that Silver is undervalued – or Gold is overvalued – and might buy Silver or sell Gold accordingly. Conversely, a low ratio might suggest that Gold is undervalued relative to Silver.
Silver FAQs
Silver is a precious metal highly traded among investors. It has been historically used as a store of value and a medium of exchange. Although less popular than Gold, traders may turn to Silver to diversify their investment portfolio, for its intrinsic value or as a potential hedge during high-inflation periods. Investors can buy physical Silver, in coins or in bars, or trade it through vehicles such as Exchange Traded Funds, which track its price on international markets.
Silver prices can move due to a wide range of factors. Geopolitical instability or fears of a deep recession can make Silver price escalate due to its safe-haven status, although to a lesser extent than Gold's. As a yieldless asset, Silver tends to rise with lower interest rates. Its moves also depend on how the US Dollar (USD) behaves as the asset is priced in dollars (XAG/USD). A strong Dollar tends to keep the price of Silver at bay, whereas a weaker Dollar is likely to propel prices up. Other factors such as investment demand, mining supply – Silver is much more abundant than Gold – and recycling rates can also affect prices.
Silver is widely used in industry, particularly in sectors such as electronics or solar energy, as it has one of the highest electric conductivity of all metals – more than Copper and Gold. A surge in demand can increase prices, while a decline tends to lower them. Dynamics in the US, Chinese and Indian economies can also contribute to price swings: for the US and particularly China, their big industrial sectors use Silver in various processes; in India, consumers’ demand for the precious metal for jewellery also plays a key role in setting prices.
Silver prices tend to follow Gold's moves. When Gold prices rise, Silver typically follows suit, as their status as safe-haven assets is similar. The Gold/Silver ratio, which shows the number of ounces of Silver needed to equal the value of one ounce of Gold, may help to determine the relative valuation between both metals. Some investors may consider a high ratio as an indicator that Silver is undervalued, or Gold is overvalued. On the contrary, a low ratio might suggest that Gold is undervalued relative to Silver.
Gold prices fell in India on Tuesday, according to data from India's Multi Commodity Exchange (MCX).
Gold price stood at 71,777 Indian Rupees (INR) per 10 grams, down INR 123 compared with the INR 71,900 it cost on Monday.
As for futures contracts, Gold prices decreased to INR 70,977 per 10 gms from INR 71,602 per 10 gms.
Prices for Silver futures contracts decreased to INR 81,250 per kg from INR 82,483 per kg.
| Major Indian city | Gold Price |
|---|---|
| Ahmedabad | 74,225 |
| Mumbai | 73,905 |
| New Delhi | 74,145 |
| Chennai | 74,260 |
| Kolkata | 74,230 |
Global Market Movers: Comex Gold price extends losses amid goodish US Dollar rebound
- Friday's release of the US Personal Consumption Expenditures (PCE) Price Index pointed to still sticky inflation and reaffirmed bets that the Federal Reserve will begin its rate-cutting cycle only in September.
- Hawkish Fed expectations act as a tailwind for the US Dollar, which, along with a generally positive risk tone, turn out to be key factors that contribute to capping the upside for the non-yielding Gold price on Comex.
- The global risk sentiment remains well supported on the back of receding fears about any further escalation of conflict between Iran and Israel and the latest optimism over Israel-Hamas peace talks in Cairo.
- Traders, however, now seem to have moved to the sidelines and refrain from positioning for a firm near-term direction ahead of this week's key central bank event risk and important US economic releases.
- The Fed is scheduled to announce its policy decision at the end of a two-day meeting on Wednesday, which will be followed by the release of the closely watched US jobs data, or the Nonfarm Payrolls report on Friday.
- Investors will look for cues about the Fed's future policy decisions and rate-cut path, which, in turn, should influence the USD price dynamics and help in determining the near-term trajectory for the XAU/USD.
- In the meantime, Tuesday's US economic docket – featuring the Chicago PMI and the Conference Board's Consumer Confidence Index – might provide some impetus later during the North American session.
(An automation tool was used in creating this post.)
Gold FAQs
Gold has played a key role in human’s history as it has been widely used as a store of value and medium of exchange. Currently, apart from its shine and usage for jewelry, the precious metal is widely seen as a safe-haven asset, meaning that it is considered a good investment during turbulent times. Gold is also widely seen as a hedge against inflation and against depreciating currencies as it doesn’t rely on any specific issuer or government.
Central banks are the biggest Gold holders. In their aim to support their currencies in turbulent times, central banks tend to diversify their reserves and buy Gold to improve the perceived strength of the economy and the currency. High Gold reserves can be a source of trust for a country’s solvency. Central banks added 1,136 tonnes of Gold worth around $70 billion to their reserves in 2022, according to data from the World Gold Council. This is the highest yearly purchase since records began. Central banks from emerging economies such as China, India and Turkey are quickly increasing their Gold reserves.
Gold has an inverse correlation with the US Dollar and US Treasuries, which are both major reserve and safe-haven assets. When the Dollar depreciates, Gold tends to rise, enabling investors and central banks to diversify their assets in turbulent times. Gold is also inversely correlated with risk assets. A rally in the stock market tends to weaken Gold price, while sell-offs in riskier markets tend to favor the precious metal.
The price can move due to a wide range of factors. Geopolitical instability or fears of a deep recession can quickly make Gold price escalate due to its safe-haven status. As a yield-less asset, Gold tends to rise with lower interest rates, while higher cost of money usually weighs down on the yellow metal. Still, most moves depend on how the US Dollar (USD) behaves as the asset is priced in dollars (XAU/USD). A strong Dollar tends to keep the price of Gold controlled, whereas a weaker Dollar is likely to push Gold prices up.
- Silver price tumbles to $26.70 as US yields rise ahead of Fed policy.
- The Fed is expected to keep interest rates steady with hawkish guidance.
- Investors should be prepared for high volatility this week, as the US NFP will follow the Fed’s policy.
Silver price (XAG/USD) drops to near three-week low of $26.70 in Tuesday’s European session. The white metal faces a sharp sell-off after breaking below the crucial support of $27.00. The asset faces pressure as the US Treasury yields rise amid caution ahead of the Federal Reserve’s (Fed) monetary policy announcement on Wednesday.
10-year US Treasury yields rise to 4.63% on expectations that the Fed will maintain a hawkish narrative. Higher yields on interest-bearing assets increase the opportunity cost of holding investments in non-yielding assets, such as Silver.
The CME FedWatch tool shows that interest rates will remain unchanged in the range of 5.25%-5.50%. Therefore, investors will keenly focus on the Fed’s guidance on interest rates. The Fed is expected to support keeping interest rates at restrictive levels for a longer period until it gets evidence that inflation will come down to the 2% target.
Investors will also watch whether the Fed remains committed to its three rate-cut projections this year. Doubts over the Fed’s three rate-cut projections that were shown in March’s dot plot have emerged due to United States inflation remaining stubbornly higher in the first quarter.
The US Dollar Index (DXY), which tracks the US Dollar’s value against six major currencies, bounces back to 105.90. The US dollar's appeal improves ahead of a data-packed week. This week, investors will focus on the ISM Manufacturing PMI and the Nonfarm Payrolls (NFP) report for April, which will be published on Wednesday and Friday, respectively.
Silver technical analysis
Silver price declines toward the horizontal support plotted from 14 April 2023 high around $26.09 on a daily timeframe. The above-mentioned support was earlier a major resistance for the Silver price bulls. The uncertainty over Silver’s near-term outlook deepens as it has slipped below the 20-period Exponential Moving Average (EMA), which trades around $27.20.
The 14-period Relative Strength Index (RSI) slips into the 40.00-60.00, suggesting that the bullish momentum has faded. However, the long-term outlook is still stable.
Silver daily chart
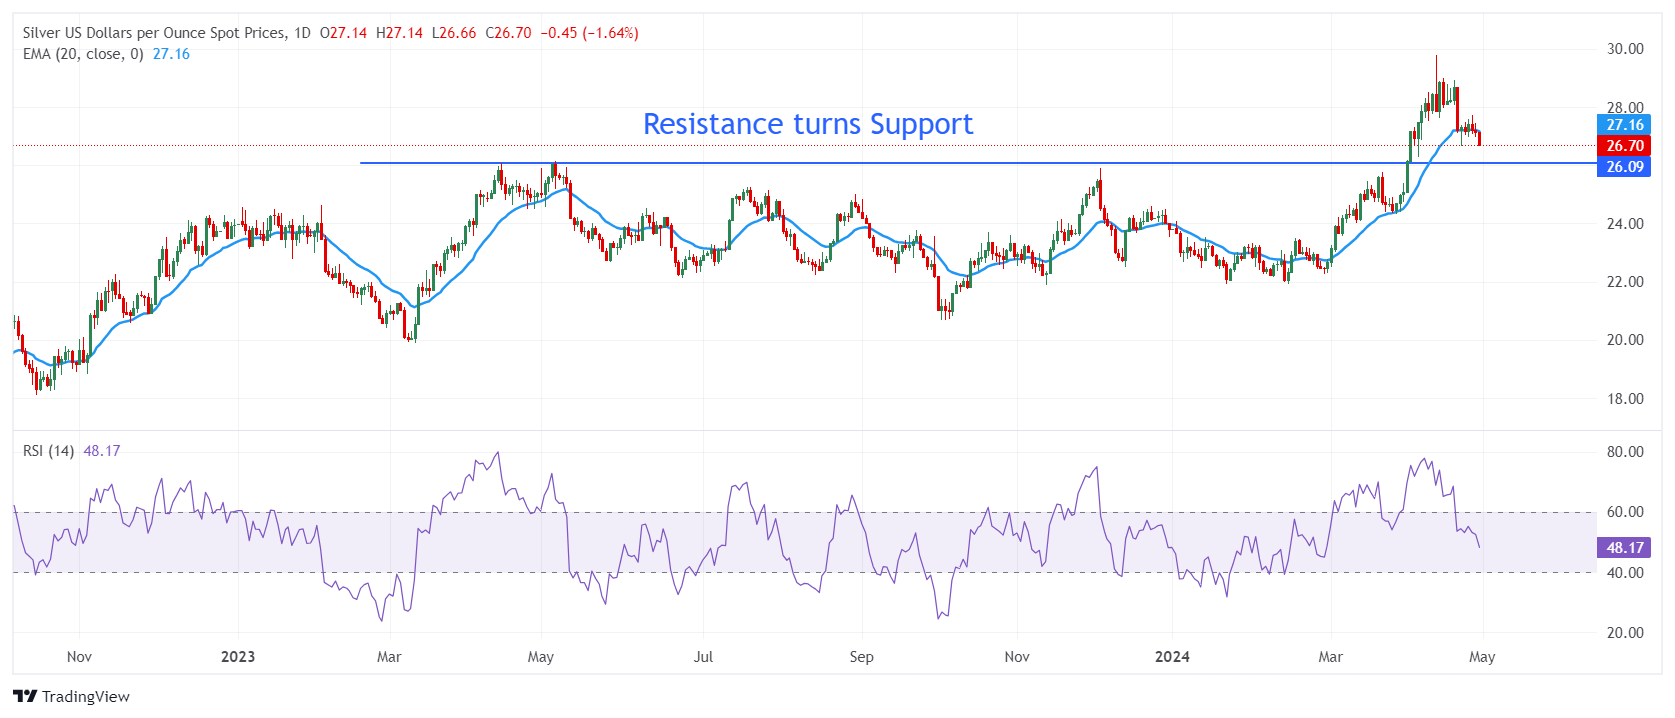
- The Pound Sterling falls to 1.2530 as investors turn cautious ahead of the Fed’s policy announcement.
- Investors will also focus on US Manufacturing PMI and labor market data in addition to the Fed's policy.
- Market expectations for UK interest rates will guide the Pound Sterling.
The Pound Sterling (GBP) edges down from a two-week high of 1.2570 but holds above the psychological support of 1.2500 against the US Dollar (USD) in Tuesday’s London session. The GBP/USD pair comes under pressure as investors await the US Federal Reserve’s (Fed) monetary policy announcement on Wednesday for fresh guidance.
A data-packed week in the United States will keep the US Dollar on tenterhooks. On the other side of the Atlantic, the United Kingdom's economic calendar is light. Therefore, market speculation for the Bank of England’s (BoE) interest rate policy on May 9 will guide the Pound Sterling. The BoE is expected to maintain the status quo, but guidance on interest rates is expected to be slightly on the dovish side.
BoE Governor Andrew Bailey is confident about a sharp decline in the headline inflation of April and sees market expectations for two or three rate cuts this year as reasonable. Also, BoE Deputy Governor Dave Ramsden has predicted that risks of inflation remaining persistent have receded. The BoE could shed more light on the time frame from when it could start reducing interest rates. Market participants remain divided between June or August meetings from when the BoE could pivot to interest rate cuts.
Daily digest market movers: Pound Sterling falls while US Dollar rebounds
- The Pound Sterling struggles to extend upside above the immediate resistance of 1.2560 against the US Dollar. Market sentiment turns cautious as investors shift focus to the Federal Reserve’s interest rate decision, which will be announced on Wednesday. S&P 500 futures are down in the European session, exhibiting a decline in investors’ risk appetite. Investors will keenly focus on the interest rate guidance as policymakers are expected to vote for holding interest rates steady in the range of 5.25%-5.50%.
- Inflation measures for March have indicated that price pressures remain persistently higher due to robust consumer spending and tight labor market conditions. This would force the Fed to support the argument of keeping interest rates higher for a longer period. Fed policymakers are expected to continue with their current monetary policy framework until they get sufficient evidence that inflation will sustainably return to the desired rate of 2% target.
- The US Dollar Index (DXY) rebounds to near 106.00 on expectations that the Fed will maintain a hawkish guidance. Before the Fed policy, investors will watch the ADP Employment Change and the ISM Manufacturing Purchasing Managers Index (PMI) data for April. US private employers are forecasted to have hired 179K job-seekers, slightly lower from the prior reading of 184K.
- The US ISM PMI is expected to remain above the 50.0 threshold that separates expansion from contraction but will drop slightly to 50.1 from 50.3. On the same, the survey by S&P Global for April showed that the factory data fell below the 50.0 threshold. The agency reported a sharp decline in the scale of production and new orders due to inflationary pressures, weak demand and sufficient stock holdings at customers.
- Later this week, the US Dollar will be guided by the Nonfarm Payrolls (NFP) report for April, which will be published on Friday.
Technical Analysis: Pound Sterling holds the 1.2500 support
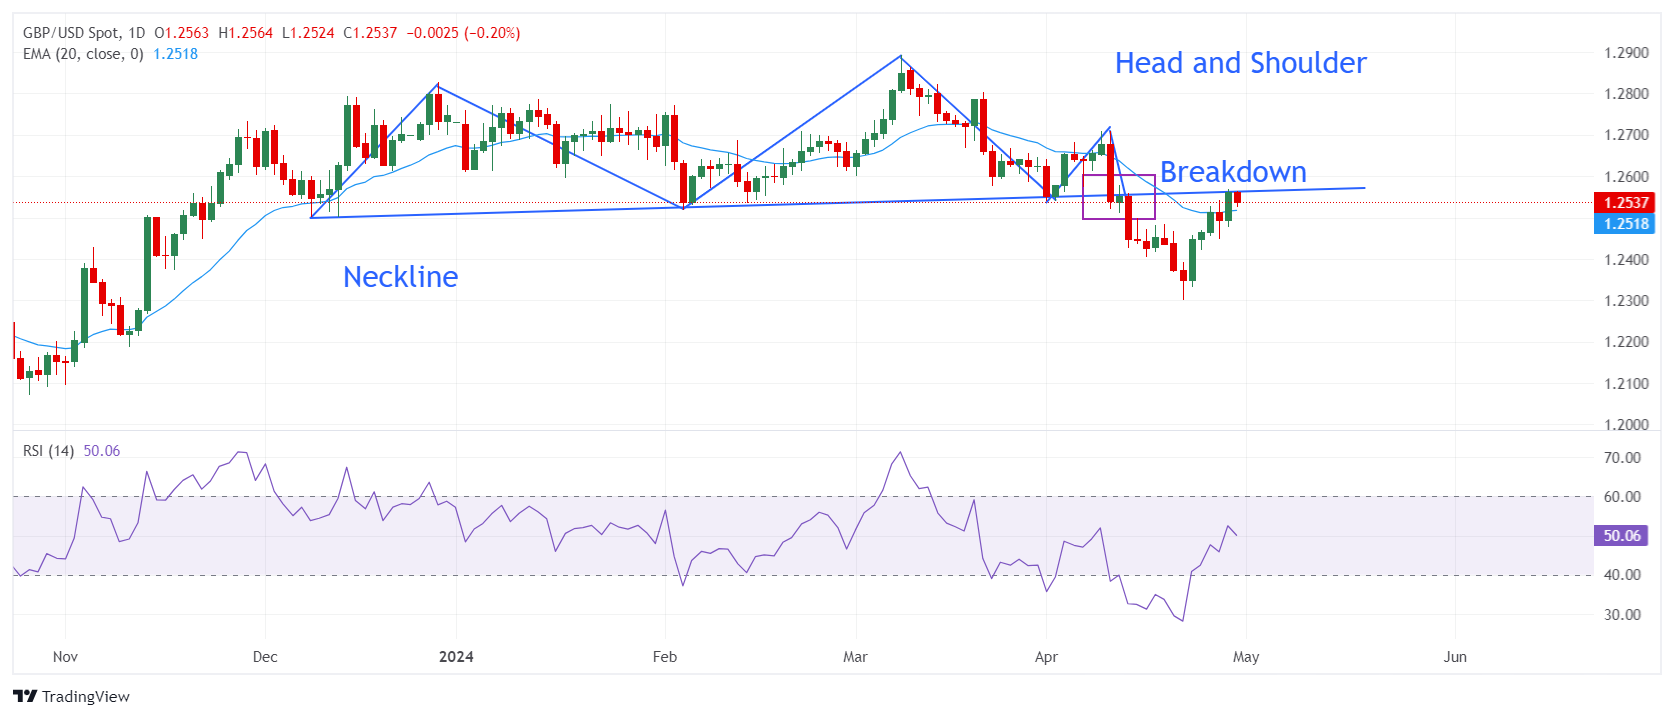
The Pound Sterling falls from a two-week high of 1.2570 against the Greenback. The GBP/USD pair struggled to extend its upside reaching the breakdown region of the Head and Shoulder chart pattern formed on a daily timeframe. The Cable witnessed a sharp fall after breaking below the crucial support of 1.2535 on April 12, but it has recovered recent losses since then.
Cable's near-term outlook has improved as it trades comfortably above the 20-day Exponential Moving Average (EMA), which is around 1.2516.
The 14-period Relative Strength Index (RSI) shifts into the 40.00-60.00 range, suggesting a consolidation ahead.
BoE FAQs
The Bank of England (BoE) decides monetary policy for the United Kingdom. Its primary goal is to achieve ‘price stability’, or a steady inflation rate of 2%. Its tool for achieving this is via the adjustment of base lending rates. The BoE sets the rate at which it lends to commercial banks and banks lend to each other, determining the level of interest rates in the economy overall. This also impacts the value of the Pound Sterling (GBP).
When inflation is above the Bank of England’s target it responds by raising interest rates, making it more expensive for people and businesses to access credit. This is positive for the Pound Sterling because higher interest rates make the UK a more attractive place for global investors to park their money. When inflation falls below target, it is a sign economic growth is slowing, and the BoE will consider lowering interest rates to cheapen credit in the hope businesses will borrow to invest in growth-generating projects – a negative for the Pound Sterling.
In extreme situations, the Bank of England can enact a policy called Quantitative Easing (QE). QE is the process by which the BoE substantially increases the flow of credit in a stuck financial system. QE is a last resort policy when lowering interest rates will not achieve the necessary result. The process of QE involves the BoE printing money to buy assets – usually government or AAA-rated corporate bonds – from banks and other financial institutions. QE usually results in a weaker Pound Sterling.
Quantitative tightening (QT) is the reverse of QE, enacted when the economy is strengthening and inflation starts rising. Whilst in QE the Bank of England (BoE) purchases government and corporate bonds from financial institutions to encourage them to lend; in QT, the BoE stops buying more bonds, and stops reinvesting the principal maturing on the bonds it already holds. It is usually positive for the Pound Sterling.
- USD/CHF rebounds possibly due to the hawkish remarks from Fed officials.
- Fed Chair Powell said that it may take "longer than expected" to gain confidence if inflation is weakening.
- The Swiss KOF Leading Indicator indicated robust development in the domestic economy.
USD/CHF retraces its recent losses registered on Monday, trading around 0.9130 during the European session on Tuesday. The US Dollar (USD) appreciates, possibly due to hawkish remarks from US Federal Reserve (Fed) officials, indicating no immediate need for rate cuts. This has underpinned the USD/CHF pair.
According to a report by The Economic Times on Monday, Fed Chair Jerome Powell said that it may take "longer than expected" to gain confidence that inflation is progressing toward the central bank's 2% target. Powell also emphasized that the central bank can maintain high rates "as long as needed." Additionally, Fed Governor Michelle Bowman expressed concerns about "upside risks" to inflation. Meanwhile, Minneapolis Fed President Neel Kashkari floated the possibility of no rate cuts occurring this year.
On the Swiss side, the KOF Leading Indicator, which reflects GDP growth and economic trends in Switzerland, increased to 101.8 in April from a downwardly revised 100.4 in March, slightly below forecasts of 102.1. Although the figure suggests stabilization above the long-term average, indicating robust development in the Swiss economy, there is no strong upward momentum anticipated soon.
According to a report from Bloomberg, Swiss National Bank (SNB) Chairman Thomas J. Jordan said last Friday that the central bank is dedicated to closely monitoring inflation. Jordan emphasized that the SNB is prepared to lower interest rates further if needed. While highlighting the SNB's achievements in addressing inflation, he also warned of ongoing high uncertainty and the potential for unexpected shocks.
- German GDP rebounds 0.2% QoQ in Q1 vs. 0.1% estimate.
- Annual German GDP contracts 0.2% in Q1 vs. -0.2% anticipated.
- EUR/USD shrugs off the mixed German Q1 GDP report.
The German economy grew 0.2% over the quarter in the first quarter of 2024 after contracting 0.3% in the last quarter of 2023, according to the preliminary data published by Destatis on Tuesday. The data surpassed the expected 0.1% expansion.
Meanwhile, the annual GDP rate declined by 0.2% in Q1, at the same pace as seen in the fourth quarter of last year while matching the market expectations.
Germany’s Unemployment Rate held steady at 5.9% in April while Unemployment Change stood at 10K, higher than the 7K expected.
EUR/USD reaction to the German GDP data
EUR/USD paid little attention to the German GDP report, losing 0.16% on the day to trade at 1.0702, at the time of writing. The pair awaits the Eurozone Preliminary GDP and inflation data for a fresh directional impetus.
Euro price today
The table below shows the percentage change of Euro (EUR) against listed major currencies today. Euro was the weakest against the US Dollar.
| USD | EUR | GBP | CAD | AUD | JPY | NZD | CHF | |
| USD | 0.13% | 0.17% | 0.20% | 0.53% | 0.37% | 0.57% | 0.26% | |
| EUR | -0.13% | 0.04% | 0.07% | 0.40% | 0.29% | 0.44% | 0.12% | |
| GBP | -0.17% | -0.05% | 0.03% | 0.35% | 0.19% | 0.39% | 0.08% | |
| CAD | -0.20% | -0.07% | -0.03% | 0.32% | 0.15% | 0.37% | 0.05% | |
| AUD | -0.53% | -0.39% | -0.35% | -0.32% | -0.17% | 0.03% | -0.27% | |
| JPY | -0.37% | -0.23% | -0.19% | -0.17% | 0.15% | 0.20% | -0.14% | |
| NZD | -0.55% | -0.44% | -0.43% | -0.37% | -0.05% | -0.20% | -0.31% | |
| CHF | -0.23% | -0.13% | -0.08% | -0.04% | 0.27% | 0.14% | 0.31% |
The heat map shows percentage changes of major currencies against each other. The base currency is picked from the left column, while the quote currency is picked from the top row. For example, if you pick the Euro from the left column and move along the horizontal line to the Japanese Yen, the percentage change displayed in the box will represent EUR (base)/JPY (quote).
- The Mexican Peso pauses in its recovery in most major pairs.
- Risk appetite continues to be positive, however, supporting a bullish outlook for the Peso.
- Analysts at Rabobank expect the Peso to appreciate as long as volatility remains subdued.
The Mexican Peso (MXN) has stalled after rallying against most counterparts over recent sessions. The Peso had been supported by a rise in risk appetite from easing geopolitical tensions and strong US tech company earnings.
On Tuesday the general market mood remains positive, helped by the Caixin Chinese Manufacturing PMI – which hit a 14-month high – as well as French and Spanish GDP growth beating estimates in Q1.
USD/MXN is trading at 17.03, EUR/MXN at 18.22 and GBP/MXN at 21.34, at the time of publication during the European session.
Mexican Peso traders await GDP data
The Mexican Peso could be subject to volatility after the release of the preliminary reading for Q1 Mexican GDP growth data at 12:00 GMT.
In the previous quarter, the GDP growth rate was recorded as 2.5% YoY and 0.1% QoQ. If the data beats the previous results it could lead to an appreciation in the Mexican Peso.
Mexican Peso to continue strengthening – Rabobank
The Mexican Peso will continue to strengthen as long as market volatility remains low, according to analysts at Rabobank.
“..as long as volatility is declining, MXN will rally. While suppression of volatility is a tenuous assumption, it is our base case for the next couple of weeks,” says Rabobank.
Relatively high interest rates in Mexico – the Banxico overnight interest rate is 11.00% – support inflows from the carry trade in which traders borrow in a currency with low interest rates and use the loan to buy a currency with higher interest rates like the Mexican Peso.
“We expect interest rate differentials to remain favorable,” says Rabobank.
In the case of Mexican Peso’s most highly traded pair USD/MXN, the rate differential remains Peso-favorable.
“US-MX 2yr rate differentials have widened 33bp in April and will continue to act supportive for MXN over the course of May.”
The Banxico is likely to keep interest rates unchanged at its May meeting based on recent Banxico commentary.
“We have changed our Banxico forecast to reflect a pause at the May 9 meeting. This follows Deputy Governor Jonathan Heath’s interview on April 20, when he noted that he is ‘leaning towards a pause in May, and we can see how data evolves by June,’ which he highlighted is ‘likely’ to be a unanimous decision,” says Rabobank.
The high number of long positions amongst non-commercial speculators in the MXN futures market as well as a seasonal effect, which suggests May is a favorable month for MXN, are further drivers of upside, according to the bank.
Rabobank forecasts USD/MXN to fall below 17.00, eventually reaching a target of 16.80.
Technical Analysis: USD/MXN sideways trend continues
USD/MXN further extends its sideways trend over the short-term, oscillating within a range that has a floor at 16.86 and a ceiling at 17.40.
USD/MXN 4-hour Chart
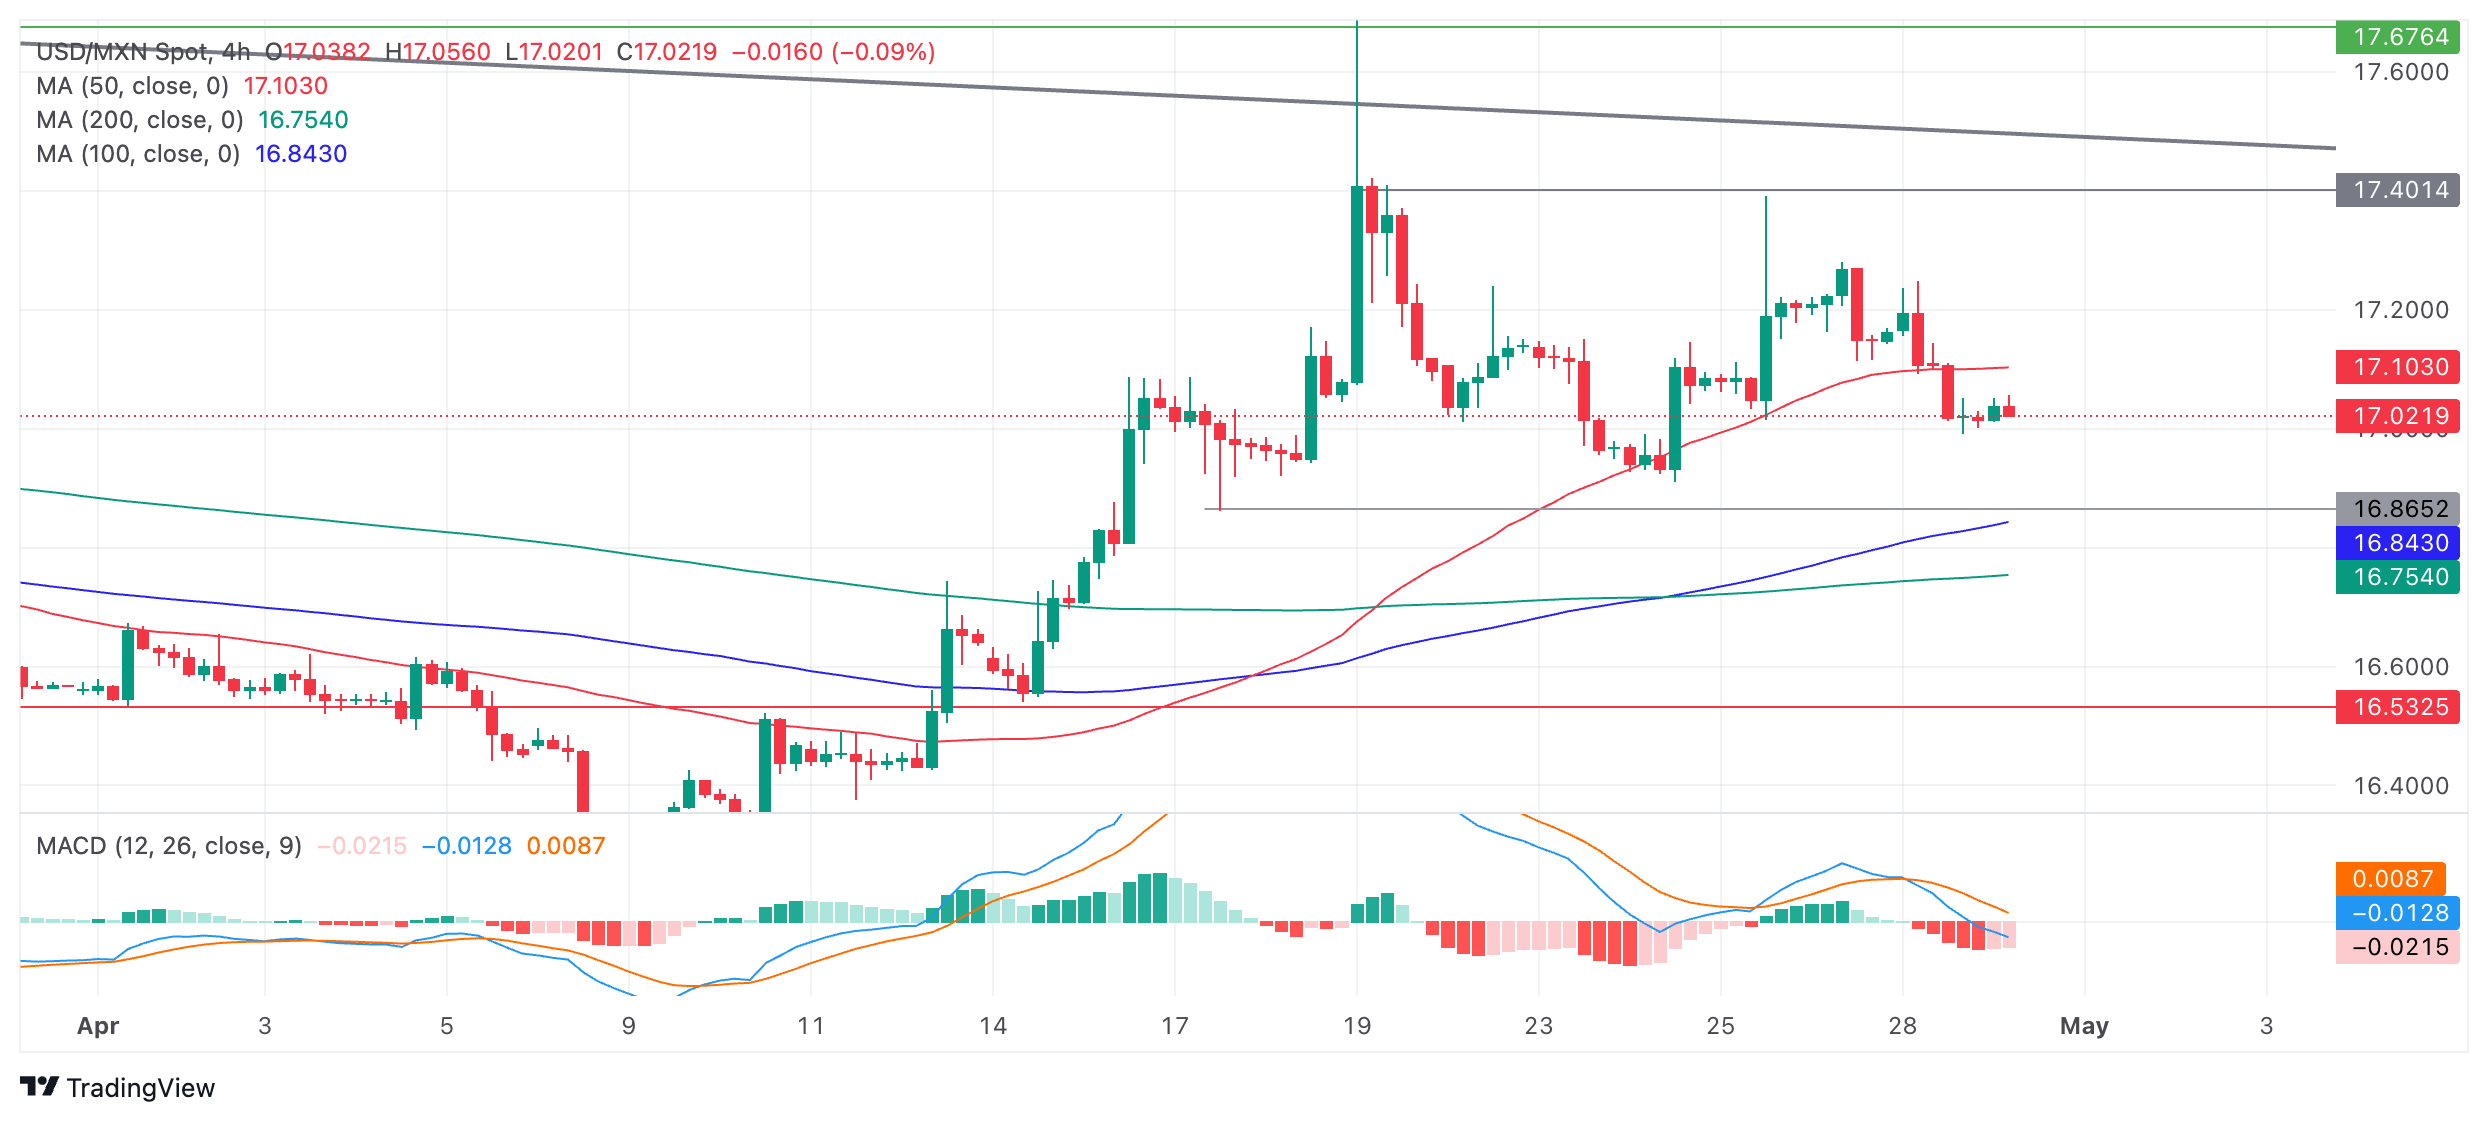
The pair is in a down leg within the sideways trend and could continue falling to the range lows. The Moving Average Convergence/ Divergence (MACD) is printing a red histogram and looks poised to move below the zero line, further adding a bearish tenor to the chart.
A decisive breakout of the range – either below the floor at 16.86, or the ceiling at 17.40 – would change the directional bias of the pair.
A break below the floor could see further downside to a target at 16.50, followed by the April 9 low at 16.26.
On the other side, a break above the top would activate an upside target first at 17.67, piercing a long-term trendline and then possibly reaching a further target at around 18.15.
A decisive break would be one characterized by a longer-than-average green or red daily candlestick that pierces above or below the range high or low, and that closes near its high or low for the period; or three green/red candlesticks in a row that pierce above/below the respective levels.
Economic Indicator
Gross Domestic Product (QoQ)
The Gross Domestic Product released by INEGI is a measure of the total value of all goods and services produced by Mexico. The GDP is considered as a broad measure of economic activity and health. Generally speaking, a high reading is seen as positive (or bullish) for the Peso, while a negative trend is seen as negative (or bearish).
Read more.
On Tuesday, China’s Politburo, the country’s top leadership, said they “will implement prudent monetary policy, proactive fiscal policy.”
Additional quotes
Will flexibly use policy tools, including Reserve Requirement Ratio (RRR) and interest rates.
Will actively expand domestic demand.
Discussed property measures.
Will coordinate and study on policy measures to resolve home inventories.
Will ensure debt-laden provinces and cities to reduce debt burden, meanwhile developing steadily.
Will promote healthy development of capital market.
Economic recovery still faces multiple challenges.
Will support private firms to explore overseas markets.
Will step up efforts to attact and utilize foreign capital.
Market reaction
These comments seem to help limit the losses in the Australian Dollar, as AUD/USD is holding the bounce near 0.6525, still down 0.65% on the day.
Australian Dollar FAQs
One of the most significant factors for the Australian Dollar (AUD) is the level of interest rates set by the Reserve Bank of Australia (RBA). Because Australia is a resource-rich country another key driver is the price of its biggest export, Iron Ore. The health of the Chinese economy, its largest trading partner, is a factor, as well as inflation in Australia, its growth rate and Trade Balance. Market sentiment – whether investors are taking on more risky assets (risk-on) or seeking safe-havens (risk-off) – is also a factor, with risk-on positive for AUD.
The Reserve Bank of Australia (RBA) influences the Australian Dollar (AUD) by setting the level of interest rates that Australian banks can lend to each other. This influences the level of interest rates in the economy as a whole. The main goal of the RBA is to maintain a stable inflation rate of 2-3% by adjusting interest rates up or down. Relatively high interest rates compared to other major central banks support the AUD, and the opposite for relatively low. The RBA can also use quantitative easing and tightening to influence credit conditions, with the former AUD-negative and the latter AUD-positive.
China is Australia’s largest trading partner so the health of the Chinese economy is a major influence on the value of the Australian Dollar (AUD). When the Chinese economy is doing well it purchases more raw materials, goods and services from Australia, lifting demand for the AUD, and pushing up its value. The opposite is the case when the Chinese economy is not growing as fast as expected. Positive or negative surprises in Chinese growth data, therefore, often have a direct impact on the Australian Dollar and its pairs.
Iron Ore is Australia’s largest export, accounting for $118 billion a year according to data from 2021, with China as its primary destination. The price of Iron Ore, therefore, can be a driver of the Australian Dollar. Generally, if the price of Iron Ore rises, AUD also goes up, as aggregate demand for the currency increases. The opposite is the case if the price of Iron Ore falls. Higher Iron Ore prices also tend to result in a greater likelihood of a positive Trade Balance for Australia, which is also positive of the AUD.
The Trade Balance, which is the difference between what a country earns from its exports versus what it pays for its imports, is another factor that can influence the value of the Australian Dollar. If Australia produces highly sought after exports, then its currency will gain in value purely from the surplus demand created from foreign buyers seeking to purchase its exports versus what it spends to purchase imports. Therefore, a positive net Trade Balance strengthens the AUD, with the opposite effect if the Trade Balance is negative.
Here is what you need to know on Tuesday, April 30:
Following a volatile opening to the week, financial markets remain relatively quiet early Tuesday. Gross Domestic Product (GDP) data for the first quarter from the Euro area and Germany will be watched closely. Eurostat will also release the preliminary Harmonized Index of Consumer Prices (HICP) for April. The US economic docket will feature housing data and the Federal Reserve's (Fed) two-day meeting will get underway.
The US Dollar (USD) weakened against its major rivals on Monday and the USD Index closed the day in negative territory. In the European morning, the index recovers toward 106.00. In the meantime, the benchmark 10-year US Treasury bond yield holds above 4.6% and US stock index futures trade marginally lower. CB Consumer Confidence for April and Employment Cost Index data for the first quarter will also be watched closely in the second half of the day.
US Dollar price today
The table below shows the percentage change of US Dollar (USD) against listed major currencies today. US Dollar was the strongest against the Australian Dollar.
| USD | EUR | GBP | CAD | AUD | JPY | NZD | CHF | |
| USD | 0.09% | 0.21% | 0.19% | 0.61% | 0.34% | 0.55% | 0.18% | |
| EUR | -0.09% | 0.13% | 0.09% | 0.54% | 0.31% | 0.46% | 0.09% | |
| GBP | -0.20% | -0.11% | -0.02% | 0.40% | 0.14% | 0.34% | -0.02% | |
| CAD | -0.18% | -0.09% | 0.02% | 0.41% | 0.14% | 0.36% | -0.01% | |
| AUD | -0.61% | -0.51% | -0.39% | -0.41% | -0.27% | -0.06% | -0.42% | |
| JPY | -0.33% | -0.23% | -0.12% | -0.14% | 0.28% | 0.21% | -0.17% | |
| NZD | -0.53% | -0.46% | -0.34% | -0.36% | 0.06% | -0.20% | -0.32% | |
| CHF | -0.16% | -0.09% | 0.02% | 0.01% | 0.43% | 0.19% | 0.37% |
The heat map shows percentage changes of major currencies against each other. The base currency is picked from the left column, while the quote currency is picked from the top row. For example, if you pick the Euro from the left column and move along the horizontal line to the Japanese Yen, the percentage change displayed in the box will represent EUR (base)/JPY (quote).
Following Japan's suspected intervention in foreign exchange markets, USD/JPY fell to 154.50 in the Asian trading hours on Monday. The pair erased a portion of its daily losses later in the day and continued to recover toward 157.00 early Tuesday. Japan's top currency diplomat, Masato Kanda, said that he has no comment on foreign exchange intervention for now when was asked by media if authorities had stepped into markets to support the Yen. Kanda added that the Ministry of Finance will release figures on currency intervention at the end of May.
Japanese Yen holds above 157.00 against USD, looks to US macro data for fresh impetus.
EUR/USD registered small gains on Monday but lost its traction on Tuesday. The pair was last seen trading at around 1.0700. The data from Germany showed earlier in the day that Retail Sales rose 1.8% on a monthly basis in March following the 1.9% contraction recorded in February.
Australian Bureau of Statistics reported on Tuesday that Private Sector Credit grew 5.1% on a yearly basis in March, while Retail Sales declined by 0.4% (MoM). Meanwhile, Caixin Manufacturing PMI in China edged higher to 51.4 in April from 51.1 in March and NBS Non-Manufacturing PMI declined to 51.2 from 53. AUD/USD came under heavy bearish pressure following mixed data releases and declined toward 0.6500 during the Asian trading hours.
Australian Dollar drops toward a psychological level after weaker Retail Sales.
GBP/USD rose more than 0.5% on Monday but reversed its direction early Tuesday. As of writing, the pair was down 0.25% on the day near 1.2530.
Gold struggled to find direction on the first trading day of the week and closed virtually unchanged. XAU/USD stays on the back foot in the European session and trades below $2,330.
Inflation FAQs
Inflation measures the rise in the price of a representative basket of goods and services. Headline inflation is usually expressed as a percentage change on a month-on-month (MoM) and year-on-year (YoY) basis. Core inflation excludes more volatile elements such as food and fuel which can fluctuate because of geopolitical and seasonal factors. Core inflation is the figure economists focus on and is the level targeted by central banks, which are mandated to keep inflation at a manageable level, usually around 2%.
The Consumer Price Index (CPI) measures the change in prices of a basket of goods and services over a period of time. It is usually expressed as a percentage change on a month-on-month (MoM) and year-on-year (YoY) basis. Core CPI is the figure targeted by central banks as it excludes volatile food and fuel inputs. When Core CPI rises above 2% it usually results in higher interest rates and vice versa when it falls below 2%. Since higher interest rates are positive for a currency, higher inflation usually results in a stronger currency. The opposite is true when inflation falls.
Although it may seem counter-intuitive, high inflation in a country pushes up the value of its currency and vice versa for lower inflation. This is because the central bank will normally raise interest rates to combat the higher inflation, which attract more global capital inflows from investors looking for a lucrative place to park their money.
Formerly, Gold was the asset investors turned to in times of high inflation because it preserved its value, and whilst investors will often still buy Gold for its safe-haven properties in times of extreme market turmoil, this is not the case most of the time. This is because when inflation is high, central banks will put up interest rates to combat it. Higher interest rates are negative for Gold because they increase the opportunity-cost of holding Gold vis-a-vis an interest-bearing asset or placing the money in a cash deposit account. On the flipside, lower inflation tends to be positive for Gold as it brings interest rates down, making the bright metal a more viable investment alternative.
- EUR/GBP snaps the five-day losing streak near. 0.8535 in Tuesday’s early European session.
- German Retail Sales climbed 0.3% YoY in March, compared to a decline of 2.7% in February.
- The cautious approach from the BoE’s policymaker supports the Pound Sterling (GBP).
The EUR/GBP cross posts modest gains around 0.8535 during the early European trading hours on Tuesday. The latest German Retail Sales were hotter-than-expected. Later in the day, the Eurozone Gross Domestic Product (GDP) growth number Q1 and the first reading of the Harmonized Index of Consumer Prices (HICP) will be released.
German Retail Sales climbed 0.3% YoY in March from a decline of 2.7% in February, the Destatis showed on Tuesday. On a monthly basis, the Retail Sales figure rose 1.8% MoM in March, compared to a 1.9% drop in the previous month. Nonetheless, the Euro (EUR) fails to capitalize on the upbeat Retail Sales report.
Looking ahead, investors will focus on the release of Gross Domestic Product (GDP) for Q1 from Germany and the Eurozone, along with the Eurozone inflation data. If the reports show a softer-than-expected outcome, this might allow the ECB to pivot to interest rate cuts sooner and weigh on the EUR.
On the other hand, Bank of England (BoE) Chief Economist Huw Pill warned last week that there were greater risks from cutting the interest rate too quickly, rather than too late. His cautious approach to monetary policy provides some support to the British Pound (GBP). However, investors have priced in the first rate cut from the BoE in August, with 50 basis points (bps) expected. This, in turn, might exert some selling pressure on the Cable and cap the downside of the cross.
Germany's Retail Sales jumped by 1.8% MoM in March, rebounding from a 1.9% drop in February, the official data released by Destatis showed on Tuesday.
Annually, Retail Sales in the Eurozone's economic powerhouse rose 0.3% in March when compared to a decline of 2.7% in February.
EUR/USD reaction to the German data
Strong German data fails to move the needle around the Euro, keeping EUR/USD just below 1.0700. The pair is trading 0.19% down on the day at 1.0697, as of writing.
Euro price today
The table below shows the percentage change of Euro (EUR) against listed major currencies today. Euro was the weakest against the US Dollar.
| USD | EUR | GBP | CAD | AUD | JPY | NZD | CHF | |
| USD | 0.17% | 0.22% | 0.20% | 0.60% | 0.30% | 0.62% | 0.13% | |
| EUR | -0.17% | 0.04% | 0.02% | 0.44% | 0.12% | 0.44% | -0.04% | |
| GBP | -0.22% | -0.05% | -0.02% | 0.38% | 0.08% | 0.40% | -0.08% | |
| CAD | -0.19% | -0.03% | 0.02% | 0.39% | 0.09% | 0.42% | -0.07% | |
| AUD | -0.60% | -0.42% | -0.37% | -0.39% | -0.30% | 0.01% | -0.46% | |
| JPY | -0.30% | -0.12% | -0.08% | -0.04% | 0.30% | 0.32% | -0.15% | |
| NZD | -0.60% | -0.45% | -0.40% | -0.43% | -0.02% | -0.32% | -0.50% | |
| CHF | -0.11% | 0.04% | 0.09% | 0.06% | 0.46% | 0.16% | 0.48% |
The heat map shows percentage changes of major currencies against each other. The base currency is picked from the left column, while the quote currency is picked from the top row. For example, if you pick the Euro from the left column and move along the horizontal line to the Japanese Yen, the percentage change displayed in the box will represent EUR (base)/JPY (quote).
FX option expiries for Apr 29 NY cut at 10:00 Eastern Time, via DTCC, can be found below
- EUR/USD: EUR amounts
- 1.0615 895m
- 1.0625 483m
- 1.0650 640m
- 1.0700 482m
- 1.0750 1b
- GBP/USD: GBP amounts
- 1.2300 425m
- USD/JPY: USD amounts
- 154.00 1.3b
- 155.00 767m
- USD/CHF: USD amounts
- 0.8750 400m
- AUD/USD: AUD amounts
- 0.6455 463m
- 0.6625 520m
- USD/CAD: USD amounts
- 1.3570 660m
- EUR/JPY holds positive ground around 167.75 in Tuesday’s early European session.
- Japan's top currency diplomat declined to comment about any intervention move on Monday.
- ECB’s Knot said inflation in the Eurozone is moving towards the 2% target, while geopolitical tensions pose minor threats.
The EUR/JPY cross trades on a stronger note near 167.75 on Tuesday during the early European session. The cross edges higher despite a likely foreign exchange (FX) intervention by Japanese authorities on Monday. Market players will closely monitor the Gross Domestic Product (GDP) growth number for Q1 and the first reading of the Harmonized Index of Consumer Prices (HICP) from the Eurozone for fresh impetus.
Early Tuesday, Japan's top currency diplomat, Masato Kanda, offered no comments on FX intervention but said that recent movements have been "speculative, rapid, and abnormal.” Kanda further stated that excessive FX moves could impact daily lives, and the Japanese authorities are ready to take action 24 hours a day. The fear of further FX intervention might provide some support to the Japanese Yen (JPY) in the near term and cap the upside of the cross.
On the Euro front, European Central Bank (ECB) Governing Council member Klaas Knot said on Monday that inflation in the Eurozone is moving towards the ECB’s 2% target, while geopolitical tensions pose minor threats. Nonetheless, the central bank should still exercise caution when cutting interest rates beyond a first step in June. The ECB policymaker Pierre Wunsch stated that the July rate cut is not a done deal and that he still wants monetary policy to remain a little restrictive.
The ECB Vice President Luis de Guindos emphasized the progress on inflation but pulled back from making any clear projections on the pace of rate cuts. The uncertainties surrounding the ECB’s rate cut timing are likely to drag the Euro (EUR) lower and create a headwind for the EUR/JPY cross. However, the easing fears of geopolitical tensions in the Middle East might boost riskier assets, benefiting the EUR against the JPY.
- NZD/USD loses ground due to Tuesday's rebound in the US Dollar.
- The hawkish remarks from Fed officials indicate that there is no immediate need for interest rate cuts.
- ANZ Business Confidence has marked its lowest level since last September, indicating a significant economic deterioration.
NZD/USD retraces its recent gains, trading around 0.5950 during the Asian session on Tuesday. The rebound in the US Dollar (USD) undermines the NZD/USD pair, which could be attributed to the hawkish remarks from US Federal Reserve (Fed) officials, indicating no immediate need for rate cuts.
The Economic Times reported on Monday that Fed Chair Jerome Powell said it would probably take "longer than expected" to be confident that inflation is moving toward the central bank's 2% target. Powell also noted that the central bank can keep rates high "as long as needed." Additionally, Fed Governor Michelle Bowman voiced her concerns about "upside risks" to inflation. Meanwhile, Minneapolis Fed President Neel Kashkari suggested the possibility of no rate cuts occurring this year.
US Dollar Index (DXY), which gauges the performance of the US Dollar (USD) against six major currencies, edges higher to near 105.80, by the press time. Traders are anticipated to observe Wednesday's release of the ADP Employment Change and ISM Manufacturing PMI from the United States (US), alongside the Fed Interest Rate Decision. These events are likely to influence market sentiment and USD movement.
In New Zealand, the ANZ Business Confidence fell to 14.9 in April from March’s reading of 22.9, marking the third consecutive month of decline and hitting the lowest level since last September. This latest data suggests a notable weakening of the economy, likely influenced by the Reserve Bank of New Zealand’s (RBNZ) decision to raise interest rates.
Moreover, amid decreasing concerns about a potential conflict between Israel and Iran, growing optimism regarding peace talks between Israel and Hamas in Cairo is enhancing investors' appetite for riskier currencies such as the New Zealand Dollar (NZD). This sentiment could limit the losses of the NZD/USD pair.
- EUR/USD comes under renewed selling pressure amid a modest pickup in USD demand.
- The technical setup warrants caution for bearish traders ahead of the key Eurozone CPI.
- The market focus will then shift to the FOMC policy decision, scheduled for Wednesday.
The EUR/USD pair meets with some supply during the Asian session on Tuesday and erodes a part of the previous day's gains amid the emergence of fresh US Dollar (USD) buying. Spot prices, however, remain in a familiar range held over the past week or so and currently trade around the 1.0700 round-figure mark.
Hawkish Federal Reserve (Fed) expectations help revive the US Dollar (USD) demand. This, along with bets that the European Central Bank (ECB) will cut interest rates in June, turn out to be key factors exerting some downward pressure on the EUR/USD pair. Traders, however, seem reluctant to place aggressive directional bets ahead of the Eurozone consumer inflation figures on Tuesday and the outcome of a two-day FOMC policy meeting on Wednesday.
From a technical perspective, any subsequent decline is more likely to find decent support near the 1.0690-1.0685 confluence, comprising the 200-hour Simple Moving Average (SMA) and over a one-week-old ascending trend line. A convincing break below might prompt some technical selling and drag the EUR/USD pair towards last week's swing low, around the 1.0625 region en route to the 1.0600 mark or the YTD trough touched earlier this month.
On the flip side, bulls need to wait for a sustained strength beyond the 1.0730-1.0740 supply zone before positioning for any further gains. The EUR/USD pair might then accelerate the positive move towards reclaiming the 1.0800 round figure before climbing to the 1.0835-1.0840 intermediate barrier and the monthly peak, around the 1.0885 region. This is followed by the 1.0900 mark, which if cleared will shift the near-term bias in favor of bullish traders.
EUR/USD 1-hour chart
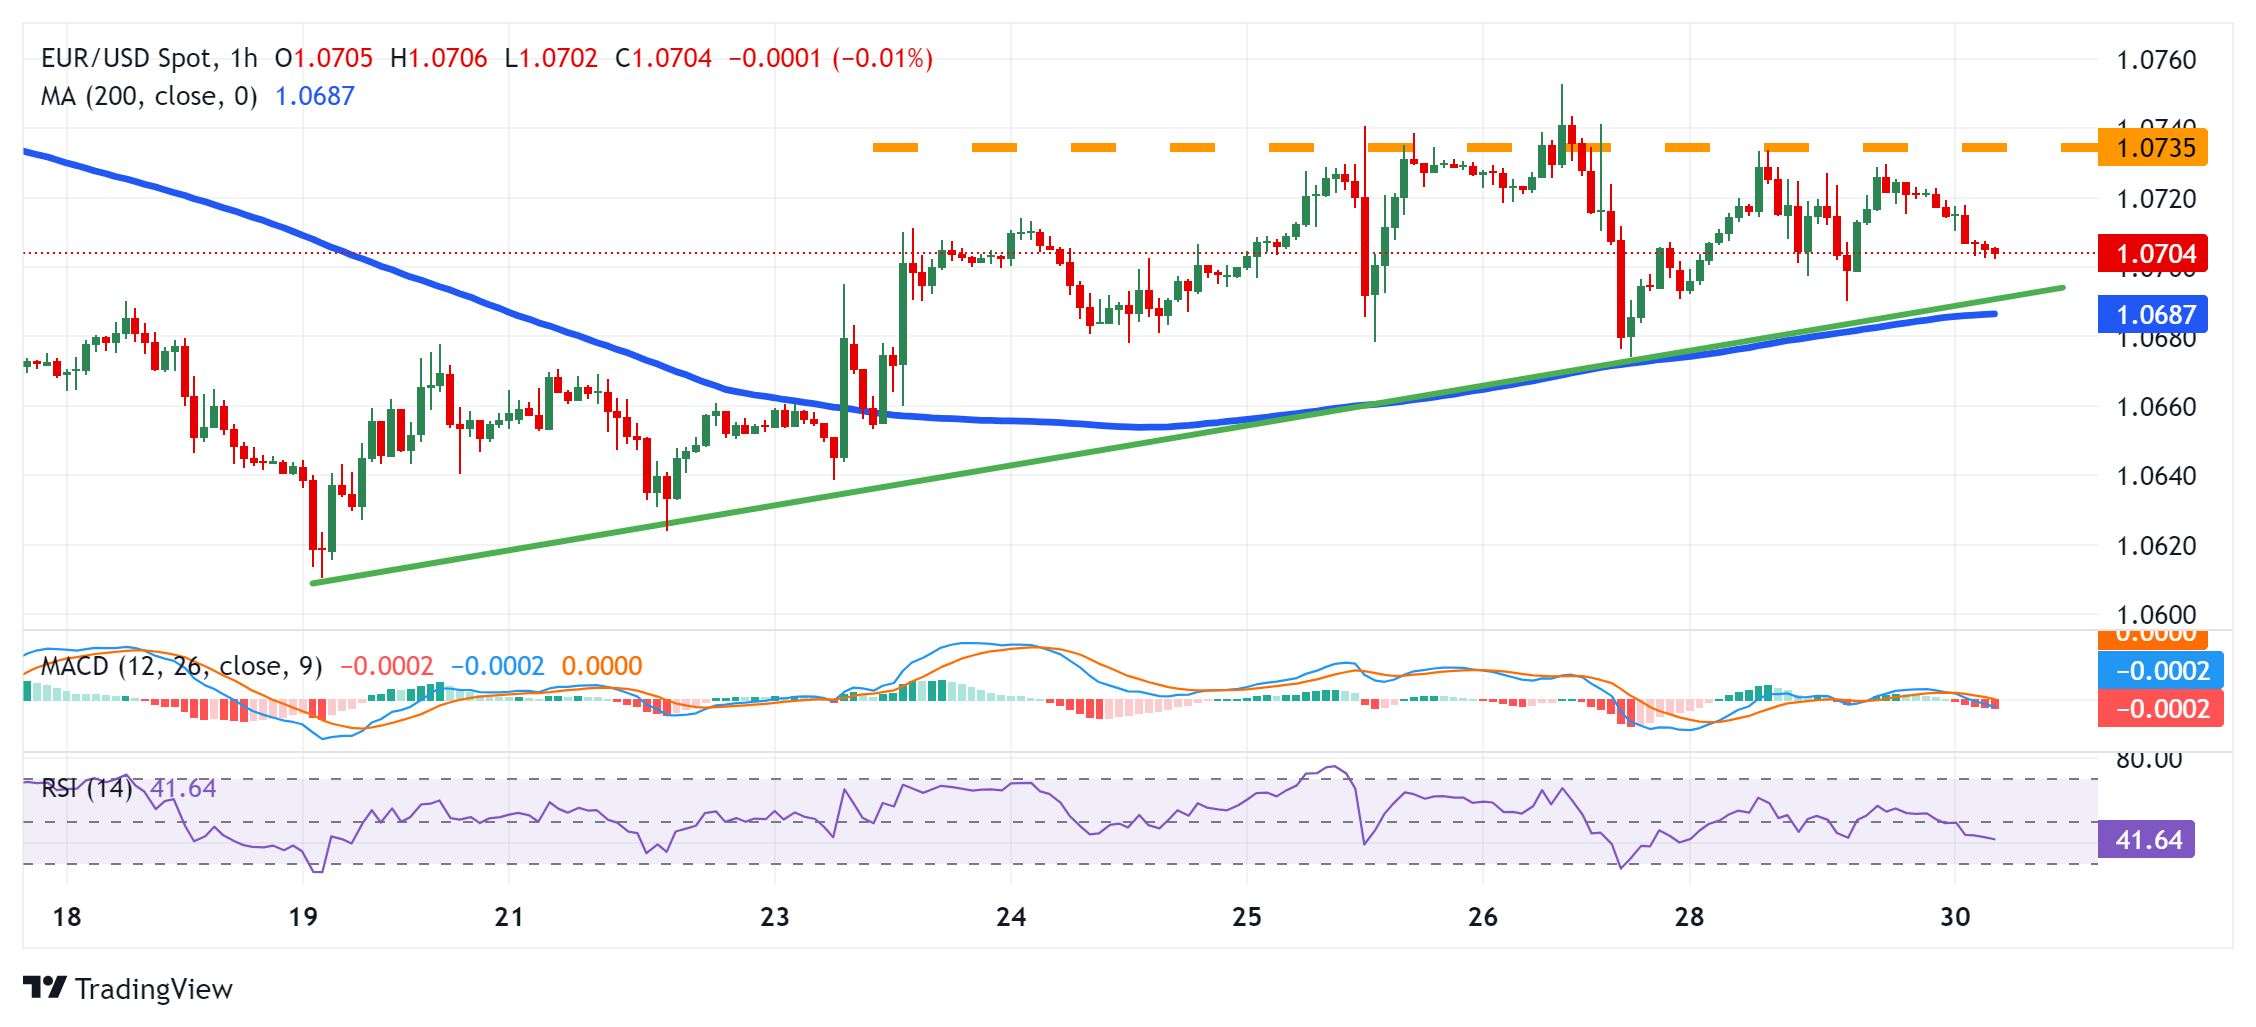
- Gold price remains confined in a narrow range as traders prefer to wait on the sidelines.
- Reduced Fed rate cut bets revive the USD demand and act as a headwind for the metal.
- Investors now await the FOMC decision and US macro data before placing directional bets.
Gold price (XAU/USD) continues with its struggle to gain any meaningful traction and extends its sideways consolidative price move during the Asian session on Tuesday. Growing acceptance that the Federal Reserve (Fed) will keep interest rates higher for longer amid signs of still sticky inflation assists the US Dollar (USD) in attracting some dip-buying. Apart from this, easing tensions in the Middle East acts as a headwind for the safe-haven precious metal. The downside, however, remains cushioned as traders prefer to wait for cues about the Fed's rate-cut path before placing fresh directional bets.
Hence, the focus remains glued to the crucial two-day FOMC monetary policy meeting starting today and the release of the closely-watched US monthly employment details, popularly known as the Nonfarm Payrolls (NFP) report on Friday. This will play a key role in influencing the USD demand in the near term and provide some meaningful impetus to the non-yielding Gold price. Heading into the key central bank/US data risks, Tuesday's US economic docket – featuring the Chicago PMI and the Conference Board's Consumer Confidence Index – might produce short-term trading opportunities.
Daily Digest Market Movers: Gold price is undermined by hawkish Fed expectations and a modest USD strength
- Friday's release of the US Personal Consumption Expenditures (PCE) Price Index pointed to still sticky inflation and reaffirmed bets that the Federal Reserve will begin its rate-cutting cycle only in September.
- Hawkish Fed expectations act as a tailwind for the US Dollar, which, along with a generally positive risk tone, turn out to be key factors that contribute to capping the upside for the non-yielding Gold price.
- The global risk sentiment remains well supported on the back of receding fears about any further escalation of conflict between Iran and Israel and the latest optimism over Israel-Hamas peace talks in Cairo.
- Traders, however, now seem to have moved to the sidelines and refrain from positioning for a firm near-term direction ahead of this week's key central bank event risk and important US economic releases.
- The Fed is scheduled to announce its policy decision at the end of a two-day meeting on Wednesday, which will be followed by the release of the closely watched US jobs data, or the Nonfarm Payrolls report on Friday.
- Investors will look for cues about the Fed's future policy decisions and rate-cut path, which, in turn, should influence the USD price dynamics and help in determining the near-term trajectory for the XAU/USD.
- In the meantime, Tuesday's US economic docket – featuring the Chicago PMI and the Conference Board's Consumer Confidence Index – might provide some impetus later during the North American session.
Technical Analysis: Gold price needs to find acceptance above 200-hour SMA for bulls to seize near-term control
From a technical perspective, the Gold price has been struggling to make it through the 200-hour Simple Moving Average (SMA) barrier over the past two days. The said hurdle, currently pegged near the $2,346 region, now coincides with the 38.2% Fibonacci retracement level of the recent pullback from the all-time peak and should act as a key pivotal point. This is followed by 50% Fibo. level, around the $2,352-2,353 area, which if cleared could lift the Gold price to the next relevant hurdle near the $2,371-2,372 region. The momentum could extend further towards the $2,400 round figure en route to the all-time peak, around the $2,431-2,432 area touched earlier this month.
On the flip side, some follow-through selling and acceptance below the 100-hour SMA could make the Gold price vulnerable to retesting last week's swing low, around the $2,292-2,291 zone, with some intermediate support near the $2,320 region. The subsequent downfall has the potential to drag the XAU/USD further towards the next relevant support near the $2,268-2,265 area.
Gold FAQs
Gold has played a key role in human’s history as it has been widely used as a store of value and medium of exchange. Currently, apart from its shine and usage for jewelry, the precious metal is widely seen as a safe-haven asset, meaning that it is considered a good investment during turbulent times. Gold is also widely seen as a hedge against inflation and against depreciating currencies as it doesn’t rely on any specific issuer or government.
Central banks are the biggest Gold holders. In their aim to support their currencies in turbulent times, central banks tend to diversify their reserves and buy Gold to improve the perceived strength of the economy and the currency. High Gold reserves can be a source of trust for a country’s solvency. Central banks added 1,136 tonnes of Gold worth around $70 billion to their reserves in 2022, according to data from the World Gold Council. This is the highest yearly purchase since records began. Central banks from emerging economies such as China, India and Turkey are quickly increasing their Gold reserves.
Gold has an inverse correlation with the US Dollar and US Treasuries, which are both major reserve and safe-haven assets. When the Dollar depreciates, Gold tends to rise, enabling investors and central banks to diversify their assets in turbulent times. Gold is also inversely correlated with risk assets. A rally in the stock market tends to weaken Gold price, while sell-offs in riskier markets tend to favor the precious metal.
The price can move due to a wide range of factors. Geopolitical instability or fears of a deep recession can quickly make Gold price escalate due to its safe-haven status. As a yield-less asset, Gold tends to rise with lower interest rates, while higher cost of money usually weighs down on the yellow metal. Still, most moves depend on how the US Dollar (USD) behaves as the asset is priced in dollars (XAU/USD). A strong Dollar tends to keep the price of Gold controlled, whereas a weaker Dollar is likely to push Gold prices up.
- The Australian Dollar has weakened following the release of softer Retail Sales data.
- The Australian Dollar could regain ground due to growing expectations of the RBA delaying interest rate cuts.
- The US Dollar has rebounded, possibly from hawkish comments made by Fed officials, signaling no immediate necessity for rate cuts.
The Australian Dollar (AUD) extended its downward correction following Tuesday's release of lower than expected domestic Retail Sales data. Retail Sales are a key leading indicator directly correlated with inflation and growth prospects, potentially influencing the Reserve Bank of Australia's (RBA) hawkish stance on interest rate trajectory.
The Australian Dollar could potentially regain its footing, buoyed by higher-than-expected domestic inflation data released last week, which has raised expectations that the RBA may delay interest rate cuts. Furthermore, Commonwealth Bank, Australia's largest mortgage lender, has revised its forecast for the timing of the first interest rate cut by the RBA, now projecting only one cut in November, as reported by the Financial Review.
The US Dollar Index (DXY), which gauges the performance of the US Dollar (USD) against six major currencies, has rebounded following hawkish remarks from US Federal Reserve (Fed) officials, indicating no immediate need for rate cuts.
Traders are anticipated to await Wednesday's release of the ADP Employment Change and ISM Manufacturing PMI from the United States (US), alongside the Fed Interest Rate Decision. These events are likely to influence market sentiment and USD movement.
Daily Digest Market Movers: Australian Dollar depreciates after lower Retail Sales
- The seasonally adjusted Australian Retail Sales experienced a 0.4% month-on-month decrease in March, falling short of expectations for a 0.2% increase. This decline contrasts with the previous month's growth of 0.3%.
- In April, China's NBS Manufacturing Purchasing Managers Index (PMI) declined to 50.4, down from the previous reading of 50.8. Although it was higher than the expected reading of 50.3. Additionally, the Non-manufacturing PMI decreased to 51.2, in line with expectations, compared to the previous reading of 53.0 in March.
- The International Monetary Fund (IMF) stated in its latest report, released on Tuesday, that China's economic growth is anticipated to decelerate in the coming years. The projected growth rates are 5.2% in 2023, 4.6% in 2024, and 4.1% in 2025. This forecast has implications for the Australian market, as Australia is the largest exporter of commodities and raw materials to China.
- Australian shares kicked off Tuesday with little change, as investors paused ahead of the upcoming US Federal Reserve rates decision on Wednesday. Among the 11 sectors, only materials showed gains, while the rest remained relatively unchanged.
- According to the CME FedWatch Tool, the probability of the Federal Reserve keeping interest rates unchanged in the June meeting has increased to 88.4%, up from 83.5% in the past week. The Fed's narrative of higher rates for a longer period strengthens the US Dollar and presents a challenge for the AUD/USD pair.
- The Economic Times reported on Monday that Fed Chair Jerome Powell mentioned it would likely take "longer than expected" to gain confidence that inflation is progressing towards the central bank's 2% target. Powell added that the central bank can maintain rates at a high level "as long as needed." Fed Governor Michelle Bowman expressed her view of "upside risks" to inflation. Meanwhile, Minneapolis Fed President Neel Kashkari raised the possibility of no rate cuts occurring this year.
Technical Analysis: Australian Dollar moves below 0.6550
The Australian Dollar trades around 0.6530 on Tuesday. The pair remains within the symmetrical triangle, with the 14-day Relative Strength Index (RSI) positioned above the 50-level, affirming a bullish stance.
In terms of potential upward targets, the AUD/USD pair may test the triangle’s upper boundary around the level of 0.6585, followed by the psychological barrier at 0.6600 and subsequently aim for March’s high of 0.6667.
On the downside, the AUD/USD pair could test the lower boundary of the symmetrical triangle, aligned with the major support of 0.6500. A break below the major support of 0.6480 could lead the pair to reach April’s low of 0.6362.
AUD/USD: Daily Chart
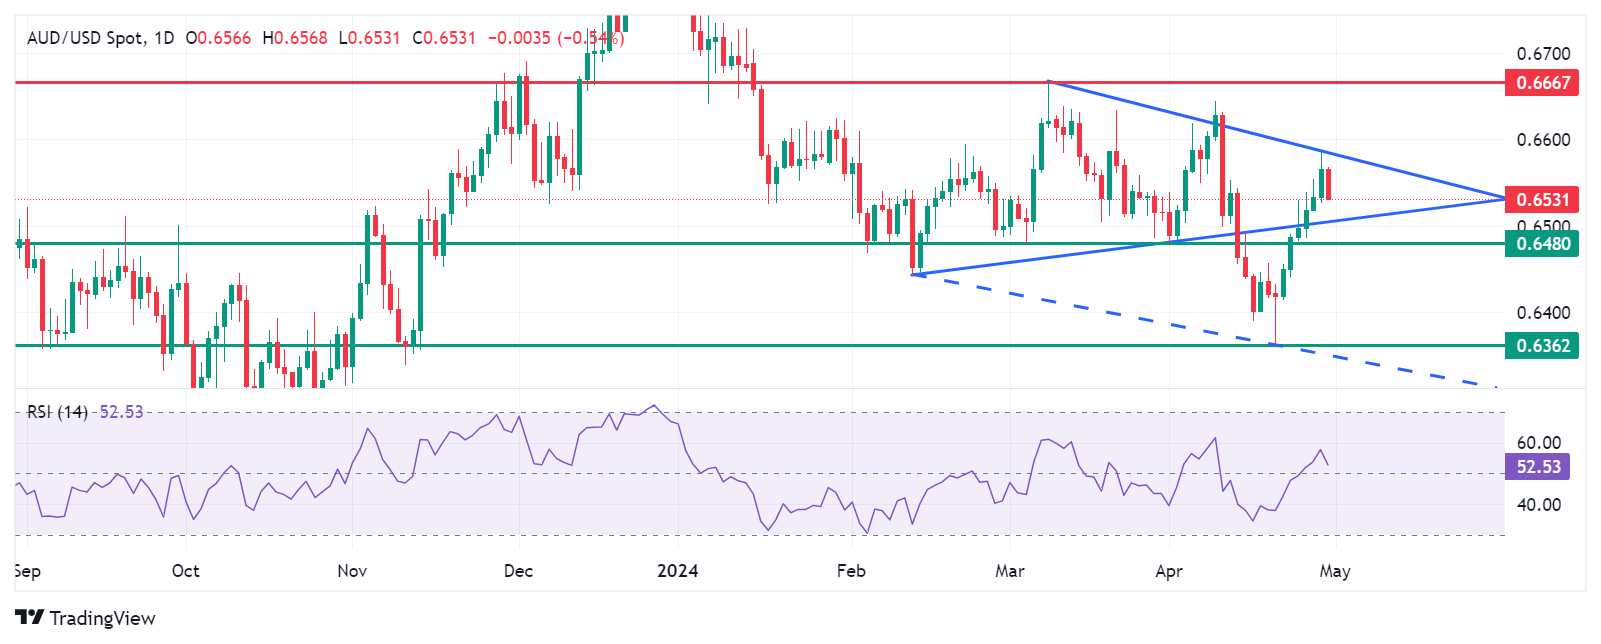
Australian Dollar price in the last 7 days
The table below shows the percentage change of the Australian Dollar (AUD) against listed major currencies in the last 7 days. The Australian Dollar was the strongest against the Japanese Yen.
| USD | EUR | GBP | CAD | AUD | JPY | NZD | CHF | |
| USD | -0.48% | -1.58% | -0.15% | -1.32% | 1.24% | -0.51% | -0.02% | |
| EUR | 0.48% | -1.11% | 0.33% | -0.82% | 1.66% | -0.02% | 0.45% | |
| GBP | 1.56% | 1.09% | 1.42% | 0.27% | 2.79% | 1.07% | 1.55% | |
| CAD | 0.15% | -0.33% | -1.42% | -1.15% | 1.39% | -0.35% | 0.13% | |
| AUD | 1.29% | 0.81% | -0.29% | 1.13% | 2.52% | 0.79% | 1.27% | |
| JPY | -1.25% | -1.74% | -2.87% | -1.42% | -2.59% | -1.77% | -1.28% | |
| NZD | 0.51% | 0.01% | -1.07% | 0.35% | -0.80% | 1.75% | 0.47% | |
| CHF | 0.04% | -0.45% | -1.57% | -0.13% | -1.27% | 1.26% | -0.46% |
The heat map shows percentage changes of major currencies against each other. The base currency is picked from the left column, while the quote currency is picked from the top row. For example, if you pick the Euro from the left column and move along the horizontal line to the Japanese Yen, the percentage change displayed in the box will represent EUR (base)/JPY (quote).
Australian Dollar FAQs
One of the most significant factors for the Australian Dollar (AUD) is the level of interest rates set by the Reserve Bank of Australia (RBA). Because Australia is a resource-rich country another key driver is the price of its biggest export, Iron Ore. The health of the Chinese economy, its largest trading partner, is a factor, as well as inflation in Australia, its growth rate and Trade Balance. Market sentiment – whether investors are taking on more risky assets (risk-on) or seeking safe-havens (risk-off) – is also a factor, with risk-on positive for AUD.
The Reserve Bank of Australia (RBA) influences the Australian Dollar (AUD) by setting the level of interest rates that Australian banks can lend to each other. This influences the level of interest rates in the economy as a whole. The main goal of the RBA is to maintain a stable inflation rate of 2-3% by adjusting interest rates up or down. Relatively high interest rates compared to other major central banks support the AUD, and the opposite for relatively low. The RBA can also use quantitative easing and tightening to influence credit conditions, with the former AUD-negative and the latter AUD-positive.
China is Australia’s largest trading partner so the health of the Chinese economy is a major influence on the value of the Australian Dollar (AUD). When the Chinese economy is doing well it purchases more raw materials, goods and services from Australia, lifting demand for the AUD, and pushing up its value. The opposite is the case when the Chinese economy is not growing as fast as expected. Positive or negative surprises in Chinese growth data, therefore, often have a direct impact on the Australian Dollar and its pairs.
Iron Ore is Australia’s largest export, accounting for $118 billion a year according to data from 2021, with China as its primary destination. The price of Iron Ore, therefore, can be a driver of the Australian Dollar. Generally, if the price of Iron Ore rises, AUD also goes up, as aggregate demand for the currency increases. The opposite is the case if the price of Iron Ore falls. Higher Iron Ore prices also tend to result in a greater likelihood of a positive Trade Balance for Australia, which is also positive of the AUD.
The Trade Balance, which is the difference between what a country earns from its exports versus what it pays for its imports, is another factor that can influence the value of the Australian Dollar. If Australia produces highly sought after exports, then its currency will gain in value purely from the surplus demand created from foreign buyers seeking to purchase its exports versus what it spends to purchase imports. Therefore, a positive net Trade Balance strengthens the AUD, with the opposite effect if the Trade Balance is negative.
- Indian Rupee loses momentum on the month-end US dollar (USD) demand on Tuesday.
- The positive outlook in the Indian economy continues to boost Indian equities and might strengthen the INR in the near term.
- The Federal Reserve's (Fed) interest rate decision and press conference on Wednesday will be closely watched.
Indian Rupee (INR) extends its downside on Tuesday amid month-end US dollar (USD) demand from importers. On Monday, the Indian Rupee edged lower to its worst intraday fall in more than two weeks as weakness in major Asian currencies exerts some selling pressure on the local currencies. However, the continuous confidence and optimism in India's economic stability continue to support Indian equities, and this might lift the INR in the near term.
Market players will monitor the Federal Reserve's (Fed) interest rate decision and the press conference on Wednesday. A cautious tone from Fed Chair Jerome Powell could boost the Greenback further and create a tailwind for the pair. Also, the ISM Manufacturing PMI data and the US employment report this week might offer some insights about the interest rate outlook. On the Indian docket, India’s HSBC Manufacturing PMI for April will be released on Thursday.
Daily Digest Market Movers: Indian Rupee remains vulnerable despite the positive economic outlook
- The Indian economy is estimated to grow faster than 7% in this financial year, according to the National Council of Applied Economic Research (NCAER) on Monday.
- Nifty had slipped 2.5% in January 2023 amid the Foreign Institutional Investors (FIIs) sell-off. However, so far this April, the Nifty holds a monthly gain of 0.4%.
- India’s foreign exchange reserves contracted by $2.83 billion to $640.33 billion as of April 19, according to the Reserve Bank of India (RBI).
- India’s HSBC Manufacturing PMI is expected to remain unchanged at 59.1 in April.
- The US Federal Reserve (Fed) is widely anticipated to hold rates steady at a more than two-decade high after their meeting on Wednesday.
- Financial markets expect only one Fed rate cut in 2024, below the roughly six quarter-point cuts they expected at the beginning of the year.
Technical analysis: USD/INR keeps the bullish vibe in the longer term
The Indian Rupee trades weaker on the day. USD/INR maintains the bullish outlook unchanged as the pair is above the key 100-day Exponential Moving Average (EMA) on the daily timeframe. The upward momentum is backed by the 14-day Relative Strength Index (RSI), which holds in bullish territory around 55, suggesting the support zone is likely to hold rather than break.
The immediate resistance level for the pair will emerge near a high of April 15 at 83.50. A sustained bullish move will pave the way to the next upside target near an all-time high of 83.72, en route to the 84.00 psychological round mark. On the downside, a decisive break below a low of April 26 at 83.23 could drag USD/INR back to 83.15, portraying the confluence of the 100-day EMA and a low of April 10. Further south, the next contention level is seen near a low of January 15 at 82.78.
US Dollar price today
The table below shows the percentage change of US Dollar (USD) against listed major currencies today. US Dollar was the strongest against the Australian Dollar.
| USD | EUR | GBP | CAD | AUD | JPY | NZD | CHF | |
| USD | 0.10% | 0.10% | 0.09% | 0.39% | 0.34% | 0.29% | 0.10% | |
| EUR | -0.11% | -0.01% | -0.03% | 0.28% | 0.24% | 0.18% | -0.01% | |
| GBP | -0.11% | -0.01% | -0.03% | 0.27% | 0.21% | 0.18% | -0.01% | |
| CAD | -0.08% | 0.02% | 0.04% | 0.31% | 0.23% | 0.22% | 0.02% | |
| AUD | -0.41% | -0.30% | -0.30% | -0.31% | -0.07% | -0.12% | -0.30% | |
| JPY | -0.34% | -0.22% | -0.20% | -0.26% | 0.08% | 0.00% | -0.21% | |
| NZD | -0.28% | -0.20% | -0.19% | -0.22% | 0.10% | 0.02% | -0.20% | |
| CHF | -0.07% | -0.01% | 0.01% | -0.03% | 0.29% | 0.19% | 0.20% |
The heat map shows percentage changes of major currencies against each other. The base currency is picked from the left column, while the quote currency is picked from the top row. For example, if you pick the Euro from the left column and move along the horizontal line to the Japanese Yen, the percentage change displayed in the box will represent EUR (base)/JPY (quote).
Indian Rupee FAQs
The Indian Rupee (INR) is one of the most sensitive currencies to external factors. The price of Crude Oil (the country is highly dependent on imported Oil), the value of the US Dollar – most trade is conducted in USD – and the level of foreign investment, are all influential. Direct intervention by the Reserve Bank of India (RBI) in FX markets to keep the exchange rate stable, as well as the level of interest rates set by the RBI, are further major influencing factors on the Rupee.
The Reserve Bank of India (RBI) actively intervenes in forex markets to maintain a stable exchange rate, to help facilitate trade. In addition, the RBI tries to maintain the inflation rate at its 4% target by adjusting interest rates. Higher interest rates usually strengthen the Rupee. This is due to the role of the ‘carry trade’ in which investors borrow in countries with lower interest rates so as to place their money in countries’ offering relatively higher interest rates and profit from the difference.
Macroeconomic factors that influence the value of the Rupee include inflation, interest rates, the economic growth rate (GDP), the balance of trade, and inflows from foreign investment. A higher growth rate can lead to more overseas investment, pushing up demand for the Rupee. A less negative balance of trade will eventually lead to a stronger Rupee. Higher interest rates, especially real rates (interest rates less inflation) are also positive for the Rupee. A risk-on environment can lead to greater inflows of Foreign Direct and Indirect Investment (FDI and FII), which also benefit the Rupee.
Higher inflation, particularly, if it is comparatively higher than India’s peers, is generally negative for the currency as it reflects devaluation through oversupply. Inflation also increases the cost of exports, leading to more Rupees being sold to purchase foreign imports, which is Rupee-negative. At the same time, higher inflation usually leads to the Reserve Bank of India (RBI) raising interest rates and this can be positive for the Rupee, due to increased demand from international investors. The opposite effect is true of lower inflation.
| Raw materials | Closed | Change, % |
|---|---|---|
| Silver | 27.133 | -0.01 |
| Gold | 2336.47 | 0.11 |
| Palladium | 974.39 | 1.86 |
- The Australian Dollar loses ground after the release of lower-than-expected Retail Sales.
- The Australian Retail Sales for March took an unexpected downturn, contrasting with the anticipated rise.
- Market participants will closely monitor for any potential Japanese intervention on Tuesday.
AUD/JPY edges lower on Monday after the release of the lower-than-expected Aussie Retail Sales, a leading indicator that has a direct correlation with inflation and growth prospects, could impact the RBA’s hawkish stance on interest rate trajectory. However, the Australian Dollar (AUD) strengthened as higher-than-expected domestic inflation data raised expectations that the Reserve Bank of Australia (RBA) may not cut interest rates soon.
Australia's largest mortgage lender, Commonwealth Bank has adjusted its forecast for the timing of the first interest rate cut by the RBA. They are now projecting only one cut in November, as reported by the Financial Review. CBA anticipates that the Reserve Bank of Australia' could decrease the cash rate to 4.1% from 4.35% this year, with a more substantial drop to 3.1% by 2025. Gareth Aird, CBA's head of Australian economics, stated, "We have penciled in one 25 basis point rate cut in each quarter over 2025."
On the Japanese side, market participants will remain vigilant for potential Japanese intervention on Tuesday, following reports of Tokyo's involvement in the currency market on Monday, which propelled the Japanese Yen (JPY), according to Reuters. Lower-than-expected domestic Retail Trade data released on Tuesday support the dovish stance of the Bank of Japan (BOJ). Additionally, expectations for a sustained significant interest rate differential between Japan and other nations suggest that the trajectory of the JPY is biased toward further depreciation.
Daily Digest Market Movers: AUD/JPY edges lower after softer Retail Sales
- The seasonally adjusted Australian Retail Sales dropped 0.4% MoM in March, compared to the expected increase of 0.2% and the previous growth of 0.3%.
- China’s NBS Manufacturing Purchasing Managers Index (PMI) fell to 50.4 in April, against the 50.8 prior. The reading was better than the expected reading of 50.3. Non-manufacturing PMI declined to 51.2, as expected. The previous reading was 53.0 in March.
- Japan’s Retail Trade increased by 1.2% year-over-year in March, which was lower than the expected increase of 2.5% and the previous increase of 4.7%. The seasonally adjusted Retail Trade (MoM) decreased by 1.2%, against the expected rise of 0.6%.
- Australian shares kicked off Tuesday with little change, as investors paused ahead of the upcoming US Federal Reserve rates decision on Wednesday. Among the 11 sectors, only materials showed gains, while the rest remained relatively unchanged.
- Masato Kanda, Japan's senior currency diplomat, made pointed comments regarding the currency's impact on import prices, emphasizing its significant influence. He highlighted the readiness of authorities to take action around the clock to address currency-related matters, as per a Reuters report.
- BoJ Governor Kazuo Ueda provided insights into the central bank's decision to maintain the status quo during the post-policy meeting press conference on Friday. Ueda outlined that the BoJ will adjust the degree of monetary easing if the underlying inflation rate rises. Additionally, He emphasized that easy financial conditions will be maintained for the time being, indicating the BoJ's commitment to supporting economic recovery and stability through accommodative monetary measures.
Technical Analysis: AUD/JPY maintains position above 102.00
The AUD/JPY traded around 102.70 on Tuesday, hovering above the lower boundary of the ascending triangle on a daily chart. Additionally, the 14-day Relative Strength Index (RSI) is above the 50-level, reinforcing the bullish sentiment.
The immediate resistance is observed at the psychological level of 105.00, coinciding with the upper boundary of the triangle. A breakthrough above this area could propel the AUD/JPY cross to test the highest level of 105.43 recorded in April 2013.
On the downside, immediate support for the AUD/JPY pair might be encountered at the psychological level of 102.00, aligning with the lower boundary of the triangle. If the pair breaches below this level, it could lead to a further decline toward the nine-day Exponential Moving Average (EMA) at 101.51.
AUD/JPY: Daily Chart
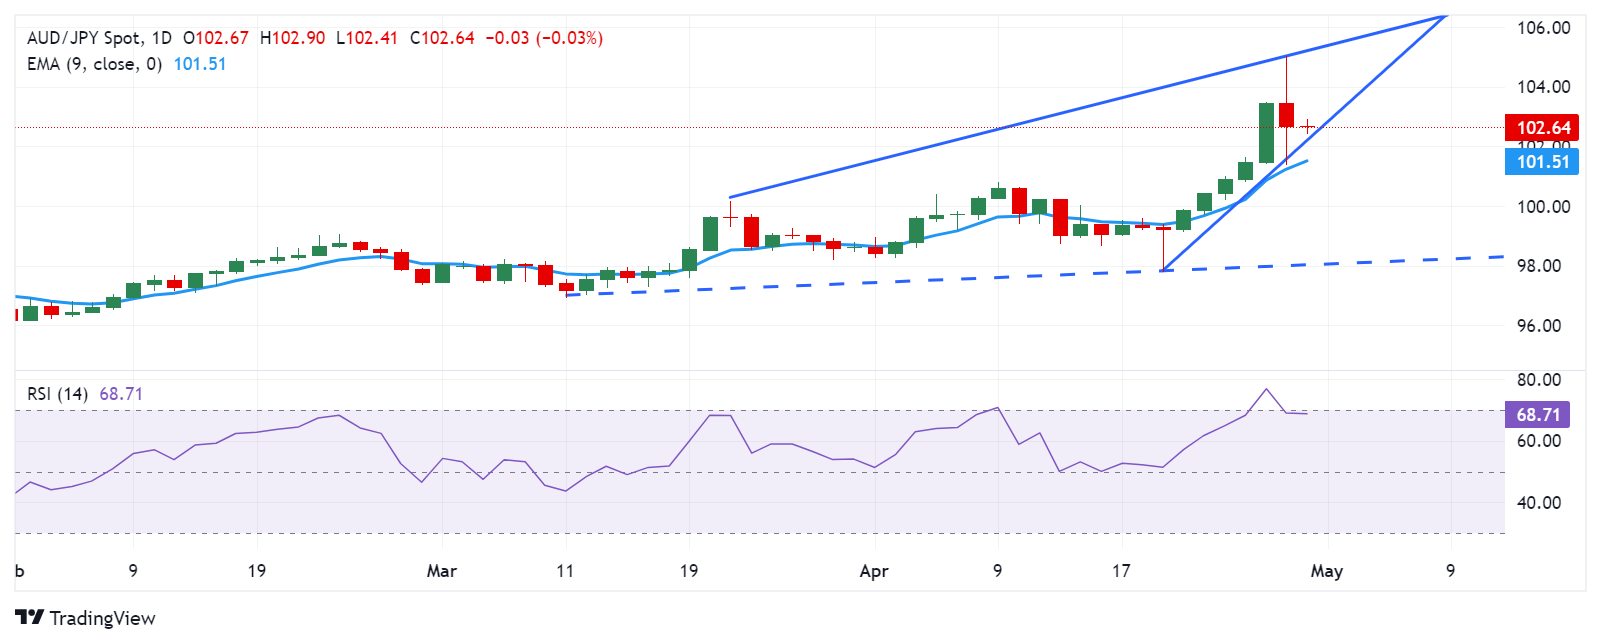
Japanese Yen price today
The table below shows the percentage change of the Japanese Yen (JPY) against listed major currencies today. Japanese Yen was the strongest against the Australian Dollar.
| USD | EUR | GBP | CAD | AUD | JPY | NZD | CHF | |
| USD | 0.10% | 0.10% | 0.06% | 0.29% | 0.36% | 0.22% | 0.09% | |
| EUR | -0.08% | -0.01% | -0.03% | 0.19% | 0.34% | 0.12% | -0.01% | |
| GBP | -0.10% | 0.01% | -0.04% | 0.20% | 0.26% | 0.13% | 0.00% | |
| CAD | -0.05% | 0.05% | 0.04% | 0.23% | 0.29% | 0.17% | 0.04% | |
| AUD | -0.30% | -0.18% | -0.18% | -0.23% | 0.07% | -0.08% | -0.19% | |
| JPY | -0.36% | -0.25% | -0.28% | -0.29% | -0.04% | -0.16% | -0.26% | |
| NZD | -0.21% | -0.12% | -0.13% | -0.17% | 0.07% | 0.14% | -0.13% | |
| CHF | -0.05% | 0.01% | 0.00% | -0.04% | 0.20% | 0.24% | 0.13% |
The heat map shows percentage changes of major currencies against each other. The base currency is picked from the left column, while the quote currency is picked from the top row. For example, if you pick the Euro from the left column and move along the horizontal line to the Japanese Yen, the percentage change displayed in the box will represent EUR (base)/JPY (quote).
Japanese Yen FAQs
The Japanese Yen (JPY) is one of the world’s most traded currencies. Its value is broadly determined by the performance of the Japanese economy, but more specifically by the Bank of Japan’s policy, the differential between Japanese and US bond yields, or risk sentiment among traders, among other factors.
One of the Bank of Japan’s mandates is currency control, so its moves are key for the Yen. The BoJ has directly intervened in currency markets sometimes, generally to lower the value of the Yen, although it refrains from doing it often due to political concerns of its main trading partners. The current BoJ ultra-loose monetary policy, based on massive stimulus to the economy, has caused the Yen to depreciate against its main currency peers. This process has exacerbated more recently due to an increasing policy divergence between the Bank of Japan and other main central banks, which have opted to increase interest rates sharply to fight decades-high levels of inflation.
The BoJ’s stance of sticking to ultra-loose monetary policy has led to a widening policy divergence with other central banks, particularly with the US Federal Reserve. This supports a widening of the differential between the 10-year US and Japanese bonds, which favors the US Dollar against the Japanese Yen.
The Japanese Yen is often seen as a safe-haven investment. This means that in times of market stress, investors are more likely to put their money in the Japanese currency due to its supposed reliability and stability. Turbulent times are likely to strengthen the Yen’s value against other currencies seen as more risky to invest in.
- The Japanese Yen struggles to build on the previous day’s solid recovery from a multi-decade low.
- The divergent BoJ-Fed policy expectations and a positive risk tone undermine the safe-haven JPY.
- The emergence of some USD buying provides an additional boost to the USD/JPY pair on Tuesday.
The Japanese Yen (JPY) staged a strong intraday recovery on Monday and rallied over 550 pips against its American counterpart, following an initial slump below the 160.00 psychological mark for the first time since April 1990. Traders cited intervention by Japanese authorities for the first time in 18 months as a trigger for the solid rebound in the JPY amid relatively thin liquidity due to a local public holiday. This, along with the emergence of fresh US Dollar (USD) selling, dragged the USD/JPY pair to a one-week low.
The JPY, however, started losing traction in the wake of expectations that interest rates in Japan would remain low for some time in contrast to relatively high-interest rates in the United States (US). This, along with a generally positive risk tone, which tends to undermine the safe-haven JPY, assisted the USD/JPY pair in attracting fresh buyers in the vicinity of mid-154.00s and trimming a part of its heavy intraday losses. The momentum extends through the Asian session on Tuesday and is further fueled by rather unimpressive Japanese macro data.
The focus, meanwhile, remains on the outcome of the crucial two-day FOMC policy meeting, scheduled to be announced on Wednesday. Furthermore, this week's important US macro releases, including the closely watched Nonfarm Payrolls (NFP) on Friday, will influence the USD and provide some meaningful impetus to the USD/JPY pair. In the meantime, Tuesday's US economic docket – featuring the Chicago PMI and the Conference Board's Consumer Confidence Index — will be looked upon to grab short-term trading opportunities.
Daily Digest Market Movers: Japanese Yen meets with a fresh supply amid the BoJ’s uncertain rate outlook
- The Japanese Yen witnessed a dramatic intraday turnaround after touching a fresh 34-year low on Monday amid reports that Japanese authorities intervened in the market to support the domestic currency.
- Japan's top currency diplomat Masato Kanda refrained from confirming if there was an intervention but said that the current developments in the currency market were “speculative, rapid and abnormal”.
- The strong JPY recovery, however, lost traction in the wake of firming expectations that a significant interest-rate differential between Japan and the United States is likely to remain in place for some time.
- The Bank of Japan decided to keep its key interest rate unchanged at the end of April policy meeting last Friday and said that it will continue buying government bonds in line with the guidance made in March.
- The BoJ lowered its economic growth forecast for the current fiscal year 2024, while data on Monday showed that inflation in Tokyo slowed for the second month in April, raising doubts about further policy tightening.
- The Federal Reserve is expected to keep rates higher for longer, and the bets were reaffirmed by Friday's release of the Personal Consumption Expenditures (PCE) Price Index, which pointed to sticky inflation.
- Data released from Japan this Tuesday showed that the unemployment rate held steady at 2.6% in March as compared to the 2.5% anticipated, while Industrial Production grew by 3.8% during the reported month.
- Meanwhile, Japan's Retail Sales declined by 1.2% in March and the yearly rate, though recorded a slower-than-expected rise, pointed to expansion for the 25th consecutive month, doing little to influence the JPY.
- Traders now look to the US economic docket – featuring the Chicago PMI and the Conference Board's Consumer Confidence Index — for short-term opportunities ahead of the FOMC policy decision on Wednesday.
- Apart from this, important US macro data scheduled at the beginning of a new month, influencing the monthly jobs data, should influence the USD price dynamics and provide a fresh impetus to the USD/JPY pair.
Technical Analysis: USD/JPY could climb further towards testing the 50% Fibo. hurdle near the 157.40 region
From a technical perspective, spot prices showed resilience below the 200-hour Simple Moving Average (SMA) on Monday. The subsequent move beyond the 38.2% Fibonacci retracement level of the overnight sharp pullback from a multi-decade top favored bullish traders. Moreover, oscillators on hourly charts have again started gaining positive traction and validate the constructive outlook for the USD/JPY pair. Hence, some follow-through strength beyond the 157.00 mark towards the 50% Fibo. level near the 157.40 region looks like a distinct possibility. The momentum could extend further towards the 158.00 round figure or the 61.8% Fibo. level, which should now act as a key pivotal point.
On the flip side, weakness back below the 156.75-156.70 area now seems to find some support near the 156.35 region ahead of the 156.00 mark. A convincing breakthrough the latter might expose the 200-hour SMA support, currently pegged near the 155.35 zone, before the USD/JPY pair weakens further below the 155.00 psychological mark and challenges the overnight swing low, around mid-154.00s.
Japanese Yen FAQs
The Japanese Yen (JPY) is one of the world’s most traded currencies. Its value is broadly determined by the performance of the Japanese economy, but more specifically by the Bank of Japan’s policy, the differential between Japanese and US bond yields, or risk sentiment among traders, among other factors.
One of the Bank of Japan’s mandates is currency control, so its moves are key for the Yen. The BoJ has directly intervened in currency markets sometimes, generally to lower the value of the Yen, although it refrains from doing it often due to political concerns of its main trading partners. The current BoJ ultra-loose monetary policy, based on massive stimulus to the economy, has caused the Yen to depreciate against its main currency peers. This process has exacerbated more recently due to an increasing policy divergence between the Bank of Japan and other main central banks, which have opted to increase interest rates sharply to fight decades-high levels of inflation.
The BoJ’s stance of sticking to ultra-loose monetary policy has led to a widening policy divergence with other central banks, particularly with the US Federal Reserve. This supports a widening of the differential between the 10-year US and Japanese bonds, which favors the US Dollar against the Japanese Yen.
The Japanese Yen is often seen as a safe-haven investment. This means that in times of market stress, investors are more likely to put their money in the Japanese currency due to its supposed reliability and stability. Turbulent times are likely to strengthen the Yen’s value against other currencies seen as more risky to invest in.
The International Monetary Fund (IMF) said in its latest report published on Tuesday that China’s economic growth is expected to slow in 2023 and the next two years.
Key quotes
Asia Pacific heading for 'soft landing' with rapid disinflation, resilient growth.
Asia Pacific 2024 growth seen slowing to 4.5%, higher than prev forecast.
Asia Pacific 2023 growth at 5%, stronger than previous forecast.
Near-term risks broadly balanced, growth expected to slow in medium term.
Asia Pacific 2025 growth seen slowing further to 4.3%.
China growth expected to slow; at 5.2% in 2023, 4.6% in 2024, 4.1% in 2025.
Risks to region include China property sector correction, commodity price shocks, trade disruptions due to conflict.
Related read
China's Caixin Manufacturing Purchasing Managers' Index (PMI) rose to 51.4 in April, compared to the expansion of 51.1 seen in March, according to the latest data released on Tuesday.
The reading beat the market forecast of 51.0 in the reported month.
Key highlights (via Caixin)
Production expands at most pronounced pace since May 2023.
New export orders rise at the quickest pace in nearly three-and-ahalf years.
Selling prices fell again despite highest cost inflation in six months.
"Both supply and demand expanded at a faster pace amid the market upturn. In April, manufacturers’ output and total new orders continued to grow, with the corresponding subindexes reaching new highs since May 2023 and February 2023, respectively,” said Wang Zhe, an economist at Caixin Insight Group.
Wang added, “The increase in external demand was even more notable, with the gauge for new export orders hitting a high not seen since November 2020. Investment goods outperformed both consumer and intermediate goods in terms of supply as well as demand at home and abroad.”
In the last hour, China’s National Bureau of Statistics (NBS) released the country’s official Manufacturing Purchasing Managers' Index (PMI), which fell to 50.4 in April, compared with the 50.8 growth reported in March while beating the estimates of a 50.3 figure. The Non-Manufacturing PMI dipped to 51.2 in the same period vs. March’s 53.0.
AUD/USD reaction to China’s PMI data
The encouraging Chinese Manufacturing PMI fails to inspire the Aussie Dollar, as AUD/USD flirts with intraday lows near 0.6550, at the time of writing, down 0.20% on the day.
Australian Dollar price today
The table below shows the percentage change of Australian Dollar (AUD) against listed major currencies today. Australian Dollar was the weakest against the US Dollar.
| USD | EUR | GBP | CAD | AUD | JPY | NZD | CHF | |
| USD | 0.04% | 0.05% | 0.00% | 0.15% | 0.36% | 0.07% | 0.05% | |
| EUR | -0.04% | 0.00% | -0.05% | 0.11% | 0.32% | 0.03% | 0.00% | |
| GBP | -0.05% | -0.01% | -0.05% | 0.10% | 0.32% | 0.02% | 0.00% | |
| CAD | 0.00% | 0.05% | 0.05% | 0.14% | 0.35% | 0.08% | 0.05% | |
| AUD | -0.15% | -0.10% | -0.09% | -0.14% | 0.22% | -0.08% | -0.09% | |
| JPY | -0.44% | -0.39% | -0.40% | -0.44% | -0.34% | -0.37% | -0.42% | |
| NZD | -0.06% | -0.03% | -0.02% | -0.08% | 0.08% | 0.29% | -0.03% | |
| CHF | -0.02% | 0.00% | 0.00% | -0.05% | 0.10% | 0.35% | 0.03% |
The heat map shows percentage changes of major currencies against each other. The base currency is picked from the left column, while the quote currency is picked from the top row. For example, if you pick the Euro from the left column and move along the horizontal line to the Japanese Yen, the percentage change displayed in the box will represent EUR (base)/JPY (quote).
Australia’s Retail Sales, a measure of the country’s consumer spending, dropped 0.4% MoM in March from the previous reading of a 0.3% rise, according to the official data published by the Australian Bureau of Statistics (ABS) on Tuesday. The figure came in weaker than market expectations with an increase of 0.2%.
Market reaction
The Australian Dollar (AUD) attracts some sellers following the downbeat Retail Sales data. The AUD/USD pair is down 0.17% on the day at 0.6554.
Australian Dollar FAQs
One of the most significant factors for the Australian Dollar (AUD) is the level of interest rates set by the Reserve Bank of Australia (RBA). Because Australia is a resource-rich country another key driver is the price of its biggest export, Iron Ore. The health of the Chinese economy, its largest trading partner, is a factor, as well as inflation in Australia, its growth rate and Trade Balance. Market sentiment – whether investors are taking on more risky assets (risk-on) or seeking safe-havens (risk-off) – is also a factor, with risk-on positive for AUD.
The Reserve Bank of Australia (RBA) influences the Australian Dollar (AUD) by setting the level of interest rates that Australian banks can lend to each other. This influences the level of interest rates in the economy as a whole. The main goal of the RBA is to maintain a stable inflation rate of 2-3% by adjusting interest rates up or down. Relatively high interest rates compared to other major central banks support the AUD, and the opposite for relatively low. The RBA can also use quantitative easing and tightening to influence credit conditions, with the former AUD-negative and the latter AUD-positive.
China is Australia’s largest trading partner so the health of the Chinese economy is a major influence on the value of the Australian Dollar (AUD). When the Chinese economy is doing well it purchases more raw materials, goods and services from Australia, lifting demand for the AUD, and pushing up its value. The opposite is the case when the Chinese economy is not growing as fast as expected. Positive or negative surprises in Chinese growth data, therefore, often have a direct impact on the Australian Dollar and its pairs.
Iron Ore is Australia’s largest export, accounting for $118 billion a year according to data from 2021, with China as its primary destination. The price of Iron Ore, therefore, can be a driver of the Australian Dollar. Generally, if the price of Iron Ore rises, AUD also goes up, as aggregate demand for the currency increases. The opposite is the case if the price of Iron Ore falls. Higher Iron Ore prices also tend to result in a greater likelihood of a positive Trade Balance for Australia, which is also positive of the AUD.
The Trade Balance, which is the difference between what a country earns from its exports versus what it pays for its imports, is another factor that can influence the value of the Australian Dollar. If Australia produces highly sought after exports, then its currency will gain in value purely from the surplus demand created from foreign buyers seeking to purchase its exports versus what it spends to purchase imports. Therefore, a positive net Trade Balance strengthens the AUD, with the opposite effect if the Trade Balance is negative.
China’s official Manufacturing Purchasing Managers' Index (PMI) fell in April, coming in at 50.4, as against the 50.8 expansion in March, according to the latest data released by the National Bureau of Statistics (NBS) on Tuesday.
The market forecast was for a 50.3 reading in the reported month.
The index continued to hold above the 50 mark, which separates expansion from contraction.
The NBS Non-Manufacturing PMI declined to 51.2 in April versus the expected 52.2 figure and March’s 53.0 print.
AUD/USD reaction to China's PMI data
The mixed Chinese PMIs are weighing on the Australian Dollar, with AUD/USD losing 0.20% on the day to test session lows near 0.6550.
Australian Dollar FAQs
One of the most significant factors for the Australian Dollar (AUD) is the level of interest rates set by the Reserve Bank of Australia (RBA). Because Australia is a resource-rich country another key driver is the price of its biggest export, Iron Ore. The health of the Chinese economy, its largest trading partner, is a factor, as well as inflation in Australia, its growth rate and Trade Balance. Market sentiment – whether investors are taking on more risky assets (risk-on) or seeking safe-havens (risk-off) – is also a factor, with risk-on positive for AUD.
The Reserve Bank of Australia (RBA) influences the Australian Dollar (AUD) by setting the level of interest rates that Australian banks can lend to each other. This influences the level of interest rates in the economy as a whole. The main goal of the RBA is to maintain a stable inflation rate of 2-3% by adjusting interest rates up or down. Relatively high interest rates compared to other major central banks support the AUD, and the opposite for relatively low. The RBA can also use quantitative easing and tightening to influence credit conditions, with the former AUD-negative and the latter AUD-positive.
China is Australia’s largest trading partner so the health of the Chinese economy is a major influence on the value of the Australian Dollar (AUD). When the Chinese economy is doing well it purchases more raw materials, goods and services from Australia, lifting demand for the AUD, and pushing up its value. The opposite is the case when the Chinese economy is not growing as fast as expected. Positive or negative surprises in Chinese growth data, therefore, often have a direct impact on the Australian Dollar and its pairs.
Iron Ore is Australia’s largest export, accounting for $118 billion a year according to data from 2021, with China as its primary destination. The price of Iron Ore, therefore, can be a driver of the Australian Dollar. Generally, if the price of Iron Ore rises, AUD also goes up, as aggregate demand for the currency increases. The opposite is the case if the price of Iron Ore falls. Higher Iron Ore prices also tend to result in a greater likelihood of a positive Trade Balance for Australia, which is also positive of the AUD.
The Trade Balance, which is the difference between what a country earns from its exports versus what it pays for its imports, is another factor that can influence the value of the Australian Dollar. If Australia produces highly sought after exports, then its currency will gain in value purely from the surplus demand created from foreign buyers seeking to purchase its exports versus what it spends to purchase imports. Therefore, a positive net Trade Balance strengthens the AUD, with the opposite effect if the Trade Balance is negative.
- WTI prices trade in negative territory for the third consecutive day near 82.20 on Tuesday.
- The growing speculation of delay rate cuts and the Fed’s hawkish remark weigh on the black gold.
- A successful ceasefire negotiation might mitigate the geopolitical risk premium built into WTI prices.
Western Texas Intermediate (WTI), the US crude oil benchmark, is trading around $82.20 on Tuesday. The black gold edges lower as ceasefire talks between Israel and Hamas in Cairo alleviated the fear of a broader conflict in the Middle East.
The most recent ceasefire proposal appears to include major compromises from Israel, which is under pressure over the fate of the captives and faces worldwide criticism over the humanitarian crisis its war has caused in Gaza, per the Guardian. A successful ceasefire negotiation might mitigate the geopolitical risk premium built into oil prices.
Additionally, the recent US inflation data and hawkish stance from the US Federal Reserve (Fed) dimmed the prospect of imminent interest rate cuts, which caps the upside of black gold. The US Fed is expected to hold rates steady in its current 5.25%–5.50% range on Wednesday. Chair Jerome Powell’s press conference will also be a closely watched event, as it might provide insights into the Fed's stance on interest rate adjustments. The 'higher-for-longer' interest rates narrative might lift the US Dollar (USD) and exert some selling pressure on the USD-denominated oil
Later on Tuesday, the Chinese Caixin Manufacturing PMI, NBS PMI data, the Eurozone Inflation data, and GDP growth numbers will be due. Apart from this, the API Weekly Crude Oil Stock for the week ending April 26 will be released.
The People’s Bank of China (PBoC) set the USD/CNY central rate for the trading session ahead on Tuesday at 7.1063 as compared to the previous day's fix of 7.1066 and 7.2459 Reuters estimates.
| Index | Change, points | Closed | Change, % |
|---|---|---|---|
| Hang Seng | 95.76 | 17746.91 | 0.54 |
| KOSPI | 31.11 | 2687.44 | 1.17 |
| ASX 200 | 61.5 | 7637.4 | 0.81 |
| DAX | -42.69 | 18118.32 | -0.24 |
| CAC 40 | -23.09 | 8065.15 | -0.29 |
| Dow Jones | 146.43 | 38386.09 | 0.38 |
| S&P 500 | 16.21 | 5116.17 | 0.32 |
| NASDAQ Composite | 55.18 | 15983.08 | 0.35 |
- USD/CAD trades on a stronger note near 1.3665 on Tuesday.
- The FOMC is widely expected to hold rates steady in its current 5.25%–5.50% range on Wednesday.
- The further downside of oil prices weighs on the commodity-linked Loonie.
The USD/CAD pair posts modest gains around 1.3665 on Tuesday during the early Asian trading hours. A modest rebound of the US Dollar (USD) provide some support to the pair. Meanwhile, the decline in oil prices weighs on the commodity-linked Loonie. Investors will keep an eye on the Canadian February Gross Domestic Product (GDP) growth number. The attention will shift to the Federal Open Market Committee's (FOMC) interest rate decision on Wednesday.
The US Federal Reserve’s (Fed) policymakers see no urgency in lowering rates. Fed Governor Michelle Bowman said she sees “upside risks” to inflation. Meanwhile, Minneapolis Fed President Neel Kashkari floated the possibility of having no rate cuts this year. Atlanta Fed’s Raphael Bostic said he could favor hiking them if inflation gets worse. The US Fed’s higher-for-longer rate narrative lifts the Greenback and creates a tailwind for the USD/CAD pair.
The FOMC is widely expected to leave rates unchanged in their current 5.25%–5.50% range on Wednesday. Investors will closely monitor the tone of the FOMC statement and press conference. If the US central bank remains hawkish, this might strengthen the USD and attract more foreign capital inflows. On the other hand, the dovish tone might exert some selling pressure on the Greenback.
On the Loonie front, traders expect the Bank of Canada (BoC) to wait until June or July to start cutting its policy rate. The monthly Gross Domestic Product (GDP) data for February might offer some hints about how the Canadian economy performs. In case the report shows weaker-than-expected data, this might allow the Bank of Canada (BoC) to pivot to interest rate cuts sooner and weigh on the CAD. Meanwhile, the further downside of oil prices might exert some selling pressure on the Loonie, as Canada is the largest crude oil exporter to the United States (US).
| Pare | Closed | Change, % |
|---|---|---|
| AUDUSD | 0.65653 | 0.45 |
| EURJPY | 167.46 | -0.99 |
| EURUSD | 1.07219 | 0.22 |
| GBPJPY | 196.328 | -0.64 |
| GBPUSD | 1.2562 | 0.53 |
| NZDUSD | 0.59771 | 0.55 |
| USDCAD | 1.36594 | -0.05 |
| USDCHF | 0.90999 | -0.43 |
| USDJPY | 156.285 | -1.16 |


© 2000-2026. All rights reserved.
This site is managed by Teletrade D.J. LLC 2351 LLC 2022 (Euro House, Richmond Hill Road, Kingstown, VC0100, St. Vincent and the Grenadines).
The information on this website is for informational purposes only and does not constitute any investment advice.
The company does not serve or provide services to customers who are residents of the US, Canada, Iran, The Democratic People's Republic of Korea, Yemen and FATF blacklisted countries.
Making transactions on financial markets with marginal financial instruments opens up wide possibilities and allows investors who are willing to take risks to earn high profits, carrying a potentially high risk of losses at the same time. Therefore you should responsibly approach the issue of choosing the appropriate investment strategy, taking the available resources into account, before starting trading.
Use of the information: full or partial use of materials from this website must always be referenced to TeleTrade as the source of information. Use of the materials on the Internet must be accompanied by a hyperlink to teletrade.org. Automatic import of materials and information from this website is prohibited.
Please contact our PR department if you have any questions or need assistance at pr@teletrade.global.
transfers