- Analytics
- News and Tools
- Market News
CFD Markets News and Forecasts — 29-04-2024
The European Central Bank (ECB) Governing Council member and President of De Nederlandsche Bank (DNB), Klaas Knot, said on late Monday that Eurozone inflation is easing towards the 2% target, and geopolitical tensions pose minor threats, but the ECB should still exercise caution when cutting interest rates beyond a first step in June, per Reuters.
Key quotes
"I am increasingly confident in the disinflation process.”
“Eurozone inflation is falling towards 2%.”
“Geopolitical stress poses only moderate risks.”
“June rate cut remains realistic if price and wage data continue to come in line with projections.”
"After June, I would say: no pre-commitment to any specific time path.”
“We will have to take a cautious approach after June.”
“Every quarter, we will have an additional data point on the labor market going into a fresh round of projections and that will be an important piece of information for us to recalibrate our policy settings.”
“The experience of the US in the last three months has reminded us that we should still be vigilant.”
“It may well be only in the course of 2025 that this condition can be established.”
Market reaction
These comments have little to no market reaction to the Euro. The EUR/USD pair is trading at 1.0717, losing 0.03% on the day.
ECB FAQs
The European Central Bank (ECB) in Frankfurt, Germany, is the reserve bank for the Eurozone. The ECB sets interest rates and manages monetary policy for the region. The ECB primary mandate is to maintain price stability, which means keeping inflation at around 2%. Its primary tool for achieving this is by raising or lowering interest rates. Relatively high interest rates will usually result in a stronger Euro and vice versa. The ECB Governing Council makes monetary policy decisions at meetings held eight times a year. Decisions are made by heads of the Eurozone national banks and six permanent members, including the President of the ECB, Christine Lagarde.
In extreme situations, the European Central Bank can enact a policy tool called Quantitative Easing. QE is the process by which the ECB prints Euros and uses them to buy assets – usually government or corporate bonds – from banks and other financial institutions. QE usually results in a weaker Euro. QE is a last resort when simply lowering interest rates is unlikely to achieve the objective of price stability. The ECB used it during the Great Financial Crisis in 2009-11, in 2015 when inflation remained stubbornly low, as well as during the covid pandemic.
Quantitative tightening (QT) is the reverse of QE. It is undertaken after QE when an economic recovery is underway and inflation starts rising. Whilst in QE the European Central Bank (ECB) purchases government and corporate bonds from financial institutions to provide them with liquidity, in QT the ECB stops buying more bonds, and stops reinvesting the principal maturing on the bonds it already holds. It is usually positive (or bullish) for the Euro.
Japan's top currency diplomat, Masato Kanda, who will instruct the BoJ to intervene, when he judges it necessary, said that he has no comment on foreign exchange (FX) intervention for now when was asked by media if authorities had stepped into markets to support the Yen. Kanda added that the Ministry of Finance will release figures on currency intervention at the end of May.
Key quotes
“No comment on intervention.”
"Will disclose at end of next month.”
“Currency impact has a bigger impact on import prices now.”
“Excessive FX moves could impact on daily lives.”
“Need to take appropriate actions on FX.”
“Inappropriate to comment on Bank of Japan Governor Ueda’s comment.”
“Ready to take action 24 hours a day.”
“Won't comment on FX levels.”
Market reaction
The Japanese Yen (JPY) has attracted some buyers from the likely intervention by the Japanese authorities during Monday’s Asian session. At the time of writing, USD/JPY was trading at 156.27, losing 0.06% on the day.
Japanese Yen FAQs
The Japanese Yen (JPY) is one of the world’s most traded currencies. Its value is broadly determined by the performance of the Japanese economy, but more specifically by the Bank of Japan’s policy, the differential between Japanese and US bond yields, or risk sentiment among traders, among other factors.
One of the Bank of Japan’s mandates is currency control, so its moves are key for the Yen. The BoJ has directly intervened in currency markets sometimes, generally to lower the value of the Yen, although it refrains from doing it often due to political concerns of its main trading partners. The current BoJ ultra-loose monetary policy, based on massive stimulus to the economy, has caused the Yen to depreciate against its main currency peers. This process has exacerbated more recently due to an increasing policy divergence between the Bank of Japan and other main central banks, which have opted to increase interest rates sharply to fight decades-high levels of inflation.
The BoJ’s stance of sticking to ultra-loose monetary policy has led to a widening policy divergence with other central banks, particularly with the US Federal Reserve. This supports a widening of the differential between the 10-year US and Japanese bonds, which favors the US Dollar against the Japanese Yen.
The Japanese Yen is often seen as a safe-haven investment. This means that in times of market stress, investors are more likely to put their money in the Japanese currency due to its supposed reliability and stability. Turbulent times are likely to strengthen the Yen’s value against other currencies seen as more risky to invest in.
- AUD/USD advances on improved risk sentiment and the impact of Japanese intervention on the US Dollar.
- US economic data shows a slight decline in the Dallas Fed Manufacturing Index.
- The Federal Reserve’s is expected to maintain current interest rates on May 1.
- Upcoming Australian Retail Sales and China's PMI data could further influence AUD/USD movements.
The Aussie Dollar registered solid gains against the US Dollar on Monday, edged up by 0.55% on an improvement in risk appetite, while the Greenback was crushed by Japanese authorities' intervention. As Tuesday’s Asian session begins, the AUD/USD trades at 0.6564, virtually unchanged.
AUD/USD edges higher on upbeat mood, ahead of crucial Aussie and US data
Wall Street finished with gains, while US Treasury yields dropped. Consequently, that undermined the US Dollar, which was left adrift to an anemic economic calendar. The Dallas Fed Manufacturing Index in April was at -14.5 vs. -14.4 in March. The data was ignored by market participants, which are focused on the Federal Reserve’s monetary policy decision on May 1.
The US central bank is expected to hold rates unchanged, following hawkish remarks by Fed Chairman Jerome Powell, who commented that the “lack of progress on inflation” would be a reason to keep rates higher for longer. After that, the swaps market had priced out 5 rate cuts from the six foreseen by traders at the beginning of 2024.
Futures data from the Chicago Board of Trade (CBOT) shows that market participants estimate a full 25 basis points (bps) rate cut by the end of the year.
Aside from this, Australia’s economic docket will feature March’s Retail Sales, which are expected to dip from 0.3% to 0.2% MoM, indicating further weakness. If the number comes as expected, the AUD/USD could drag lower, but after breaching the 200-day moving average (DMA) of 0.6524, that could be seen as the first support. Otherwise, an upbeat result could underpin the Aussie, as strong sales would mean the Reserve Bank of Australia (RBA) must keep rates at the current level.
Furthermore, traders would eye the release of China’s PMIs. As Australia’s largest trade partner, positive data could influence the Aussie Dollar’s path.
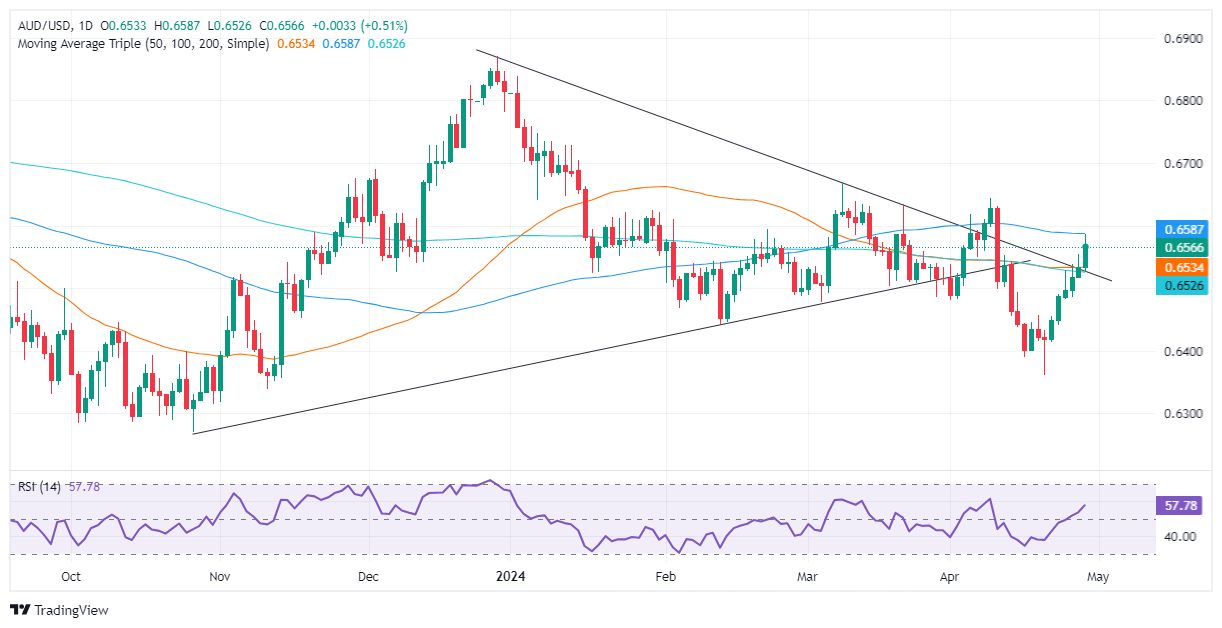
AUD/USD Price Analysis: Technical outlook
The AUD/USD is neutrally biased, but it could shift to neutral upwards if buyers reclaim the 100-DMA at 0.6584, followed by the latest cycle high seen at 0.6644, the April 9 high. Once cleared, that could open the door to challenge 0.6700. On the flip side, a drop below the confluence of the 50 and 200-DMAs at around 0.6523/33 opens the door for a retracement to 0.6500.
- GBP/USD takes a breather around 1.2560 in Tuesday’s early Asian session.
- The US Fed is expected to hold rates steady at its May meeting on Wednesday.
- Investors reduce their bets on BoE rate cuts, which support the Cable.
The GBP/USD pair consolidates its gains near 1.2560 after flirting with the key 200-day SMA and three-week highs in the 1.2550-1.2560 zone during the early Asian session on Tuesday. The recovery of the major pair is supported by a falling US Dollar Index (DXY) to 105.65. On Wednesday, the Federal Open Market Committee's (FOMC) interest rate decision will take center stage ahead of the release of April’s Nonfarm Payrolls (NFP) on Friday.
The US Federal Reserve (Fed) is widely anticipated to hold rates steady at a more than two-decade high after their meeting on Wednesday. Investors will take more cues from the tone of the meeting and Chair Jerome Powell’s press conference. Financial markets expect only one Fed rate cut in 2024, below the roughly six quarter-point cuts they expected at the beginning of the year.
The recent US GDP growth numbers and hotter-than-expected inflation data might convince the Fed to hold the rate higher for longer to become confident inflation is moving toward the central bank’s 2% target. The hawkish stance of the Fed might lift the Greenback and cap the upside of the GBP/USD pair in the near term.
On the other hand, the Pound Sterling (GBP) gains traction amid mixed guidance from Bank of England (BoE) policymakers over the inflation outlook. Investors reduce their bets on BoE rate cuts, which provide some support to the Cable. In the absence of top-tier economic data releases from the UK, the USD price dynamics will continue to play a key role in influencing the GBP/USD pair.
- German CPI inflation continues to rise, but below forecasts.
- Fed rate call, pan-EU GDP and HICP inflation in the mid-week.
- NFP Friday a key US datapoint this week.
EUR/USD jostled on Monday, settling near 1.0720 after churning in a tight but lopsided range as markets settle in for the wait to Wednesday’s US Federal Reserve (Fed) outing. Investors broadly expect US rates to hold steady this week, but traders will be looking for an uptick in Fed guidance for when rate cuts could be coming. As of writing, the CME’s FedWatch Tool shows rate markets are pricing in 58% odds of a first rate cut in September.
German Consumer Price Index (CPI) inflation rose to 0.5% MoM in April, up from the previous month’s 0.4% but missing the forecast 0.6%. Germany’s YoY Harmonized Index of Consumer Prices (HICP) inflation ticked higher to 2.4%, compared to the forecast hold at 2.3%. Markets will be looking ahead to Tuesday’s HICP inflation for the pan-Euro area, which is expected to stand pat at 2.4% for the year ended April.
European Gross Domestic Product (GDP) figures are also due during Tuesday’s European market session, forecast to grind higher to a scant 0.1% in the first quarter compared to the previous quarter’s flat 0.0%.
The key headlines this week will be the Fed’s latest rate call on Wednesday, followed by Friday’s NFP labor data, which is expected to show a slight easing from the previous month’s 12-month peak of 303k. Friday’s US NFP is forecast to ease to 243k net additional job growth.
EUR/USD technical outlook
The EUR/USD churned just north of the 1.0700 handle on Monday as the pair continues to grind higher off of technical bounces from the 200-hour Exponential Moving Average (EMA) rising into the 1.0700 region. Chart paper north of 1.0750 is proving a difficult boundary to cross, and downside momentum, though sluggish, continues to keep the pair weighed down.
EUR/USD remains down 2.5% from the last major swing high into 1.0980, with a near-term price floor at 1.0600.
EUR/USD hourly chart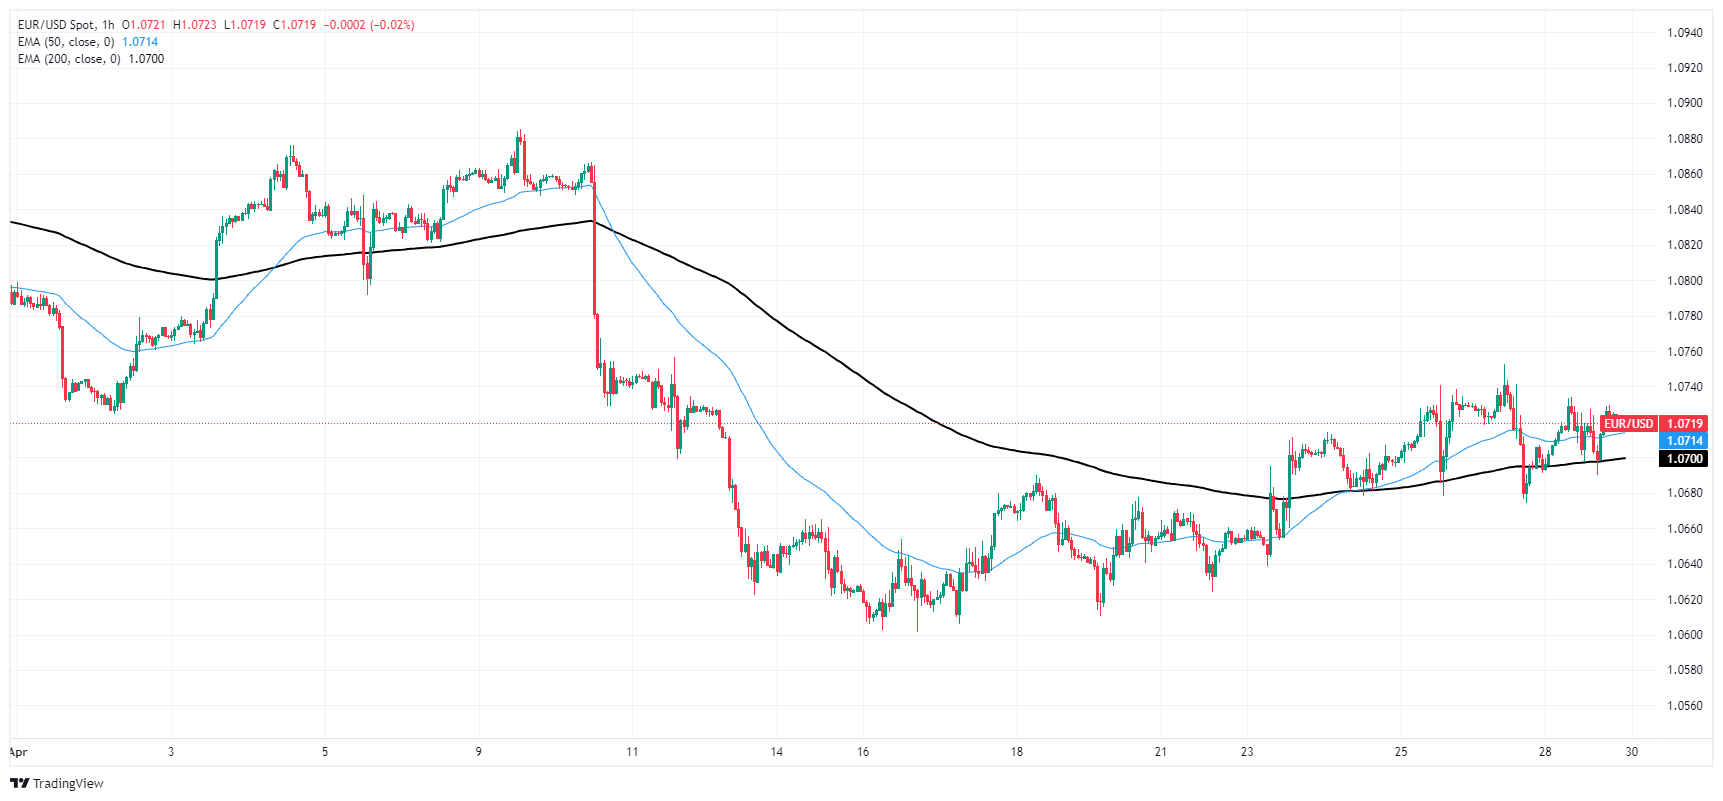
EUR/USD daily chart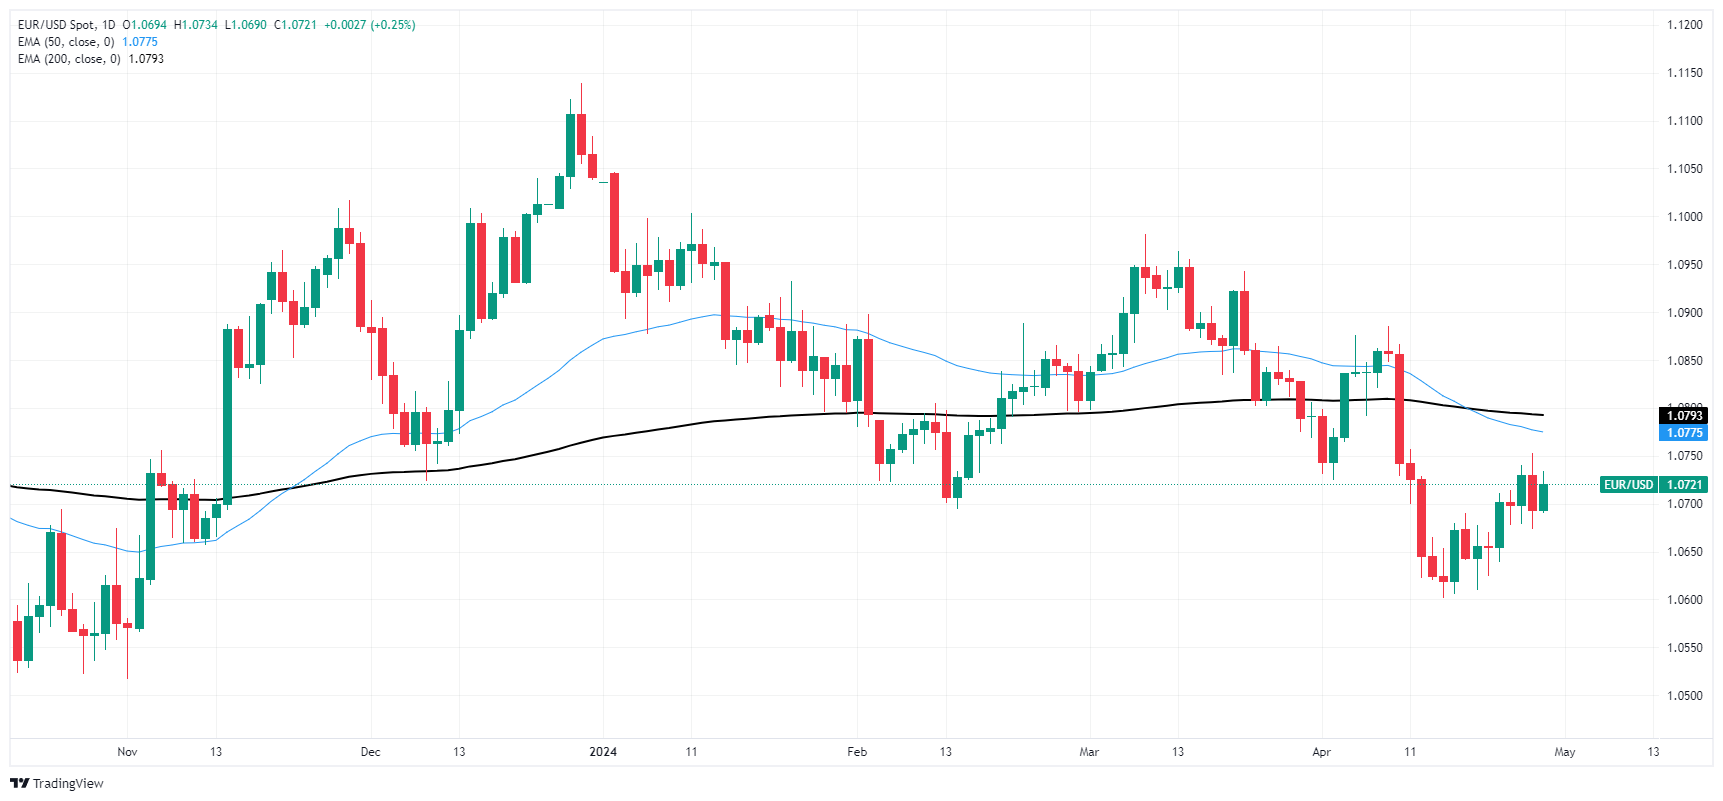
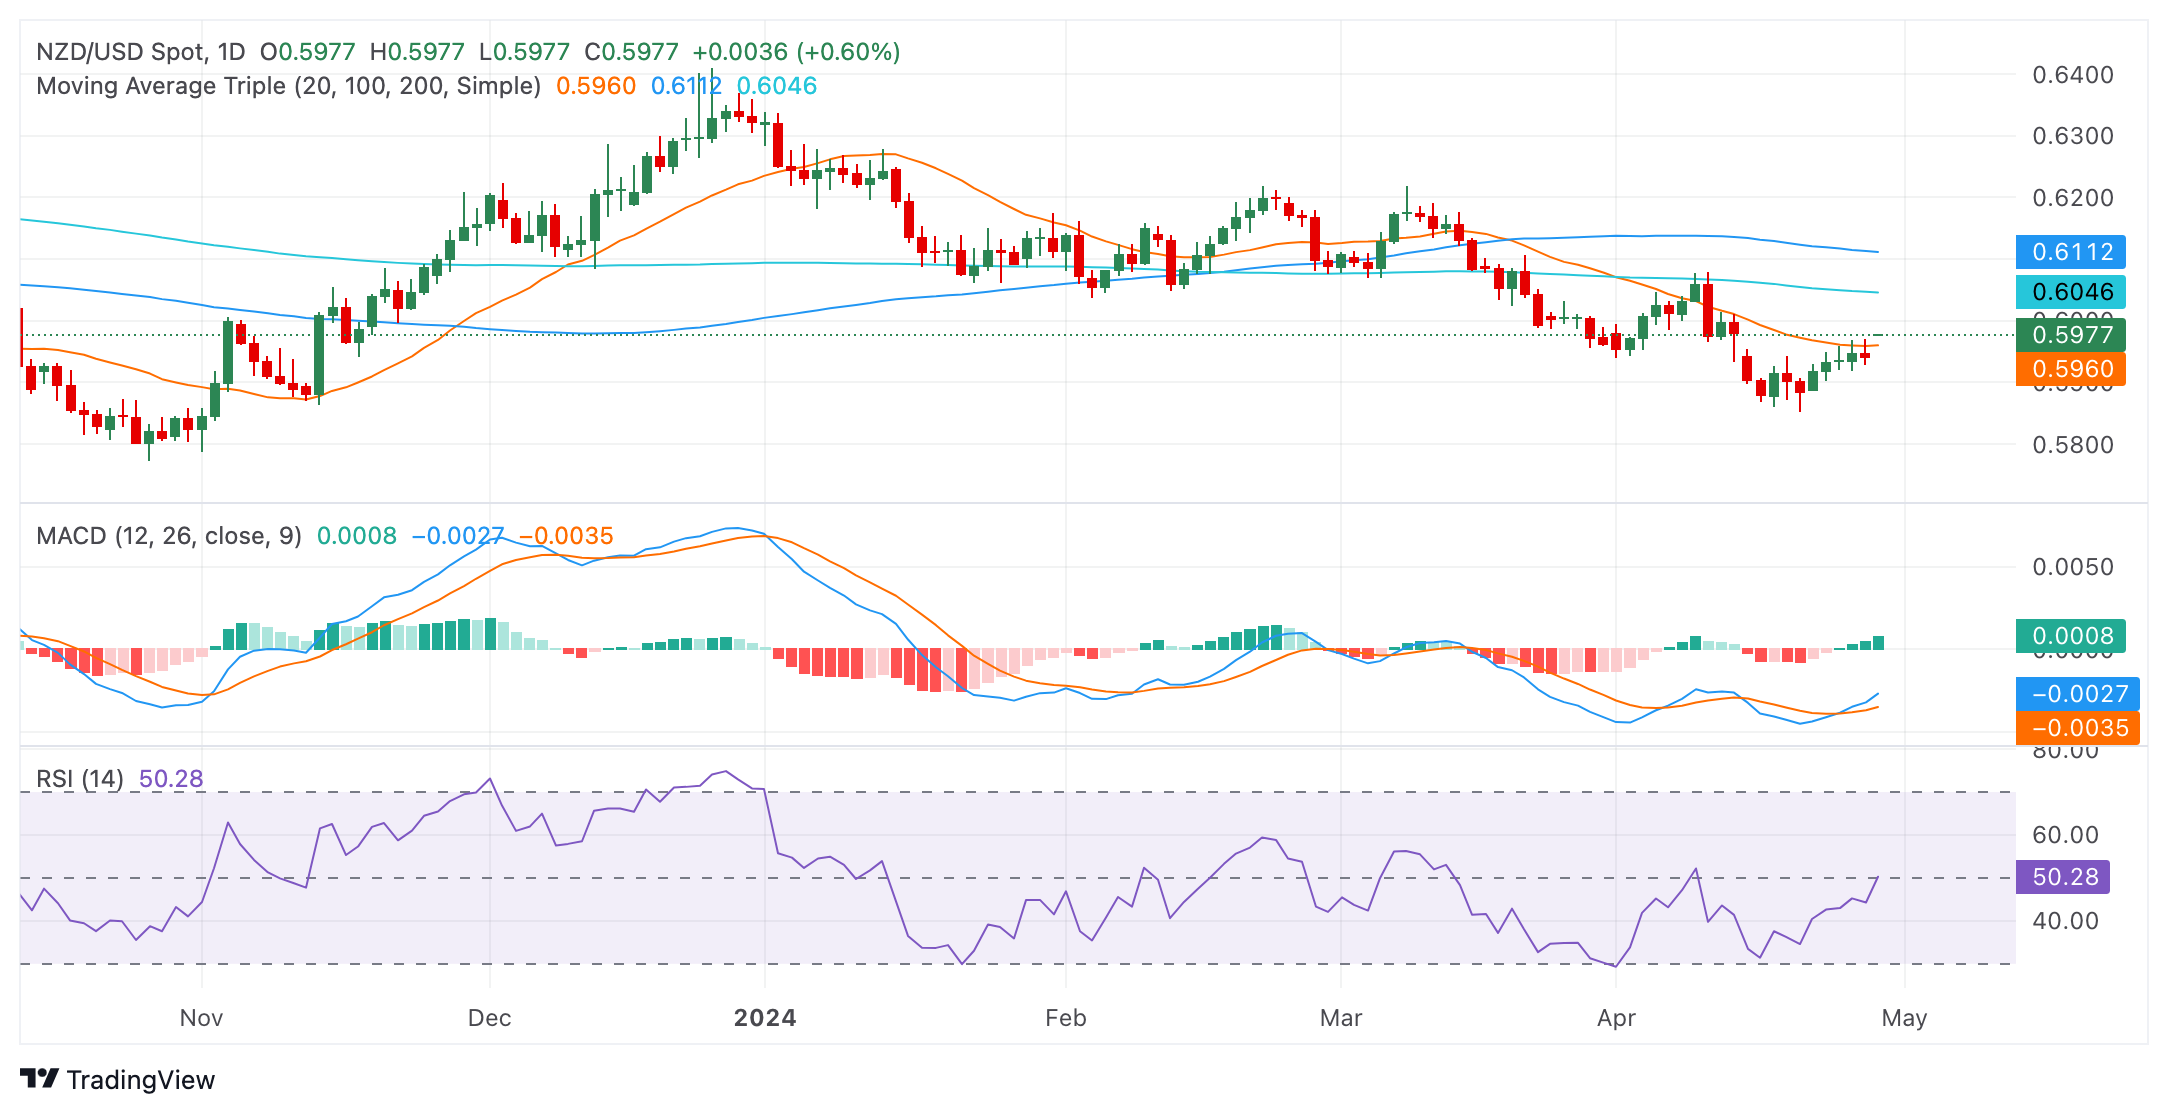
- The NZD/USD maintains a bearish stance while showing a flattening buying momentum on both daily and hourly charts.
- The bulls got rejected again by the 20-day SMA.
- Any upward movement that fails to conquer the mentioned SMA shouldn’t be considered a buying signal.
The NZD/USD pair rallied to 0.5980 on Monday and then stabilized around 0.5960, yet maintains a bearish outlook. While recent movements have shown increased buying momentum, significant positioning beneath key Simple Moving Averages (SMAs) indicates a larger bearish bias and as long as the pair is kept below this levels, the outlook will remain in favor of the bears.
On the daily chart, the Relative Strength Index (RSI) indicates a positive trend for the NZD/USD pair. From the oversold territory, the index is now on its way to its middle point, demonstrating an increase in buying momentum. The Moving Average Convergence Divergence (MACD) histogram displays flat green bars, suggesting steady positive momentum with buyers dominating the market but warns of a flattening buying traction.
NZD/USD daily chart
Transitioning to the hourly chart, the RSI maintains a positive outlook, hovering around the 57 mark but is currently pointing down, suggesting that the buyers are running out of steam in this timeframe. The MACD shows flat green bars, pointing to a more cautious uptrend.
NZD/USD hourly chart
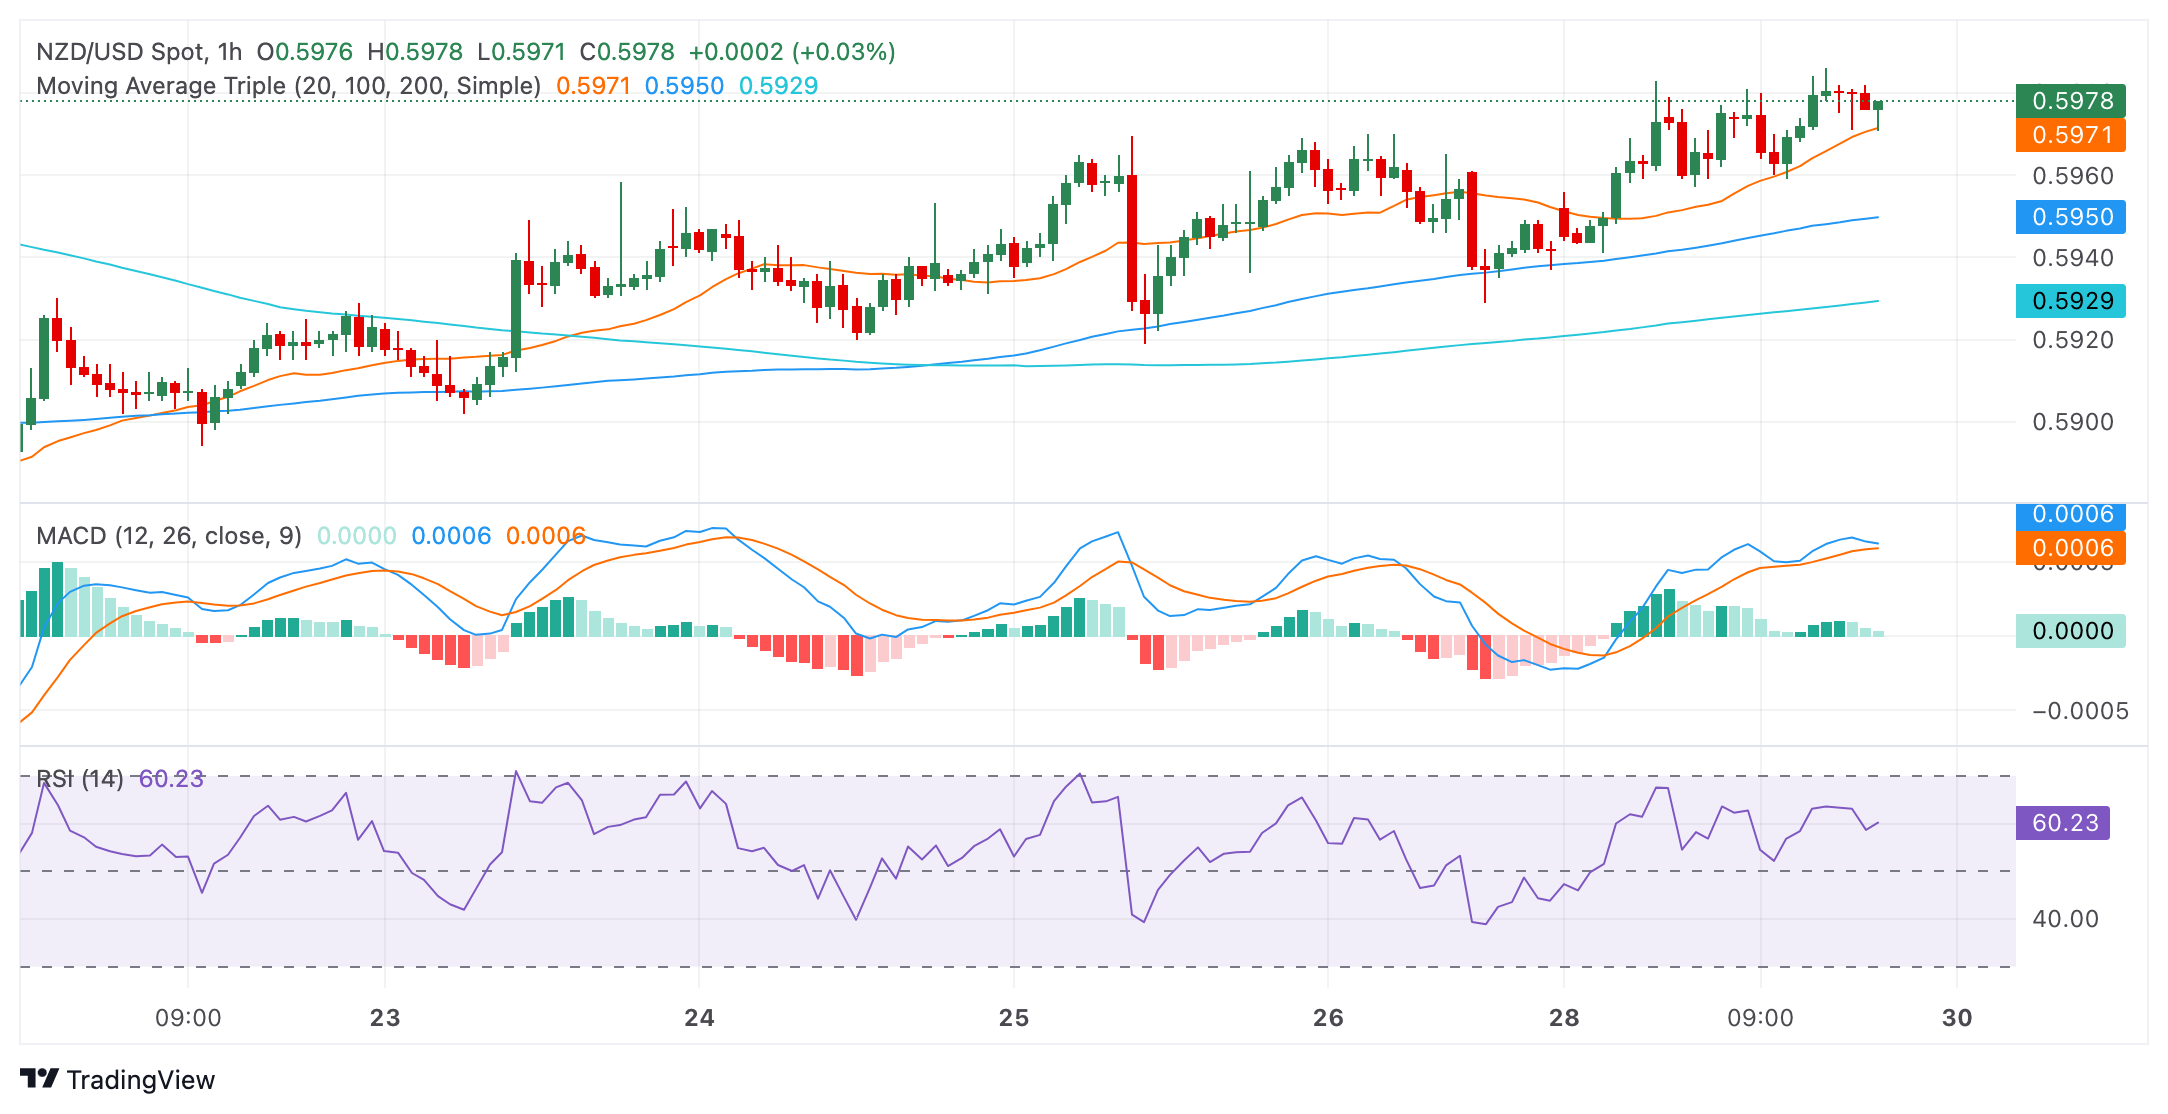
While analyzing the broader scope, the pair currently sits in a bearish posture. The Kiwi's position below its 20, 100, and 200-day Simple Moving Average (SMA), indicates an overall downtrend. The 20-day SMA rejected the buyers at the 0.596 mark on Monday, which could discourage bullish traders. However, ahead of the Asian session, buyers might make an additional stride to recover that level which could brighten the outlook for the pair.
- GBP/JPY hit three-decade high at 200.60 before steep pullback.
- Guppy covers plenty of ground, declines nearly 700 pips from day’s high.
- Possible Yen intervention to blame for broad-market JPY slide.
The GBP/JPY tumbled nearly 3.5% from the day’s 34-year peak at 200.60, rallying to its highest bids since August of 2008 before a rapid pullback, sending the pair down nearly 700 pips on Monday before markets recovered to the 196.00 technical region.
The Bank of Japan (BoJ) is believed to have intervened in global FX markets, sending the Japanese Yen (JPY) tumbling across the entire currency market. Investors will need to wait for official confirmation, but news outlets are citing unnamed sources that the BoJ stepped into the FX market while Japan was shuttered for the Showa Day holiday.
Monday was blank on the economic calendar for both the Yen and the Pound Sterling (GBP) with UK data traders faced with strictly low-tier data all week from the UK. On the JPY side, markets will be looking ahead to the BoJ’s latest Meeting Minutes, which are slated to publish early Thursday.
It’s a short trading week for the Yen; besides the Monday holiday closure, Japanese markets will also be dark on Thursday in observation of Japan’s Constitution Day, while Friday is yet another holiday in Japan for Children’s Day.
Guppy traders will be forced to wait until next week’s rate call and Monetary Policy Report from the Bank of England (BoE), which is slated for next Thursday.
GBP/JPY technical outlook
The Guppy saw one of its largest single-day trading ranges on Monday, peaking at 200.60 before tumbling back below 194.00. The pair has settled at the 196.00 handle, and traders will be keeping a close eye on the pair as they gauge whether the pair will snap its long-running bull streak.
The GBP/JPY is still on pace to close in the green for the month. The pair has closed bullish for all but three of the last 16 consecutive trading months.
Topside technical barriers remain limited as the pair grapples with multi-decade highs, and the most meaningful price floor will be the 200-day Exponential Moving Average (EMA), far below current price action at 185.16.
GBP/JPY hourly chart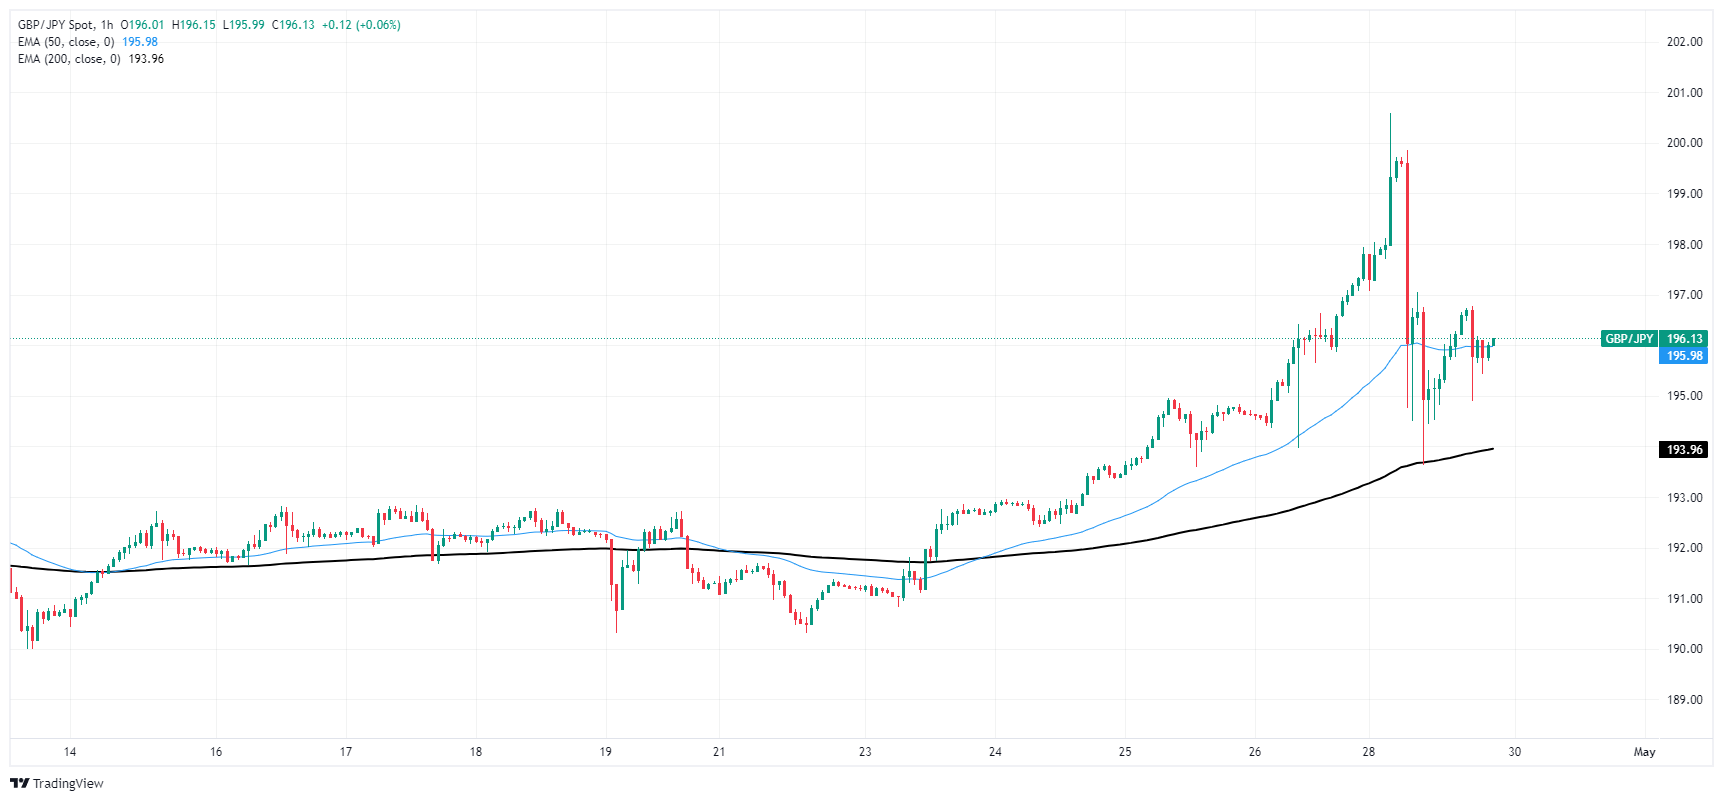
GBP/JPY daily chart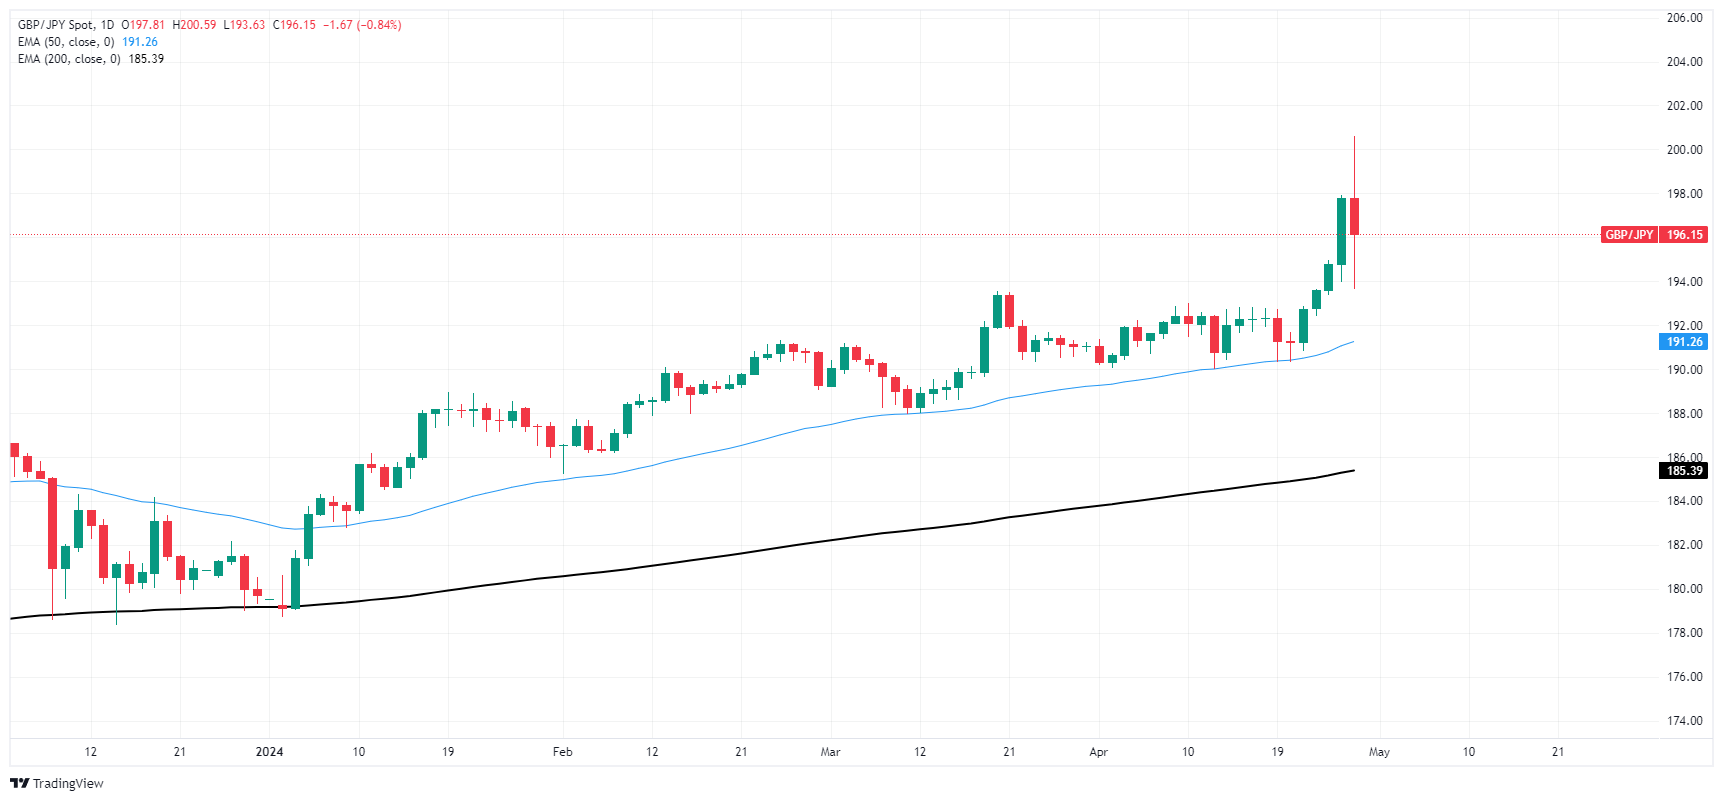
At a Euro 50 Group meeting on Monday, European Central Bank (ECB) Vice-President Luis de Guindos highlighted the ECB's progress on inflation, but pulled back from making any clear projections on the pace of rate cuts.
Key highlights
- Not pre-committing to a particular rate path.
- Risks to growth outlook remain elevated, tilted towards the downside.
- Expects consumer spending to strengthen.
- Economic activity is improving, albeit gradually.
- Stronger-than-expected policy transmission could produce downside shocks.
- Geopolitical landscape remains an upside inflation risk.
- 2% inflation target to be hit in 2025, but substantial risks remain.
- Wage growth is showing signs of easing.
- Inflation is expected to fluctuate near current levels for now.
- The slowdown in services inflation has stalled.
- Still plenty of work to be done on inflation.
- Inflation still headed in the right direction.
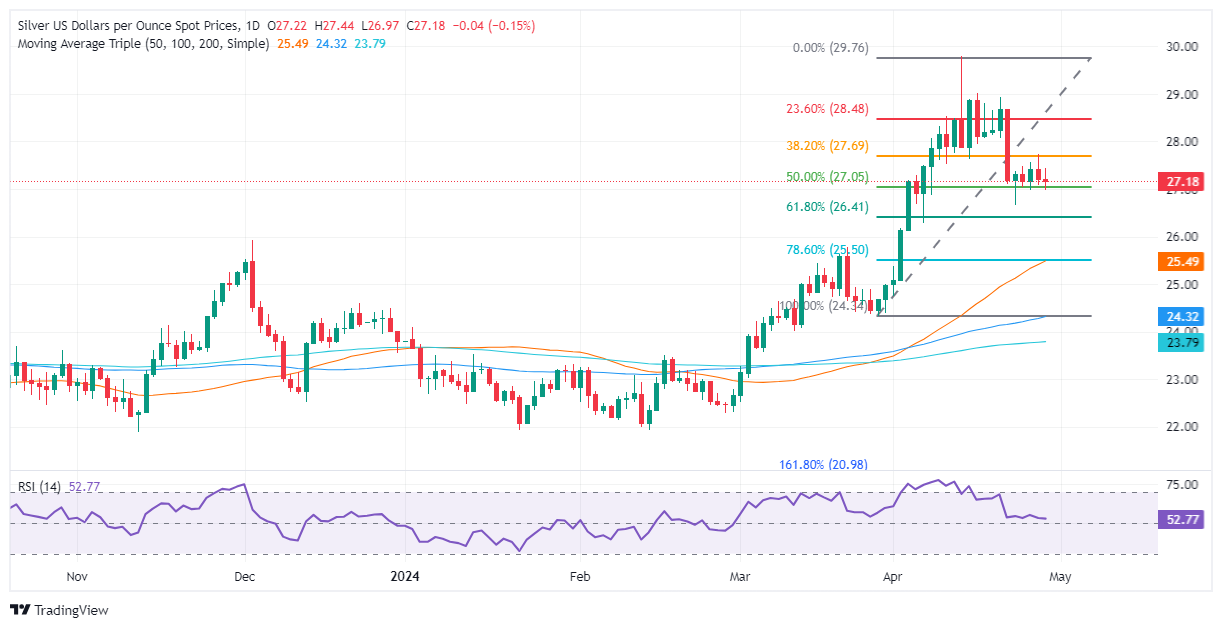
- Silver retreats from a high of $27.43 while interacting with key Fibonacci retracement levels.
- XAG/USD consolidates within the $27.05 to $27.70 Fibonacci range.
- A break above $27.70 could open the path to higher resistances at $28.00 and possibly extend towards the $29.00 mark and the annual high at $29.76.
- Should it fall below $27.05, Silver might target further supports at $26.41 and the crucial $25.50 level.
Silver's price edged down late during Monday’s North American session. It lost some 0.10% after reaching a daily high of $27.43 hit during the North American session. At the time of writing, XAG/USD trades at $27.12.
XAG/USD Price Analysis: Technical outlook
The XAG/USD daily chart suggests the grey metal is consolidating between 50% and 38.2% Fibonacci retracement, within the $27.05-$27.70 area of the Fib drawn from the swing low at $24.34 to the latest high at $29.76.
For a bullish continuation, traders need to reclaim the top of the abovementioned range at $27.70 so they can threaten to breach the $28.00 milestone. Once cleared, the next resistance would be the 23.6% Fib retracement at $28.48, followed by the $29.00 mark. The next supply area would be the year-to-date (YTD) high at $29.76.
On the flip side, bears could find some relief if XAG/USD slides below the 50% Fib retracement at $27.05, followed by the 61.8% retracement at $26.41. A subsequent dip is seen below that level, exposing the confluence of the 50-day moving average (DMA) and the 78.6% Fib retracement at $25.50.
XAG/USD Price Action – Daily Chart
- The daily RSI suggests consistent buying momentum, with a slight dip indicating the possibility of a short-term correction.
- The hourly RSI and MACD readings suggest mounting selling pressure in recent transactions.
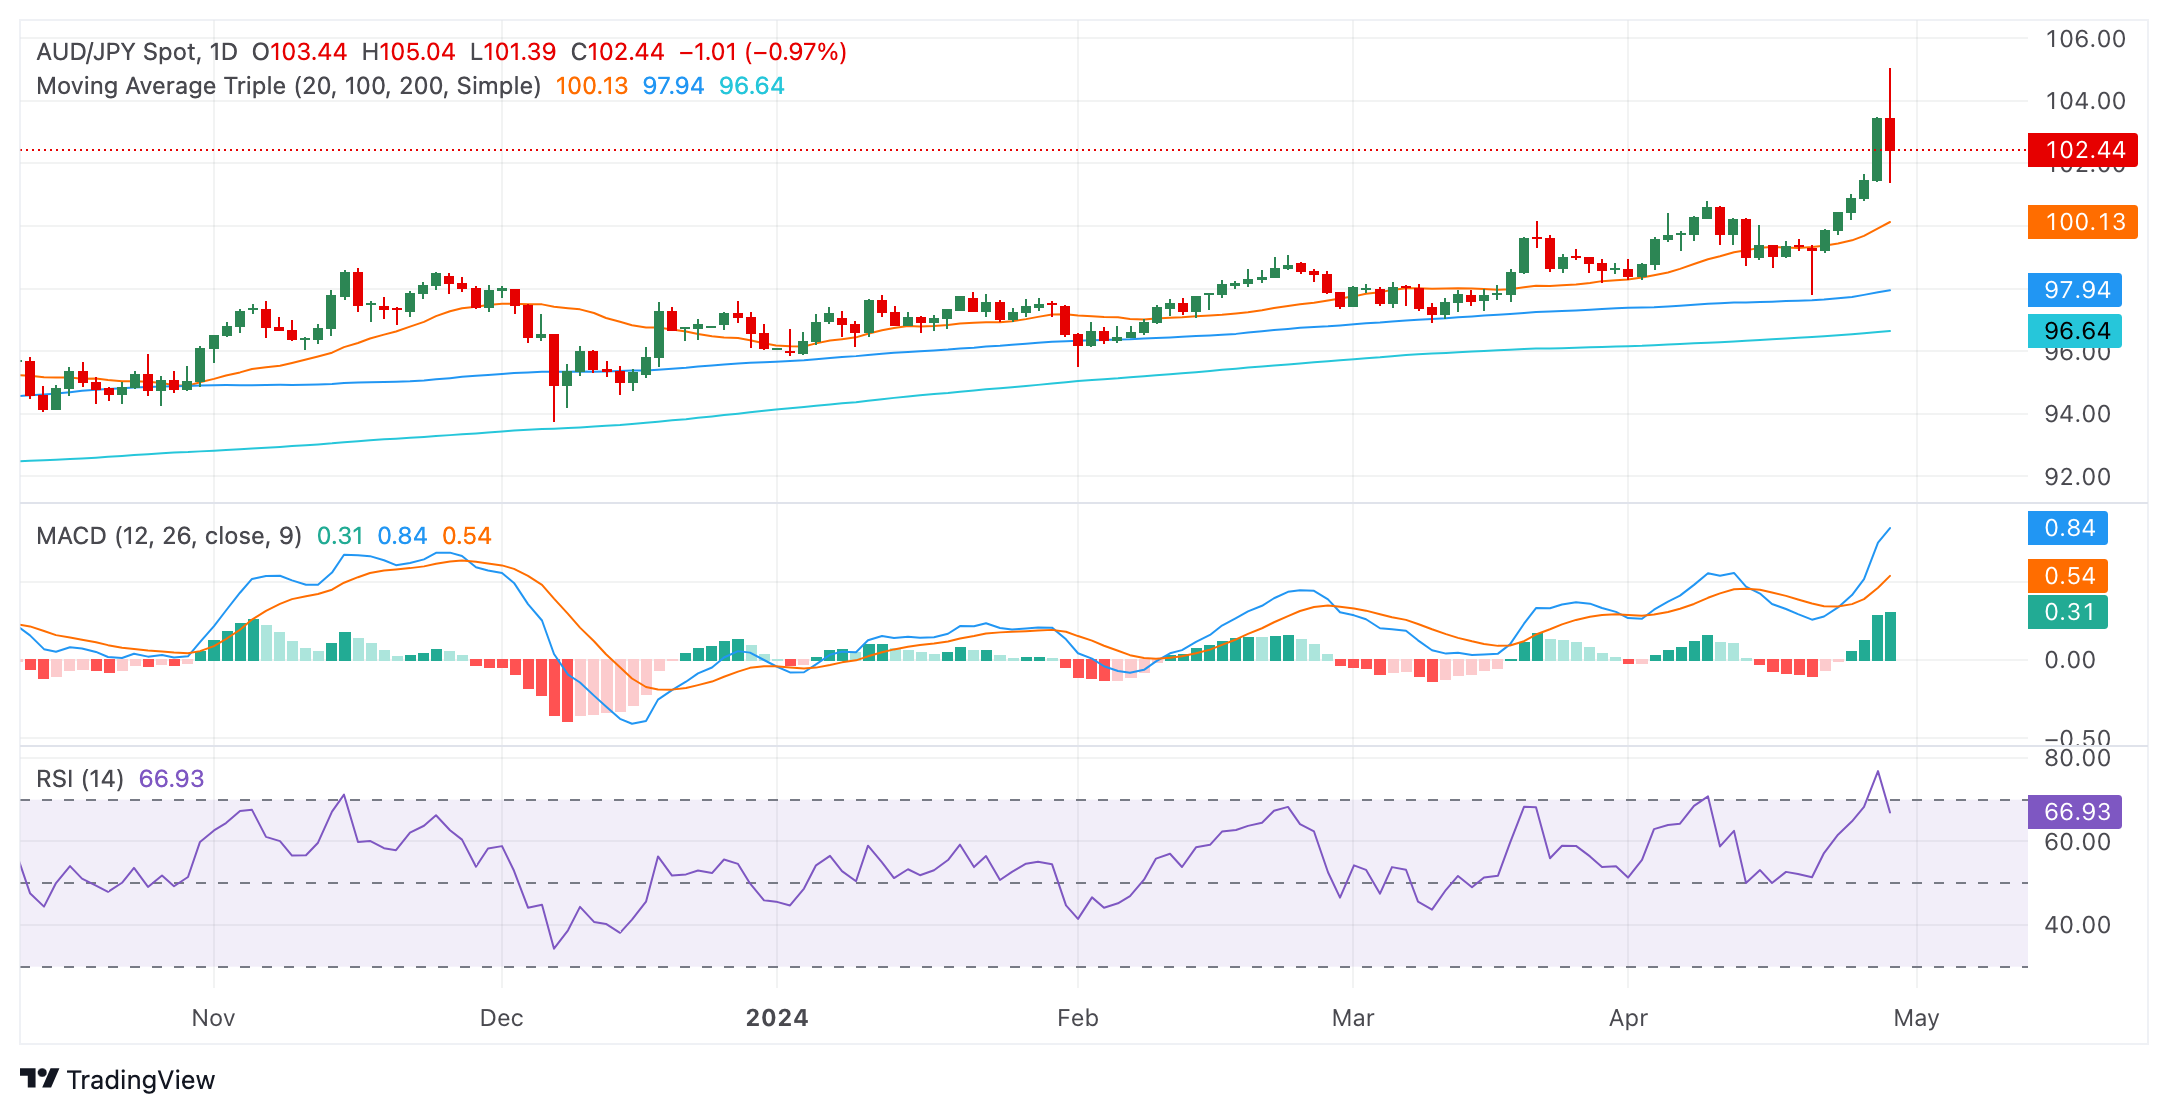
The AUD/JPY trades at 102.43, demonstrating a pronounced bullish inclination despite Monday’s sharp losses. Indicators took a big hit and suggests that despite the bullish command, sellers are gaining ground.
On the daily chart, the Relative Strength Index (RSI) is seen trending within the overbought terrain, suggesting that buying activity has dominated the market action. A recent dip from overbought territory to 66 indicates potential for a short-term correction in the upcoming sessions. Meanwhile, the Moving Average Convergence Divergence (MACD) maintains flat green bars, signifying stable positive momentum.
AUD/JPY daily chart
Shifting to the hourly chart, the RSI readings reveal a contrasting scenario. The hourly RSI readings are trending in the negative territory, demonstrating that selling activity had a certain control in the latest trading hours. Moreover, the hourly MACD marks flat red bars, underlining a steady negative momentum.
AUD/JPY hourly chart
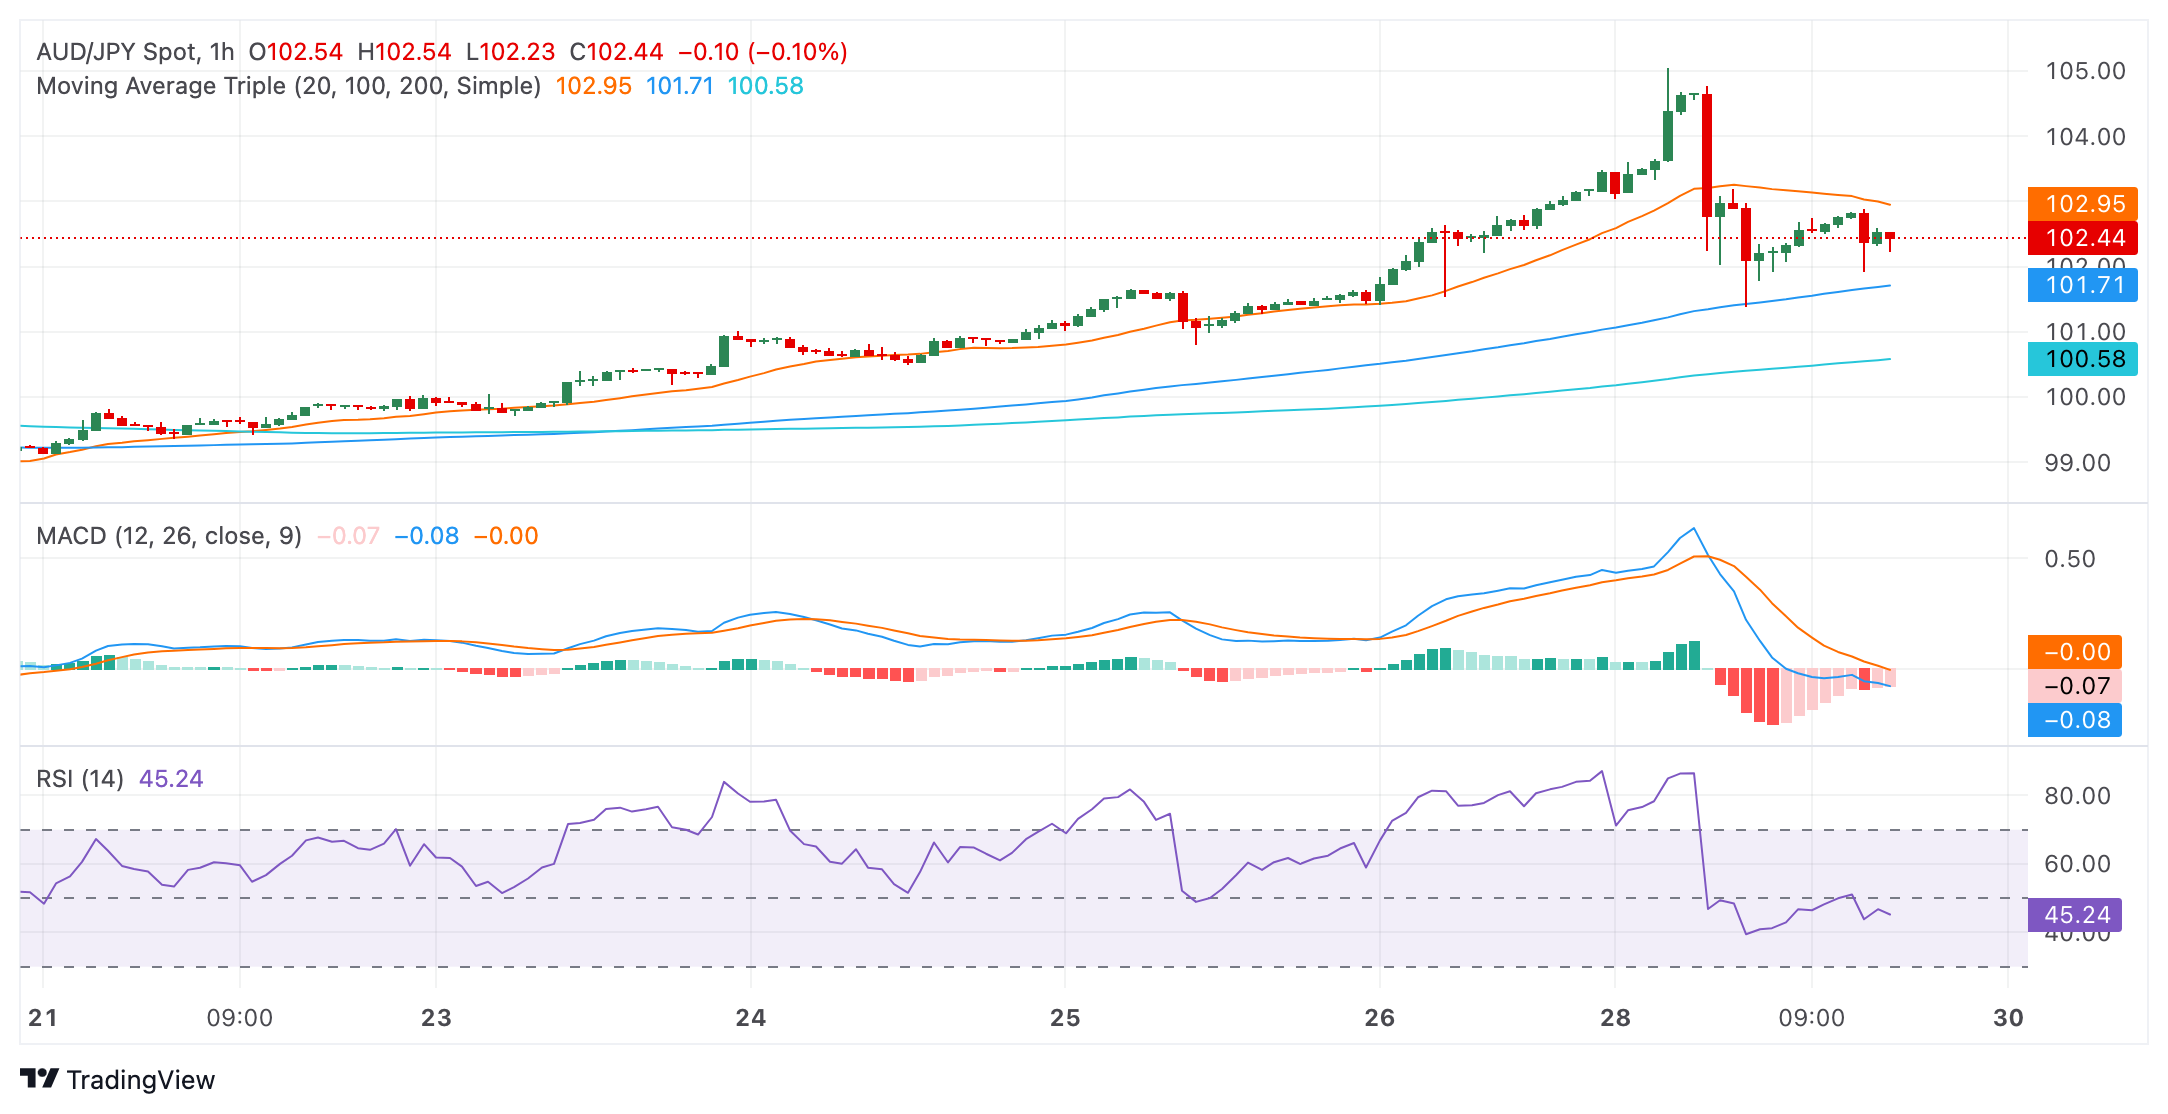
Observing the broader perspective, the AUD/JPY currently occupies a position above the 20, 100, and 200-day SMA. This stance underscores the prevailing bullish market sentiment in both short-term and long-term scenarios. In conclusion, while the daily indicators reflect an overall bullish sentiment, recent hourly readings suggest the potential for a short-term correction. Traders should monitor these contrasting signals closely as there might be a shift in the momentum in favor of the sellers and they might reclaim the 20-day SMA.
- Gold continues its three-day rally, buoyed by falling US Treasury yields and a weakening US Dollar.
- Recent US economic data, including underperforming GDP and stable core PCE inflation rates, increasing expectations for Fed holding rates.
- Attention now turns to the US Federal Reserve's monetary policy decision on May 1 and forthcoming Nonfarm Payrolls data.
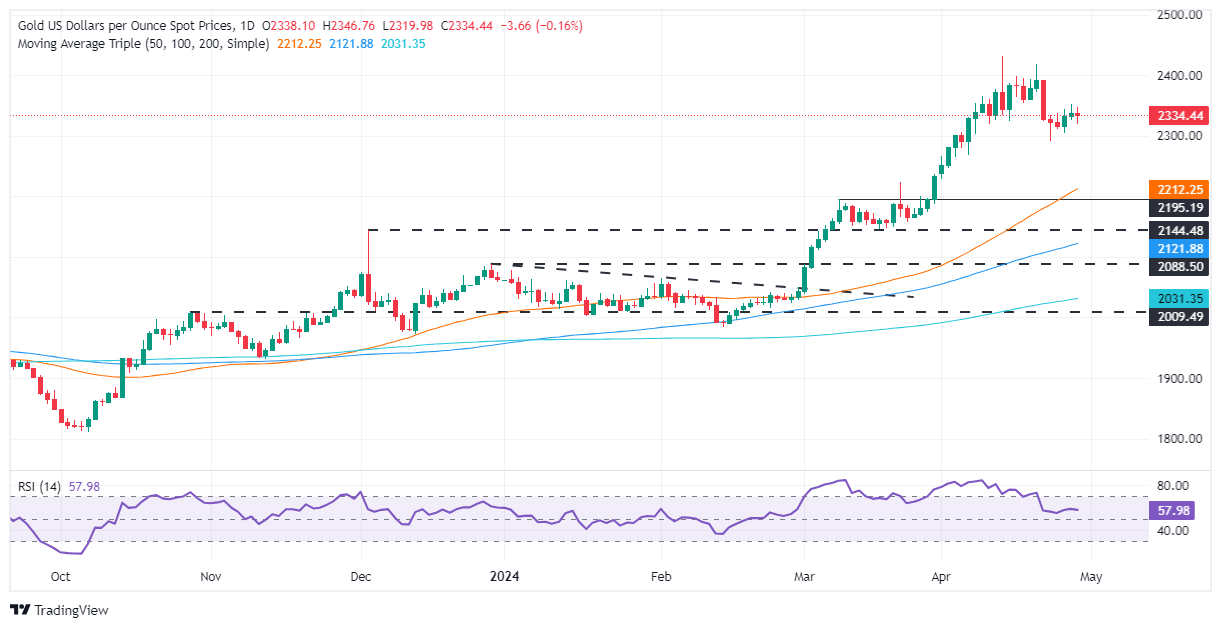
Gold's price extends its gains for the third straight day, yet it remains within familiar levels, with traders bracing for the US Federal Reserve’s (Fed) monetary policy decision on May 1. Last week, data from the United States (US) showed that Gross Domestic Product (GDP) missed the mark, while the Fed’s preferred gauge for inflation, the Core Personal Consumption Expenditure Price Index (PCE), stalled for the second straight month at 2.8% YoY.
The XAU/USD bounces off daily lows of $2,320 and trades at $2,340, courtesy of an improvement in risk appetite, lower US Treasury yields, and a weak US Dollar (USD). The Fed is expected to keep interest rates on hold following Fed Chairman Jerome Powell’s remarks in which he said the current monetary policy stance is appropriate due to the lack of progress on curbing inflation. Besides that, Investors will be eyeing the release of US Nonfarm Payrolls figures on Friday.
Daily digest market movers: Gold price climbs amid tumbling US yields
- Gold’s gains are sponsored by the drop in US Treasury yields and a soft US Dollar. The US 10-year Treasury bond yield dropped five basis points (bps) to 4.612%, a tailwind for the non-yielding metal. At the same time, the Greenback, as measured by the US Dollar Index (DXY), surrendered below 106.00, falling 0.43% to trade at 105.63.
- Last week’s softer than expected Gross Domestic Product (GDP) was overshadowed by the jump in the core Personal Consumption Expenditure Price Index (PCE) for Q1 2024 to 3.7%. Even though that spooked investors to price out the Federal Reserve’s interest rate cuts for 2024, the monthly reading of the core PCE at 2.8% YoY relieved traders, sparking an improvement in market mood.
- On May 3, the US Bureau of Labor Statistics (BLS) is expected to reveal April’s Nonfarm Payrolls figures, which are expected to come at 243K, below March’s 303K. The Unemployment Rate is estimated to stay unchanged at 3.8%, while Average Hourly Earnings (AHE) would likely remain unchanged at 0.3% MoM.
- Data from the Chicago Board of Trade (CBOT) suggests that traders expect the fed funds rate to finish 2024 at 5.035%, down from 5.050% last Friday.
Technical analysis: Gold price consolidates around $2,330
Gold price remains upwardly biased, though to extend its gains, buyers need to reclaim the April 26 high of $2,352, so they can remain hopeful of challenging higher prices. The next resistance would be the $2,400 mark, followed by the April 19 high at $2,417 and the all-time high of $2,431.
On the flip side, if the XAU/USD price dips below the April 15 daily low of $2,324, that would pave the way to test $2,300. A breach of the latter would expose the April 23 low of $2,229, followed by the March 21 high at $2,222.
Gold FAQs
Gold has played a key role in human’s history as it has been widely used as a store of value and medium of exchange. Currently, apart from its shine and usage for jewelry, the precious metal is widely seen as a safe-haven asset, meaning that it is considered a good investment during turbulent times. Gold is also widely seen as a hedge against inflation and against depreciating currencies as it doesn’t rely on any specific issuer or government.
Central banks are the biggest Gold holders. In their aim to support their currencies in turbulent times, central banks tend to diversify their reserves and buy Gold to improve the perceived strength of the economy and the currency. High Gold reserves can be a source of trust for a country’s solvency. Central banks added 1,136 tonnes of Gold worth around $70 billion to their reserves in 2022, according to data from the World Gold Council. This is the highest yearly purchase since records began. Central banks from emerging economies such as China, India and Turkey are quickly increasing their Gold reserves.
Gold has an inverse correlation with the US Dollar and US Treasuries, which are both major reserve and safe-haven assets. When the Dollar depreciates, Gold tends to rise, enabling investors and central banks to diversify their assets in turbulent times. Gold is also inversely correlated with risk assets. A rally in the stock market tends to weaken Gold price, while sell-offs in riskier markets tend to favor the precious metal.
The price can move due to a wide range of factors. Geopolitical instability or fears of a deep recession can quickly make Gold price escalate due to its safe-haven status. As a yield-less asset, Gold tends to rise with lower interest rates, while higher cost of money usually weighs down on the yellow metal. Still, most moves depend on how the US Dollar (USD) behaves as the asset is priced in dollars (XAU/USD). A strong Dollar tends to keep the price of Gold controlled, whereas a weaker Dollar is likely to push Gold prices up.
- Dow Jones climbs 0.4% as equities lean bullish to kick off the trading week.
- Tech Sector gains ground, Telecoms Services retreat.
- Fed rate call slated for Wednesday.
The Dow Jones Industrial Average (DJIA) is testing into the high side on Monday, with around two-thirds of listed securities on the major equity index finding the green as markets gear up for another Federal Reserve (Fed) rate call in the midweek. Another US Nonfarm Payrolls (NFP) Friday print looms ahead, and investors are tilting into the bullish side as markets continue to hinge focus on the possibility of rate cuts from the Fed.
The Fed’s latest rate meeting will begin on Tuesday and culminate in another rate call and press conference from Fed Chairman Jerome Powell on Wednesday. US Treasury yields are retreating and helping to bolster equities as investors lean into hopes of a softening stance from the US central bank. Rates are broadly expected to remain unchanged until September, with the CME’s FedWatch Tool showing rate markets expect around 58% odds a 25 basis point cut at the Fed’s September meeting. However, investors will be looking for signs of firming policy guidance from the Fed this week.
Read more: Fed Chair Powell to likely sound more cautious than usual – TD Securities
Friday’s NFP labor print will also provide key details for the state of the US economy in April. Markets currently expect Friday’s NFP to show 243K jobs additions for the month of April, down from March’s 303k print. March’s NFP jobs figure was the highest US employment gain since June of 2023.
Dow Jones news
Of the 30 securities that make up the Dow Jones, around a third of them were in the red on Monday, with Intel Corp. (INTC) leading the charge down, declining half a point to $31.45 per share, falling around 1.4%. INTC was closely followed by Microsoft Corp (MSFT), which fell five points to $401.24 per share, declining 1.25%. Boeing Co. (BA) shares climbed nearly six points to $172.93 per share, rising 3.4% with Apple Inc. (AAPL) close behind, rising around 3% to trade into $174.20 per share.
Dow Jones technical outlook
The Dow Jones remains tepid on Monday, climbing to a slim high of 38,401.03 before retreating back into the 38,300.00 region with the day’s bottom bids priced in near 38,267.55. Bullish momentum remains limited but determined as the DJIA grapples with the 200-hour Exponential Moving Average (EMA) at 38,297.23.
The Dow Jones is down around 4% from the last swing high just shy of the 40,000.00 major handle, bit the index is still trading safely into bull country, bidding north of the 200-day EMA at 36,725.68. The key long-run moving average has been provided a technical price floor for the Dow Jones since the index rose from last November’s bottoms near 32,800.00.
DJIA five-minute chart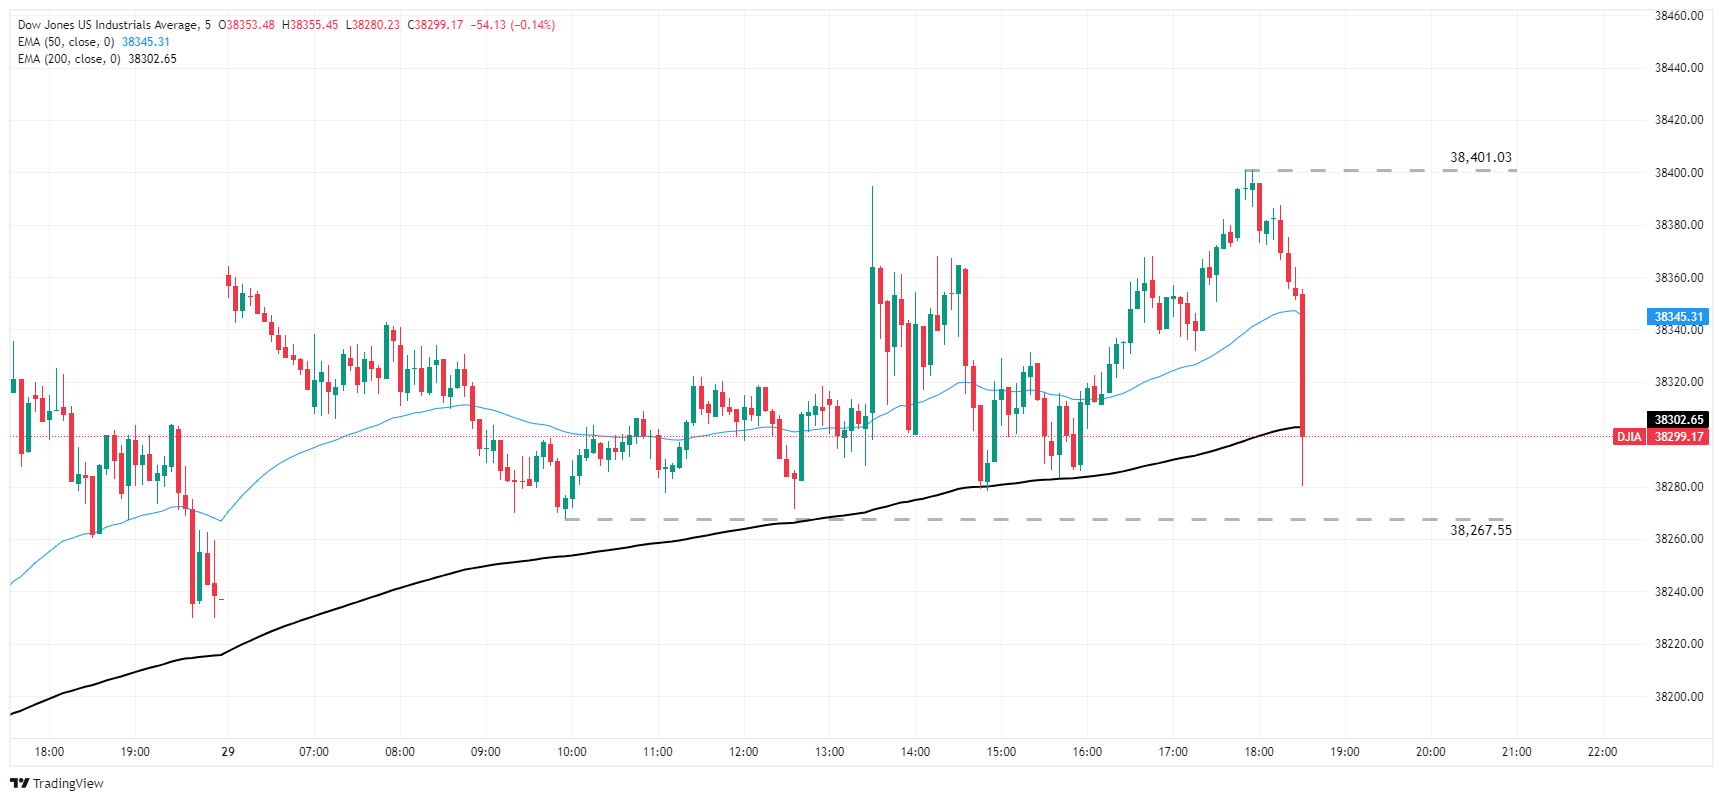
DJIA daily chart
Dow Jones FAQs
The Dow Jones Industrial Average, one of the oldest stock market indices in the world, is compiled of the 30 most traded stocks in the US. The index is price-weighted rather than weighted by capitalization. It is calculated by summing the prices of the constituent stocks and dividing them by a factor, currently 0.152. The index was founded by Charles Dow, who also founded the Wall Street Journal. In later years it has been criticized for not being broadly representative enough because it only tracks 30 conglomerates, unlike broader indices such as the S&P 500.
Many different factors drive the Dow Jones Industrial Average (DJIA). The aggregate performance of the component companies revealed in quarterly company earnings reports is the main one. US and global macroeconomic data also contributes as it impacts on investor sentiment. The level of interest rates, set by the Federal Reserve (Fed), also influences the DJIA as it affects the cost of credit, on which many corporations are heavily reliant. Therefore, inflation can be a major driver as well as other metrics which impact the Fed decisions.
Dow Theory is a method for identifying the primary trend of the stock market developed by Charles Dow. A key step is to compare the direction of the Dow Jones Industrial Average (DJIA) and the Dow Jones Transportation Average (DJTA) and only follow trends where both are moving in the same direction. Volume is a confirmatory criteria. The theory uses elements of peak and trough analysis. Dow’s theory posits three trend phases: accumulation, when smart money starts buying or selling; public participation, when the wider public joins in; and distribution, when the smart money exits.
There are a number of ways to trade the DJIA. One is to use ETFs which allow investors to trade the DJIA as a single security, rather than having to buy shares in all 30 constituent companies. A leading example is the SPDR Dow Jones Industrial Average ETF (DIA). DJIA futures contracts enable traders to speculate on the future value of the index and Options provide the right, but not the obligation, to buy or sell the index at a predetermined price in the future. Mutual funds enable investors to buy a share of a diversified portfolio of DJIA stocks thus providing exposure to the overall index.
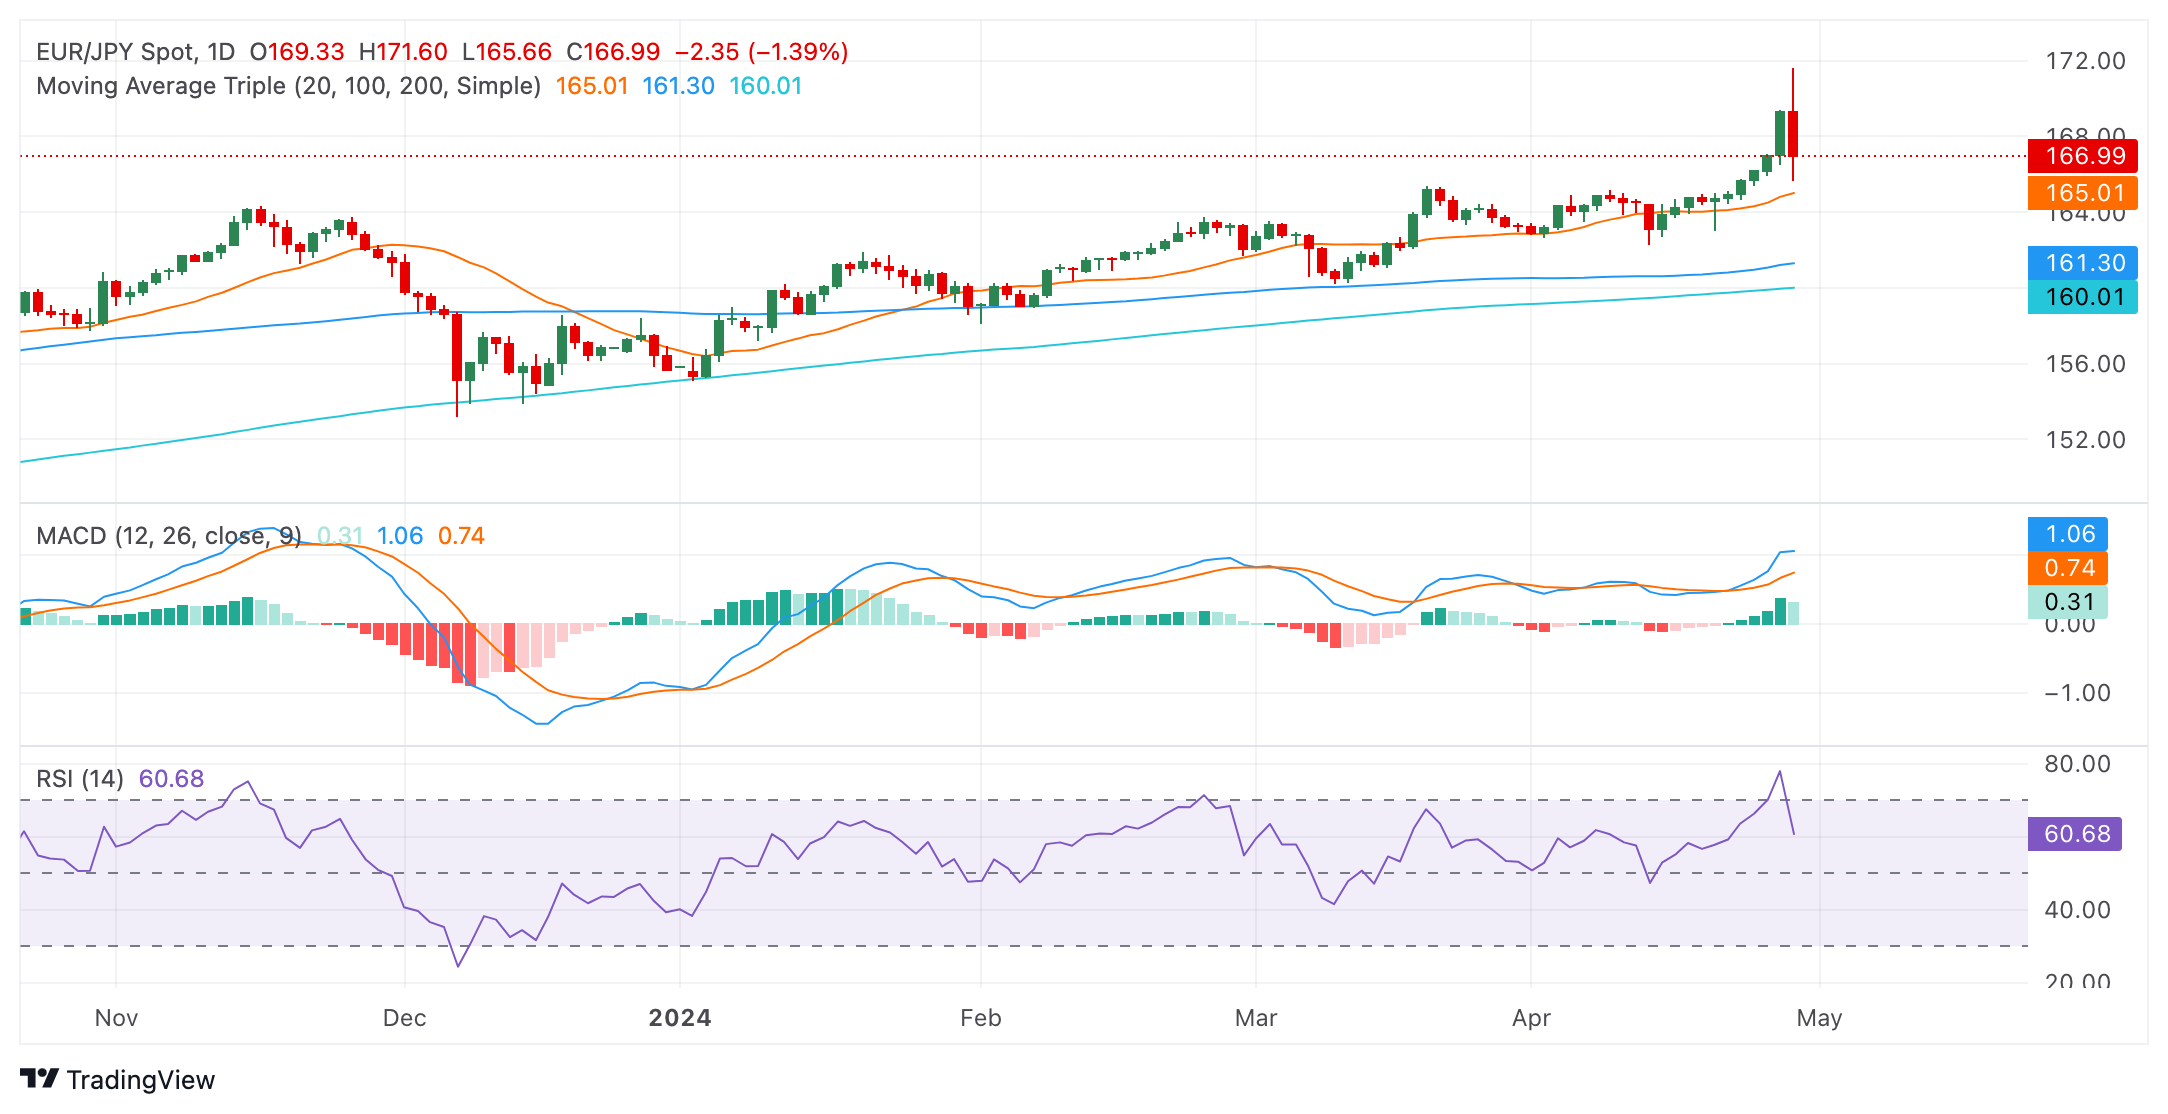
- The daily RSI of the EUR/JPY transitioned from its overbought threshold to near 60.
- In the hourly chart, the RSI reveals intense short-term bearish momentum, with the MACD also depicting increased negative bias.
- Any move below the primary SMAs could alter the bullish trend.
The EUR/JPY pair demonstrates resilience, bouncing back after encountering stern resistance at around the pivotal 165.50 landmark. Having faced a downward momentum of 0.90%, the pair skillfully remains above key Simple Moving Averages (SMAs), underlining the persistent bullish sentiment. Yet, market participants are encouraged to prepare for potential short-term adjustments, as bears are gaining ground.
On the daily chart, the Relative Strength Index (RSI) took a big hit on Monday. Notwithstanding, the current value remains in the positive trend territory, potentially signaling the continuation of buying momentum. The Moving Average Convergence Divergence (MACD) prints decreasing green bars, suggesting that the tide might have turned in favor of the bears.
EUR/JPY daily chart
Turning to the hourly RSI, it is located in the negative territory. This situation highlights possible downward momentum, aligning with the downward trend depicted on the Moving Average Convergence Divergence (MACD) histogram, currently showing rising red bars, denoting strengthened negative momentum.
EUR/JPY hourly chart
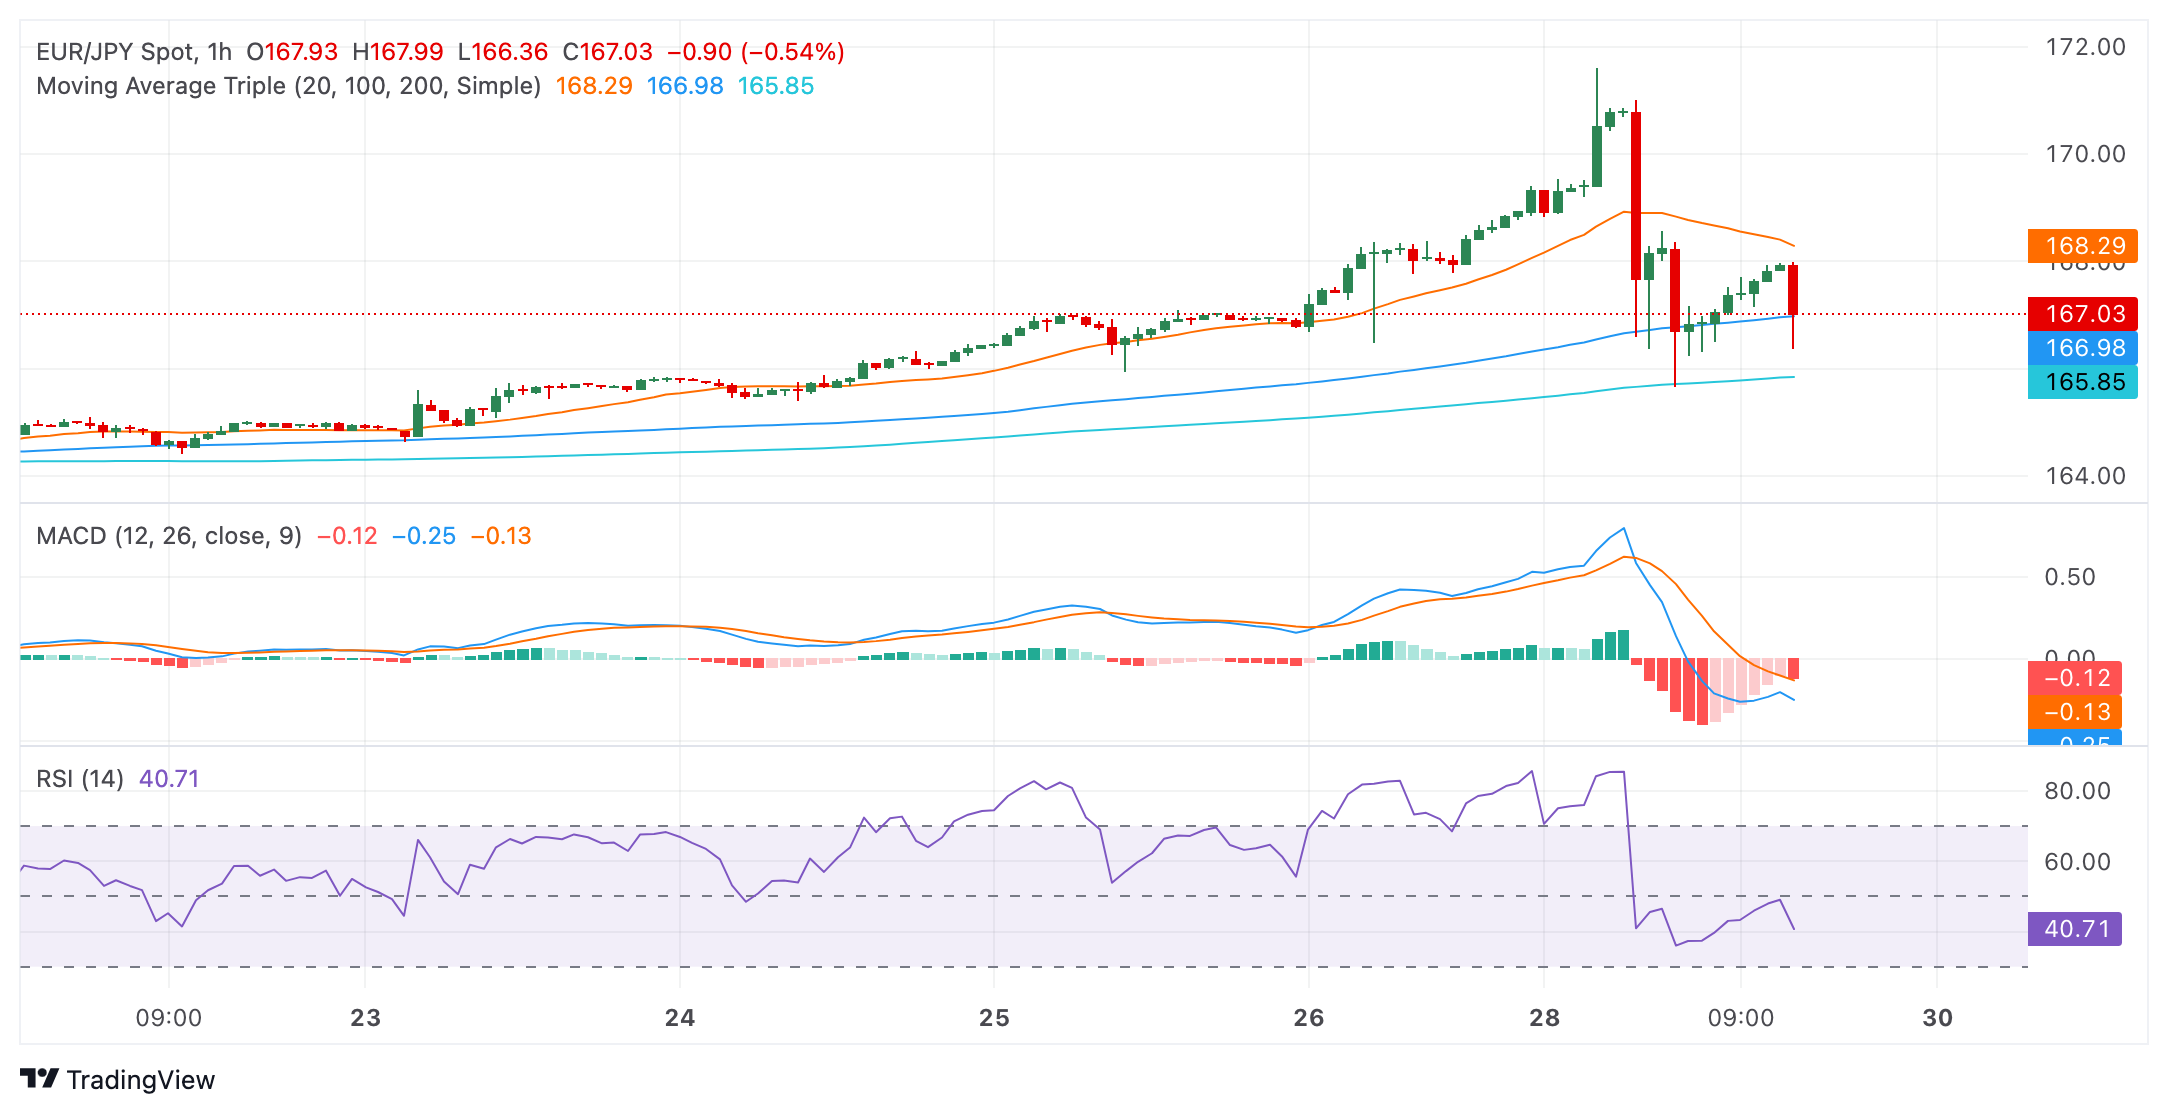
Broadening the perspective, the EUR/JPY pair is positioned above the 20-day Simple Moving Average (SMA), having just bounced back strongly after meeting resistance at the crucial 165.50 level. This event furnishes a positive impression of the short-term trend. Additionally, the pair's placement above the 100 and 200-day SMA suggests an overall bullish long-term outlook. However, buyers shouldn’t call it a victory as bears are still around the corner.
The Greenback started the week on the back foot in a week where interest rate cut bets by the Fed would remain in centre stage amidst the FOMC event and the release of April’s Non-farm Payrolls.
Here is what you need to know on Tuesday, April 30:
A negative start to the week saw the Greenback give away Friday’s gains after the presumed intervention by the Japanese MoF to support the yen after it weakened to multi-decade lows past 160.00 vs. the US Dollar. On April 30, the Employment Cost Index is due, seconded by the FHFA’s House Price Index and the Conference Board’s Consumer Confidence gauge.
EUR/USD rapidly left behind Friday’s pullback and regained further upside traction, helped by the renewed downside pressure in the Greenback. Retail Sales, the publication of the labour market report and flash Q1 GDP Growth Rate in Germany are due on April 30 seconded by flash Inflation Rate and the preliminary Q1 GDP Growth Rate in the broader euro bloc.
GBP/USD rose to three-week highs and flirted with the key 200-day SMA in the 1.2550-1.2560 band. Mortgage Approvals and Mortgage Lending are expected across the pond on April 30.
USD/JPY dropped sharply after hitting new highs past 160.00, all against the backdrop of suspected FX intervention. On April 30, the Unemployment Rate is due in the Japanese docket ahead of Industrial Production, Retail Sales, and Housing Starts.
AUD/USD advanced further and reached new three-week highs close to the 0.6600 region. In Australia, Housing Credit and flash Retail Sales readings are due on April 30.
WTI prices dropped to two-day lows near the $82.00 mark per barrel on the back of dwindling geopolitical fears and the Fed’s tighter-for-longer narrative.
Prices of gold advanced for the third session in a row and poked with the $2,350 mark per troy ounce in response to the weaker Dollar and sticky US inflation. Silver extended further its consolidative mood, always supported by the $27.00 region.
- Mexican Peso gains over 0.7%, capitalizing on US Dollar pullback triggered by Japanese intervention in Forex markets.
- Mexico's economic agenda is light today, but pivotal releases like GDP figures and Banxico's forex reserves are due later in the week.
- USD/MXN traders’ focus shifts to Wednesday’s Fed monetary policy decision.
The Mexican Peso capitalizes on a softer US Dollar and registers more than 0.7% gains following Japanese authorities' intervention in the forex market. Consequently, the Greenback is the laggard during the session ahead of a busy economic docket in the United States (US), with traders focused on the Federal Reserve’s (Fed) monetary policy meeting on Wednesday. The USD/MXN trades at 17.00 after hitting a daily high of 17.24.
Mexico’s economic docket will remain absent during the day, but on Tuesday the release of Gross Domestic Product (GDP) figures could likely trigger some activity in the USD/MXN pair. On May 2, the Bank of Mexico (Banxico) will reveal Foreign Exchange Reserves, followed by Business Confidence, April’s S&P Global Manufacturing PMI, and Gross Fixed Investment on May 3.
Across the border, Wall Street registers gains, portraying a risk-on mood among investors, thus lending a lifeline to the Mexican Peso. This week, the US economic docket would be busy, though the most significant events will be the releases of the ISM Manufacturing PMI and the Fed’s monetary policy decision on May 1, followed by the Nonfarm Payroll figures on Friday and the ISM Services PMI.
Daily digest market movers: Mexican Peso climbs on upbeat mood ahead of Fed decision
- Last week, Banxico Governor Victoria Rodriguez Ceja said that service inflation is not slowing as expected, Peso’s strength has helped to temper inflationary pressure and lower imported goods. Ceja emphasized that Banxico would remain data-dependent.
- Last week Mexico’s labor market figures were more solid than expected, portraying a strong labor market. Meanwhile, the Balance of Trade witnessed a surplus of $2.098 billion in March, up from $-0.585B in the same month of the previous year.
- Furthermore, the latest inflation reports also supported the Mexican currency. Core inflation edged lower, while headline inflation is up from 4.48% to 4.63%. This would deter the Bank of Mexico (Banxico) from easing policy at the May meeting.
- Citibanamex Survey showed that most analysts expect Banxico to hold rates unchanged at the May meeting. The median foresees a rate cut in June, while they estimate the main reference rate to end at 10.00%, up from 9.63% previously.
- Although the USD/MXN is trending lower, it remains capped by the latest US inflation figures. The March US Core Personal Consumption Expenditure Price Index (PCE) expanded as expected by 0.3% MoM and was unchanged when compared to February’s number. Annually-based inflation increased by 2.8%, unchanged from February but exceeding estimates.
- Federal Reserve is expected to keep rates unchanged at May 1 meeting, though traders will be eyeing Fed Chairman Jerome Powell’s press conference. A hawkish tilt could trigger a jump in favor of the Greenback; otherwise, the USD/MXN could resume its downtrend.
- Data from the Chicago Board of Trade (CBOT) suggests that traders expect the fed funds rate to finish 2024 at 5.035%, down from 5.050% last Friday.
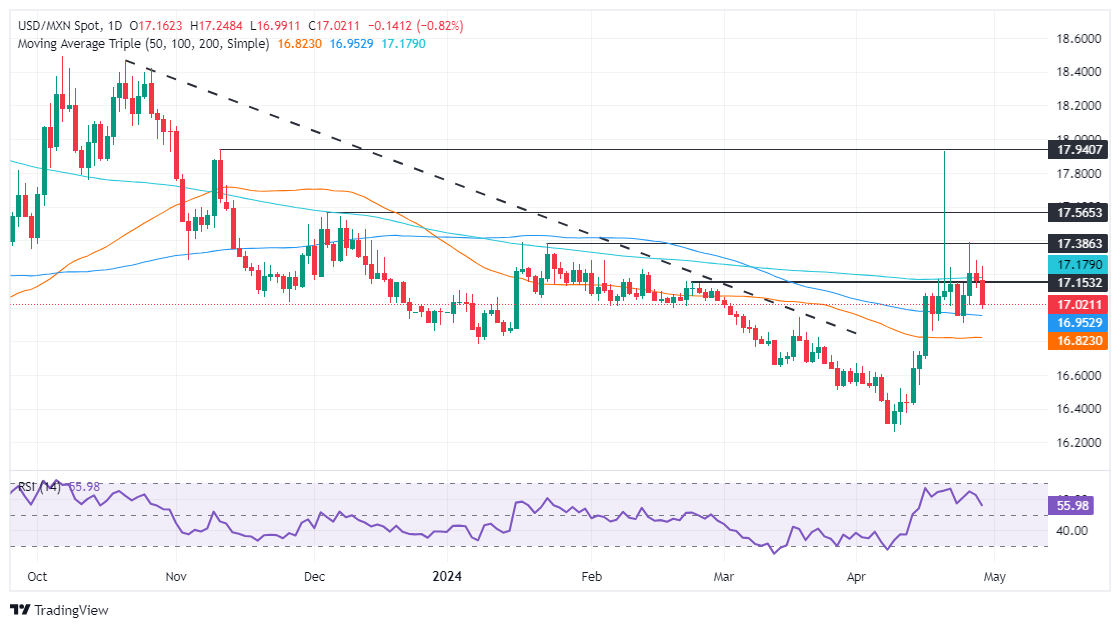
MXN technical analysis: Mexican Peso appreciates as USD/MXN tumbles below 200-day SMA
The Mexican Peso extended its recovery to two days, reaching a two-day high of 16.98, further below the 200-day Simple Moving Average (SMA) at 17.17. Further losses are seen if USD/MXN buyers fail to hold the exchange rate above 17.00, as key support levels would emerge at the 50-day SMA at 16.81 before challenging last year’s low of 16.62.
Conversely, the 200-day (SMA) would be the first resistance. Once cleared, that would extend the uptrend. The next resistance would be the January 23 swing high of 17.38, followed by the year-to-date (YTD) high of 17.92, ahead of 18.00.
Mexican Peso FAQs
The Mexican Peso (MXN) is the most traded currency among its Latin American peers. Its value is broadly determined by the performance of the Mexican economy, the country’s central bank’s policy, the amount of foreign investment in the country and even the levels of remittances sent by Mexicans who live abroad, particularly in the United States. Geopolitical trends can also move MXN: for example, the process of nearshoring – or the decision by some firms to relocate manufacturing capacity and supply chains closer to their home countries – is also seen as a catalyst for the Mexican currency as the country is considered a key manufacturing hub in the American continent. Another catalyst for MXN is Oil prices as Mexico is a key exporter of the commodity.
The main objective of Mexico’s central bank, also known as Banxico, is to maintain inflation at low and stable levels (at or close to its target of 3%, the midpoint in a tolerance band of between 2% and 4%). To this end, the bank sets an appropriate level of interest rates. When inflation is too high, Banxico will attempt to tame it by raising interest rates, making it more expensive for households and businesses to borrow money, thus cooling demand and the overall economy. Higher interest rates are generally positive for the Mexican Peso (MXN) as they lead to higher yields, making the country a more attractive place for investors. On the contrary, lower interest rates tend to weaken MXN.
Macroeconomic data releases are key to assess the state of the economy and can have an impact on the Mexican Peso (MXN) valuation. A strong Mexican economy, based on high economic growth, low unemployment and high confidence is good for MXN. Not only does it attract more foreign investment but it may encourage the Bank of Mexico (Banxico) to increase interest rates, particularly if this strength comes together with elevated inflation. However, if economic data is weak, MXN is likely to depreciate.
As an emerging-market currency, the Mexican Peso (MXN) tends to strive during risk-on periods, or when investors perceive that broader market risks are low and thus are eager to engage with investments that carry a higher risk. Conversely, MXN tends to weaken at times of market turbulence or economic uncertainty as investors tend to sell higher-risk assets and flee to the more-stable safe havens.
- DXY Index is noting losses at the start of the week, declining toward 105.70.
- Resilient US economy, hawkish Fed are likely to keep pressure on yields, which may limit losses.
- Markets foresee a hold on interest rates for Wednesday’s Fed meeting.
The US Dollar Index (DXY) is declining on Monday and fell to 105.70. The Bank of Japan (BoJ)'s recent intervention led to a slight drop in the USD value. However, the Greenback's rally is expected to continue, thanks to monetary policy divergence favoring the US Dollar and the anticipation of a hawkish hold from the forthcoming Federal Reserve (Fed) meeting.
The US economy remains resilient, and sticky inflation may keep the USD’s rally alive. The Fed is maintaining a hawkish stance, resisting market pressure for easing, and a June rate cut seems unlikely. Wednesday’s messaging will be key.
Daily digest market movers: DXY starts week with left foot, eyes on Fed’s decision
Fed is anticipated to adopt a hawkish approach, underscoring hefty growth, sustained inflation in US economy.
Unchanging interest rates together with robust US data may maintain upward trajectory of US Treasury bond yields.
Market expectations for subsequent Fed meetings are seen as a 10% likelihood of a rate cut in June, 35% in July, and less than 80% in September.
US Treasury bond yields are down, signifying a disfavorable environment for the US Dollar. Specifically, the 2-year yield stands at 4.97%, the 5-year yield at 4.65%, and the 10-year yield at 4.63%.
DXY technical analysis: DXY bulls struggle under pressure, yet retain control
The indicators on the daily chart reflect a mixed outlook for the DXY. The Relative Strength Index (RSI), despite having a negative slope, maintains a stance in positive territory, indicating resilience among buyers. However, this bullish momentum appears somewhat challenged as evidenced by the freshly formed red bar in the Moving Average Convergence Divergence (MACD), a bearing that typically presages a potential shift toward bearish territory.
Also, the DXY stays comfortably above the 20, 100 and 200-day Simple Moving Averages (SMAs), an indication that buyers still have the upper hand in the intermediate and longer terms. Despite the potential for short-term selling pressure, the narrative of the bulls continues to be supported by this SMA structure.
US Dollar FAQs
The US Dollar (USD) is the official currency of the United States of America, and the ‘de facto’ currency of a significant number of other countries where it is found in circulation alongside local notes. It is the most heavily traded currency in the world, accounting for over 88% of all global foreign exchange turnover, or an average of $6.6 trillion in transactions per day, according to data from 2022. Following the second world war, the USD took over from the British Pound as the world’s reserve currency. For most of its history, the US Dollar was backed by Gold, until the Bretton Woods Agreement in 1971 when the Gold Standard went away.
The most important single factor impacting on the value of the US Dollar is monetary policy, which is shaped by the Federal Reserve (Fed). The Fed has two mandates: to achieve price stability (control inflation) and foster full employment. Its primary tool to achieve these two goals is by adjusting interest rates. When prices are rising too quickly and inflation is above the Fed’s 2% target, the Fed will raise rates, which helps the USD value. When inflation falls below 2% or the Unemployment Rate is too high, the Fed may lower interest rates, which weighs on the Greenback.
In extreme situations, the Federal Reserve can also print more Dollars and enact quantitative easing (QE). QE is the process by which the Fed substantially increases the flow of credit in a stuck financial system. It is a non-standard policy measure used when credit has dried up because banks will not lend to each other (out of the fear of counterparty default). It is a last resort when simply lowering interest rates is unlikely to achieve the necessary result. It was the Fed’s weapon of choice to combat the credit crunch that occurred during the Great Financial Crisis in 2008. It involves the Fed printing more Dollars and using them to buy US government bonds predominantly from financial institutions. QE usually leads to a weaker US Dollar.
Quantitative tightening (QT) is the reverse process whereby the Federal Reserve stops buying bonds from financial institutions and does not reinvest the principal from the bonds it holds maturing in new purchases. It is usually positive for the US Dollar.
- Canadian Dollar eases against broader market.
- Canada absent from economic calendar on Monday.
- Canadian GDP slated for Tuesday ahead of key US labor figures.
The Canadian Dollar (CAD) is broadly softer on Monday, slipping back against most of its major currency peers and holding flat against the US Dollar (USD) in tepid trading. The economic calendar is thin to kick off the trading week as the US Federal Reserve (Fed) and another US Nonfarm Payrolls (NFP) on Friday loom ahead later in the week.
Canada's latest monthly Gross Domestic Product (GDP) update is on Tuesday, but broader markets will be largely focused on the Fed’s upcoming rate call on Wednesday. US ADP Employment Change is also due Wednesday, and will serve as a preview (albeit a volatile one) to Friday’s US NFP jobs print.
Daily digest market movers: Thin data in US trading session leaves markets looking ahead
- Markets remain thin in the US market session, Canadian Dollar flattens against USD and Euro (EUR).
- Suspected intervention in global markets by the Bank of Japan (BoJ) on behalf of Japanese Yen (JPY) roiled Pacific markets, leaving a volatility vacuum in its wake.
- Tuesday’s Canadian MoM GDP is expected to decline to 0.3% in February after January’s 12-month high of 0.6%.
- Bank of Canada (BoC) Governor Tiff Macklem will be testifying alongside Senior Deputy Governor Carolyn Rogers before the Canadian government’s Standing Senate Committee on Banking, Commerce, and the Economy on Wednesday.
- BoC’s reporting is widely expected to get drowned out by markets focusing on Fed’s latest rate call, also scheduled on Wednesday.
- According to the CME’s FedWatch Tool, rate markets currently see around 58% odds of first rate cut in September.
Canadian Dollar price today
The table below shows the percentage change of Canadian Dollar (CAD) against listed major currencies today. Canadian Dollar was the strongest against the US Dollar.
| USD | EUR | GBP | CAD | AUD | JPY | NZD | CHF | |
| USD | -0.18% | -0.46% | -0.05% | -0.44% | -1.62% | -0.54% | -0.45% | |
| EUR | 0.18% | -0.28% | 0.13% | -0.24% | -1.40% | -0.35% | -0.26% | |
| GBP | 0.47% | 0.27% | 0.41% | 0.03% | -1.11% | -0.09% | 0.03% | |
| CAD | 0.04% | -0.15% | -0.41% | -0.38% | -1.53% | -0.50% | -0.42% | |
| AUD | 0.42% | 0.24% | -0.04% | 0.40% | -1.15% | -0.12% | -0.02% | |
| JPY | 1.55% | 1.35% | 1.08% | 1.53% | 1.10% | 0.99% | 1.13% | |
| NZD | 0.53% | 0.35% | 0.08% | 0.50% | 0.12% | -1.03% | 0.10% | |
| CHF | 0.46% | 0.28% | -0.01% | 0.40% | 0.03% | -1.14% | -0.09% |
The heat map shows percentage changes of major currencies against each other. The base currency is picked from the left column, while the quote currency is picked from the top row. For example, if you pick the Euro from the left column and move along the horizontal line to the Japanese Yen, the percentage change displayed in the box will represent EUR (base)/JPY (quote).
Technical analysis: Canadian Dollar flattens as markets look elsewhere
During Monday's US market session, the Canadian Dollar (CAD) treads water, trading close to a tenth of a percent against both the US Dollar and the Euro (EUR). The CAD is down around half of a percent against the Antipodeans and in the red over a full 1.5% against the JPY.
USD/CAD continues to churn into the 1.3650 technical level. The pair continues to slip back from last week’s peak bids near 1.3850, but intraday bids still stick on the high side of a near-term supply zone between 1.3600 and 1.3550.
Despite a near-term pullback, the USD/CAD remains on the bullish side of long-term technicals. The pair still holds north of the 200-day Exponential Moving Average (EMA) at 1.3528, and the US Dollar is still up around 3% against the Canadian Dollar in 2024.
USD/CAD hourly chart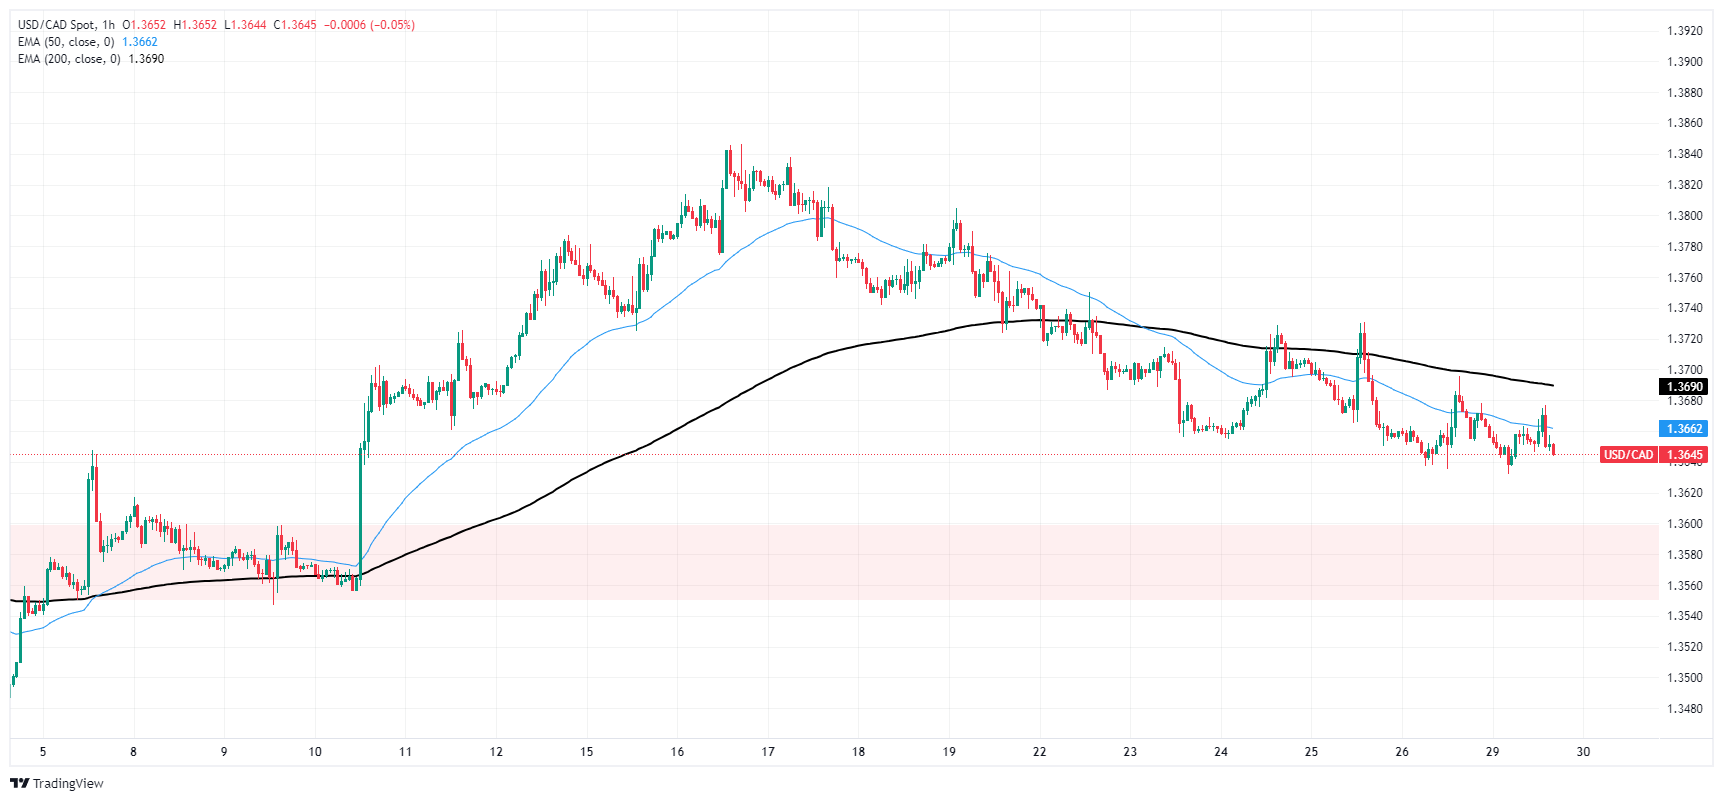
USD/CAD daily chart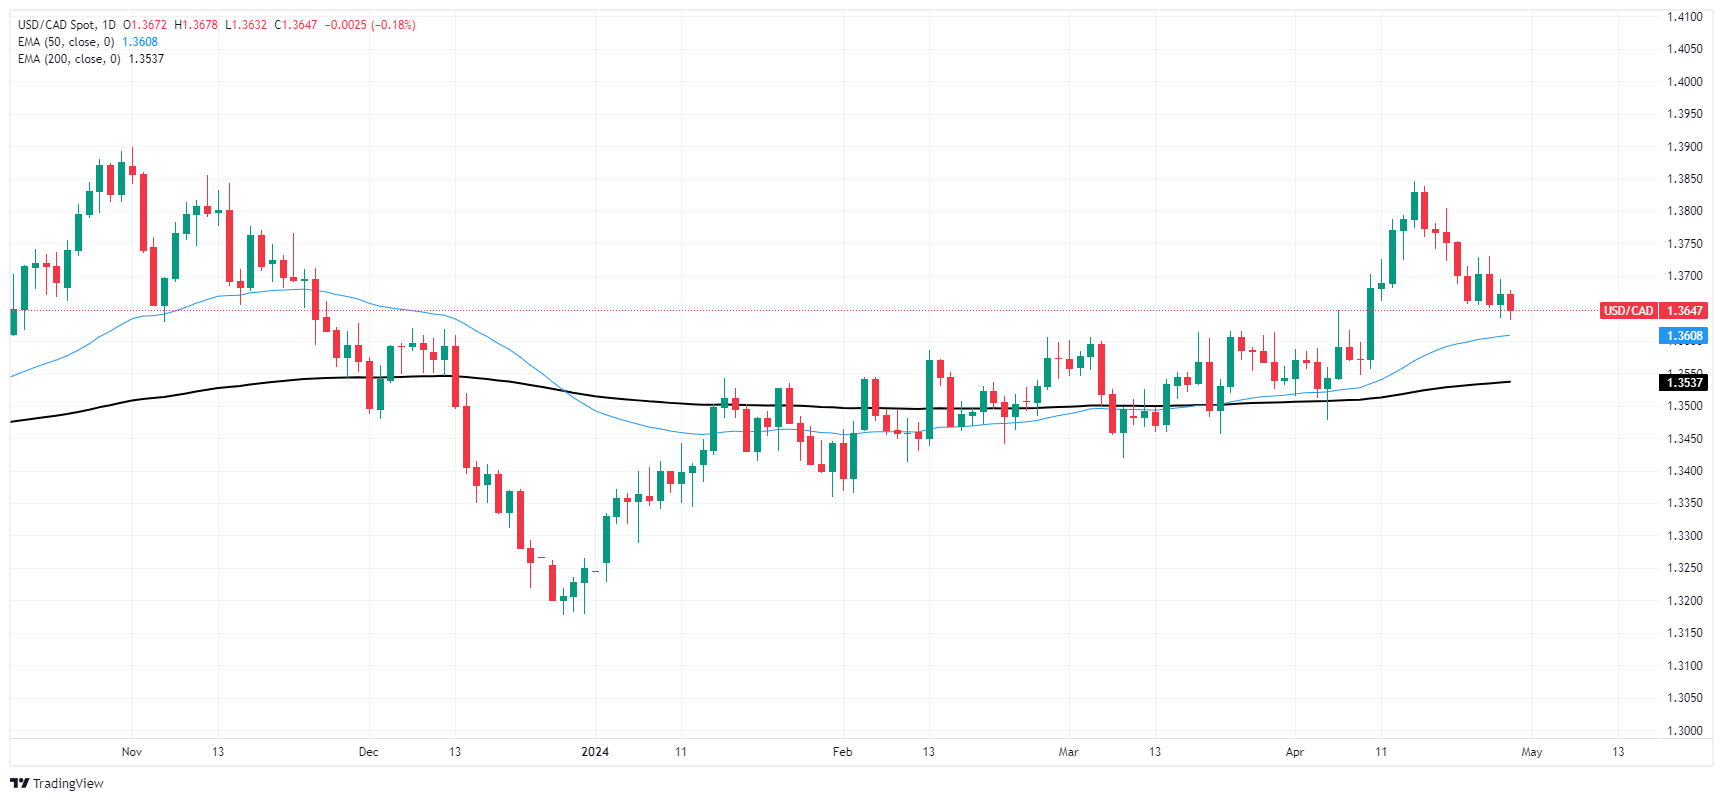
Canadian Dollar FAQs
The key factors driving the Canadian Dollar (CAD) are the level of interest rates set by the Bank of Canada (BoC), the price of Oil, Canada’s largest export, the health of its economy, inflation and the Trade Balance, which is the difference between the value of Canada’s exports versus its imports. Other factors include market sentiment – whether investors are taking on more risky assets (risk-on) or seeking safe-havens (risk-off) – with risk-on being CAD-positive. As its largest trading partner, the health of the US economy is also a key factor influencing the Canadian Dollar.
The Bank of Canada (BoC) has a significant influence on the Canadian Dollar by setting the level of interest rates that banks can lend to one another. This influences the level of interest rates for everyone. The main goal of the BoC is to maintain inflation at 1-3% by adjusting interest rates up or down. Relatively higher interest rates tend to be positive for the CAD. The Bank of Canada can also use quantitative easing and tightening to influence credit conditions, with the former CAD-negative and the latter CAD-positive.
The price of Oil is a key factor impacting the value of the Canadian Dollar. Petroleum is Canada’s biggest export, so Oil price tends to have an immediate impact on the CAD value. Generally, if Oil price rises CAD also goes up, as aggregate demand for the currency increases. The opposite is the case if the price of Oil falls. Higher Oil prices also tend to result in a greater likelihood of a positive Trade Balance, which is also supportive of the CAD.
While inflation had always traditionally been thought of as a negative factor for a currency since it lowers the value of money, the opposite has actually been the case in modern times with the relaxation of cross-border capital controls. Higher inflation tends to lead central banks to put up interest rates which attracts more capital inflows from global investors seeking a lucrative place to keep their money. This increases demand for the local currency, which in Canada’s case is the Canadian Dollar.
Macroeconomic data releases gauge the health of the economy and can have an impact on the Canadian Dollar. Indicators such as GDP, Manufacturing and Services PMIs, employment, and consumer sentiment surveys can all influence the direction of the CAD. A strong economy is good for the Canadian Dollar. Not only does it attract more foreign investment but it may encourage the Bank of Canada to put up interest rates, leading to a stronger currency. If economic data is weak, however, the CAD is likely to fall.
- EUR/GBP has crashed back inside its multi-month range.
- It is falling to the range floor where it is likely to meet strong support.
- A break lower would activate downside targets based on the height of the range.
EUR/GBP is trading back inside its multi-month range after forming five down days in a row. The range stretches from roughly a ceiling level at 0.8600 and a floor at 0.8530.
EUR/GBP Daily Chart
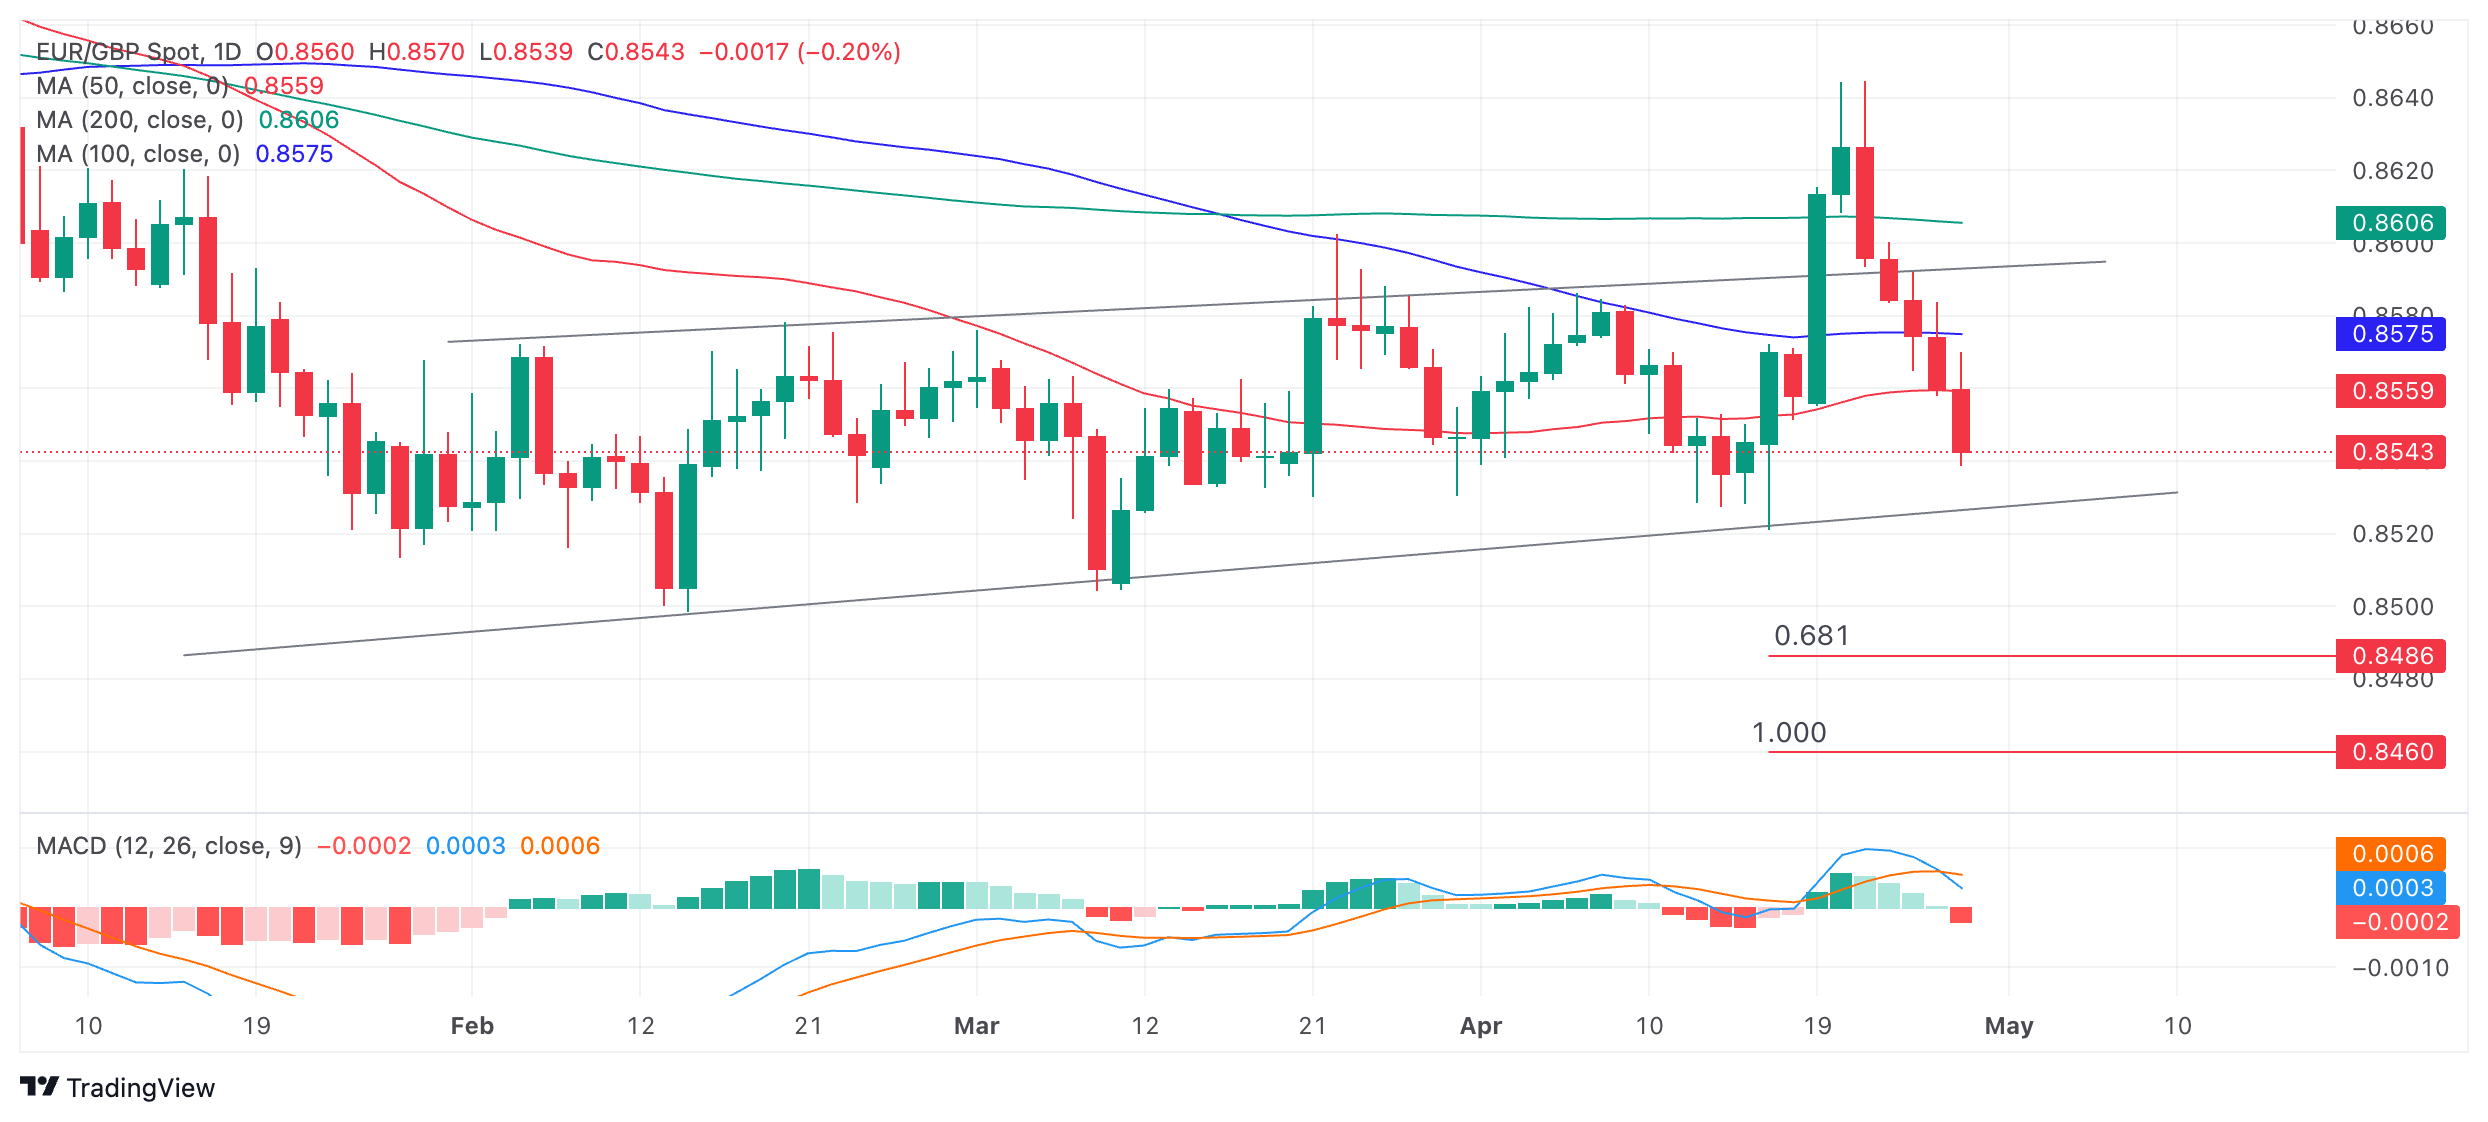
EUR/GBP has fallen to 0.8541, which is quite close to the range floor at 0.8530. At the level of the range floor it is likely to encounter relatively tough support, and will probably bounce, at the very least temporarily.
A decisive break below the range low would open the way for more downside to the next target lower at 0.8486. This is the 0.681 Fibonacci ratio of the height of the range extrapolated down from the channel’s base, the method used by technical analysts to estimate range breakouts. Further weakness could even see price match the target at 0.8460.
EUR/GBP broke out of the top of its multi-month consolidation range on April 19 and rose up to a peak of 0.8645 before forming a Tweezer Top candlestick reversal pattern at the highs, reversing and tumbling back down. The Tweezer Top forms when two adjacent candlesticks peak, their wicks are of similar length, and end at the same or very similar levels.
The pair then declined rapidly, breaking back inside the range and is now on its way to the range lows.
EUR/GBP is in a sideways trend which is forecast to continue until a directional bias proves otherwise.
The Moving Average Convergence Divergence (MACD) indicator has just crossed below its signal line, giving a sell signal and indicating more downside. The signal is improved by the fact the pair is in a sideways trend and MACD is proven to be a more reliable indicator in non-trending markets.
- GBP/USD rises, rebounding from 1.2474 amid rumors impacting the US Dollar.
- Currently, GBP/USD tests the 200-day moving average at 1.2555, showing a neutral to slight bearish outlook.
- Breaking above the 200-DMA may target 1.2600, with potential further gains to 1.2621 and 1.2645.
- Failure to exceed the 200-DMA could prompt a retest of the 1.2500 support.
The Pound Sterling advanced sharply against the US Dollar in early trading during Monday’s North American session after hitting a daily low of 1.2474. Rumors of an intervention by Japanese authorities to propel the Japanese Yen (JPY) weighed on the Greenback, which is tumbling against most G8 FX currencies. Therefore, the GBP/USD trades at 1.2534, gaining 0.36%.
GBP/USD Price Analysis: Technical outlook
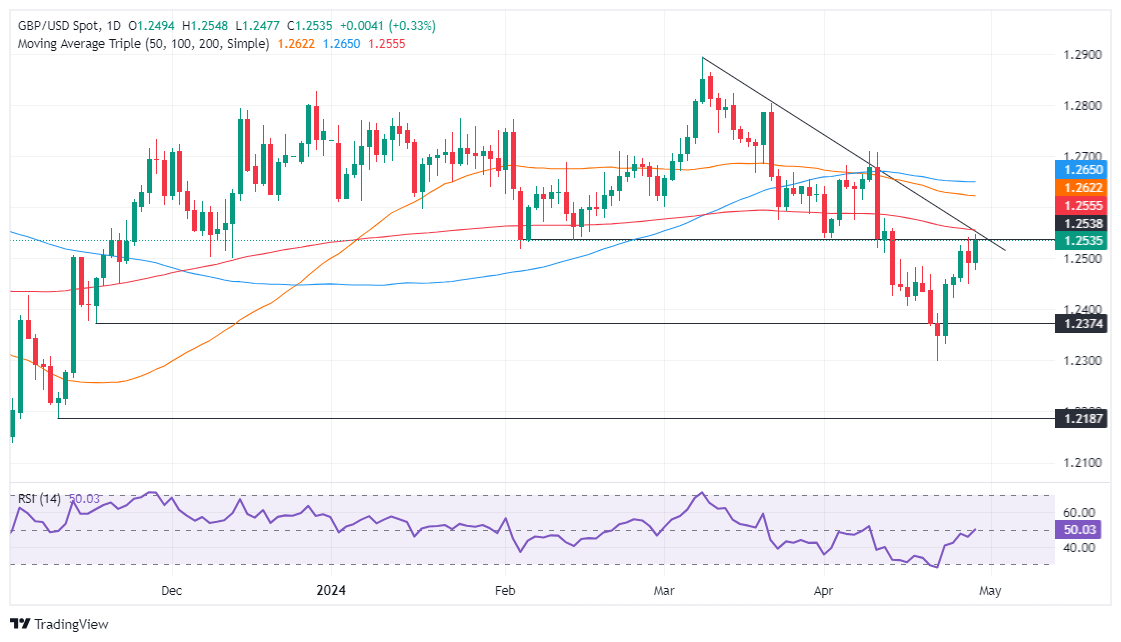
From a technical standpoint, the GBP/USD is neutral-biased, though tilted to the downside. It remains below the key 200-day moving average (DMA) at 1.2555, which delineates an asset's bullishness or bearishness. However, buyers are gathering momentum as the Relative Strength Index (RSI) punches above the 50-midline level.
With that context, if buyers achieve a daily close above the 200-DMA, that will expose the 1.2600 figure. Further upside is seen past the 50-DMA at 1.2621, followed by the 100-DMA at 1.2645. Once those levels are surpassed, the 1.2700 mark is up next.
Conversely, failure at the 200-DMA adds pressure on Sterling, which could drag the GBP/USD exchange rate beneath the 1.2500 mark. A breach of the latter will expose the April 24 low at 1.2422, followed by the April 22 low at 1.2299.
GBP/USD Price Action – Daily Chart
Analysts at TD Securities share a brief preview of this week's key macroeconomic events from the US.
Looking for payrolls to lose momentum
The FOMC meeting will grab the headlines this week amid a very busy data calendar for the US. Chair Powell will likely sound more cautious than usual, with a hawkish bent, regarding the policy outlook. "Higher for longer" will likely remain the name of the game for now. We also expect the Fed to announce a preliminary plan to taper QT starting in June.
We also look for payrolls to lose momentum at the start of the second quarter following Q1's notable showing, while ECI growth likely picked up modestly. The QRA, the March JOLTS report and the ISM surveys for April will also garner attention this week.
- USD/JPY finds cushion near 155.00 after plummeting from 160.00 on probable Japan’s intervention.
- Investors expect Japan’s intervention would only provide provisional support to the Japanese Yen.
- The US Dollar finds support on expectations that the Fed will support higher interest rates for a longer period.
The USD/JPY finds provisional support near 155.00 in Monday’s early American session. The asset registered a vertical sell-off from historic highs of 160.00, which market participants recognised as an outcome of suspected intervention by Japan’s authorities.
However, Japan's top currency diplomat, Masato Kanda, didn't confirm any FX intervention in his speech in the European session. Kanda said, "Speculative, rapid and abnormal FX moves have had a bad impact on the economy, so are unacceptable.". Kanda refrained from providing an appropriate level when asked about what could be the probable zone where the administration could intervene if authorities have not stepped yet.
Prospects of Japan’s FX intervention remained high as the Japanese Yen has weakened significantly. The Japanese Yen remained on the back foot despite the Bank of Japan (BoJ) pivoting to monetary policy tightening after maintaining a super-easy monetary policy stance for more than a decade. Though the BoJ has moved its interest rates to a positive trajectory, investors remain worried about the limited scope of policy tightening due to uncertainty over the wage-growth spiral.
The BoJ is moderately moving toward policy normalization, but firm expectations of prolonged policy divergence between the BoJ and the Federal Reserve (Fed) are making it difficult for the Japanese Yen to establish a firm footing.
Meanwhile, the US Dollar rebounds amid uncertainty ahead of the Fed’s interest rate decision, which will be announced on Wednesday. The US Dollar Index (DXY), which tracks the US Dollar’s value against six major currencies, recovers after discovering buying interest near 105.45. The Fed is expected to maintain the status quo for the sixth straight time and will maintain the argument of keeping interest rates restrictive until it gets confidence that inflation will sustainably return to the desired rate of 2%.
- AUD/USD is in a short-term uptrend that is extending.
- The pair is pulling back within a rising channel.
- It will probably find support at the lower channel line and then resume its uptrend.
AUD/USD extends its short-term uptrend as it trades in the mid-0.6550s on Monday.
AUD/USD 4-hour Chartç
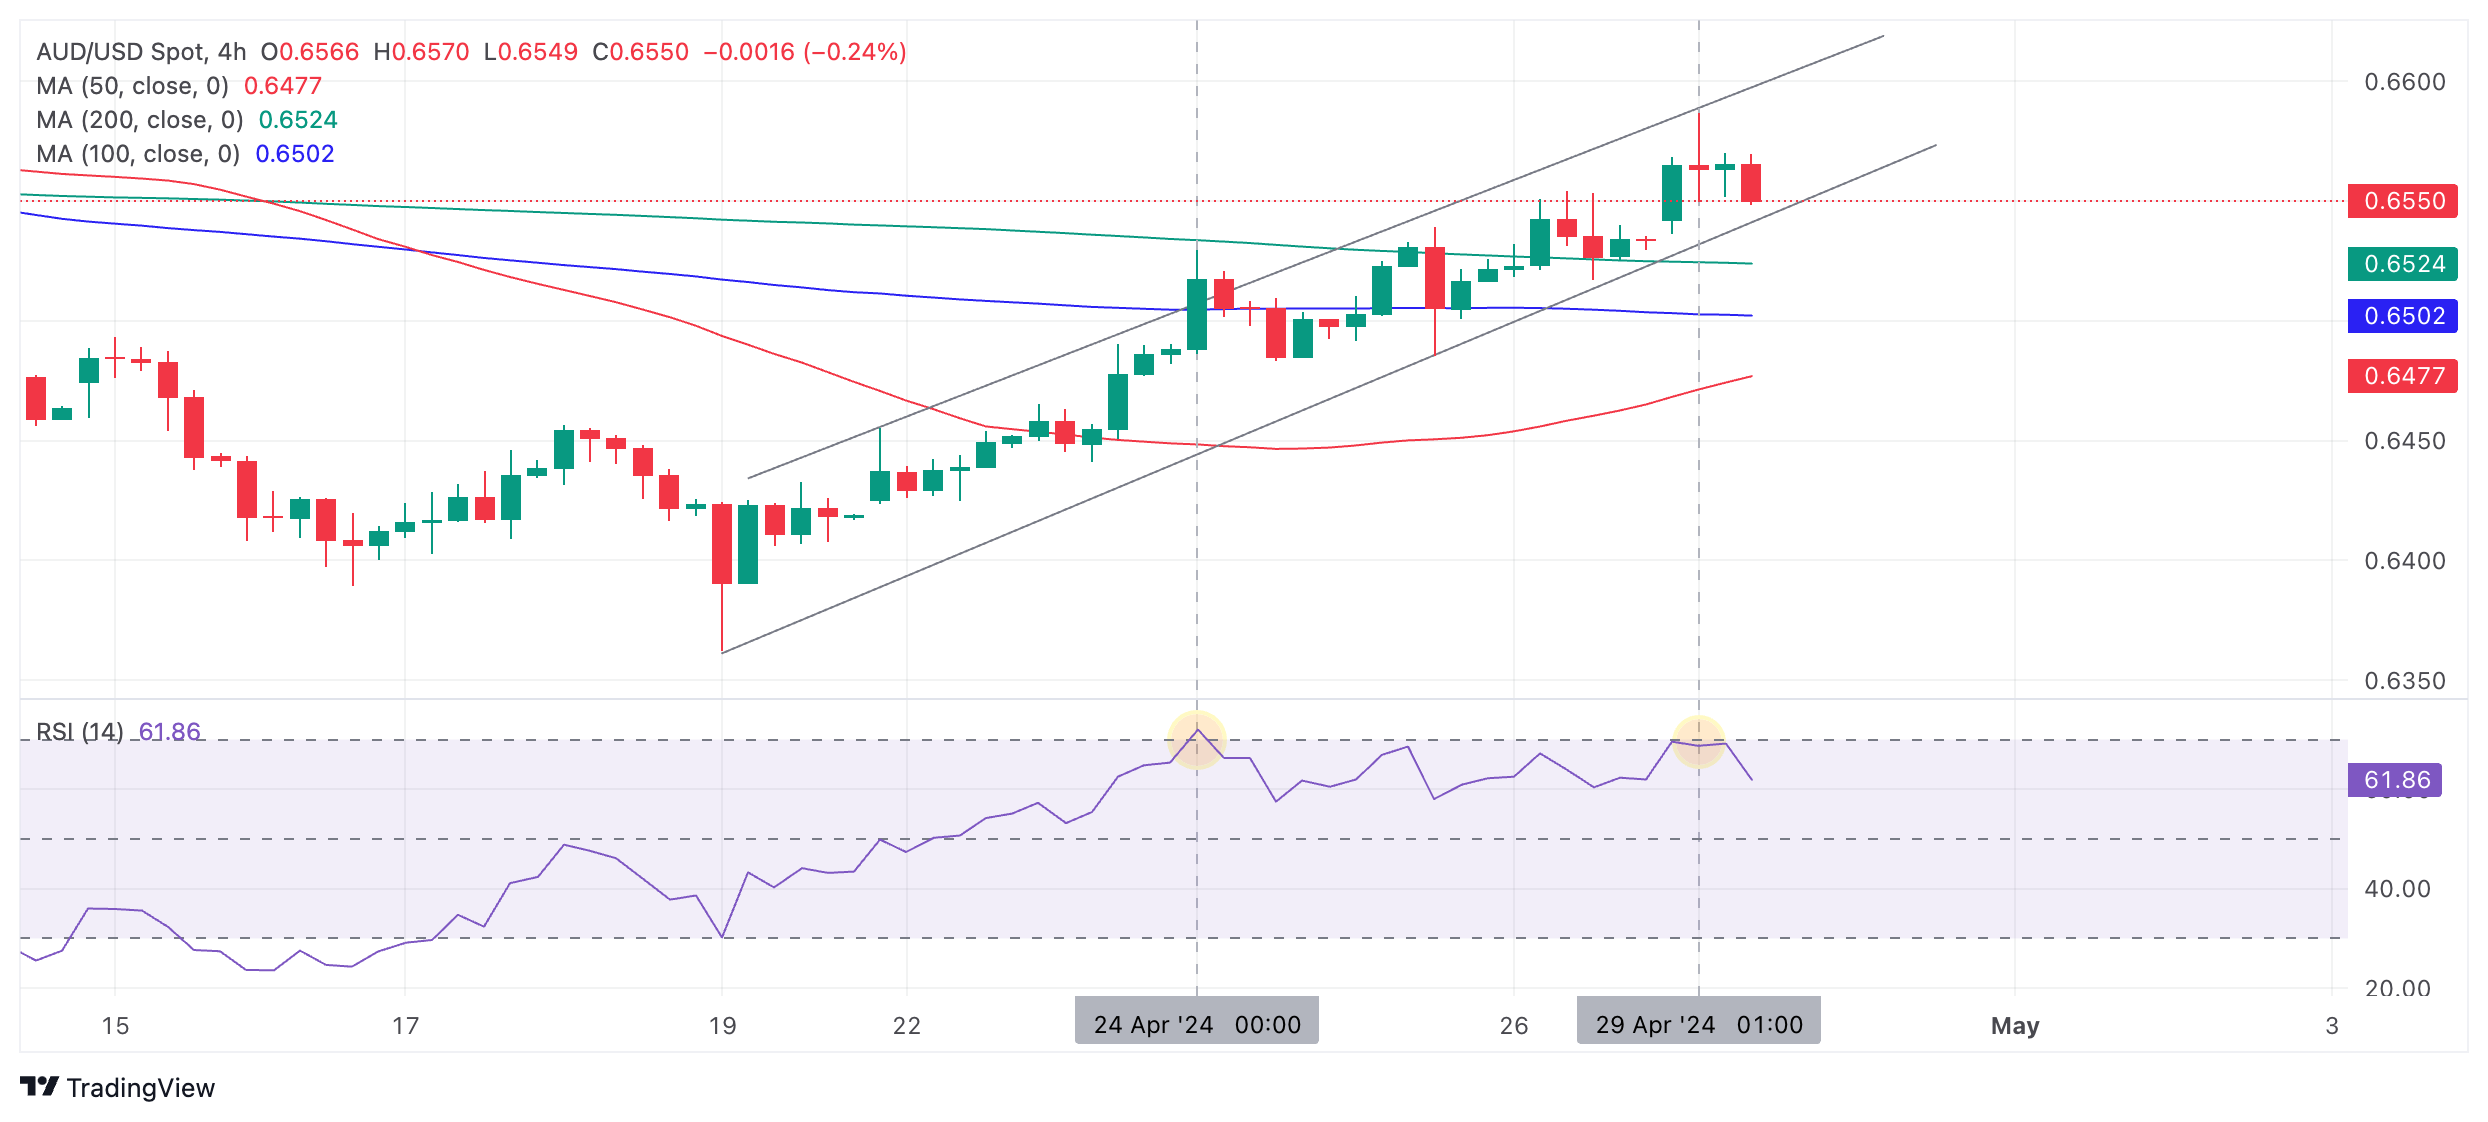
The pair has formed a neat channel higher on the 4-hour chart used to assess the short-term trend.
AUD/USD is currently pulling back within the channel but will probably find support at the lower channel line at around 0.6540, and – given “the trend is your friend” as they say – resume its bull trend thereafter.
The next target in AUD/USD’s march higher is probably the upper channel line at around 0.6600.
The Relative Strength Index (RSI) momentum indicator is not yet overbought, signaling the possibility more buyers may yet enter the market and push the pair higher. The RSI is, however, currently showing mild bearish divergence when compared with the peak of April 24 when the RSI poked into overbought (cricled). This is a slightly bearish sign.
AUD/USD has broken above all three of the major moving averages – the 50-4hr, 100-4hr and 200-4hr Simple Moving Averages (SMA) – a bullish indication in the near-term.
It would require a decisive break below the lower channel line for the price to signal a bearish breakout from the channel and the start of a deeper decline.
A decisive break would be one in which AUD/USD formed a long red bearish candlestick on the 4-hr chart that pierced below the channel line and closed near its low, or three consecutive red candles in a row that also broke below the channel line.
- USD/CAD trades above 1.3640 as the US Dollar rebounds ahead of the Fed’s policy decision.
- The Fed is expected to emphasize keeping interest rates restrictive for a longer period.
- The Canadian economy is forecasted to have expanded by 0.3% in February.
The USD/CAD pair holds auction above the immediate support of 1.3460 in Monday’s early American session. The Loonie asset finds support as the US Dollar Index (DXY) rebounds after discovering buying interest near the previous week’s low of around 105.46.
The USD Index finds support as investors shift focus to the Federal Reserve’s (Fed) monetary policy decision, which will be announced on Wednesday. Financial market participants expect that the Fed will hold interest rates steady in the range of 5.25%-5.50% for the sixth time in a row.
As interest rates are expected to remain steady, investors will focus on the interest rate outlook. The Fed is expected to reiterate the need to maintain the current interest rate framework as it is for a longer period. The recent batch of consumer inflation showed that price pressures are stubbornly higher than expectations. The Fed would consider reducing interest rates only after policymakers get evidence that inflation will sustainably return to the desired rate of 2%.
Meanwhile, the market sentiment is bullish as investors have shrugged off risks of further escalation in Middle East tensions. The S&P 500 has opened on a bullish note. 10-year US Treasury yields have dropped to 4.64%.
On the Canadian Dollar front, investors await the monthly Gross Domestic Product (GDP) data for February, which will be published on Tuesday. Economists expect that the Canadian economy expanded by half the pace of 0.6% recorded in January. A slowdown in GDP growth will allow the Bank of Canada (BoC) to pivot to interest rate cuts sooner.
- EUR/JPY rises up to its highest ever recorded level of 171.60 before retreating.
- The pair falls over 1.0% after making its record high, possibly as a result of intervention by the Japanese authorities.
- Eurozone inflation data for Germany and Spain shows price stickiness, potentially providing support for the Euro.
EUR/JPY rose to a new all-time high of 171.60 early on Monday before collapsing and retreating over a percentage point, due to direct intervention by the Japanese Ministry of Finance (MOF) to prop up the Japanese Yen (JPY), it was rumored.
The EUR/JPY beat its previous record high of 169.97 set in 2008, in the early hours of Monday morning, however, it swiftly began to decline thereafter, reaching 165.64 by the time Europe was arriving to work at 07:00 GMT. Since then it has recovered a little, rising back above 167.00 on the back of firm inflation data from Germany and Spain.
The decline has been put down to rumors of a massive currency intervention by the Japanese authorities. It is possible the move came given the countless verbal warnings from the Japanese Minister of Finance Shun’ichi Suzuki over recent weeks, in which he repeated he was watching currency moves carefully and would intervene if necessary.
German and Spanish inflation data show signs of stickiness
In Europe, meanwhile, the release of the Harmonized Index of Consumer Prices (HICP) for April, the European Central Bank’s (ECB) preferred inflation gauge, in Germany and Spain, painted a picture of persistent inflation.
The data suggests interest rates may need to remain higher for longer in the Eurozone to bring down inflation. This in turn could provide support for the Euro (EUR) since higher interest rates attract greater foreign capital inflows.
The HICP for Germany rose by 2.4% in April year-over-year, which was slightly above the 2.3% expected, and 2.3% previous, data from the Federal Statistics Office of Germany showed.
On a monthly basis, German HICP rose 0.6% in April according to preliminary estimates – the same as forecast and previous.
In Spain, HICP rose 3.4% YoY in April compared to 3.3% in the previous month, and 0.6% on month, from 1.4% previously, according to data from INE.
- Annual CPI inflation in Germany held steady at 2.2% in April.
- EUR/USD trades in positive territory above 1.0700 after the data.
Inflation in Germany, as measured by the change in the Consumer price Index (CPI), remained unchanged at 2.2% on a yearly basis in April, Germany's Destatis reported on Monday. This reading came in below the market expectation of 2.3%. On a monthly basis, the CPI rose 0.5% following the 0.4% increase recorded in March.
The Harmonized Index of Consumer Prices (HICP), the European Central Bank's (ECB) preferred gauge of inflation, rose 0.6% on a monthly basis as forecast. The annual HICP increased 2.4% in the same period, up from 2.3% in March.
Market reaction
EUR/USD edged slightly higher with the immediate reaction to German inflation data and was last seen rising 0.27% on the day at 1.0720.
- Silver price is still probably forming a Bear Flag pattern on the 4-hour chart.
- The pattern indicates a probable continuation of the bearish trend to targets substantially lower.
- Support from a long-term support and resistance level at $25.80 is likely to provide a floor for any sell-off.
Silver (XAG/USD) price may have formed a Bear Flag pattern on the 4-hour chart with negative implications for the precious metal’s price going forward.
4-hour Chart
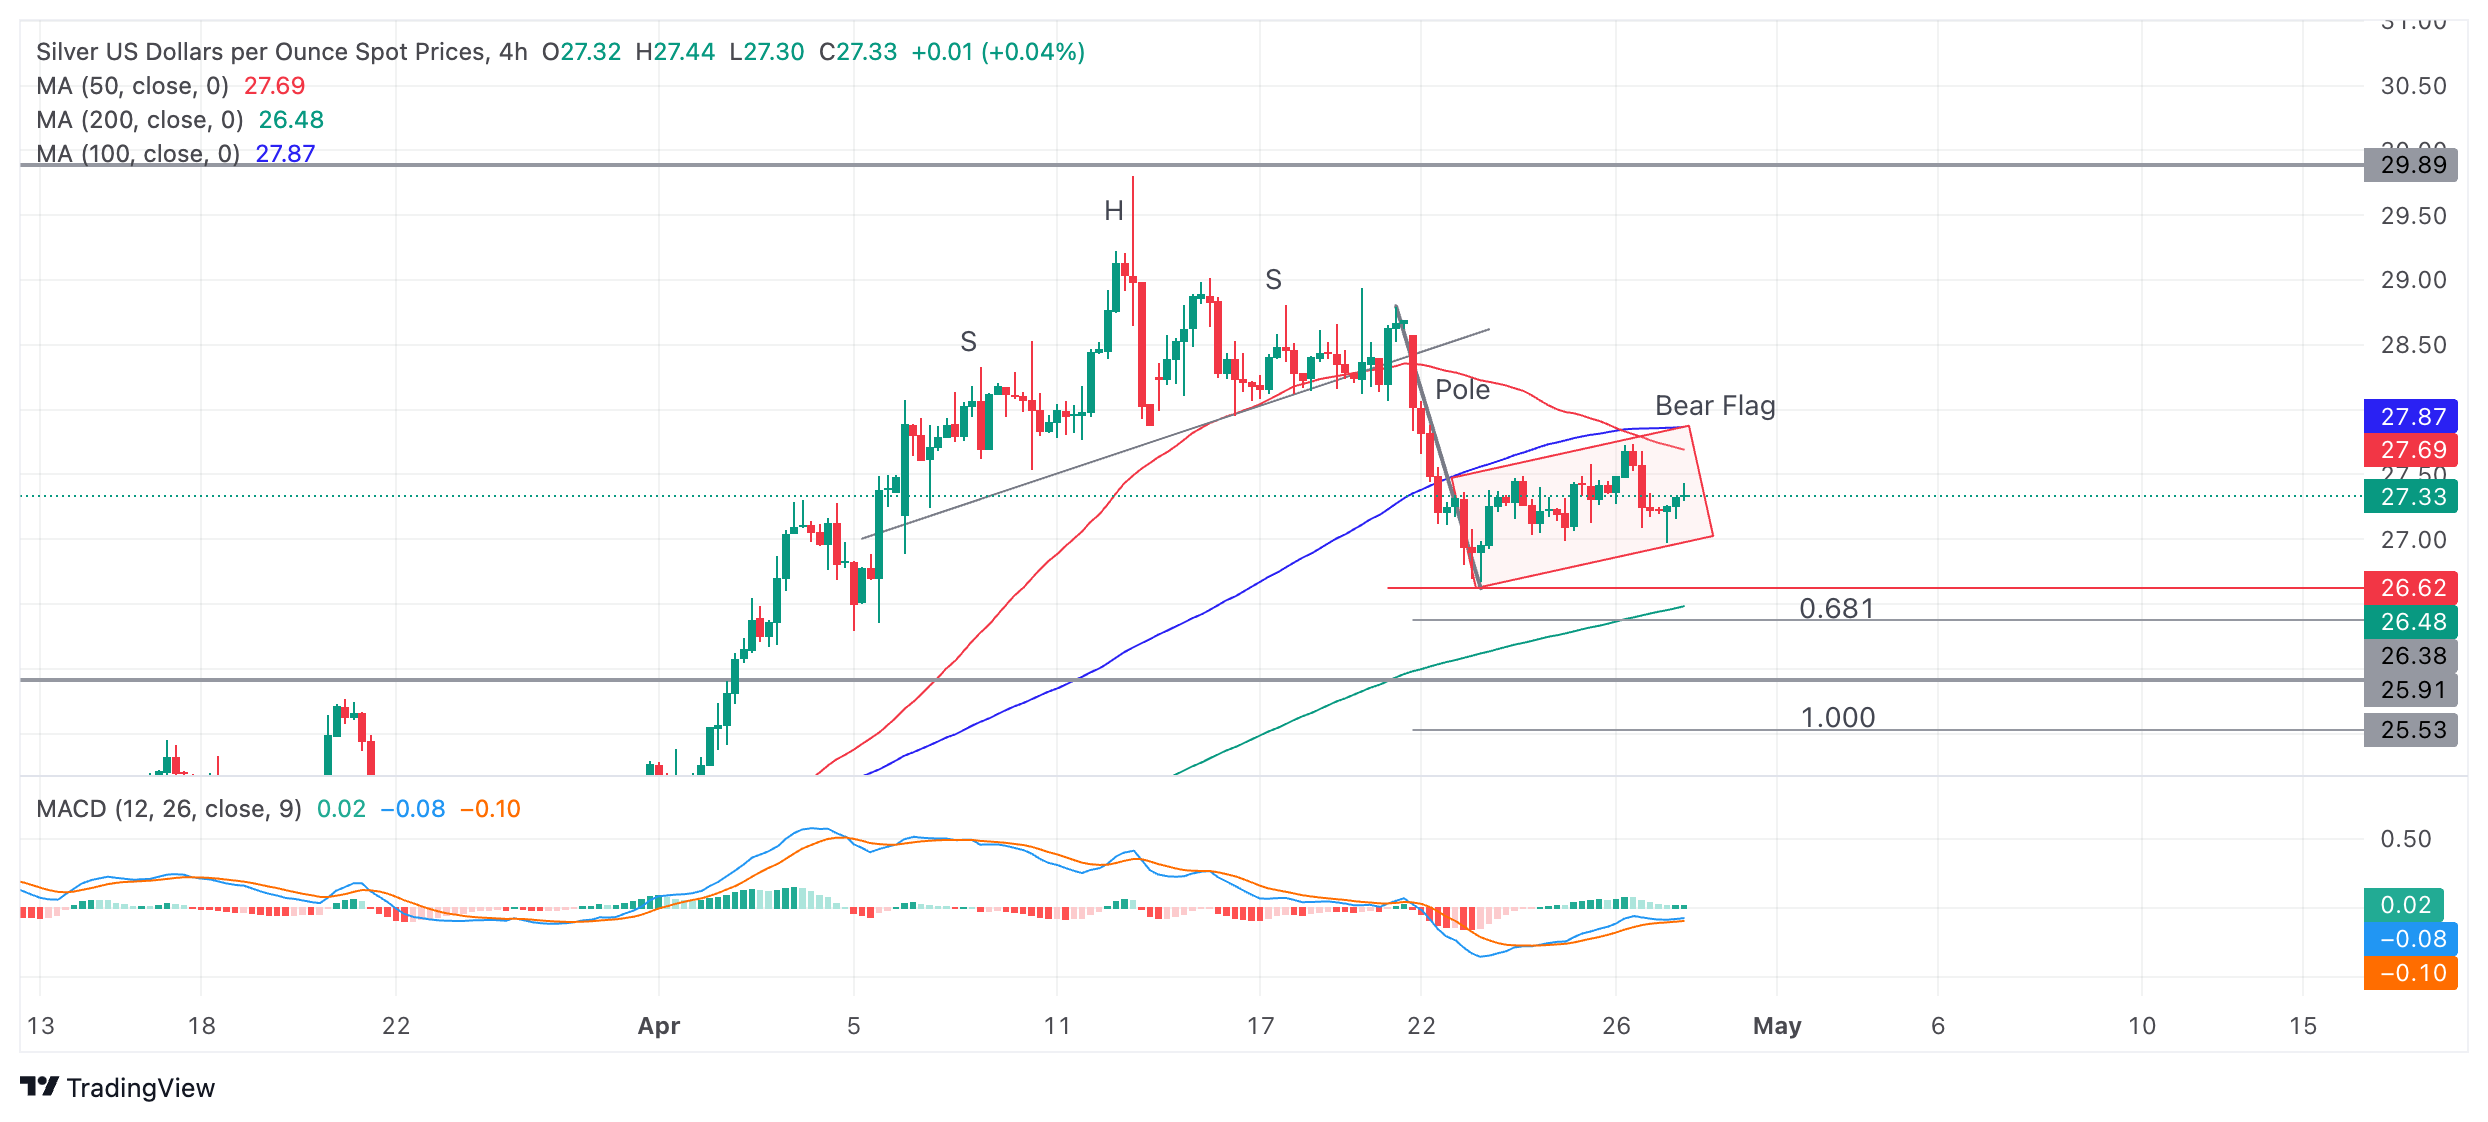
After a steep decline between April 19-23 Silver price bounced off support at $26.70 and has since consolidated into a rectangle pattern. Taken together with the prior sell-off the whole formation resembles a Bear Flag pattern.
According to technical lore, the expected move down from a Bear Flag equals the length of the preceding “pole” or a Fibonacci ratio of the pole extrapolated from the flag pattern down. In this case the pole is the decline between April 19-23.
The Fibonacci 0.618 ratio of the pole gives a conservative target at roughly $26.30. If Silver price falls the whole length of the pole (Fib. 1.000), however, it will reach a more optimistic target of around $25.50.
Tough support from a long-term upper range boundary line at about $25.80, however, is likely to offer support before Silver price reaches the lower target for the Bear Flag.
A break below the $26.69 low of April 23 would be required to confirm a breakdown of the Bear Flag towards its targets.
In February Silver price started rallying up to the top of a 4-year consolidation close to $30.00. After reaching just shy of this resistance level it formed a multiple shouldered Head and Shoulders (H&S) topping pattern in mid-April.
Silver price then declined to the initial target for the H&S pattern at $26.70 and bounced. Since then it has been consolidating.
- The Mexican Peso rises as sentiment improves due to gains for tech giants and the easing of real-estate regulations in China.
- Microsoft and Alphabet stock prices soared at the end of last week, lifting the whole market higher.
- Speculation of the Chinese authorities easing property market regulations helps soothe investor fears, further supporting sentiment.
The Mexican Peso (MXN) trades higher against its key counterparts on Monday morning on the back of a wave of positive market sentiment. Asian stock indices noted gains at the end of their session, with Hong Kong’s Hang Seng Index up 1.6% and China’s Shanghai Composite closing up 0.79% at the time of writing.
USD/MXN is trading down 0.30% at 17.10, EUR/MXN is down over 0.10% at 18.34 and GBP/MXN is down a similar amount at 21.43, at the time of publication during the European session.
Mexican Peso rises on wave of positive risk sentiment
The Mexican Peso makes gains at the start of the week as risk sentiment turns positive on speculation the Chinese Communist Party Central Committee's Political Bureau will meet in late April to discuss loosening property policies, according to Reuters.
Market sentiment is being further buoyed by the strong gains seen in US stocks on Friday as a result of expectation-beating first quarter results from Alphabet (GOOG) and Microsoft (MSFT).
On the data front, the Mexican labor market showed resilience after the release of the Unemployment Rate, which came in lower-than-expected at 2.3% in March from 2.5% previously, according to figures from INEGI. Analysts had been expecting a lesser decline to 2.4%.
Balance of Trade data, released at the same time, showed a higher-than-expected surplus of $2.098 billion in March from $1.195B in the same month of the previous year, and February’s 0.585B deficit, according to data from INEGI. The result was above expectations of a 0.700B surplus.
The data is more likely than not to lead the Banxico to delay further interest-rate cuts. The central bank reduced interest rates from 11.25% to 11.00% at its March meeting, however, it said future cuts would be data dependent. Maintaining higher interest rates for longer is likely to support the Mexican Peso going forward as higher interest rates attract more capital inflows.
Technical Analysis: USD/MXN extends sideways trend
USD/MXN extends its sideways trend over the short-term horizon as it continues to seesaw between tepid gains and losses between range lows in the 16.80s and highs in the 17.40s.
USD/MXN 4-hour Chart
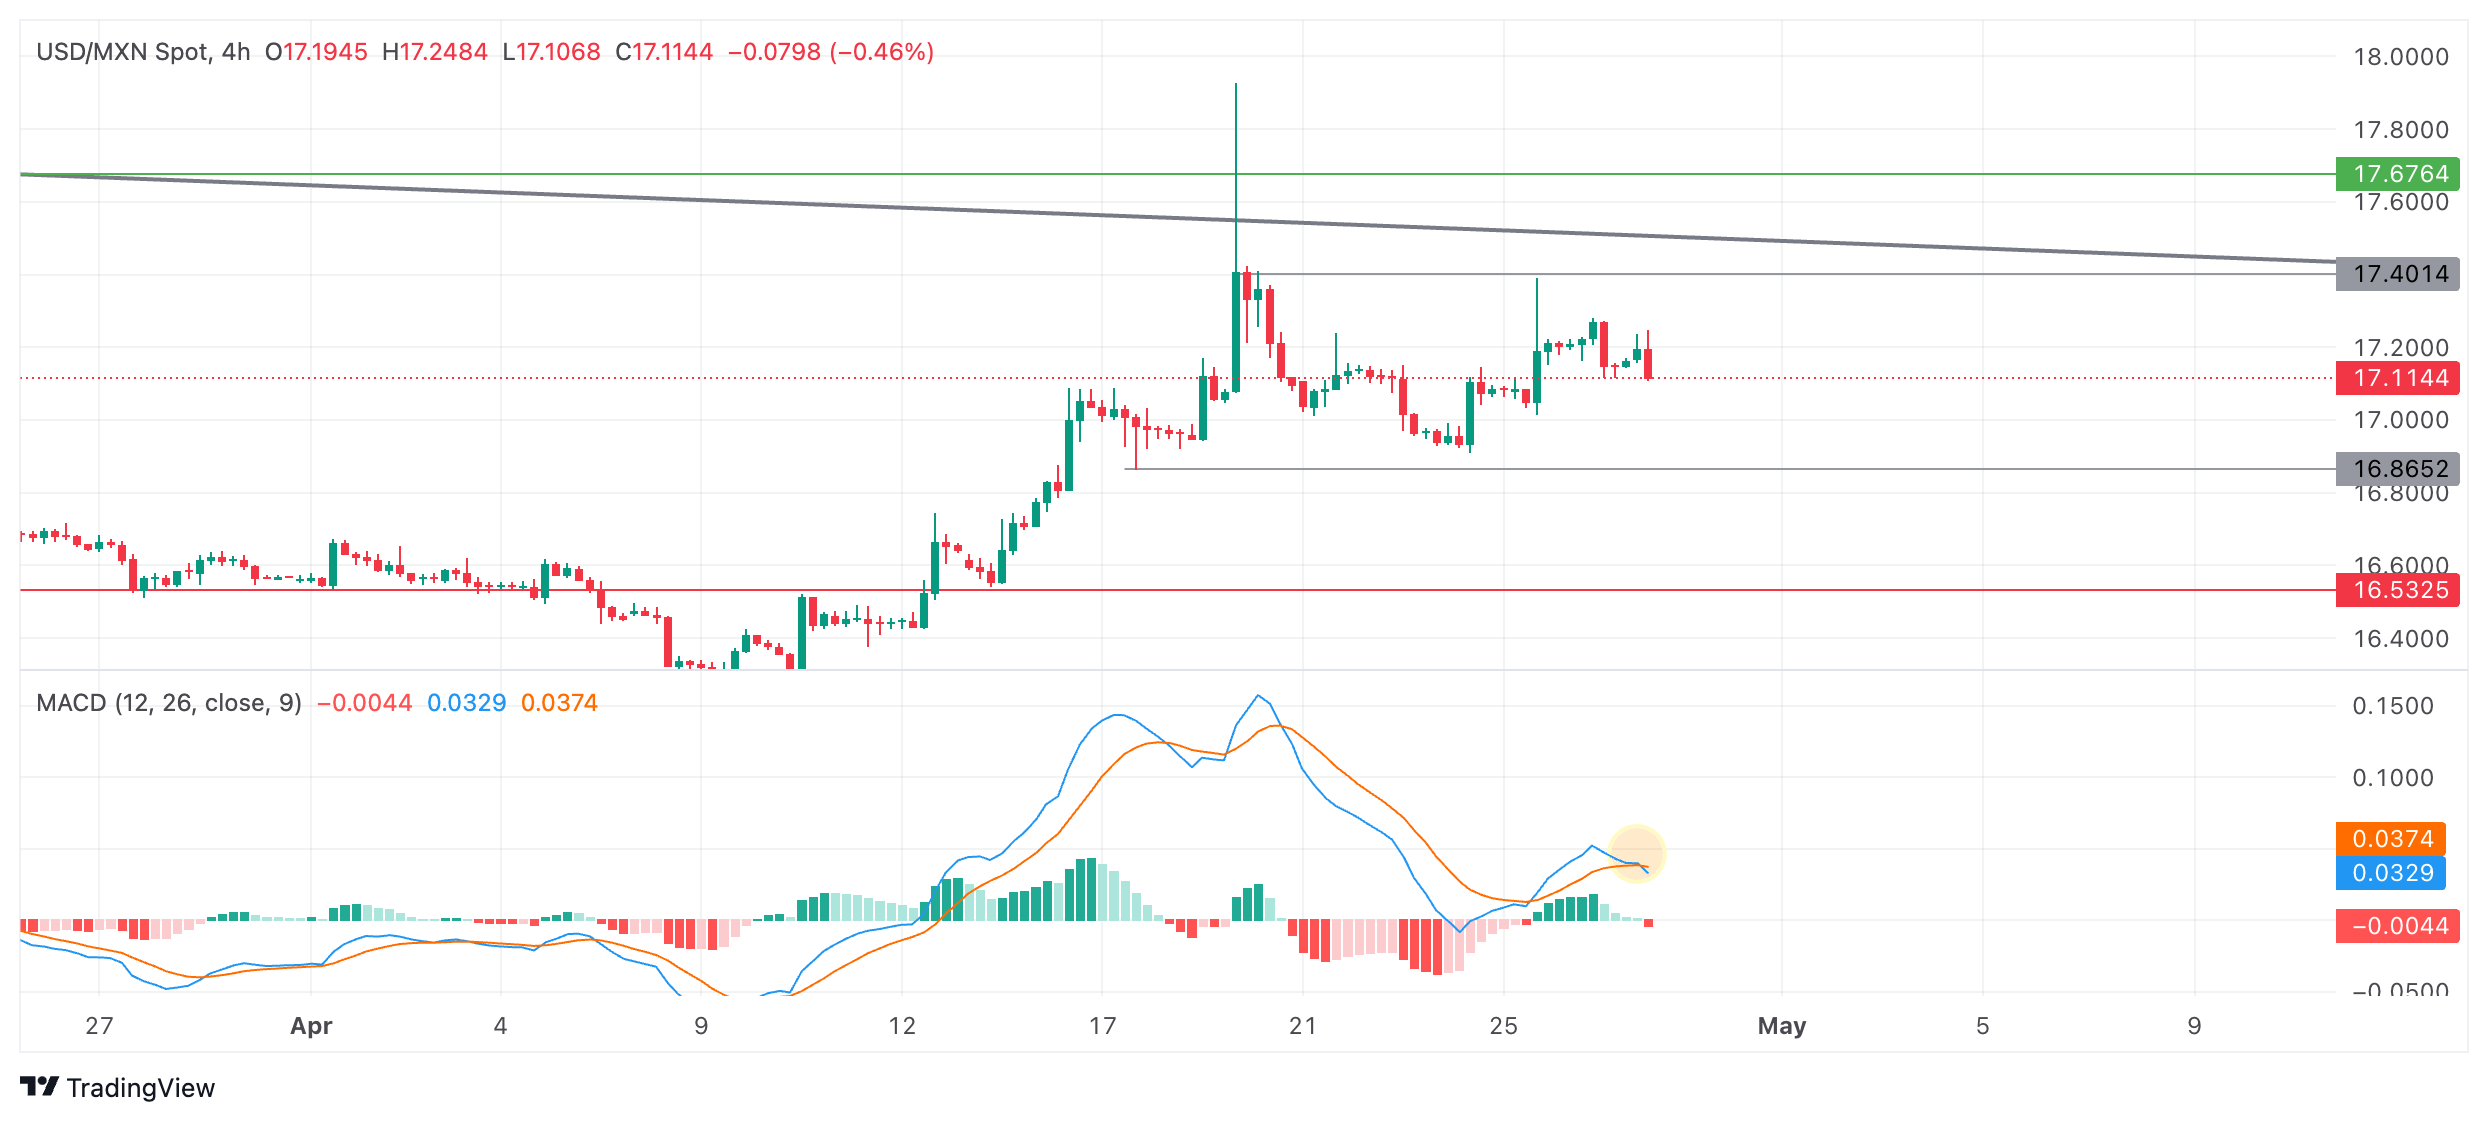
The Moving Average Convergence/ Divergence (MACD) momentum indicator has just crossed below its signal line, giving a sell signal and indicating the likelihood that USD/MXN will continue falling to the range floor. The signal is enhanced by the fact that MACD is more reliable in sideways market conditions.
A decisive breakout of the range, either below the range floor at 16.86 or range ceiling at 17.40, would change the directional bias of the pair.
A break below the floor could see further downside to a target at 16.50, followed by the April 9 low at 16.26.
On the other side, a breakout higher would activate an upside target first at 17.67, piercing a long-term trendline and then possibly reaching a further target at around 18.15.
A decisive break would be one characterized by a longer-than-average green or red daily candlestick that pierces above or below the range high or low, and that closes near its high or low for the period; or three green/red candlesticks in a row that pierce above/below the respective levels.
Mexican Peso FAQs
The Mexican Peso (MXN) is the most traded currency among its Latin American peers. Its value is broadly determined by the performance of the Mexican economy, the country’s central bank’s policy, the amount of foreign investment in the country and even the levels of remittances sent by Mexicans who live abroad, particularly in the United States. Geopolitical trends can also move MXN: for example, the process of nearshoring – or the decision by some firms to relocate manufacturing capacity and supply chains closer to their home countries – is also seen as a catalyst for the Mexican currency as the country is considered a key manufacturing hub in the American continent. Another catalyst for MXN is Oil prices as Mexico is a key exporter of the commodity.
The main objective of Mexico’s central bank, also known as Banxico, is to maintain inflation at low and stable levels (at or close to its target of 3%, the midpoint in a tolerance band of between 2% and 4%). To this end, the bank sets an appropriate level of interest rates. When inflation is too high, Banxico will attempt to tame it by raising interest rates, making it more expensive for households and businesses to borrow money, thus cooling demand and the overall economy. Higher interest rates are generally positive for the Mexican Peso (MXN) as they lead to higher yields, making the country a more attractive place for investors. On the contrary, lower interest rates tend to weaken MXN.
Macroeconomic data releases are key to assess the state of the economy and can have an impact on the Mexican Peso (MXN) valuation. A strong Mexican economy, based on high economic growth, low unemployment and high confidence is good for MXN. Not only does it attract more foreign investment but it may encourage the Bank of Mexico (Banxico) to increase interest rates, particularly if this strength comes together with elevated inflation. However, if economic data is weak, MXN is likely to depreciate.
As an emerging-market currency, the Mexican Peso (MXN) tends to strive during risk-on periods, or when investors perceive that broader market risks are low and thus are eager to engage with investments that carry a higher risk. Conversely, MXN tends to weaken at times of market turbulence or economic uncertainty as investors tend to sell higher-risk assets and flee to the more-stable safe havens.
- The US Dollar slides in Monday’s Asian session to broadly recover later in the European start.
- Traders are trying to keep their powder dry for the Federal Reserve meeting on Wednesday.
- The US Dollar Index briefly dips to 105.47 before erasing nearly the whole move.
The US Dollar (USD) took it on the chin on Monday during the Asia-Pacific trading session. Although still unconfirmed, markets are speculating over the possibility that the Bank of Japan (BoJ) or its Ministry of Finance intervened in the forex market to support a rapidly weakening Japanese Yen (JPY). The USD/JPY pair slid lower from 160.17 to 154.50, a more than 3.50% appreciation of the Japanese Yen against the US Dollar. This sharp move had a ripple effect through the forex markets and saw the Greenback trading weaker across the board.
On the economic data front, Monday presents a very calm start to the week ahead of the main event on Wednesday: the US Federal Reserve (Fed) convening for the Federal Open Market Committee (FOMC) meeting. The main element will be how Fed Chairman Jerome Powell perceives the current situation after some disappointing US economic data combined with signs of persisting price pressures.
Daily digest market movers: Do interventions really work?
- Overnight, the Ministry of Finance from Japan or the Bank of Japan (BoJ) possibly intervened in the Japanese Yen, although there isn’t any official word about it. The move comes after the USD/JPY pair hit 160.00 in early trading on Monday. The BoJ intervenes by strengthening its currency in order to avoid having imported inflation from a weak currency, which could trigger more demand from abroad for goods produced locally.
- At 14:30 GMT, the Dallas Fed Manufacturing Business Index for April will be released. The previous print was -14.4.
- The US Treasury will allocate a 3-month and a 6-month bill around 15:30 GMT.
- Equities are overall in the green on Monday, cheering the weaker Greenback. Usually, when equities are underperforming, the US Dollar is stronger as an increase of safe haven demand.
- The CME Fedwatch Tool suggests an 88.5% probability that June will still see no change to the Federal Reserve's feds fund rate. Odds of a rate cut in July are out of the cards, while for September the tool shows a 43.6% chance that rates will be lower than current levels.
- The benchmark 10-year US Treasury Note trades around 4.64% and keeps lingering around this level.
US Dollar Index Technical Analysis: Forget about a calm Monday
The US Dollar Index (DXY) got trashed on Monday after the Japanese Yen rattled markets by strengthening substantially. Add in there the turning sentiment in US data since last week, with Gross Domestic Product and the Purchasing Managers Indices starting to flirt with contraction, that US exceptionalism looks bleak. The US economy is not in stagflation yet, though the window for the Fed to cut interest rates is starting to close rapidly for this year.
On the upside, 105.88 (a pivotal level since March 2023) needs to be recovered again before targeting the April 16 high at 106.52. Further up and above the 107.00 round level, the DXY index could meet resistance at 107.35, the October 3 high.
On the downside, 105.12 and 104.60 should act as support ahead of the 55-day and the 200-day Simple Moving Averages (SMAs) at 104.40 and 104.10, respectively. If those levels are unable to hold, the 100-day SMA near 103.75 is the next best candidate.
Bank of Japan FAQs
The Bank of Japan (BoJ) is the Japanese central bank, which sets monetary policy in the country. Its mandate is to issue banknotes and carry out currency and monetary control to ensure price stability, which means an inflation target of around 2%.
The Bank of Japan has embarked in an ultra-loose monetary policy since 2013 in order to stimulate the economy and fuel inflation amid a low-inflationary environment. The bank’s policy is based on Quantitative and Qualitative Easing (QQE), or printing notes to buy assets such as government or corporate bonds to provide liquidity. In 2016, the bank doubled down on its strategy and further loosened policy by first introducing negative interest rates and then directly controlling the yield of its 10-year government bonds.
The Bank’s massive stimulus has caused the Yen to depreciate against its main currency peers. This process has exacerbated more recently due to an increasing policy divergence between the Bank of Japan and other main central banks, which have opted to increase interest rates sharply to fight decades-high levels of inflation. The BoJ’s policy of holding down rates has led to a widening differential with other currencies, dragging down the value of the Yen.
A weaker Yen and the spike in global energy prices have led to an increase in Japanese inflation, which has exceeded the BoJ’s 2% target. Still, the Bank judges that the sustainable and stable achievement of the 2% target has not yet come in sight, so any sudden change in the current policy looks unlikely.
- NZD/USD trades close to a two-week high around 0.5980 amid improved market mood.
- The US Dollar drops ahead of the Fed’s policy meeting, scheduled for May 1.
- NZ Q1 Employment data will guide the next move in the Kiwi Dollar.
The NZD/USD pair refreshes two-week high near 0.5980 in Monday’s European session. The Kiwi asset is up 0.55% as appeal for risk-sensitive assets is upbeat. The US Dollar drops as weak United States data has raised concerns over its economic outlook.
The US Dollar Index (DXY) remains near the key support of 105.50 due to a poor outlook by the S&P Global PMI survey for April and weak Q1 Gross Domestic Product (GDP) data.
Meanwhile, investors shift focus to the Federal Reserve’s (Fed) monetary policy, which will be announced on Wednesday. The CME FedWatch tool shows that interest rates will remain unchanged in the range of 5.25%-5.50%. Therefore, fresh guidance on interest rates will influence further action in the US Dollar.
On the New Zealand Dollar front, investors will focus on the Q1 Employment data, which will be published on Tuesday. The labor market is expected to have grown by 0.3%, slower than the prior pace of 0.4%. The Labor Cost Index that feeds price pressures are forecasted to rise slowly by 0.8% from 1.0% growth recorded in the last quarter of 2023. Tight labor market conditions would allow the Reserve Bank of New Zealand (RBNZ) to keep the monetary policy restrictive for a longer period.
NZD/USD pair rebounds strongly after the discovery of buying interest around 0.5850. The Kiwi asset rebounded after a Double Bottom formation, which lead to a bullish reversal emerges. The asset has extended its upside above the horizontal resistance plotted from April 1 low around 0.5939, which has become a support for New Zealand Dollar bulls.
The near-term outlook improves as the asset holds gains above the 20-period Exponential Moving Average (EMA) around 0.5950. The 200-EMA around 0.5990 is still a major roadblock for the New Zealand Dollar bulls.
The 14-period Relative Strength Index (RSI) climbs above 60.00, suggesting a bullish momentum has been triggered.
Further upside above the psychological resistance of 0.6000 will drive the asset towards April 4 high around 0.6050 and the round-level resistance of 0.6100.
On the contrary, a fresh downside would appear if the asset breaks below April 16 low at 0.5860. This would drag the asset toward 8 September 2023 low at 0.5847, followed by the round-level support of 0.5900
NZD/USD four-hour chart
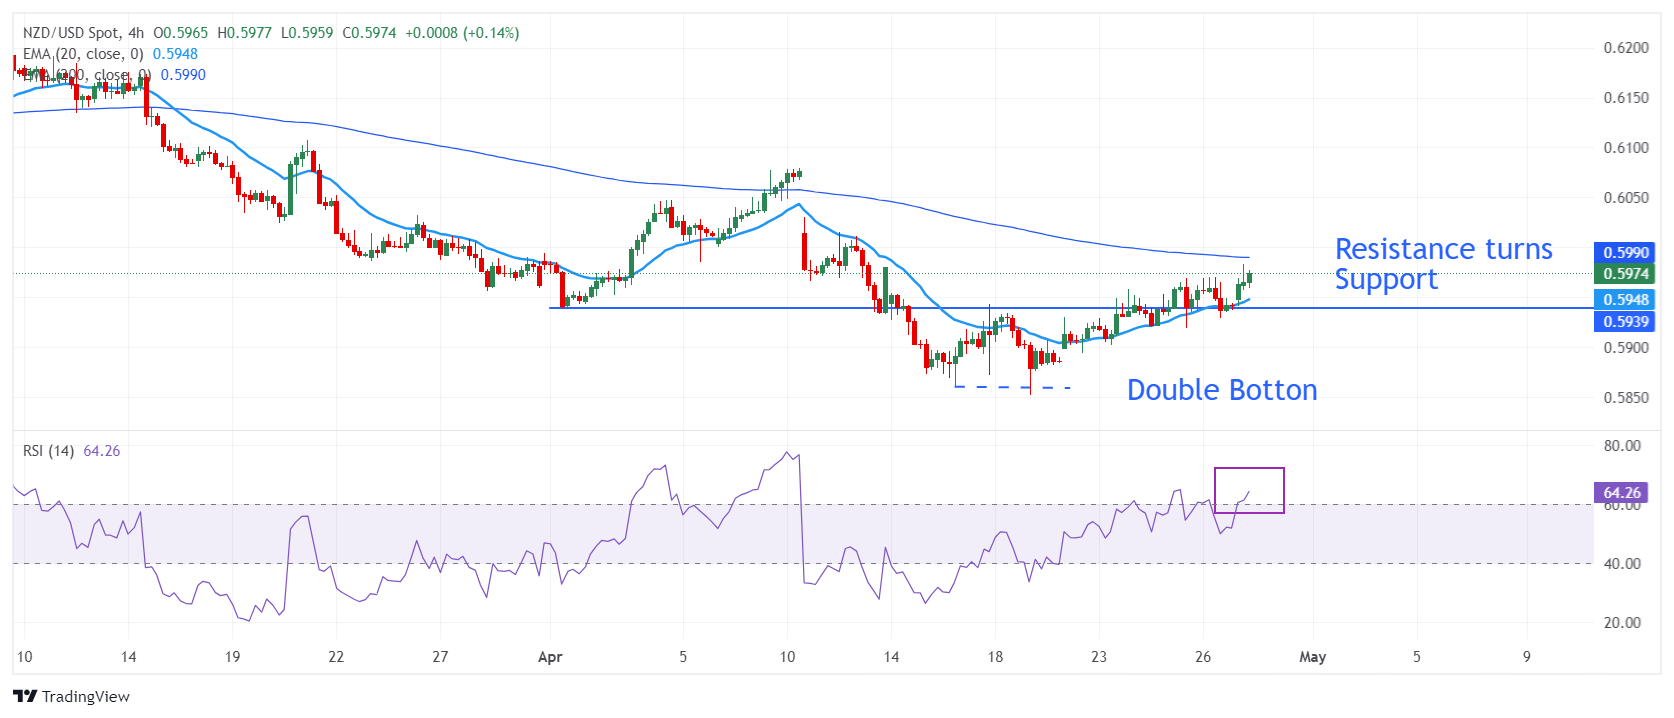
- Gold price edges higher on rumors Japanese authorities are selling the Dollar to buy the Yen
- The precious metal has weakened amid expectations interest rates will remain higher for longer in the US.
- The US Federal Reserve meeting in May could color the outlook for interest rates, impacting Gold price.
The Gold price (XAU/USD) edges higher on Monday, trading at $2,338 an ounce, on the back of a weaker US Dollar (USD) – the currency in which Gold is mostly quoted and traded in.
The USD depreciates after heavy selling pressure, purportedly although still unconfirmed by the Japanese authorities, who are selling USD to buy the Japanese Yen (JPY) in order to prop up their currency.
Gold price comes off highs on interest rate outlook
The Gold price is trading sideways after a backslide from record highs of $2,430 in mid-April, when it became apparent interest rates would remain higher for longer in the United States. This made non-yielding Gold less attractive because investors could earn relatively more by staying in cash.
Persistently high inflation in the US caused the recalibration of the outlook for interest rates. From the US Federal Reserve (Fed) – the body tasked with setting interest rates in America – foreseeing the need for three 0.25% interest-rate cuts in 2024, markets now expect only one and a half 0.25% cuts, due to persistently high inflation.
More light will be shed on the outlook for interest rates when the Fed meets to decide its monetary policy on Wednesday, in the meantime Gold price may remain relatively subdued.
Gold price may drift lower in the short-term but will eventually recover – TD Securities
Gold price is likely to drift lower in the short-term if economic data stays firm and inflation persists but this is unlikely to last into the autumn, according to analysts at investment bank TD Securities.
“..once we start seeing disappointment or negative data surprises, investors may start getting interested again into the autumn,” says Bart Melek, Head of Commodity Strategy at TD Securities.
“Once Western demand is combined with China uptake, it is quite likely that the yellow metal will move above recent record levels. Under this scenario, $2,500+ target would be reasonable,” adds Melek.
Technical Analysis: Gold price pulls back in an uptrend
Gold price (XAU/USD) is showing a mixed picture on the 4-hour chart, which technical analysts use to analyze the short-term trend.
On the one hand, the sell-off that began at the April 19 highs could still have lower to go. In such a scenario the move could be unfolding as a three-wave Measured Move pattern with its third and final C wave yet to unfold.
On the other hand, a break above the cluster of Moving Averages and the peak of wave B at $2,353 would potentially usher in a new more bullish environment. This could then see a retest of $2,400.
A break below $2,290, however, would confirm more downside as wave C unfolds, with targets at $2,267 and $2,243.
The Moving Average Convergence Divergence (MACD) momentum indicator is printing green histogram bars but has not yet risen above zero, giving a neutral to marginally positive stance.
Additionally, the trend for Gold price is up both in the medium and long-term, supporting bulls.
Economic Indicator
Fed Interest Rate Decision
The Federal Reserve (Fed) deliberates on monetary policy and makes a decision on interest rates at eight pre-scheduled meetings per year. It has two mandates: to keep inflation at 2%, and to maintain full employment. Its main tool for achieving this is by setting interest rates – both at which it lends to banks and banks lend to each other. If it decides to hike rates, the US Dollar (USD) tends to strengthen as it attracts more foreign capital inflows. If it cuts rates, it tends to weaken the USD as capital drains out to countries offering higher returns. If rates are left unchanged, attention turns to the tone of the Federal Open Market Committee (FOMC) statement, and whether it is hawkish (expectant of higher future interest rates), or dovish (expectant of lower future rates).
Read more.Next release: Wed May 01, 2024 18:00
Frequency: Irregular
Consensus: 5.5%
Previous: 5.5%
Source: Federal Reserve
- Natural Gas price ticks up, although its upside looks capped due to easing demand.
- Gas prices could dip lower in the coming days with Freeport supply coming in.
- The US Dollar Index dives after a sharp appreciation from the Japanese Yen unofficially attributed to an intervention.
Natural Gas (XNG/USD) prices are ticking up above $2 on Monday, showing a distorted picture of fundamentals against correlations. Fundamentally, Gas prices are expected to retreat a little with news that points to higher supply and lower demand, a textbook combination for lower prices. On the demand side, Europe is about to face a warm weather front, slashing the demand for Gas in the continent. Adding to this, more supply is likely coming online as the US Freeport Liquified Natural Gas (LNG) plant overcomes some of its technical problems, which have weighed on production for the last few months.
Meanwhile, the US Dollar Index (DXY) is easing substantially, helping to push commodities’ prices higher. The easing comes on the back of an unofficial intervention from Japanese authorities to support the Japanese Yen (JPY), which has strengthened substantially against the US Dollar overnight. This had a ripple effect on the Greenback against other major currencies and pushed commodities higher.
Natural Gas is trading at $2.05 per MMBtu at the time of writing.
Natural Gas news and market movers: Easing on both sides
- Bloomberg reports that The Freeport LNG export plant in Texas has restarted one of its production trains, according to traders in the commodity.
- BP has signed a deal with Korea Gas Corporation to deliver 9.8 million tons of LNG over 11 years.
- European Natural Gas prices are extending their decline as a warmer weather front moves in for this week and the next.
- German Gas storages are still at 67% full, while reserves for overall Europe are at 62%.
Natural Gas Technical Analysis: Easing in two speeds
Natural Gas is bound to ease a little with flows from the US Freeport plant coming back online, adding to US export volumes, which were tighter these past few weeks. Meanwhile, Europe will see its reserves holding up this week with a warm front coming in. This should at least open some room for a bit of easing in Gas prices, which is already taking place in the European Gas market, while the US market needs to catch up.
On the upside, the blue line at $2.11, the 2023 low, and the 100-day Simple Moving Average (SMA) at $2.10 are acting as a resistance. Further up, the next level to watch is the January 25 high at $2.33.
On the other side, the $2.00 handle has worked as nearby support for now. Further down, a trifecta of support is formed at $1.88, with the ascending and descending trend lines crossing and the 55-day SMA. Should that level break, expect a quick downward movement to the year-to-date low at $1.60.
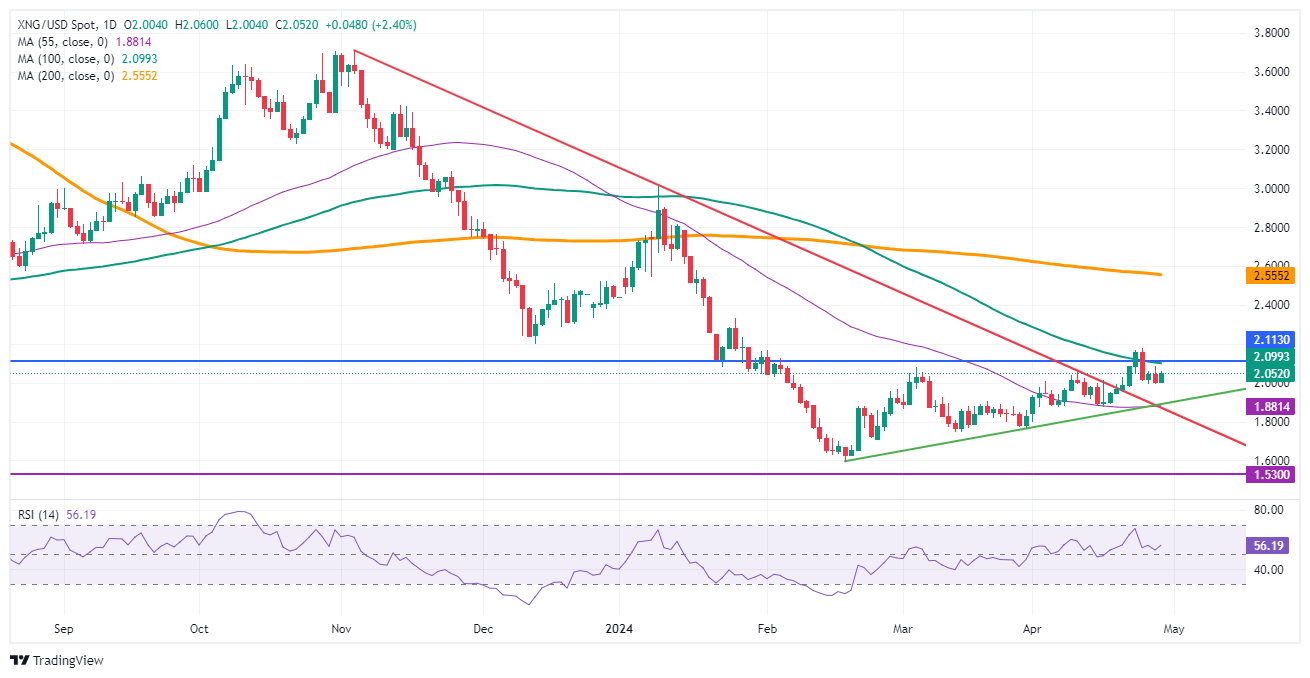
Natural Gas: Daily Chart
Natural Gas FAQs
Supply and demand dynamics are a key factor influencing Natural Gas prices, and are themselves influenced by global economic growth, industrial activity, population growth, production levels, and inventories. The weather impacts Natural Gas prices because more Gas is used during cold winters and hot summers for heating and cooling. Competition from other energy sources impacts prices as consumers may switch to cheaper sources. Geopolitical events are factors as exemplified by the war in Ukraine. Government policies relating to extraction, transportation, and environmental issues also impact prices.
The main economic release influencing Natural Gas prices is the weekly inventory bulletin from the Energy Information Administration (EIA), a US government agency that produces US gas market data. The EIA Gas bulletin usually comes out on Thursday at 14:30 GMT, a day after the EIA publishes its weekly Oil bulletin. Economic data from large consumers of Natural Gas can impact supply and demand, the largest of which include China, Germany and Japan. Natural Gas is primarily priced and traded in US Dollars, thus economic releases impacting the US Dollar are also factors.
The US Dollar is the world’s reserve currency and most commodities, including Natural Gas are priced and traded on international markets in US Dollars. As such, the value of the US Dollar is a factor in the price of Natural Gas, because if the Dollar strengthens it means less Dollars are required to buy the same volume of Gas (the price falls), and vice versa if USD strengthens.
- EUR/USD struggles to hold gains above 1.0700 amid uncertainty ahead of key economic events.
- The ECB seems poised to start reducing key borrowing rates in June.
- Eurozone’s CPI, Q1 GDP and the Fed’s policy outlook will be in focus.
The EUR/USD pair struggles to sustain above the round-level resistance of 1.0700 in Monday’s European session. The major currency pair exhibits caution ahead of the release of key economic indicators in the Eurozone, such as preliminary Eurozone Q1 Gross Domestic Product (GDP) and the Consumer Price Index (CPI) data for April, which will be published on Tuesday.
Eurozone’s economic data will influence speculation about interest rate cuts by the European Central Bank (ECB). Currently, investors’ expectations that the ECB will start to cut its Main Refinancing Operations Rate from the June meeting strengthened as policymakers see them as reasonable.
Last week, Banque de France Governor and ECB Council member François Villeroy de Galhau said there is no need to wait much longer to start interest rate cuts if other things remain constant. Villeroy expects that energy prices are unlikely to rise further despite Middle East tensions and, hence, should not impact the ECB’s plans to pivot to interest rate cuts starting in June.
While a rate-cut move in the June meeting is widely expected, there is uncertainty over whether the ECB will extend the rate-tightening campaign. ECB policymakers share different opinions on that as Villeroy said last week: “June rate cuts should be followed by further cuts, at a pragmatic pace.” On the contrary, ECB policymaker and Bundesbank Chief Joachim Nagel said last week that a June interest rate cut may not necessarily be followed up by a series of rate cuts. Nagel remains worried about higher service inflation due to strong wage growth. He is not fully convinced that inflation will actually return to target in a timely and sustained manner.
In Monday’s session, investors will focus on the German preliminary inflation data for April, which will be published at 12:00 GMT. The annual Harmonized Index of Consumer Prices (HICP) is expected to have grown steadily by 2.3%.
Daily digest market movers: EUR/USD is off from daily high ahead of German data
- The EUR/USD retreats from the intraday high of 1.0734. The major currency pair fails to hold gains even though the market sentiment is favourable for risk-sensitive assets and the US Dollar edges down. Significant gains registered by S&P 500 futures indicate that the market sentiment is risk-on.
- The US Dollar remains on the backfoot due to uncertainty over the US economic outlook. The US Dollar Index (DXY), which tracks the Greenback’s value against six major currencies, fell to 105.60 as weak preliminary US economic indicators such as the S&P Global Purchasing Managers’ Index survey for April and Q1 GDP have raised concerns over the economy’s strength in coping with higher interest rates by the US Federal Reserve (Fed).
- The next move in the US Dollar will be guided by the Fed’s monetary policy decision, which will be announced on Wednesday. The US central bank is widely anticipated to keep interest rates steady in the range of 5.25%-5.50%. Therefore, investors will focus on the Fed’s guidance for interest rates. Considering the hot Q1 GDP Price Index and higher-than-expected US core Personal Consumption Expenditure Price Index (PCE) data for March, the Fed has no option but to deliver hawkish guidance on interest rates.
- Fed policymakers are expected to reiterate the need to maintain interest rates at their current levels until they get confidence that inflation will come down sustainably to the desired rate of 2% target. Investors will focus on whether the Fed remains committed to three rate-cut projections during 2024. Actually, the CME FedWatch tool shows that the US central bank will only make two rate cuts this year, and the September meeting is likely to be chosen as the earliest point.
Technical Analysis: EUR/USD aims for sustainability above 1.0700
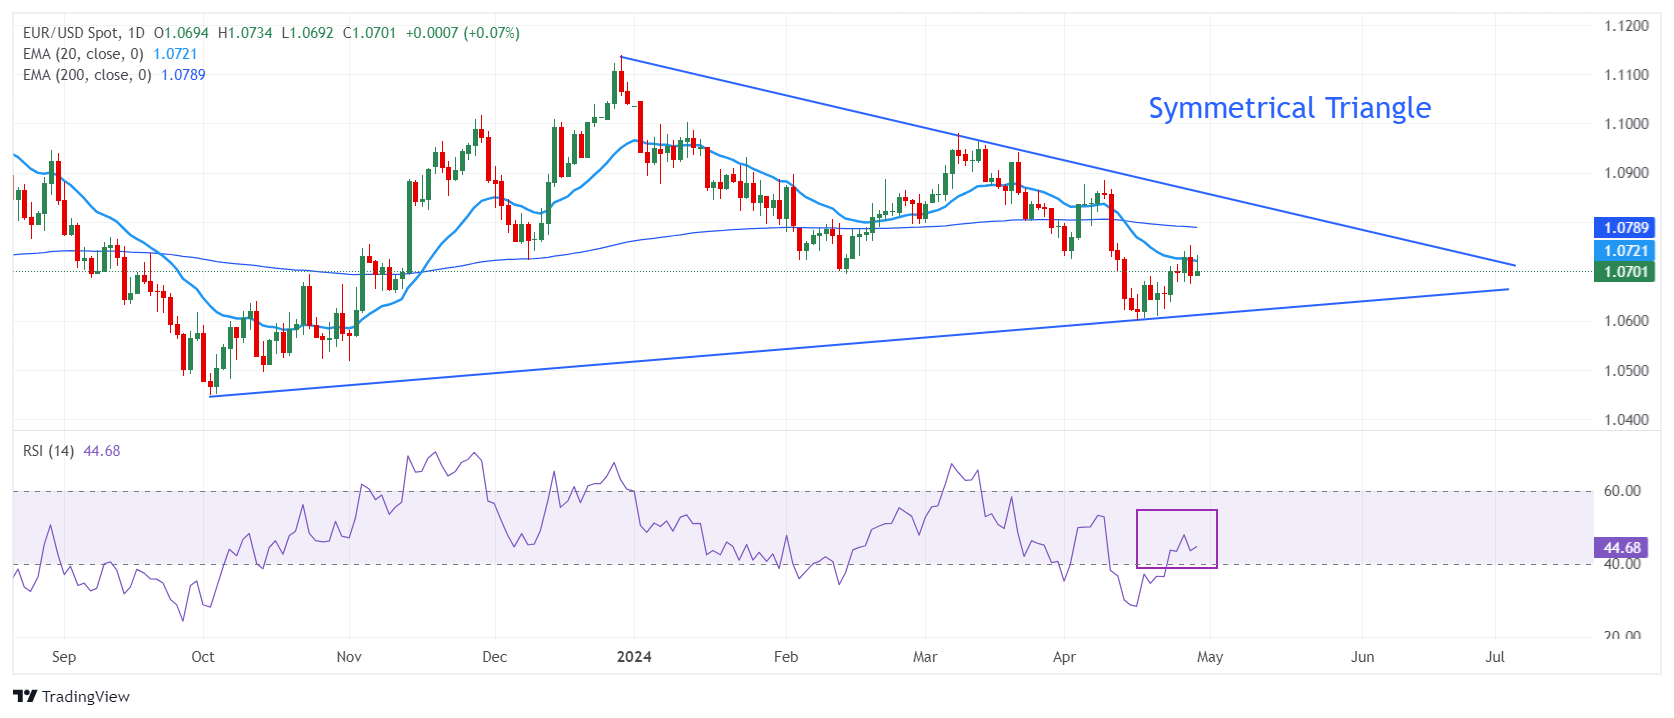
The EUR/USD attempts to establish firm footing above the 1.0700 hurdle. The shared currency pair extends its recovery from 1.0600 to 1.0700, but the near-term outlook is still uncertain. The 20-day Exponential Moving Average (EMA) near 1.0720 remains a major barricade for the Euro bulls. The 200-day EMA near 1.0800 is declining, suggesting that the long-term appeal is bearish.
The 14-period Relative Strength Index (RSI) shifts into the 40.00-60.00 range, indicating a consolidation ahead.
The holistic view of the EUR/USD pair indicates a sharp volatility contraction due to a Symmetrical Triangle formation on a daily timeframe. The upward-sloping border of the triangle pattern is plotted from the October 3 low at 1.0448, and the downward-sloping border is placed from the December 28 high around 1.1140.
Euro FAQs
The Euro is the currency for the 20 European Union countries that belong to the Eurozone. It is the second most heavily traded currency in the world behind the US Dollar. In 2022, it accounted for 31% of all foreign exchange transactions, with an average daily turnover of over $2.2 trillion a day. EUR/USD is the most heavily traded currency pair in the world, accounting for an estimated 30% off all transactions, followed by EUR/JPY (4%), EUR/GBP (3%) and EUR/AUD (2%).
The European Central Bank (ECB) in Frankfurt, Germany, is the reserve bank for the Eurozone. The ECB sets interest rates and manages monetary policy. The ECB’s primary mandate is to maintain price stability, which means either controlling inflation or stimulating growth. Its primary tool is the raising or lowering of interest rates. Relatively high interest rates – or the expectation of higher rates – will usually benefit the Euro and vice versa. The ECB Governing Council makes monetary policy decisions at meetings held eight times a year. Decisions are made by heads of the Eurozone national banks and six permanent members, including the President of the ECB, Christine Lagarde.
Eurozone inflation data, measured by the Harmonized Index of Consumer Prices (HICP), is an important econometric for the Euro. If inflation rises more than expected, especially if above the ECB’s 2% target, it obliges the ECB to raise interest rates to bring it back under control. Relatively high interest rates compared to its counterparts will usually benefit the Euro, as it makes the region more attractive as a place for global investors to park their money.
Data releases gauge the health of the economy and can impact on the Euro. Indicators such as GDP, Manufacturing and Services PMIs, employment, and consumer sentiment surveys can all influence the direction of the single currency. A strong economy is good for the Euro. Not only does it attract more foreign investment but it may encourage the ECB to put up interest rates, which will directly strengthen the Euro. Otherwise, if economic data is weak, the Euro is likely to fall. Economic data for the four largest economies in the euro area (Germany, France, Italy and Spain) are especially significant, as they account for 75% of the Eurozone’s economy.
Another significant data release for the Euro is the Trade Balance. This indicator measures the difference between what a country earns from its exports and what it spends on imports over a given period. If a country produces highly sought after exports then its currency will gain in value purely from the extra demand created from foreign buyers seeking to purchase these goods. Therefore, a positive net Trade Balance strengthens a currency and vice versa for a negative balance.
Japan’s top currency diplomat Masato Kanda is back on the wires on Monday, unwilling to comment again on whether there was FX intervention.
Additional comments
“Will continue to take appropriate action against excessive forex moves.”
“Don't have a specific level in mind about appropriate forex level.”
“Speculative, rapid, abnormal FX moves have bad impact on the economy, so unacceptable.”
“Ready to respond 24 hours, 365 days,” when asked whether Japan was ready to take action in the FX market.
Market reaction
At the time of writing, USD/JPY keeps its recovery mode intact near 155.80, having tested 154.50 in an exaggerated reaction to a likely intervention by the Japanese authorities during Monday’s Asian trading. The pair is still down 1.53% on the day.
Japanese Yen FAQs
The Japanese Yen (JPY) is one of the world’s most traded currencies. Its value is broadly determined by the performance of the Japanese economy, but more specifically by the Bank of Japan’s policy, the differential between Japanese and US bond yields, or risk sentiment among traders, among other factors.
One of the Bank of Japan’s mandates is currency control, so its moves are key for the Yen. The BoJ has directly intervened in currency markets sometimes, generally to lower the value of the Yen, although it refrains from doing it often due to political concerns of its main trading partners. The current BoJ ultra-loose monetary policy, based on massive stimulus to the economy, has caused the Yen to depreciate against its main currency peers. This process has exacerbated more recently due to an increasing policy divergence between the Bank of Japan and other main central banks, which have opted to increase interest rates sharply to fight decades-high levels of inflation.
The BoJ’s stance of sticking to ultra-loose monetary policy has led to a widening policy divergence with other central banks, particularly with the US Federal Reserve. This supports a widening of the differential between the 10-year US and Japanese bonds, which favors the US Dollar against the Japanese Yen.
The Japanese Yen is often seen as a safe-haven investment. This means that in times of market stress, investors are more likely to put their money in the Japanese currency due to its supposed reliability and stability. Turbulent times are likely to strengthen the Yen’s value against other currencies seen as more risky to invest in.
Silver prices (XAG/USD) rose on Monday, according to FXStreet data. Silver trades at $27.39 per troy ounce, up 0.64% from the $27.22 it cost on Friday.
Silver prices have increased by 7.54% since the beginning of the year.
| Unit measure | Today Price |
|---|---|
| Silver price per troy ounce | $27.39 |
| Silver price per gram | $0.88 |
The Gold/Silver ratio, which shows the number of troy ounces of Silver needed to equal the value of one troy ounce of Gold, stood at 85.38 on Monday, down from 85.91 on Friday.
Investors might use this ratio to determine the relative valuation of Gold and Silver. Some may consider a high ratio as an indicator that Silver is undervalued – or Gold is overvalued – and might buy Silver or sell Gold accordingly. Conversely, a low ratio might suggest that Gold is undervalued relative to Silver.
Silver FAQs
Silver is a precious metal highly traded among investors. It has been historically used as a store of value and a medium of exchange. Although less popular than Gold, traders may turn to Silver to diversify their investment portfolio, for its intrinsic value or as a potential hedge during high-inflation periods. Investors can buy physical Silver, in coins or in bars, or trade it through vehicles such as Exchange Traded Funds, which track its price on international markets.
Silver prices can move due to a wide range of factors. Geopolitical instability or fears of a deep recession can make Silver price escalate due to its safe-haven status, although to a lesser extent than Gold's. As a yieldless asset, Silver tends to rise with lower interest rates. Its moves also depend on how the US Dollar (USD) behaves as the asset is priced in dollars (XAG/USD). A strong Dollar tends to keep the price of Silver at bay, whereas a weaker Dollar is likely to propel prices up. Other factors such as investment demand, mining supply – Silver is much more abundant than Gold – and recycling rates can also affect prices.
Silver is widely used in industry, particularly in sectors such as electronics or solar energy, as it has one of the highest electric conductivity of all metals – more than Copper and Gold. A surge in demand can increase prices, while a decline tends to lower them. Dynamics in the US, Chinese and Indian economies can also contribute to price swings: for the US and particularly China, their big industrial sectors use Silver in various processes; in India, consumers’ demand for the precious metal for jewellery also plays a key role in setting prices.
Silver prices tend to follow Gold's moves. When Gold prices rise, Silver typically follows suit, as their status as safe-haven assets is similar. The Gold/Silver ratio, which shows the number of ounces of Silver needed to equal the value of one ounce of Gold, may help to determine the relative valuation between both metals. Some investors may consider a high ratio as an indicator that Silver is undervalued, or Gold is overvalued. On the contrary, a low ratio might suggest that Gold is undervalued relative to Silver.
- USD/CHF loses ground due to the improved risk appetite on Monday.
- Fed is expected to maintain its current interest rate range of 5.25%–5.5% in June.
- SNB Chairman Thomas Jordan stated that the central bank is prepared to lower interest rates again if deemed necessary.
USD/CHF retraces its recent gains that registered on Friday, trading around 0.9120 during the European session on Monday. The US Dollar (USD) depreciates, possibly reflecting a shift toward a risk-on sentiment, which undermines the USD/CHF pair.
However, market analysts expect the US Federal Reserve (Fed) to maintain the current interest rate range of 5.25%–5.5% in its upcoming policy meeting on Wednesday, likely due to concerns about stronger inflation. Additionally, the annual US Core Personal Consumption Expenditures (PCE) Price Index data for March showed a rise on last Friday, suggesting that the Fed may delay any potential rate cuts until September. According to the CME FedWatch Tool, the probability of the Fed keeping interest rates unchanged in the June meeting has increased to 87.7%, up from last week's 81.7%.
On the Swiss side, during the SNB's General Meeting of Shareholders on Friday, Chairman Thomas J. Jordan emphasized the bank's commitment to monitoring inflation closely. He stated that the SNB stands ready to reduce interest rates again when necessary. In March, the SNB surprised markets by lowering its main policy rate by 0.25 percentage points to 1.5%.
Chairman Jordan highlighted the SNB's success in combating inflation but cautioned that uncertainty remains high and shocks can arise unexpectedly. He emphasized the importance of maintaining focus on price stability and warned against calls from critics to broaden the SNB's mandate, labeling such demands as dangerous.
Investors are expected to closely watch the Consumer Price Index (CPI) data scheduled to be released by the Swiss Federal Statistical Office on Thursday. The CPI serves as the primary indicator for measuring inflation and changes in purchasing trends in Switzerland.
Gold prices fell in India on Monday, according to data from India's Multi Commodity Exchange (MCX).
Gold price stood at 71,900 Indian Rupees (INR) per 10 grams, down INR 216 compared with the INR 72,116 it cost on Friday.
As for futures contracts, Gold prices increased to INR 71,564 per 10 gms from INR 71,500 per 10 gms.
Prices for Silver futures contracts increased to INR 82,617 per kg from INR 82,496 per kg.
| Major Indian city | Gold Price |
|---|---|
| Ahmedabad | 74,450 |
| Mumbai | 74,245 |
| New Delhi | 74,250 |
| Chennai | 74,490 |
| Kolkata | 74,520 |
Global Market Movers: Comex Gold price struggles for a firm direcion amid mixed fundamental cues
- The US Bureau of Economic Analysis reported on Friday that the Personal Consumption Expenditures (PCE) Price Index rose 0.3% in March, while the yearly rate climbed to 2.7% from 2.5% in February, beating estimates for a reading of 2.6%.
- Meanwhile, the core PCE Price Index, which excludes volatile food and energy prices, held steady at 2.8% as compared to 2.6% anticipated, reaffirming hawkish Federal Reserve expectations and exerting pressure on the non-yielding Gold price on Comex.
- Further, Israel-Hamas peace talks in Cairo fuel optimism about the de-escalation of tensions in the Middle East, which further boosts investors' appetite for riskier assets and contributes to driving flows away from the safe-haven precious metal.
- That said, Ukraine attacked more Russian oil refineries over the weekend and also called on more military aid from the US over worsening conditions on the front lines, keeping geopolitical risks in play and lending support to the XAU/USD.
- Apart from this, evidence that inflation in the US is not easing as initially expected should act as a tailwind for the metal, which is seen as a hedge against inflation, ahead of the crucial two-day FOMC monetary policy meeting starting on Tuesday.
- Investors this week will also confront the release of important US macro data scheduled at the beginning of a new month, including the closely-watched monthly jobs data – popularly known as the Nonfarm Payrolls (NFP) report on Friday.
(An automation tool was used in creating this post.)
Gold FAQs
Gold has played a key role in human’s history as it has been widely used as a store of value and medium of exchange. Currently, apart from its shine and usage for jewelry, the precious metal is widely seen as a safe-haven asset, meaning that it is considered a good investment during turbulent times. Gold is also widely seen as a hedge against inflation and against depreciating currencies as it doesn’t rely on any specific issuer or government.
Central banks are the biggest Gold holders. In their aim to support their currencies in turbulent times, central banks tend to diversify their reserves and buy Gold to improve the perceived strength of the economy and the currency. High Gold reserves can be a source of trust for a country’s solvency. Central banks added 1,136 tonnes of Gold worth around $70 billion to their reserves in 2022, according to data from the World Gold Council. This is the highest yearly purchase since records began. Central banks from emerging economies such as China, India and Turkey are quickly increasing their Gold reserves.
Gold has an inverse correlation with the US Dollar and US Treasuries, which are both major reserve and safe-haven assets. When the Dollar depreciates, Gold tends to rise, enabling investors and central banks to diversify their assets in turbulent times. Gold is also inversely correlated with risk assets. A rally in the stock market tends to weaken Gold price, while sell-offs in riskier markets tend to favor the precious metal.
The price can move due to a wide range of factors. Geopolitical instability or fears of a deep recession can quickly make Gold price escalate due to its safe-haven status. As a yield-less asset, Gold tends to rise with lower interest rates, while higher cost of money usually weighs down on the yellow metal. Still, most moves depend on how the US Dollar (USD) behaves as the asset is priced in dollars (XAU/USD). A strong Dollar tends to keep the price of Gold controlled, whereas a weaker Dollar is likely to push Gold prices up.
European Central Bank (ECB) policymaker Pierre Wunsch said on Monday that a “July rate cut is not a done deal.”
Additional quotes
We are going with at least two rate cuts this year, barring any bad news.
We still want policy to remain a little restrictive.
Cutting rates again in July could be interpreted to mean we are going to cut at every meeting.
And that would lead to repricing that might go too far.
July decision should be about managing expectations.
I'm very comfortable with rate cut in June.
But if we only do two or three rate cuts, then should not communicate that at every meeting.
Would be very surprised if ECB does more than 25 bps rate cut in June.
Market reaction
Despite these comments from the ECB official, EUR/USD is paring back gains to test 1.0700, at the time of writing.
Here is what you need to know on Monday, April 29:
The Japanese Yen (JPY) registered impressive gains against its major rivals to start the week on a suspected intervention. The US economic docket will not offer any high-tier data releases on Monday. Germany's Destatis will release the preliminary Consumer Price Index (CPI) data for February.
USD/JPY climbed to a multi-decade high above 160.00 in the early trading hours of the Asian session on Monday. After retreating toward 159.50 area, the pair moved sideways near this level for a couple of hours before declining sharply. USD/JPY lost nearly 400 pips in the next hour and was last seen down 1.7% on the day at 155.60. When asked about the market view of an intervention, Japan’s top currency diplomat Masato Kanda declined to comment.
Japanese Yen sticks to strong intraday recovery gains near 155.00 against USD.
Japanese Yen price today
The table below shows the percentage change of Japanese Yen (JPY) against listed major currencies today. Japanese Yen was the strongest against the US Dollar.
| USD | EUR | GBP | CAD | AUD | JPY | NZD | CHF | |
| USD | -0.15% | -0.21% | -0.02% | -0.35% | -1.56% | -0.33% | -0.26% | |
| EUR | 0.14% | -0.07% | 0.13% | -0.19% | -1.41% | -0.18% | -0.11% | |
| GBP | 0.22% | 0.06% | 0.20% | -0.14% | -1.33% | -0.12% | -0.03% | |
| CAD | 0.01% | -0.14% | -0.20% | -0.33% | -1.63% | -0.33% | -0.27% | |
| AUD | 0.35% | 0.19% | 0.13% | 0.33% | -1.19% | 0.00% | 0.08% | |
| JPY | 1.54% | 1.38% | 1.31% | 1.52% | 1.17% | 1.20% | 1.27% | |
| NZD | 0.33% | 0.18% | 0.12% | 0.32% | -0.01% | -1.22% | 0.08% | |
| CHF | 0.26% | 0.11% | 0.04% | 0.24% | -0.10% | -1.30% | -0.09% |
The heat map shows percentage changes of major currencies against each other. The base currency is picked from the left column, while the quote currency is picked from the top row. For example, if you pick the Euro from the left column and move along the horizontal line to the Japanese Yen, the percentage change displayed in the box will represent EUR (base)/JPY (quote).
Pressured by the decline seen in USD/JPY, the US Dollar Index turned south on Monday and was last seen losing 0.45% on the day near 105.30. Meanwhile, the benchmark 10-year US Treasury bond yield holds steady above 4.6%, while US stock index futures trade modestly higher on the day. On Wednesday, the Federal Reserve will announce monetary policy decisions and the US Bureau of Labor Statistics will release April labor market data on Friday.
EUR/USD closed the previous week in positive territory and continued to edge higher early Monday. At the time of press, the pair was up 0.3% on the day at 1.0722.
GBP/USD registered marginal losses on Friday but regained its traction to start the week. The pair was last seen trading at its highest level in over two weeks at 1.2535.
Gold fell over 2% and snapped a five-week winning streak last week. XAU/USD holds steady early Monday and fluctuates in a tight channel above $2,330.
Japanese Yen FAQs
The Japanese Yen (JPY) is one of the world’s most traded currencies. Its value is broadly determined by the performance of the Japanese economy, but more specifically by the Bank of Japan’s policy, the differential between Japanese and US bond yields, or risk sentiment among traders, among other factors.
One of the Bank of Japan’s mandates is currency control, so its moves are key for the Yen. The BoJ has directly intervened in currency markets sometimes, generally to lower the value of the Yen, although it refrains from doing it often due to political concerns of its main trading partners. The current BoJ ultra-loose monetary policy, based on massive stimulus to the economy, has caused the Yen to depreciate against its main currency peers. This process has exacerbated more recently due to an increasing policy divergence between the Bank of Japan and other main central banks, which have opted to increase interest rates sharply to fight decades-high levels of inflation.
The BoJ’s stance of sticking to ultra-loose monetary policy has led to a widening policy divergence with other central banks, particularly with the US Federal Reserve. This supports a widening of the differential between the 10-year US and Japanese bonds, which favors the US Dollar against the Japanese Yen.
The Japanese Yen is often seen as a safe-haven investment. This means that in times of market stress, investors are more likely to put their money in the Japanese currency due to its supposed reliability and stability. Turbulent times are likely to strengthen the Yen’s value against other currencies seen as more risky to invest in.
- The Pound Sterling rises to a two-week high near 1.2550 amid an improved market mood.
- Investors see the BoE pivoting to interest rate cuts in the June or August meeting.
- The Fed’s policy decision on Wednesday and the NFP report on Friday will be the key events this week.
The Pound Sterling (GBP) prints a fresh two-week high against the US Dollar (USD) near 1.2550 in Monday’s London session. The GBP/USD pair advances due to cheerful market sentiment and a decline in the US Dollar. The Cable strengthens as mixed guidance from Bank of England (BoE) policymakers over the inflation outlook increases uncertainty about when the BoE will start its interest rate cuts cycle.
BoE Deputy Governor Dave Ramsden said in mid-April that the risks of inflation remaining elevated have receded. Ramsden predicted headline inflation would return to the 2% target in May and said it would likely remain at this level for the next two years.
On the contrary, a few other BoE policymakers, such as Chief Economist Huw Pill, Jonathan Haskel, and Catherine Mann, aren’t that optimistic about the inflation outlook. Most of them have referred to the core Consumer Price Index (CPI) as the preferred measure for decision-making on interest rates, which is still high due to stubborn service inflation. Last week, Pill said: “Time for cutting bank rate remains some way off.”
Financial markets are expecting that the BoE will pivot to rate cuts in the June or August meeting. "It is between June and August, and we are leaning slightly towards August on the basis that one of the key things the BoE is looking at is service inflation," said James Smith, an economist at ING Financial Markets. "If services inflation is a little bit stickier, I think that tilts the balance a little bit further towards August over June, but it's a pretty close call, to be honest", he added.
Daily digest market movers: Pound Sterling moves higher while US Dollar edges down
- The Pound Sterling rallies to 1.2550, capitalizing on improved market sentiment. S&P 500 futures have posted significant gains during the Asian session, suggesting an improvement in investors’ risk appetite. A slight decline in the US Dollar ahead of the Federal Reserve’s interest rate decision has also boosted the GBP/USD pair. However, firm expectations that the Fed will maintain the hawkish tone could support the US Dollar.
- The Fed is widely anticipated to hold interest rates steady in the range of 5.25%- 5.50% in its monetary policy meeting on Wednesday. Fed policymakers are expected to remain data-dependent for further decisions. The central bank will likely reiterate the need to gain more confidence before pivoting to rate cuts.
- A recent batch of consumer inflation data has not offered any relief to Fed policymakers. The United States core Personal Consumption Expenditure Price Index (PCE) data for March, released on Friday, indicated that higher service prices kept price pressures hotter than expected.
- Annually, the core PCE inflation data rose by 2.8%, higher than expectations of 2.6% and at the same pace as in February. The monthly inflation data grew parallel with the consensus and the prior release of 0.3%. The 0.3% growth in monthly core PCE is higher than needed for inflation to return to the desired rate of 2%.
- Apart from the Fed’s monetary policy decision, investors will also focus on the Institute for Supply Management (ISM) Manufacturing Purchasing Managers Index (PMI) data for April, which will be published on Wednesday. The ISM Manufacturing PMI is estimated to remain above the 50.0 threshold, which separates expansion from contraction. The factory data is seen at 50.1, lower than the prior reading of 50.3. The PMI survey by S&P Global for the same period showed a sharp decline in the scale of production and new orders due to inflationary pressures, weak demand and sufficient stock holdings at customers.
- Later this week, the US Nonfarm Payrolls (NFP) data will be the crucial event that will indicate the current status of the labor market.
Technical Analysis: Pound Sterling rebounds to H&S neckline
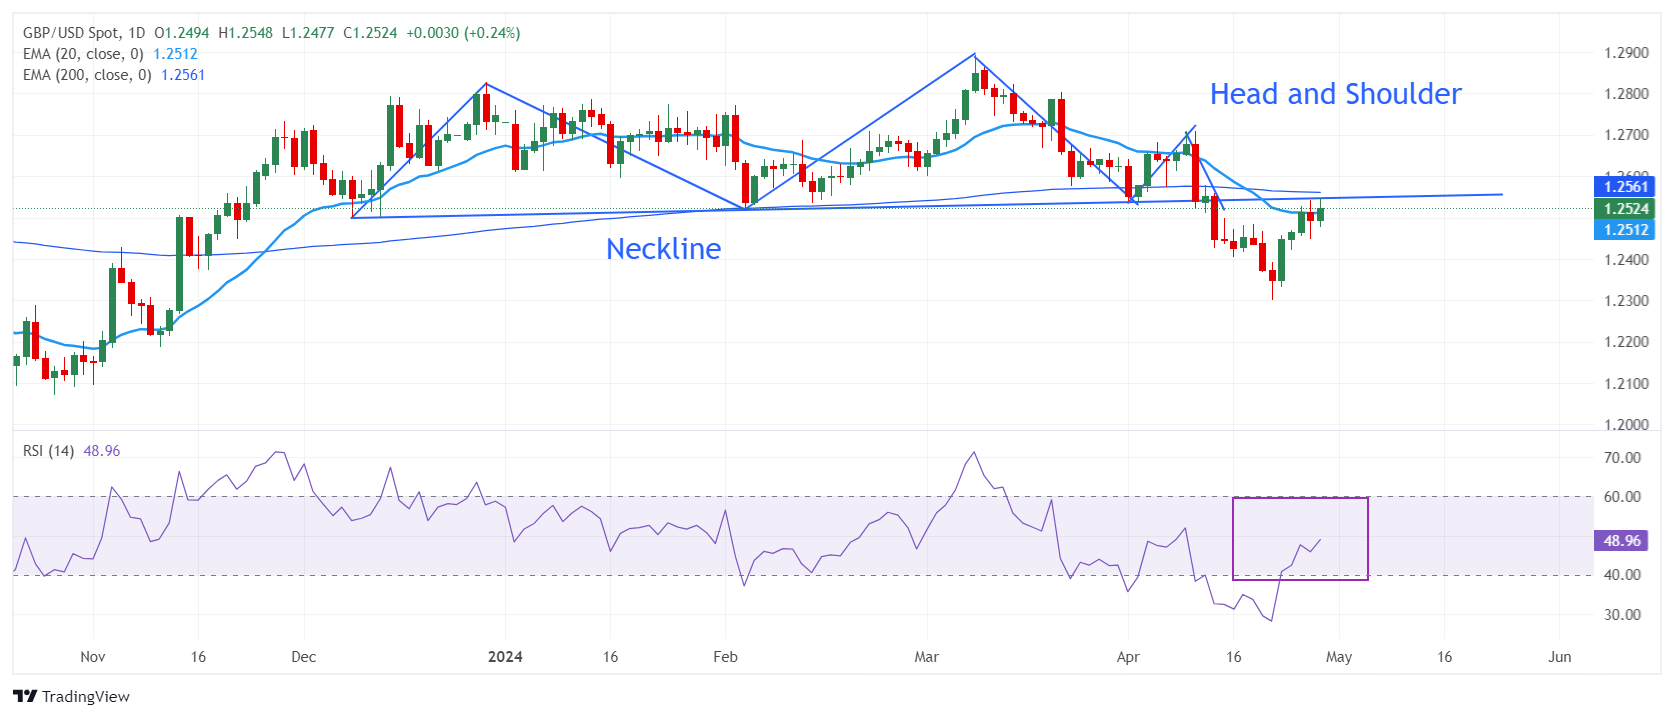
The Pound Sterling recovers losses registered in the last weeks and hovers near the neckline of the Head and Shoulder chart pattern. The neckline of the above-mentioned pattern is plotted from December 8 low around 1.2500.
The GBP/USD pair attempts to sustain above the 20-day Exponential Moving Average (EMA), at around 1.2510. The 200-day EMA, at 1.2550, is acting as a major barrier for the Pound Sterling bulls.
The 14-period Relative Strength Index (RSI) shifts into the 40.00-60.00 range, suggesting a consolidation ahead.
Pound Sterling FAQs
The Pound Sterling (GBP) is the oldest currency in the world (886 AD) and the official currency of the United Kingdom. It is the fourth most traded unit for foreign exchange (FX) in the world, accounting for 12% of all transactions, averaging $630 billion a day, according to 2022 data. Its key trading pairs are GBP/USD, aka ‘Cable’, which accounts for 11% of FX, GBP/JPY, or the ‘Dragon’ as it is known by traders (3%), and EUR/GBP (2%). The Pound Sterling is issued by the Bank of England (BoE).
The single most important factor influencing the value of the Pound Sterling is monetary policy decided by the Bank of England. The BoE bases its decisions on whether it has achieved its primary goal of “price stability” – a steady inflation rate of around 2%. Its primary tool for achieving this is the adjustment of interest rates. When inflation is too high, the BoE will try to rein it in by raising interest rates, making it more expensive for people and businesses to access credit. This is generally positive for GBP, as higher interest rates make the UK a more attractive place for global investors to park their money. When inflation falls too low it is a sign economic growth is slowing. In this scenario, the BoE will consider lowering interest rates to cheapen credit so businesses will borrow more to invest in growth-generating projects.
Data releases gauge the health of the economy and can impact the value of the Pound Sterling. Indicators such as GDP, Manufacturing and Services PMIs, and employment can all influence the direction of the GBP. A strong economy is good for Sterling. Not only does it attract more foreign investment but it may encourage the BoE to put up interest rates, which will directly strengthen GBP. Otherwise, if economic data is weak, the Pound Sterling is likely to fall.
Another significant data release for the Pound Sterling is the Trade Balance. This indicator measures the difference between what a country earns from its exports and what it spends on imports over a given period. If a country produces highly sought-after exports, its currency will benefit purely from the extra demand created from foreign buyers seeking to purchase these goods. Therefore, a positive net Trade Balance strengthens a currency and vice versa for a negative balance.
- USD/CAD loses momentum near 1.3645, losing 0.20% on Monday.
- The US Federal Reserve (Fed) is expected to leave the interest rate unchanged in its current 5.25%–5.50% range on Wednesday.
- The decline of crude oil weighs on the commodity-linked Loonie.
The USD/CAD pair weakens to 1.3645 during the early European trading hours on Monday. The decline of the US Dollar (USD) drags the pair lower to a nearly three-week low. In the absence of top-tier economic data release from Canada, the USD price dynamics will continue to play a key role in influencing the USD/CAD pair. The Federal Open Market Committee (FOMC) interest rate decision will be the highlight on Wednesday ahead of US employment data on Friday.
The two-day FOMC monetary policy meeting will end on Wednesday, with no change in rate expected. The tone of Fed Chair Jerome Powell and other policymakers will most likely be on the hawkish side. Fed Chair Jerome Powell noted that the US central bank needs more confidence that inflation is returning to its 2% target before cutting rates. Investors see a 25% chance that the Fed will cut interest rates in July, down from 50% last week. Additionally, financial markets have priced in nearly 60% odds that the Fed will lower the rate at its September meeting, according to the CME FedWatch tool.
About the data, US inflation, as measured by the Personal Consumption Expenditures (PCE) Price Index, climbed to 2.7% YoY in March from 2.5% in February, firmer than the market expectation of 2.6%. The Core PCE, the Fed's preferred inflation gauge, rose by 2.8% YoY in March, above the market consensus of 2.6%.
On the Loonie front, the Bank of Canada’s (BoC) governing council members were split on how long the central bank should wait before it begins lowering interest rates when they met earlier this month. Canada’s inflation rate was 2.9% in March, within the BoC's 1-3% target range, and Core inflation eased over the last few months. Markets widely expect the BoC to start cutting its policy rate in June or July. This, in turn, might weigh on the Canadian Dollar (CAD) and cap the USD/CAD’s downside.
Meanwhile, the decline of crude oil exerts some selling pressure on the commodity-linked Loonie, as Canada is the largest crude oil exporter to the United States (US).
- EUR/USD holds its position above the psychological level of 1.0700 amid a momentum shift toward an upward trend.
- The immediate barrier appears around the major level of 1.0750, aligned with the upper boundary of the descending channel.
- A break below 1.0700 could lead the pair toward the support level of 1.0650 and April’s low of 1.0601.
EUR/USD recovers its recent losses registered in the previous session, trading around 1.0720 during the Asian session on Monday. From a technical perspective, analysis indicates a weakening bearish sentiment for the pair as it continues to advance within the descending channel, breaching the key psychological level of 1.0700.
Furthermore, the lagging indicator Moving Average Convergence Divergence (MACD) suggests a shift toward upward momentum for the EUR/USD pair. Although positioned below the centerline, it exhibits divergence above the signal line.
The EUR/USD pair faces an immediate barrier at the major level of 1.0750, corresponding with the upper boundary of the descending channel. A successful breakthrough above this level could provide upward momentum for the pair, targeting the area near the psychological milestone of 1.0800, followed by April’s high at 1.0885.
On the downside, key support for the EUR/USD pair is anticipated around the psychological threshold of 1.0700, coinciding with major support at 1.0695. A breach below this level could exert downward pressure on the pair, potentially driving it toward the vicinity of the major support level at 1.0650. Further support levels may emerge around April’s low at 1.0601, aligning with the lower boundary of the descending channel.
EUR/USD: Daily Chart
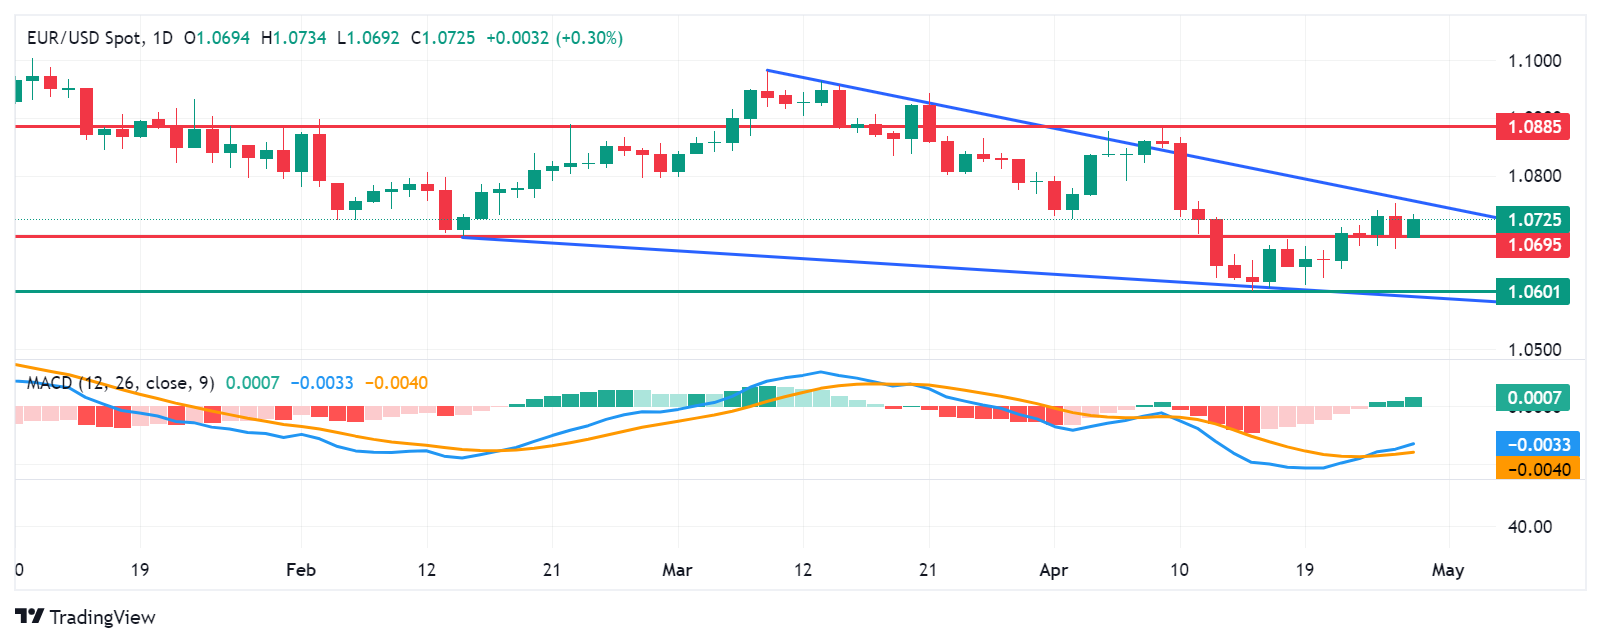
FX option expiries for Apr 29 NY cut at 10:00 Eastern Time, via DTCC, can be found below
- EUR/USD: EUR amounts
- 1.0650 559m
- 1.0710 686m
- 1.0720 579m
- 1.0725 480m
- 1.0740 1.4b
- GBP/USD: GBP amounts
- 1.2600 532m
- USD/CAD: USD amounts
- 1.3700 614m
- 1.3835 940m
- NZD/USD attracts fresh buyers on Monday and advances to over a two-week high.
- A positive risk tone undermines the Greenback and benefits the risk-sensitive Kiwi.
- Hawkish Fed expectations should limit the USD losses and cap the upside for the pair.
The NZD/USD pair gains strong positive traction on the first day of a new week and rallies to over a two-week high, around the 0.5980-0.5985 region during the Asian session.
Against the backdrop of receding fears of an Israel-Iran war, the latest optimism over Israel-Hamas peace talks in Cairo boosts investors' appetite for riskier assets. This is evident from a generally positive tone around the equity markets, which prompts some selling around the safe-haven US Dollar (USD) and benefits the risk-sensitive Kiwi. That said, hawkish Federal Reserve (Fed) expectations should help limit any meaningful USD downfall and cap the upside for the NZD/USD pair.
Investors seem convinced that the US central bank will keep interest rates higher for longer amid still sticky inflation and the bets were reaffirmed by the release of the Personal Consumption Expenditures (PCE) Price Index on Friday. The hawkish outlook, meanwhile, remains supportive of elevated US Treasury bond yields and supports prospects for the emergence of some USD dip-buying, warranting some caution before positioning for any further appreciating move for the NZD/USD pair.
Traders might also prefer to wait on the sidelines ahead of the crucial two-day FOMC monetary policy meeting starting on Tuesday. Apart from this, investors this week will confront the release of important US macro data scheduled at the beginning of a new month, including the closely-watched Nonfarm Payrolls (NFP) on Friday. This, in turn, will play a key role in influencing the near-term USD price dynamics and help in determining the next leg of a directional move for the NZD/USD pair.
Japan’s top currency diplomat Masato Kanda said on Monday that I won't comment now” when asked by reporters about the market view that Japan intervened in the currency market this morning.
His comments come after USD/JPY got heavily sold-off from above 160.00 to as low as 155.07. Markets speculated suspected Japanese FX market intervention on over 500-pips action in the pair.
At the time of writing, USD/JPY is still down 1.26% on the day to near 156.40.
Japanese Yen price today
The table below shows the percentage change of Japanese Yen (JPY) against listed major currencies today. Japanese Yen was the strongest against the US Dollar.
| USD | EUR | GBP | CAD | AUD | JPY | NZD | CHF | |
| USD | -0.19% | -0.25% | -0.08% | -0.45% | -1.25% | -0.43% | -0.29% | |
| EUR | 0.19% | -0.07% | 0.10% | -0.26% | -1.07% | -0.25% | -0.10% | |
| GBP | 0.27% | 0.07% | 0.17% | -0.19% | -0.98% | -0.17% | -0.02% | |
| CAD | 0.09% | -0.10% | -0.17% | -0.37% | -1.15% | -0.35% | -0.21% | |
| AUD | 0.45% | 0.26% | 0.19% | 0.36% | -0.78% | 0.02% | 0.16% | |
| JPY | 1.24% | 1.05% | 0.97% | 1.15% | 0.77% | 0.81% | 0.95% | |
| NZD | 0.44% | 0.24% | 0.17% | 0.34% | -0.02% | -0.81% | 0.18% | |
| CHF | 0.30% | 0.14% | 0.03% | 0.20% | -0.16% | -0.95% | -0.14% |
The heat map shows percentage changes of major currencies against each other. The base currency is picked from the left column, while the quote currency is picked from the top row. For example, if you pick the Euro from the left column and move along the horizontal line to the Japanese Yen, the percentage change displayed in the box will represent EUR (base)/JPY (quote).
- GBP/JPY moves downward after paring intraday gains, a movement possibly linked to intervention by Japanese authorities.
- The Pound Sterling has strengthened amidst market expectations of BoE holding off on lowering borrowing costs until the next quarter.
- The significant and enduring interest rate differential between Japan and other nations is anticipated to persist for some time.
GBP/JPY has pared its daily losses, moving downward toward 195.00 during the Asian session on Monday. The Japanese Yen (JPY) has shown significant intraday strength, possibly influenced by intervention by Japanese authorities to support the domestic currency. However, no official announcements are being made. It's noteworthy that Japanese markets are closed on Monday for Showa Day.
Last Friday, the Bank of Japan (BoJ) opted to maintain its policy settings unchanged, which initially exerted downward pressure on the JPY. However, the prevailing optimistic market sentiment has also played a role in diminishing the safe-haven appeal of the JPY. Consequently, these factors have collectively supported the GBP/JPY cross. Moreover, the anticipation of a prolonged and substantial interest rate gap between Japan and other countries suggests a bias for further depreciation in the trajectory of the Japanese Yen (JPY).
Meanwhile, in the UK, the Pound Sterling (GBP) has strengthened amidst market expectations that the Bank of England (BoE) will likely hold off on lowering borrowing costs until the next quarter, as indicated by median forecasts in a Reuters poll.
According to Reuters, Bank of England Chief Economist Huw Pill remarked last week that interest rate cuts are still not imminent. Moreover, persistent inflationary pressures and robust domestic Purchasing Managers Index (PMI) figures have pushed back expectations for the first BoE rate cut.
- Gold price ticks lower on Monday amid hawkish Fed expectations and a positive risk tone.
- A modest USD downtick helps limit the downside amid persistent geopolitical tensions.
- Traders also seem reluctant ahead of the FOMC meeting and key US macro data this week.
Gold price (XAU/USD) meets with some supply during the Asian session on Monday and erases a major part of its modest gains registered over the past two days. The US Personal Consumption Expenditures (PCE) Price Index released on Friday reaffirmed expectations that the Federal Reserve (Fed) will keep interest rates higher for longer, which, in turn, is seen driving flows away from the non-yielding yellow metal. Apart from this, a generally positive tone around the equity markets further contributes to the offered tone surrounding the safe-haven commodity, though the downside potential seems limited.
The US Dollar (USD) struggles to build on Friday's goodish bounce from a two-week low and kicks off the new week on a softer note, lending some support to the Gold price. Moreover, the Israel-Hamas conflict in the Gaza Strip, so far, has shown no signs of de-escalation. This, along with the protracted Russia-Ukraine war, keeps geopolitical risks in play and might continue to act as a tailwind for the XAU/USD. Traders might also prefer to wait for the outcome of the crucial two-day FOMC meeting on Wednesday and important US macro releases, including the Nonfarm Payrolls (NFP) report on Friday.
Daily Digest Market Movers: Gold price is undermined by a combination of factors, albeit lacking follow-through selling
- The US Bureau of Economic Analysis reported on Friday that the Personal Consumption Expenditures (PCE) Price Index rose 0.3% in March, while the yearly rate climbed to 2.7% from 2.5% in February, beating estimates for a reading of 2.6%.
- Meanwhile, the core PCE Price Index, which excludes volatile food and energy prices, held steady at 2.8% as compared to 2.6% anticipated, reaffirming hawkish Federal Reserve expectations and exerting pressure on the non-yielding Gold price.
- Further, Israel-Hamas peace talks in Cairo fuel optimism about the de-escalation of tensions in the Middle East, which further boosts investors' appetite for riskier assets and contributes to driving flows away from the safe-haven precious metal.
- That said, Ukraine attacked more Russian oil refineries over the weekend and also called on more military aid from the US over worsening conditions on the front lines, keeping geopolitical risks in play and lending support to the XAU/USD.
- Apart from this, evidence that inflation in the US is not easing as initially expected should act as a tailwind for the metal, which is seen as a hedge against inflation, ahead of the crucial two-day FOMC monetary policy meeting starting on Tuesday.
- Investors this week will also confront the release of important US macro data scheduled at the beginning of a new month, including the closely-watched monthly jobs data – popularly known as the Nonfarm Payrolls (NFP) report on Friday.
Technical Analysis: Gold price needs to break through $2,352-2,353 confluence for bulls to seize near-term control
From a technical perspective, last week's bounce from levels below the $2,300 mark faced rejection near the $2,352-2,353 confluence comprising the 50% Fibonacci retracement level of the recent pullback from the all-time peak and the 200-hour Simple Moving Average (SMA). The subsequent downfall, however, showed some resilience below the 100-hour SMA and stalled near the $2,320 area (23.6% Fibo. level), which should now act as a key pivotal point. A sustained break below could make the Gold price vulnerable to retesting last week's swing low, around the $2,292-2,291 region, before dropping to the next relevant support near the $2,268-2,265 zone.
On the flip side, bulls need to wait for a move beyond the $2,352-2,353 confluence hurdle before placing fresh bets. The Gold price might then accelerate the positive move towards the next relevant hurdle near the $2,371-2,372 region en route to the $2,400 round figure. The momentum could extend further towards the all-time peak, around the $2,431-2,432 area touched earlier this month.
Gold FAQs
Gold has played a key role in human’s history as it has been widely used as a store of value and medium of exchange. Currently, apart from its shine and usage for jewelry, the precious metal is widely seen as a safe-haven asset, meaning that it is considered a good investment during turbulent times. Gold is also widely seen as a hedge against inflation and against depreciating currencies as it doesn’t rely on any specific issuer or government.
Central banks are the biggest Gold holders. In their aim to support their currencies in turbulent times, central banks tend to diversify their reserves and buy Gold to improve the perceived strength of the economy and the currency. High Gold reserves can be a source of trust for a country’s solvency. Central banks added 1,136 tonnes of Gold worth around $70 billion to their reserves in 2022, according to data from the World Gold Council. This is the highest yearly purchase since records began. Central banks from emerging economies such as China, India and Turkey are quickly increasing their Gold reserves.
Gold has an inverse correlation with the US Dollar and US Treasuries, which are both major reserve and safe-haven assets. When the Dollar depreciates, Gold tends to rise, enabling investors and central banks to diversify their assets in turbulent times. Gold is also inversely correlated with risk assets. A rally in the stock market tends to weaken Gold price, while sell-offs in riskier markets tend to favor the precious metal.
The price can move due to a wide range of factors. Geopolitical instability or fears of a deep recession can quickly make Gold price escalate due to its safe-haven status. As a yield-less asset, Gold tends to rise with lower interest rates, while higher cost of money usually weighs down on the yellow metal. Still, most moves depend on how the US Dollar (USD) behaves as the asset is priced in dollars (XAU/USD). A strong Dollar tends to keep the price of Gold controlled, whereas a weaker Dollar is likely to push Gold prices up.
- EUR/JPY faces some sell-off to 166.65 in Monday’s Asian session.
- The Japanese Yen rebounds from a multi-decade low amid the likely FX intervention from the BoJ.
- The first reading of the German Consumer Price Index (CPI) will be published later on Monday.
The EUR/JPY cross loses traction to 166.65 during the Asian session on Monday. The cross reaches the intraday low of 166.36 after retracing from 171.60, the highest level since 2008. The downtick of the cross is supported by the speculation that the Bank of Japan (BoJ) might intervene in the foreign exchange (FX) market to prevent the Japanese Yen (JPY) from depreciation.
The Japanese policymakers warned in recent weeks that they will take the necessary steps to address excessive moves in the Yen if needed after the JPY weakens to a multi-decade low. The Japanese Yen recovers early Monday amid the likely FX intervention from the BoJ, but no official statement has been made thus far as it’s a holiday in Japan.
On the other hand, European Central Bank (ECB) policymakers noted that inflation in the Eurozone is cooling down and that the ECB is still likely to begin lowering its deposit rate from a record-high 4% in June. However, investors will take more cues from the incoming inflation data. The first reading of the German Consumer Price Index (CPI) will be due on Monday. On Wednesday, the Eurozone Gross Domestic Product (GDP) for Q1 and the Harmonized Index of Consumer Prices (HICP) will be released. If the reports show a hotter-than-expected outcome, this might lift the Euro (EUR) and cap the downside of the EUR/JPY cross.
- The Australian Dollar appreciates, propelled by an increasing hawkish sentiment surrounding the RBA.
- Australia’s Retail Sales could provide insight into consumer spending habits on Tuesday.
- The US Dollar retraces its recent gains due to the possible shift toward risk-on sentiment.
The Australian Dollar (AUD) continued its winning streak on Monday that began on April 22, trading around the three-week high of 0.6560. The AUD's upward momentum is fueled by increasing hawkish sentiment surrounding the Reserve Bank of Australia (RBA), spurred by last week's CPI inflation data surpassing expectations.
The Australian Financial Review reported that Warren Hogan, chief economic adviser at Judo Bank, anticipated that the RBA implement three cash rate hikes throughout 2024, ultimately reaching 5.1%, with the initial increase likely occurring in August. Investors are likely awaiting the March Retail Sales data, scheduled for release on Tuesday, as it provides insight into Australia's consumer spending habits, which significantly impact inflation and GDP trends.
The US Dollar Index (DXY), which measures the performance of the US Dollar (USD) against six major currencies, retraces its recent gains, possibly reflecting a shift toward risk-on sentiment in the market. However, market analysts anticipate that the US Federal Reserve (Fed) will maintain the current interest rate range of 5.25%–5.5% in its upcoming announcement on Wednesday, likely due to concerns over elevated inflation levels.
On Friday, the annual US Core Personal Consumption Expenditures (PCE) Price Index data for March showed an uptick, adding weight to the notion that the Fed may delay any potential rate cuts until September, as indicated by market speculation. According to the CME FedWatch Tool, the likelihood of the Federal Reserve's (Fed) interest rates remaining unchanged in the June meeting has risen to 87.7%, up from last week’s 81.7%.
Daily Digest Market Movers: Australian Dollar appreciates on growing hawkish sentiment surrounding RBA
- Monday saw a strong surge in Australia's stock market, driven by a bullish performance on Wall Street. The ASX 200 Index extended its gains on Monday, with all 11 industry sectors recording gains following the positive momentum on Wall Street on Friday, which was fueled by impressive earnings reports from tech giants like Microsoft and Alphabet, the parent company of Google, pushing the Nasdaq up by over 2%.
- TD Securities' recent revision indicated a delay in the expected rate cut by the Reserve Bank of Australia (RBA) until February 2025, shifting from the previously projected date in November. This update has strengthened the Australian Dollar (AUD), consequently boosting the AUD/JPY pair.
- US Personal Consumption Expenditures (PCE) - Price Index increased 0.3% month-over-month in March, the same as in February, and matching market forecasts. The annual rate edged up to 2.7%, above forecasts of 2.6%.
- The US Core PCE - Price Index, the Fed’s preferred gauge to measure inflation, rose by 2.8% YoY in March 2024. Figures came above market forecasts of 2.6%. On a monthly basis, Core PCE increased by 0.3%, matching February's reading and in line with market estimates.
- In the first quarter, the US Gross Domestic Product Annualized (Q1) expanded at a slower pace, falling short of market expectations. The deceleration in GDP growth suggests potential headwinds or slowdowns in various sectors of the economy.
- Australia’s Consumer Price Index (CPI) increased to an all-time high of 137.40 points in the first quarter of 2024 from 136.10 points in the fourth quarter of 2023.
Technical Analysis: Australian Dollar holds position around 0.6550
The Australian Dollar trades around 0.6560 on Monday. The pair has extended its advance within a symmetrical triangle formation, with the 14-day Relative Strength Index (RSI) positioned above the 50-level, affirming a bullish stance.
In terms of potential upward targets, the AUD/USD pair may set its sights on the psychological barrier at 0.6600 and subsequently aim for the upper boundary of the triangle, situated around 0.6639.
On the downside, immediate support is anticipated around the psychological threshold of 0.6500. Should this level be breached, it could pave the way for further downside momentum, with the subsequent notable support zone lying around 0.6443, followed by additional support levels at April’s low of 0.6362.
AUD/USD: Daily Chart
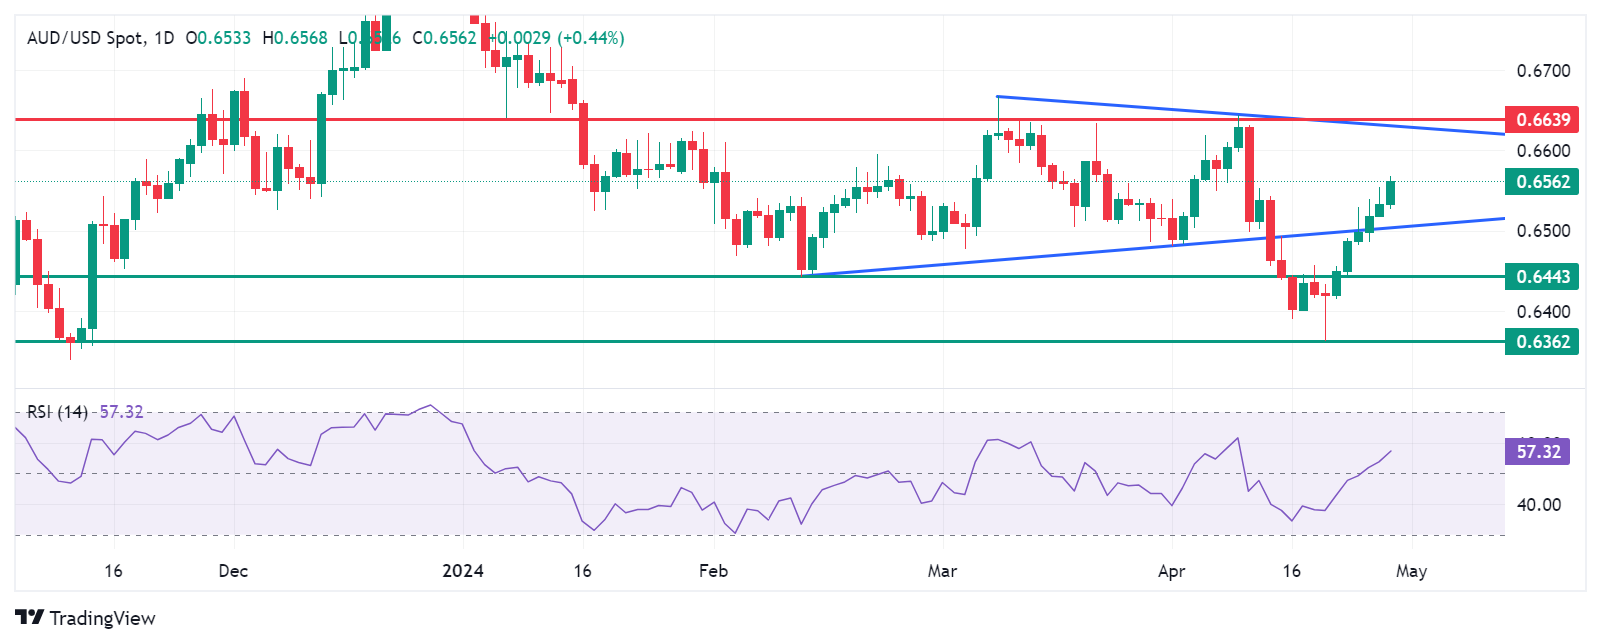
Australian Dollar price today
The table below shows the percentage change of the Australian Dollar (AUD) against listed major currencies today. The Australian Dollar was the strongest against the Japanese Yen.
| USD | EUR | GBP | CAD | AUD | JPY | NZD | CHF | |
| USD | -0.08% | -0.12% | -0.05% | -0.33% | 0.69% | -0.22% | -0.07% | |
| EUR | 0.11% | -0.01% | 0.06% | -0.22% | 0.81% | -0.11% | 0.03% | |
| GBP | 0.13% | 0.03% | 0.07% | -0.21% | 0.82% | -0.09% | 0.06% | |
| CAD | 0.05% | -0.04% | -0.07% | -0.28% | 0.75% | -0.17% | -0.03% | |
| AUD | 0.33% | 0.24% | 0.21% | 0.28% | 1.02% | 0.11% | 0.26% | |
| JPY | -0.68% | -0.80% | -0.84% | -0.75% | -1.04% | -0.95% | -0.76% | |
| NZD | 0.22% | 0.13% | 0.08% | 0.16% | -0.12% | 0.91% | 0.15% | |
| CHF | 0.08% | -0.03% | -0.06% | -0.01% | -0.27% | 0.75% | -0.15% |
The heat map shows percentage changes of major currencies against each other. The base currency is picked from the left column, while the quote currency is picked from the top row. For example, if you pick the Euro from the left column and move along the horizontal line to the Japanese Yen, the percentage change displayed in the box will represent EUR (base)/JPY (quote).
Australian Dollar FAQs
One of the most significant factors for the Australian Dollar (AUD) is the level of interest rates set by the Reserve Bank of Australia (RBA). Because Australia is a resource-rich country another key driver is the price of its biggest export, Iron Ore. The health of the Chinese economy, its largest trading partner, is a factor, as well as inflation in Australia, its growth rate and Trade Balance. Market sentiment – whether investors are taking on more risky assets (risk-on) or seeking safe-havens (risk-off) – is also a factor, with risk-on positive for AUD.
The Reserve Bank of Australia (RBA) influences the Australian Dollar (AUD) by setting the level of interest rates that Australian banks can lend to each other. This influences the level of interest rates in the economy as a whole. The main goal of the RBA is to maintain a stable inflation rate of 2-3% by adjusting interest rates up or down. Relatively high interest rates compared to other major central banks support the AUD, and the opposite for relatively low. The RBA can also use quantitative easing and tightening to influence credit conditions, with the former AUD-negative and the latter AUD-positive.
China is Australia’s largest trading partner so the health of the Chinese economy is a major influence on the value of the Australian Dollar (AUD). When the Chinese economy is doing well it purchases more raw materials, goods and services from Australia, lifting demand for the AUD, and pushing up its value. The opposite is the case when the Chinese economy is not growing as fast as expected. Positive or negative surprises in Chinese growth data, therefore, often have a direct impact on the Australian Dollar and its pairs.
Iron Ore is Australia’s largest export, accounting for $118 billion a year according to data from 2021, with China as its primary destination. The price of Iron Ore, therefore, can be a driver of the Australian Dollar. Generally, if the price of Iron Ore rises, AUD also goes up, as aggregate demand for the currency increases. The opposite is the case if the price of Iron Ore falls. Higher Iron Ore prices also tend to result in a greater likelihood of a positive Trade Balance for Australia, which is also positive of the AUD.
The Trade Balance, which is the difference between what a country earns from its exports versus what it pays for its imports, is another factor that can influence the value of the Australian Dollar. If Australia produces highly sought after exports, then its currency will gain in value purely from the surplus demand created from foreign buyers seeking to purchase its exports versus what it spends to purchase imports. Therefore, a positive net Trade Balance strengthens the AUD, with the opposite effect if the Trade Balance is negative.
- Indian Rupee trades in positive territory on the weaker USD on Monday.
- Analysts anticipate the RBI will continue to keep its policy rate steady at 6.5% in FY25, given India's robust economy.
- The Federal Open Market Committee (FOMC) monetary policy meeting on Wednesday will be in the spotlight.
Indian Rupee (INR) recovers some lost ground on Monday amid the softer US Dollar (USD) and lower crude oil prices. There is growing speculation that the US Federal Reserve (Fed) might delay rate cuts to September as inflation was stickier than expected and remains above the Fed’s 2% target. On the other hand, Morgan Stanley analysts expect the Reserve Bank of India (RBI) is unlikely to lower interest rates in the ongoing financial year due to India's robust economic growth. The higher-for-longer stance of the RBI might support the INR and cap the upside of USD/INR. However, the rising US Treasury bond yields and rebound in oil prices might drag the local currency lower.
Looking ahead, investors will keep an eye on the US ADP Employment Change, ISM Manufacturing PMI, and the Federal Open Market Committee (FOMC) interest rate decision on Wednesday. On Friday, attention will shift to the April employment data, including the Nonfarm Payrolls, Unemployment Rate, and Average Hourly Earnings. On the Indian docket, India’s HSBC Manufacturing PMI for April will be released on Thursday.
Daily Digest Market Movers: Indian Rupee gains ground amid multiple headwinds
Deloitte India estimates India's GDP growth at 6.6% in the current fiscal year, supported by consumption expenditure, exports rebound, and capital flows.
In contrast to the global scenario, the Indian economy continues to exhibit strong economic performance with broad-based growth across sectors, according to the Monthly Economic Review report of the Department of Economic Affairs under the Finance Ministry.
The US Personal Consumption Expenditures (PCE) Price Index, climbed by 2.7% YoY in March, compared to 2.5% in February, above the market consensus of 2.6%.
The Core PCE, excluding volatile food and energy prices, held steady at 2.8% YoY in March, stronger than the expectation of 2.6%.
On a monthly basis, both headline PCE and the core PCE Price Index were in line with market expectations, rising 0.3% in March.
According to the CME FedWatch tool, the chance of a rate cut by the July meeting fell from 50% last week to 25%, while traders have priced in nearly 60% odds that the Fed will cut the interest rate at its September meeting.
Technical analysis: USD/INR remains constructive in the longer term
The Indian Rupee trades stronger on the day. The bullish outlook of USD/INR remains intact as the pair is above the key 100-day Exponential Moving Average (EMA) on the daily timeframe. Additionally, the 14-day Relative Strength Index (RSI) holds in bullish territory above the 50 midline, indicating the path of least resistance is to the upside.
The first bullish target will emerge near a high of April 15 at 83.50. Any follow-through buying will see a rally to an all-time high of 83.72. The additional upside filter to watch is the 84.00 psychological level. On the flip side, the initial support level for the pair is seen near a low of April 26 at 83.23. The crucial downside target of USD/INR is located at the 83.10–83.15 zone, representing the confluence of the 100-day EMA and a low of April 10. A breach of this level will pave the way to a low of January 15 at 82.78.
US Dollar price today
The table below shows the percentage change of US Dollar (USD) against listed major currencies today. US Dollar was the strongest against the Japanese Yen.
| USD | EUR | GBP | CAD | AUD | JPY | NZD | CHF | |
| USD | -0.09% | -0.13% | -0.07% | -0.36% | 0.68% | -0.25% | -0.08% | |
| EUR | 0.09% | -0.05% | 0.02% | -0.27% | 0.78% | -0.16% | 0.02% | |
| GBP | 0.15% | 0.05% | 0.07% | -0.22% | 0.83% | -0.11% | 0.06% | |
| CAD | 0.07% | -0.03% | -0.07% | -0.29% | 0.76% | -0.18% | -0.03% | |
| AUD | 0.36% | 0.26% | 0.22% | 0.29% | 1.05% | 0.11% | 0.27% | |
| JPY | -0.68% | -0.80% | -0.86% | -0.78% | -1.07% | -0.96% | -0.78% | |
| NZD | 0.25% | 0.16% | 0.11% | 0.18% | -0.11% | 0.95% | 0.17% | |
| CHF | 0.09% | 0.01% | -0.05% | 0.01% | -0.27% | 0.76% | -0.17% |
The heat map shows percentage changes of major currencies against each other. The base currency is picked from the left column, while the quote currency is picked from the top row. For example, if you pick the Euro from the left column and move along the horizontal line to the Japanese Yen, the percentage change displayed in the box will represent EUR (base)/JPY (quote).
Indian Rupee FAQs
The Indian Rupee (INR) is one of the most sensitive currencies to external factors. The price of Crude Oil (the country is highly dependent on imported Oil), the value of the US Dollar – most trade is conducted in USD – and the level of foreign investment, are all influential. Direct intervention by the Reserve Bank of India (RBI) in FX markets to keep the exchange rate stable, as well as the level of interest rates set by the RBI, are further major influencing factors on the Rupee.
The Reserve Bank of India (RBI) actively intervenes in forex markets to maintain a stable exchange rate, to help facilitate trade. In addition, the RBI tries to maintain the inflation rate at its 4% target by adjusting interest rates. Higher interest rates usually strengthen the Rupee. This is due to the role of the ‘carry trade’ in which investors borrow in countries with lower interest rates so as to place their money in countries’ offering relatively higher interest rates and profit from the difference.
Macroeconomic factors that influence the value of the Rupee include inflation, interest rates, the economic growth rate (GDP), the balance of trade, and inflows from foreign investment. A higher growth rate can lead to more overseas investment, pushing up demand for the Rupee. A less negative balance of trade will eventually lead to a stronger Rupee. Higher interest rates, especially real rates (interest rates less inflation) are also positive for the Rupee. A risk-on environment can lead to greater inflows of Foreign Direct and Indirect Investment (FDI and FII), which also benefit the Rupee.
Higher inflation, particularly, if it is comparatively higher than India’s peers, is generally negative for the currency as it reflects devaluation through oversupply. Inflation also increases the cost of exports, leading to more Rupees being sold to purchase foreign imports, which is Rupee-negative. At the same time, higher inflation usually leads to the Reserve Bank of India (RBI) raising interest rates and this can be positive for the Rupee, due to increased demand from international investors. The opposite effect is true of lower inflation.
- WTI drifts lower on Monday amid concerns about slowing fuel demand.
- Geopolitical risks remain in play and should help limit any further losses.
- Traders now await this week’s central bank event risk and key macro data.
West Texas Intermediate (WTI) US crude Oil prices kick off the new week on a weaker note and slide below the $83.00/barrel mark during the Asian session.
Against the backdrop of receding fears about a further escalation of the Israel-Iran conflict, concerns that higher interest rates in the US will dent fuel demand in the world's top consumer and exert some pressure on the black liquid. The worries were reaffirmed by weaker-than-expected US Q1 GDP growth figures released last week.
Furthermore, the US Personal Consumption Expenditures (PCE) Price Index released on Friday cemented expectations that the Federal Reserve (Fed) will delay cutting interest rates. The hawkish outlook, meanwhile, remains supportive of the underlying bullish tone around the US Dollar (USD) and might continue to weigh on Crude Oil prices.
Meanwhile, Ukraine attacked more Russian oil refineries over the weekend. This comes after Russia announced more export and production cuts earlier this year, which, along with little signs of de-escalation of tensions in the Middle East, keep supply risks in play and should help limit any meaningful downside for Crude Oil prices.
Market participants now look forward to Tuesday's release of official PMI prints from China – the world's top Oil importer – for a fresh impetus. The focus will then shift to the outcome of a two-day FOMC policy meeting on Wednesday and important US macro data, including the NFP report, scheduled at the beginning of a new month.
Nevertheless, the aforementioned mixed fundamental backdrop warrants some caution before placing aggressive directional bets and positioning for a further intraday depreciating move in the absence of any relevant economic data from the US on Monday.
| Raw materials | Closed | Change, % |
|---|---|---|
| Silver | 27.193 | -0.83 |
| Gold | 2337.24 | 0.2 |
| Palladium | 953.03 | -3.13 |
- The Japanese Yen dives to a nearly 40-year low amid relatively thin liquidity on Monday.
- The divergent BoJ-Fed monetary policy and a positive risk tone weigh heavily on the JPY.
- Intervention fears cap USD/JPY amid a modest USD downtick and overbought conditions.
The Japanese Yen (JPY) remains under heavy selling pressure on the first day of a new week, pushing the USD/JPY pair above the 160.00 psychological mark for the first time since October 1986. A big divergence in the Bank of Japan's policy outlook and hawkish Federal Reserve expectations continue to undermine the JPY amid relatively thin liquidity on the back of a holiday in Japanese markets. That said, extremely overbought conditions and fears about a possible intervention from Japan to prop up its currency help limit further losses. Apart from this, a modest US Dollar (USD) downtick caps gains for the currency pair, though any meaningful JPY appreciation still seems elusive in the wake of the BoJ's uncertain rate outlook.
Furthermore, the US Personal Consumption Expenditures (PCE) Price Index released on Friday reaffirmed expectations that the Federal Reserve (Fed) will wait until September before cutting interest rates. This should continue to act as a tailwind for the Greenback. Apart from this, a generally positive risk tone could undermine the safe-haven JPY and suggests that the path of least resistance for the USD/JPY pair is to the upside ahead of the crucial two-day FOMC policy meeting starting on Tuesday. Investors this week will also confront the release of important US macro data scheduled at the beginning of a new month, including the closely-watched Nonfarm Payrolls (NFP) on Friday before placing fresh directional bets.
Daily Digest Market Movers: Japanese Yen is undermined by BoJ’s cautious approach towards further policy tightening
The Japanese Yen plummets to a fresh multi-decade low during the Asian session on Monday amid a big divergence in the Bank of Japan's policy outlook and hawkish Federal Reserve expectations, though intervention fears cap gains.
As was widely anticipated, the BoJ left its short-term interest rates unchanged on Friday and indicated that inflation was on track to hit the 2% target in coming years, suggesting its readiness to hike borrowing costs later this year.
In the post-meeting press conference, BoJ Governor Kazuo Ueda offered few clues on when the next rate hike will come and ruled out shifting to a full-fledged reduction in the bond purchases, warranting caution for the JPY bulls.
Moreover, the Tokyo Consumer Price Index released on Friday indicated that inflation in Japan is cooling, which, along with a generally positive tone around the equity markets, should cap any meaningful upside for the safe-haven JPY.
Japan's ruling Liberal Democratic Party lost three key by-election seats, which is not seen as a vote of confidence in Prime Minister Fumio Kishida and argued against him being reappointed at the end of the term in September.
The US Bureau of Economic Analysis reported that the Personal Consumption Expenditures (PCE) Price Index rose 0.3% in March, while the yearly rate climbed to 2.7% from 2.5% in February, beating estimates for a reading of 2.6%.
Adding to this, the core PCE Price Index, which excludes volatile food and energy prices, held steady at the 2.8% YoY rate as compared to 2.6% anticipated, reaffirming bets that the Federal Reserve will keep rates higher for longer.
According to the CME Group's FedWatch tool, investors are now pricing in a 58% chance that the Fed will begin its rate-cutting cycle in September, down from 68% a week ago, and a more than 80% possibility of easing in December.
This suggests that the wide gap in rates between Japan and the United States will remain for some time, which, along with a positive risk tone, should cap the upside for the safe-haven JPY and lend support to the USD/JPY pair.
Investors now look forward to this week's key central bank event risk – a two-day FOMC monetary policy meeting starting on Tuesday and the closely-watched US Nonfarm Payrolls (NFP) report – for a fresh directional impetus.
Technical Analysis: USD/JPY looks to build on Friday’s ascending channel breakout, overbought RSI warrants caution
From a technical perspective, Friday's breakout through an upward-sloping trend channel extending from the YTD low was seen as a fresh trigger for bullish traders. That said, the Relative Strength Index (RSI) on the daily chart is flashing extremely overbought conditions, which makes it prudent to wait for some near-term consolidation or a modest pullback before positioning for further gains. That said, any meaningful slide below the 159.00 mark is likely to attract fresh buyers near the 158.35-158.30 region and remain limited near the 158.00 mark. A convincing break below, however, might prompt some technical selling and drag the USD/JPY pair back towards the ascending channel resistance breakpoint near the 157.00 round figures. Bulls, meanwhile, will remain wary of placing fresh bets amid fears that Japanese authorities will intervene near the 160.00 pivotal point.
Japanese Yen FAQs
The Japanese Yen (JPY) is one of the world’s most traded currencies. Its value is broadly determined by the performance of the Japanese economy, but more specifically by the Bank of Japan’s policy, the differential between Japanese and US bond yields, or risk sentiment among traders, among other factors.
One of the Bank of Japan’s mandates is currency control, so its moves are key for the Yen. The BoJ has directly intervened in currency markets sometimes, generally to lower the value of the Yen, although it refrains from doing it often due to political concerns of its main trading partners. The current BoJ ultra-loose monetary policy, based on massive stimulus to the economy, has caused the Yen to depreciate against its main currency peers. This process has exacerbated more recently due to an increasing policy divergence between the Bank of Japan and other main central banks, which have opted to increase interest rates sharply to fight decades-high levels of inflation.
The BoJ’s stance of sticking to ultra-loose monetary policy has led to a widening policy divergence with other central banks, particularly with the US Federal Reserve. This supports a widening of the differential between the 10-year US and Japanese bonds, which favors the US Dollar against the Japanese Yen.
The Japanese Yen is often seen as a safe-haven investment. This means that in times of market stress, investors are more likely to put their money in the Japanese currency due to its supposed reliability and stability. Turbulent times are likely to strengthen the Yen’s value against other currencies seen as more risky to invest in.
Kyo News Agency reported late Sunday that Japan's ruling Liberal Democratic Party (LDP), headed by Prime Minister (PM) Fumio Kishida, lost three key seats in House of Representatives by-elections held earlier Sunday.
This comes even as the LDP chose not to contest in the Nagasaki and Tokyo by-elections. But it lost Shimane, a long-time held LDP prefecture.
The leading opposition Constitutional Democratic Party of Japan, led by left-leaning lower house lawmaker Kenta Izumi since November 2021, acquired all three seats by obtaining support from anti-LDP voters.
LDP Secretary General Toshimitsu Motegi, its No. 2 personnel after Kishida, told reporters in Tokyo, "We will humbly accept the results" of Sunday's by-elections, adding that the party "needs to work as one to grapple with the challenge."
Kishida's term as party president expires in September and the defeat is unlikely to work in his favor later this year.
- The Australian Dollar surges driven by growing hawkish sentiment surrounding RBA, following the hot CPI data.
- Judo Bank chief economic adviser Warren Hogan predicts that the RBA might increase the cash rate three times in 2024.
- The safe-haven JPY loses ground due to the uncertainty surrounding the BoJ's rate outlook.
AUD/JPY continues its winning streak for the sixth successive session on Monday, hovering around 104.50, a level not seen since April 2013. The persistent upward momentum of the AUD/JPY pair is driven by the increasing hawkish sentiment surrounding the Reserve Bank of Australia (RBA), following the release of last week's Consumer Price Index (CPI) inflation data.
The unexpected surge in inflation figures prompted economists to revise their earlier forecasts significantly. Warren Hogan, chief economic adviser at Judo Bank, told “The Australian Financial Review” his anticipation of the central bank raising the cash rate three times this year, reaching 5.1%, with the first hike likely in August. Investors now look forward to Retail Sales for March on Tuesday, which gauges Australia’s consumer spending. It has a significant bearing on Australia’s inflation and GDP.
The Japanese Yen (JPY) tumbled to new multi-decade lows following the Bank of Japan's (BoJ) decision to maintain policy settings unchanged on Friday. Uncertainty surrounding the BoJ's rate outlook, indications of cooling inflation in Japan, and a generally optimistic sentiment in equity markets are pivotal factors eroding the safe-haven appeal of the JPY.
Furthermore, expectations for a prolonged wide interest rate differential between Japan and the other countries imply that the JPY's trajectory is biased towards further decline. With Japanese markets closed on Monday for Showa Day, market dynamics may see limited shifts in the absence of trading activity.
Daily Digest Market Movers: AUD/JPY rises on increasing hawkish sentiment surrounding RBA
- Australia's stock market experienced a robust rally on Monday, inspired by a strong performance on Wall Street. The ASX 200 Index recovered some ground lost on Friday, with all 11 industry sectors trading in positive territory. Friday's rally on Wall Street was fueled by impressive earnings reports from tech giants such as Microsoft and Google's parent company, Alphabet, propelling the Nasdaq up by more than 2%
- On Friday, TD Securities' revision suggests a postponement of the anticipated rate cut by the Reserve Bank of Australia (RBA) until February 2025, shifting from the previously anticipated date in November. This development strengthens the Australian Dollar (AUD) and, in turn, bolsters the AUD/JPY pair.
- BoJ Governor Kazuo Ueda provided insights into the central bank's decision to maintain the status quo during the post-policy meeting press conference on Friday. Ueda outlined that the BoJ will adjust the degree of monetary easing if the underlying inflation rate rises. Additionally, He emphasized that easy financial conditions will be maintained for the time being, indicating the BoJ's commitment to supporting economic recovery and stability through accommodative monetary measures.
- Tokyo Consumer Price Index rose 1.8% YoY in April, well below the previous print of 2.6%. Markets were broadly expecting Tokyo inflation to hold steady over the period. The Core CPI fell sharply to 1.6% year-on-year, marking its lowest level since March 2022 and falling well below forecasts of 2.2%.
- On Friday, a report from Reuters said that the Bank of Japan (BOJ) is expected to project that inflation will remain close to its 2% target in the coming years and signal its preparedness to raise interest rates from their near-zero levels. This stance by the BOJ is aimed at preventing Yen depreciation and discouraging market participants from pushing the currency to fresh 34-year lows.
- Australia’s Consumer Price Index (CPI) increased to an all-time high of 137.40 points in the first quarter of 2024 from 136.10 points in the fourth quarter of 2023.
- As reported by the Japan Times, the percentage of Japanese companies aiming to raise their pay scales has surged to 70.7%, representing a notable increase of 6.3 percentage points compared to the prior year. Furthermore, the number of companies intending to implement pay-scale hikes and regular pay increases totaling 5% or higher has nearly doubled from the previous year, reaching 36.5%. This trend holds the potential to enhance the purchasing power of individuals, potentially leading to an uptick in consumer prices.
Technical Analysis: AUD/JPY surges to the major level of 104.50
The AUD/JPY trades around 104.50 on Monday, surpassing the upper boundary of the daily ascending channel. Additionally, the 14-day Relative Strength Index (RSI) is trending above the 50-level, strengthening the bullish sentiment. The immediate resistance is seen at the psychological level of 105.00. A breakthrough above this level could support the cross to test the highest level of 105.43 recorded in April 2013.
On the downside, immediate support for the AUD/JPY pair could be found at the psychological level of 104.00. If the pair breaches below this level, the AUD/JPY cross could lead to a further decline toward the nine-day Exponential Moving Average (EMA) at 101.59, aligned with the lower boundary of the ascending channel and a major level of 101.50.
AUD/JPY: Daily Chart
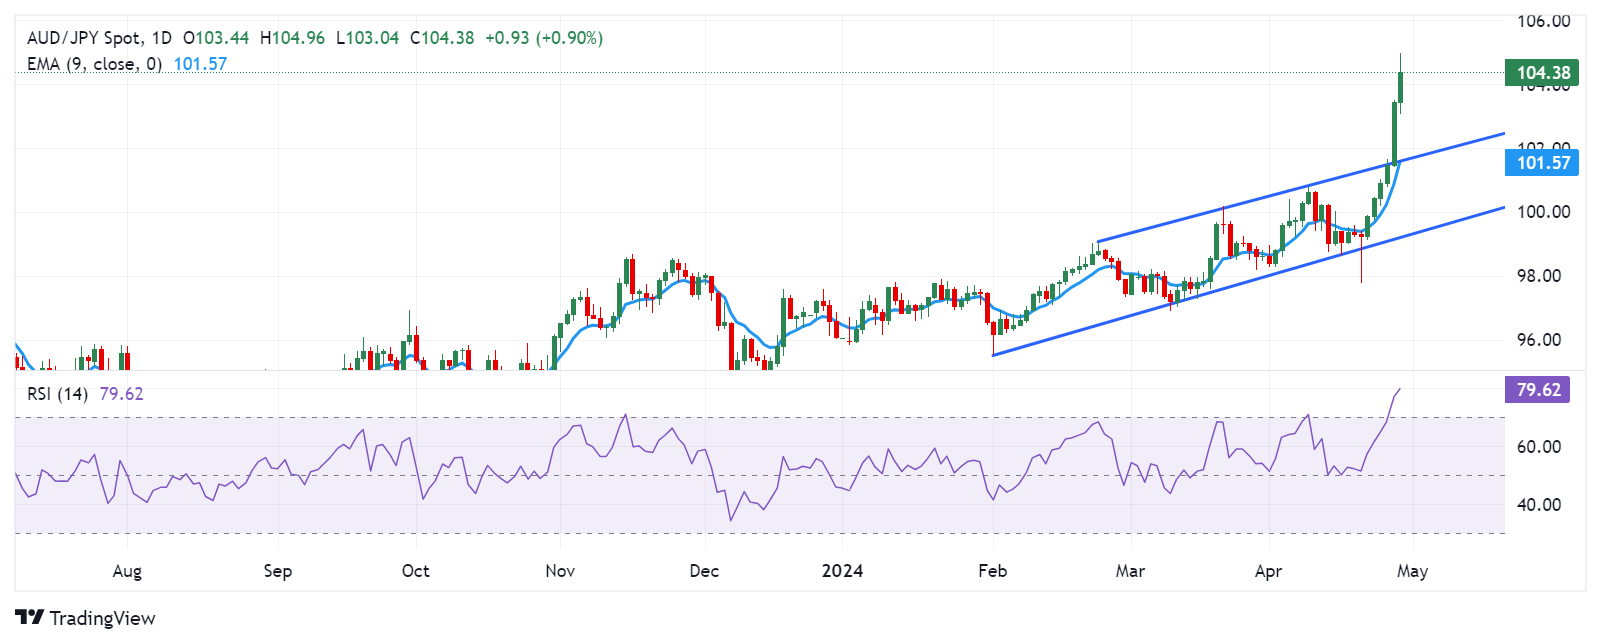
Australian Dollar price today
The table below shows the percentage change of the Australian Dollar (AUD) against listed major currencies today. The Australian Dollar was the strongest against the Japanese Yen.
| USD | EUR | GBP | CAD | AUD | JPY | NZD | CHF | |
| USD | -0.07% | -0.11% | -0.05% | -0.28% | 0.55% | -0.23% | -0.12% | |
| EUR | 0.07% | -0.04% | 0.01% | -0.21% | 0.61% | -0.15% | -0.04% | |
| GBP | 0.12% | 0.04% | 0.06% | -0.16% | 0.67% | -0.12% | 0.01% | |
| CAD | 0.05% | -0.02% | -0.06% | -0.22% | 0.61% | -0.18% | -0.08% | |
| AUD | 0.28% | 0.20% | 0.16% | 0.22% | 0.83% | 0.05% | 0.16% | |
| JPY | -0.63% | -0.71% | -0.76% | -0.69% | -0.94% | -0.87% | -0.76% | |
| NZD | 0.23% | 0.15% | 0.10% | 0.17% | -0.05% | 0.77% | 0.11% | |
| CHF | 0.13% | 0.06% | 0.00% | 0.06% | -0.16% | 0.66% | -0.11% |
The heat map shows percentage changes of major currencies against each other. The base currency is picked from the left column, while the quote currency is picked from the top row. For example, if you pick the Euro from the left column and move along the horizontal line to the Japanese Yen, the percentage change displayed in the box will represent EUR (base)/JPY (quote).
Australian Dollar FAQs
One of the most significant factors for the Australian Dollar (AUD) is the level of interest rates set by the Reserve Bank of Australia (RBA). Because Australia is a resource-rich country another key driver is the price of its biggest export, Iron Ore. The health of the Chinese economy, its largest trading partner, is a factor, as well as inflation in Australia, its growth rate, and Trade Balance. Market sentiment – whether investors are taking on more risky assets (risk-on) or seeking safe havens (risk-off) – is also a factor, with risk-on positive for AUD.
The Reserve Bank of Australia (RBA) influences the Australian Dollar (AUD) by setting the level of interest rates that Australian banks can lend to each other. This influences the level of interest rates in the economy as a whole. The main goal of the RBA is to maintain a stable inflation rate of 2-3% by adjusting interest rates up or down. Relatively high interest rates compared to other major central banks support the AUD, and the opposite for relatively low. The RBA can also use quantitative easing and tightening to influence credit conditions, with the former AUD-negative and the latter AUD-positive.
China is Australia’s largest trading partner so the health of the Chinese economy is a major influence on the value of the Australian Dollar (AUD). When the Chinese economy is doing well it purchases more raw materials, goods and services from Australia, lifting demand for the AUD, and pushing up its value. The opposite is the case when the Chinese economy is not growing as fast as expected. Positive or negative surprises in Chinese growth data, therefore, often have a direct impact on the Australian Dollar and its pairs.
Iron Ore is Australia’s largest export, accounting for $118 billion a year according to data from 2021, with China as its primary destination. The price of Iron Ore, therefore, can be a driver of the Australian Dollar. Generally, if the price of Iron Ore rises, AUD also goes up, as aggregate demand for the currency increases. The opposite is the case if the price of Iron Ore falls. Higher Iron Ore prices also tend to result in a greater likelihood of a positive Trade Balance for Australia, which is also positive of the AUD.
The Trade Balance, which is the difference between what a country earns from its exports versus what it pays for its imports, is another factor that can influence the value of the Australian Dollar. If Australia produces highly sought after exports, then its currency will gain in value purely from the surplus demand created from foreign buyers seeking to purchase its exports versus what it spends to purchase imports. Therefore, a positive net Trade Balance strengthens the AUD, with the opposite effect if the Trade Balance is negative.
- GBP/USD trades on a positive note around 1.2520 amid weaker USD on Monday.
- The recent US PCE inflation data dialed back their expectation of when the Federal Reserve (Fed) will start cutting interest rates.
- Investors increased their bets that the BoE will start cutting rates in June.
The GBP/USD pair holds positive ground near 1.2520 on Monday during the early Asian session. The uptick of the major pair is supported by the softer US Dollar (USD) below the 106.00 psychological mark. Investors will closely monitor the Federal Open Market Committee (FOMC) interest rate decision and Press Conference on Wednesday.
The US Federal Reserve (Fed) is expected to leave the interest rate unchanged in its current 5.25%–5.5% range on Wednesday. The US economy remains strong, and inflation has started to turn higher. On Friday, the US Bureau of Economic Analysis showed the Core Personal Consumption Expenditures (PCE) Price Index rose 2.8% YoY in March. These reports have triggered speculation that the first cut might not come until September.
The Fed policymakers noted that rate cuts are not coming in the next several months as inflation was stickier than expected and remains above the Fed’s 2% target. The higher-for-longer stance from the US central bank might provide some support to the Greenback and cap the downside of the GBP/USD pair.
On the other hand, investors raise their bets that the Bank of England (BoE) will start lowering borrowing costs in its June meeting. The BoE Governor Andrew Bailey said during the press conference after the last monetary policy meeting that two or three rate cuts this year are not "unreasonable." A dovish shift in the BoE remarks might lead to a weaker Pound Sterling (GBP) and create a headwind for the pair.
On Monday, the People’s Bank of China (PBoC) set the USD/CNY central rate for the trading session ahead at 7.1066 as compared to Friday's fix of 7.1056 and 7.2579 Reuters estimates.
- EUR/USD gains ground 1.0710 amid the softer USD on Monday.
- The US PCE inflation rose by 2.7% YoY in March, compared to 2.5% prior, which was hotter-than-expected.
- The ECB might cut interest rates before the Fed amid the cooler inflation in the Eurozone.
The EUR/USD pair trades on a stronger note around 1.0710 during the early Asian trading hours on Monday. The weaker US Dollar (USD) below the 106.00 mark provides some support to the major pair. The first reading of the German Consumer Price Index (CPI) for April is due on Monday. All eyes will be on the Federal Reserve monetary policy meeting on Wednesday, with no change in rate expected.
The recent US inflation data dialed back their expectation of when the Federal Reserve (Fed) will start cutting interest rates. According to the CME FedWatch tool, the chance of a rate cut by the July meeting falls from 50% last week to 25%, while traders have priced in nearly 60% odds that the Fed will cut the interest rate at its September meeting. This, in turn, might lift the Greenback and cap the upside of the EUR/USD pair in the near term.
The US Bureau of Economic Analysis revealed on Friday that the Personal Consumption Expenditures (PCE) Price Index rose by 2.7% YoY in March, compared to the previous reading of 2.5%, above the 2.6% estimated. The Core PCE figure, the Fed's preferred inflation measure, held steady at 2.8% YoY in March, firmer than the 2.6% expected. On a monthly basis, both headline PCE and the core PCE Price Index rose 0.3% in March.
Across the pond, the European Central Bank (ECB) emphasized cooler inflation in the Eurozone and signaled that the ECB might cut interest rates before the Fed. ECB President Christine Lagarde hinted that the central bank is still likely to begin lowering its deposit rate from a record-high 4% in June, but has been careful to leave open its options for the path beyond.
| Index | Change, points | Closed | Change, % |
|---|---|---|---|
| NIKKEI 225 | 306.28 | 37934.76 | 0.81 |
| Hang Seng | 366.61 | 17651.15 | 2.12 |
| KOSPI | 27.71 | 2656.33 | 1.05 |
| ASX 200 | -107.1 | 7575.9 | -1.39 |
| DAX | 243.73 | 18161.01 | 1.36 |
| CAC 40 | 71.59 | 8088.24 | 0.89 |
| Dow Jones | 153.86 | 38239.66 | 0.4 |
| S&P 500 | 51.54 | 5099.96 | 1.02 |
| NASDAQ Composite | 316.14 | 15927.9 | 2.03 |
| Pare | Closed | Change, % |
|---|---|---|
| AUDUSD | 0.6533 | 0.21 |
| EURJPY | 169.259 | 1.41 |
| EURUSD | 1.06941 | -0.33 |
| GBPJPY | 197.747 | 1.6 |
| GBPUSD | 1.24926 | -0.15 |
| NZDUSD | 0.59401 | -0.15 |
| USDCAD | 1.36679 | 0.08 |
| USDCHF | 0.91444 | 0.26 |
| USDJPY | 158.293 | 1.75 |
- Gold price edges lower to $2,335 in Monday’s early Asian session.
- The recent US inflation data added to market doubts about near-term US Fed rate cuts.
- Any escalating Middle East geopolitical tensions might boost safe-haven flows, benefiting precious metals.
Gold price (XAU/USD) trades on a softer note near $2,335 on Monday during the early Asian session. The recent US economic data showed that US inflationary pressures staying firm, which has added further to market doubts about near-term US Federal Reserve (Fed) rate cuts. On Wednesday, the Federal Reserve's (Fed) interest rate decision will be a closely watched event.
Meanwhile, the US Dollar Index (DXY), a measure of the value of the USD against a weighted basket of currencies used by US trade partners, drops to 106.00. The US Treasury bond yields edge lower, with the 10-year yield falling to 4.667%.
On Friday, the headline and Core Personal Consumption Expenditures (PCE) Price Index for March were in line with expectations, rising by 0.3% MoM. The annual headline inflation came in at 2.7% YoY in March from 2.5% in February, hotter than the 2.6% expected. Core PCE inflation increased by 2.8% YoY, above expectations of 2.6%.
Futures markets have priced in nearly 60% odds that the Fed will cut the interest rate at its September meeting, slightly more than before the report, according to the CME FedWatch tool. The US Fed is anticipated to keep the policy rate in its current 5.25%–5.5% range on Wednesday and to continue to signal no urgency on cuts. The hawkish stance in market sentiment could diminish the appeal of non-yielding metals and weigh on the gold price.
On Saturday, Hamas said that it was reviewing a fresh Israeli proposal for a cease-fire in Gaza. It came as Egypt intensified its attempts to secure an agreement between Israel and Hamas to halt the conflict and avoid an Israeli military invasion into the southern Gaza city of Rafah, per the Guardian. Gold traders will monitor the development surrounding the geopolitical risks in the Middle East. Any escalating tensions might boost traditional safe-haven assets like gold.


© 2000-2026. All rights reserved.
This site is managed by Teletrade D.J. LLC 2351 LLC 2022 (Euro House, Richmond Hill Road, Kingstown, VC0100, St. Vincent and the Grenadines).
The information on this website is for informational purposes only and does not constitute any investment advice.
The company does not serve or provide services to customers who are residents of the US, Canada, Iran, The Democratic People's Republic of Korea, Yemen and FATF blacklisted countries.
Making transactions on financial markets with marginal financial instruments opens up wide possibilities and allows investors who are willing to take risks to earn high profits, carrying a potentially high risk of losses at the same time. Therefore you should responsibly approach the issue of choosing the appropriate investment strategy, taking the available resources into account, before starting trading.
Use of the information: full or partial use of materials from this website must always be referenced to TeleTrade as the source of information. Use of the materials on the Internet must be accompanied by a hyperlink to teletrade.org. Automatic import of materials and information from this website is prohibited.
Please contact our PR department if you have any questions or need assistance at pr@teletrade.global.
transfers