- Analytics
- News and Tools
- Market News
CFD Markets News and Forecasts — 03-03-2021
| Time | Country | Event | Period | Previous value | Forecast |
|---|---|---|---|---|---|
| 00:30 (GMT) | Australia | Trade Balance | January | 6.785 | |
| 00:30 (GMT) | Australia | Retail Sales, M/M | January | -4.1% | 0.6% |
| 05:00 (GMT) | Japan | Consumer Confidence | February | 29.6 | |
| 09:30 (GMT) | United Kingdom | PMI Construction | February | 49.2 | |
| 10:00 (GMT) | Eurozone | Unemployment Rate | January | 8.3% | |
| 10:00 (GMT) | Eurozone | Retail Sales (YoY) | January | 0.6% | |
| 10:00 (GMT) | Eurozone | Retail Sales (MoM) | January | 2% | |
| 12:00 (GMT) | OPEC | OPEC Meetings | |||
| 13:30 (GMT) | Canada | Labor Productivity | Quarter IV | -10.3% | |
| 13:30 (GMT) | U.S. | Continuing Jobless Claims | February | ||
| 13:30 (GMT) | U.S. | Unit Labor Costs, q/q | Quarter IV | -7% | 6.6% |
| 13:30 (GMT) | U.S. | Nonfarm Productivity, q/q | Quarter IV | 4.6% | -4.6% |
| 13:30 (GMT) | U.S. | Initial Jobless Claims | February | ||
| 15:00 (GMT) | U.S. | Factory Orders | January | 1.1% | 1% |
| 17:05 (GMT) | U.S. | Fed Chair Powell Speaks | |||
| 21:30 (GMT) | Australia | AIG Services Index | February | 54.3 |
- Can't discount chance of growth surprise in H2 of 2021
- 2021 growth will be close to ECB's December projections
- 2021 inflation will be "clearly" above last ECB's forecast
The U.S. Energy Information Administration (EIA) revealed on Wednesday that crude inventories climbed by 21.563 million barrels in the week ended February 26. This marked the largest weekly build on record. Economists had forecast a drop of 0.928 million barrels.
At the same
time, gasoline stocks tumbled 13.624 million barrels, while analysts had
expected a decline of 2.300 million barrels. Distillate stocks plunged by 9.719
million barrels, while analysts had forecast a drop of 3.035 million barrels.
Meanwhile, oil
production in the U.S. jumped by 300,000 barrels a day to 10.000 million
barrels a day.
U.S. crude oil
imports averaged 6.3 million barrels per day last week, increased by 1.7
million barrels per day from the previous week.
The Institute
for Supply Management (ISM) reported on Wednesday that its non-manufacturing
index (NMI) came in at 55.3 in February, which was 3.4 percentage points lower
than unrevised January reading of 58.7 percent. The reading pointed to the growth in the services sector for the ninth
straight month but at the slowest pace since a contraction in May 2020.
Economists forecast
the index to remain at 58.7 last month. A reading above 50 signals expansion,
while a reading below 50 indicates contraction.
Of the 18
manufacturing industries, 17 reported gains last month, the ISM said, adding
that respondents were mostly optimistic about business recovery and the economy
even though production-capacity constraints, material shortages and challenges
in logistics and human resources were impacting the supply chain.
According to
the report, the ISM’s New Orders gauge declined 9.9 percentage points to 51.9
percent from the January reading, while its non-manufacturing Business Activity
measure fell 4.4 percentage points to 55.5 percent and the Employment indicator
went down 2.5 percentage points to 52.7 percent. Meanwhile, its Supplier
Deliveries index rose 3.0 percentage points to 60.8 percent and the Inventories
indicator surged 9.7 percentage points to 58.9 percent. Elsewhere, the Prices index
climbed 7.6 percentage points to 71.8 percent, indicating that prices increased in February, and at a
faster rate.
The latest
report by IHS Markit revealed on Wednesday the seasonally adjusted final IHS
Markit U.S. Services Business Activity Index (PMI) stood at 59.8 in February, up
from 58.3 in January and higher than the earlier released “flash” estimate of 58.9.
The latest reading pointed to the fastest expansion of business activity across
the U.S. service sector since July 2014.
Economists had
forecast the index to stay unrevised at 58.9.
According to
the report, firms linked
the February upturn to stronger client demand and a further rise in new
business. However, despite further pressure on capacity, service providers recorded
only a fractional increase in employment.
U.S. stock-index futures fell on Wednesday, as a renewed jump in U.S. Treasury yields and disappointing ADP's jobs data offset investors’ optimism about accelerating vaccine rollout in the U.S.
Global Stocks:
Index/commodity | Last | Today's Change, points | Today's Change, % |
Nikkei | 29,559.10 | +150.93 | +0.51% |
Hang Seng | 29,880.42 | +784.56 | +2.70% |
Shanghai | 3,576.90 | +68.31 | +1.95% |
S&P/ASX | 6,818.00 | +55.70 | +0.82% |
FTSE | 6,651.09 | +37.34 | +0.56% |
CAC | 5,834.10 | +24.37 | +0.42% |
DAX | 14,109.43 | +69.63 | +0.50% |
Crude oil | $60.41 | +1.10% | |
Gold | $1,711.90 | -1.25% |
FXStreet reports that the Credit Suisse analyst team notes that the S&P 500 Index remains capped at its near-term downtrend at 3910/15 and further consolidation should be allowed for ahead of a resumption of the core bull trend, with support at 3792/74 expected to remain a solid floor.
“S&P 500 stays sidelined near-term as looked for, holding key flagged support at 3792/74 – the early February price gap and rising 63-day average – but capped at its near-term downtrend, seen today at 3910 and our core outlook remains unchanged. We continue to see scope for a lengthier high-level consolidation phase, but with our broader outlook bullish and we look for a resumption of the core uptrend in due course.”
“Resistance moves to 3886/87 initially, with a break above 3910/15 needed to see the near-term downtrend break to suggest the core uptrend may have already resumed for a test next of the 3929/34 highs of last week.”
“Support remains seen at 3861 initially, then the upper end of the price gap from Monday morning at 3843, which we look to try and hold.”
(company / ticker / price / change ($/%) / volume)
3M Co | MMM | 177.5 | 0.39(0.22%) | 832 |
ALCOA INC. | AA | 28.22 | 0.72(2.62%) | 76343 |
ALTRIA GROUP INC. | MO | 44.81 | 0.09(0.20%) | 42027 |
Amazon.com Inc., NASDAQ | AMZN | 3,089.00 | -5.53(-0.18%) | 28394 |
American Express Co | AXP | 140.25 | 1.00(0.72%) | 626 |
Apple Inc. | AAPL | 124.72 | -0.40(-0.32%) | 1124112 |
AT&T Inc | T | 28.26 | 0.04(0.14%) | 168379 |
Boeing Co | BA | 224.95 | 1.81(0.81%) | 116460 |
Caterpillar Inc | CAT | 216 | 0.18(0.08%) | 10812 |
Chevron Corp | CVX | 103 | 0.56(0.55%) | 25517 |
Cisco Systems Inc | CSCO | 45.32 | -0.20(-0.43%) | 30866 |
Citigroup Inc., NYSE | C | 69.37 | 0.46(0.67%) | 31589 |
Deere & Company, NYSE | DE | 351 | -0.44(-0.13%) | 8719 |
Exxon Mobil Corp | XOM | 56.39 | 0.32(0.57%) | 179126 |
Facebook, Inc. | FB | 258.27 | -0.73(-0.28%) | 93458 |
FedEx Corporation, NYSE | FDX | 262.5 | 2.90(1.12%) | 1471 |
Ford Motor Co. | F | 12.6 | 0.05(0.40%) | 522325 |
Freeport-McMoRan Copper & Gold Inc., NYSE | FCX | 35.1 | -0.08(-0.23%) | 260708 |
General Electric Co | GE | 13.08 | 0.10(0.77%) | 529477 |
General Motors Company, NYSE | GM | 54.47 | 0.36(0.67%) | 136645 |
Goldman Sachs | GS | 332.51 | 1.57(0.47%) | 6549 |
Google Inc. | GOOG | 2,075.00 | -0.84(-0.04%) | 7267 |
Hewlett-Packard Co. | HPQ | 29.85 | -0.19(-0.63%) | 4835 |
Intel Corp | INTC | 60.52 | -0.72(-1.18%) | 105361 |
International Business Machines Co... | IBM | 120.99 | 0.66(0.55%) | 5834 |
Johnson & Johnson | JNJ | 159.6 | 0.58(0.36%) | 25977 |
JPMorgan Chase and Co | JPM | 151 | 0.99(0.66%) | 18323 |
McDonald's Corp | MCD | 209.25 | 0.58(0.28%) | 2050 |
Merck & Co Inc | MRK | 73.12 | 0.27(0.37%) | 35685 |
Microsoft Corp | MSFT | 232.45 | -1.42(-0.61%) | 119376 |
Nike | NKE | 137.05 | 0.03(0.02%) | 2852 |
Pfizer Inc | PFE | 33.54 | 0.03(0.09%) | 84985 |
Procter & Gamble Co | PG | 123.99 | 0.09(0.07%) | 4137 |
Starbucks Corporation, NASDAQ | SBUX | 107 | -0.20(-0.19%) | 7609 |
Tesla Motors, Inc., NASDAQ | TSLA | 681.33 | -5.11(-0.74%) | 437301 |
The Coca-Cola Co | KO | 50.05 | -0.05(-0.10%) | 32564 |
Twitter, Inc., NYSE | TWTR | 73.09 | -0.58(-0.79%) | 134000 |
UnitedHealth Group Inc | UNH | 336 | 1.36(0.41%) | 759 |
Wal-Mart Stores Inc | WMT | 130.34 | 0.23(0.18%) | 56719 |
Walt Disney Co | DIS | 195.51 | 1.57(0.81%) | 39187 |
Yandex N.V., NASDAQ | YNDX | 68.95 | 1.02(1.50%) | 7172 |
Microsoft (MSFT) resumed with a Buy at Citigroup; target $292
Oracle (ORCL) resumed with a Neutral at Citigroup; target $65
Tesla (TSLA) target raised to $730 from $325 at UBS; Neutral
Alcoa (AA) upgraded to Buy from Sell at Goldman; target raised to $32
Statistics
Canada announced on Wednesday that the value of building permits issued by the
Canadian municipalities climbed 8.2 percent m-o-m in January 2021, following a
revised 4.4 percent m-o-m drop in December 2020 (originally a decline of 4.1
percent m-o-m).
Economists had
forecast a 3.5 percent increase in January from the previous month.
According to
the report, the value of residential permits surged 10.6 percent m-o-m in January,
as single-family permits jumped 15.1 percent m-o-m, while permits for
multi-family dwellings rose 6.5 percent m-o-m.
At the same
time, the value of non-residential building permits increased 2.6 percent m-o-m
in January, due to gains in industrial (+31.7 percent m-o-m) and commercial (+3.3
percent m-o-m) permits, which, however, were partially offset by a decline in institutional
permits (-11.8 percent m-o-m).
In y-o-y terms,
building permits rose 6.4 percent in January.
The employment report prepared by Automatic Data Processing Inc. (ADP) and Moody's Analytics showed on Wednesday the U.S. private employers added 117,000 jobs in February.
Economists had expected an increase of 177,000.
The January
number saw an upward revision to 195,000 from the originally reported 174,000.
“The labor market continues to post a sluggish recovery across the board,” noted Nela Richardson, chief economist, ADP. “We’re seeing large-sized companies increasingly feeling the effects of COVID-19, while job growth in the goods producing sector pauses. With the pandemic still in the driver’s seat, the service sector remains well below its pre-pandemic levels; however, this sector is one that will likely benefit the most over time with reopenings and increased consumer confidence.”
- Says support for self-employed will continue until September
- Universal credit uplift of GBP20/week will continue for another 6 months
- Pledges to provide new "restart grant" for businesses in April
- Says retailers will receive up to GBP6,000 per premise
- Hospitality venues will receive up to GBP18,000 per premise
- Total direct cash support for businesses will rise to GBP25 billion (additional GBP5 billion)
- Introduces a new "recovery loan scheme"
- Businesses of any size can apply for loan of GBP25,000 to GBP10,000,000
- UK business rates holiday to be extended until June (GBP6 billion "tax cut")
- Reduced VAT rate for hospitality to be extended until end of September
- Stamp duty holiday for homebuyers to continue until 30 June
- Additional GBP65 billion to be provided for COVID-support measures
- Total COVID measures for this year and next is GBP352 billion
- Total fiscal support over this year and next amounts to GBP407 billion
- We are using the full measure of fiscal firepower to protect jobs
- UK corporate tax rate to be increased to 25% from 19% in 2023
- New higher rate of corporation tax will not apply to businesses with profits under GBP50,000
- Only 10% of companies will pay the full higher rate of corporation tax
Dollar Tree (DLTR) reported Q4 FY 2020 earnings of $2.13 per share (versus $1.79 per share in Q4 FY 2019), slightly beating analysts’ consensus estimate of $2.12 per share.
The company’s quarterly revenues amounted to $6.768 bln (+7.2% y/y), roughly in line with analysts’ consensus estimate of $6.784 bln.
DLTR fell to $95.89 (-3.09%) in pre-market trading.

- We must avoid premature rise in nominal rates
- Drop in real rates would make greater contribution to recovery given low inflation expectations
- Long-term interest rates developments must also be analysed alongside developments in rest of yield curve
- ECB stands ready to adjust all instruments as needed
- Eurozone is "long way" from inflation target
- ECB must continue to monitor FX developments even as upward euro pressure has eased
- ECB should set new inflation target at 2% with symmetry
| Time | Country | Event | Period | Previous value | Forecast | Actual |
|---|---|---|---|---|---|---|
| 07:30 | Switzerland | Consumer Price Index (MoM) | February | 0.1% | 0.4% | 0.2% |
| 07:30 | Switzerland | Consumer Price Index (YoY) | February | -0.5% | -0.3% | -0.5% |
| 08:50 | France | Services PMI | February | 47.3 | 43.6 | 45.6 |
| 08:55 | Germany | Services PMI | February | 46.7 | 45.9 | 45.7 |
| 09:00 | Eurozone | Services PMI | February | 45.4 | 44.7 | 45.7 |
| 09:30 | United Kingdom | Purchasing Manager Index Services | February | 39.5 | 49.7 | 49.5 |
| 10:00 | Eurozone | Producer Price Index (YoY) | January | -1.1% | -0.4% | 0% |
| 10:00 | Eurozone | Producer Price Index, MoM | January | 0.9% | 1.2% | 1.4% |
GBP rose against most of its major counterparts in the European session on Wednesday as market participants awaited the announcement of the UK's budget by the finance minister Rishi Sunak at 12:30 GMT.
It is expected that Sunak will pledge to do “whatever it takes”, including an extension of a massive jobs rescue plan, to support the economy during the final months of COVID-19 restrictions.
“First, we will continue doing whatever it takes to support the British people and businesses through this moment of crisis,” excerpts of Sunak's speech says. “Second, once we are on the way to recovery, we will need to begin fixing the public finances - and I want to be honest today about our plans to do that. And, third, in today’s budget we begin the work of building our future economy.”
FXStreet reports that UOB Group’s Head of Research Suan Teck Kin, CFA, and Senior Economist Alvin Liew assess the U.S. outlook.
“The recent US Treasury yields surge was attributed to the vaccine-driven reflation expectations, US to “go big” on fiscal stimulus, and inflation fears that could lead to earlier than expected monetary policy tightening.”
“Even though latest US inflation outcomes remained benign, they are lagging indicators and the crux of the issue is expectations of higher inflation have been building up, reflected in the jump in TIPS as well as consumer expectations.”
“The key supporting factors to US inflation in 2021 include the acceleration in growth of personal consumption. capital spending, housing, and inventory builds of which these sectors had been the main contributors to the US’ recovery process last year. The US savings rate is expected to normalise as US consumers resume their social and travel activities and increase spending. If the consumer spending surge is formidable, then so will be the inflation risk. The key downside for prices is the significant slack in the labour market.”
“We see US inflation rate to be trending higher, not yet at the “overheating” stage but the balance of risks is increasingly tilted to the upside. Our US 2021 growth forecast remains at 4.5% but risks are for even higher growth, potentially due to the upside on successful vaccine rollouts and more fiscal stimulus into the US economy. We now expect headline inflation forecast to average 1.7% in 2021 (from previous projection of 1.2%), with the risks also biased to the upside.”
The Mortgage
Bankers Association (MBA) reported on Wednesday the mortgage application volume
in the U.S. rose 0.5 percent in the week ended February 26, following a 11.4
percent plunge in the previous week. This marked the first weekly gain in the last
four weeks.
According to
the report, applications to purchase a home rose 1.8 percent, while refinance
applications edged up 0.1 percent.
Meanwhile, the
average fixed 30-year mortgage rate climbed from 3.08 percent to 3.23 percent,
the highest since the week ended July 5.
“Mortgage rates
jumped last week on market expectations of stronger economic growth and higher
inflation,” noted Joel Kan, MBA’s associate vice president of economic and
industry forecasting. “The 30-year fixed-rate experienced its largest
single-week increase in almost a year, reaching the highest [level] since July
2020.”
FXStreet reports that strategists at Credit Suisse appraise that Brent crude oil stays on course for the 2020 high at $71.75, despite the current pullback.
“Brent Crude is seeing a near-term pause but with a bull ‘flag’ continuation pattern in place, this is seen as a temporary and healthy breather ahead of further strength to the $71.75 high from last year. Whilst a fresh pullback below here will be looked for, a break can see next resistance at $79.10, the ‘measured flag objective’.”
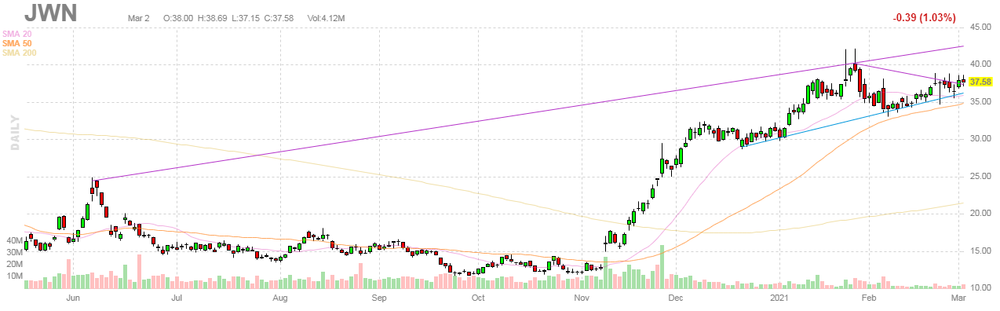
Nordstrom (JWN) reported Q4 FY 2020 earnings of $0.21 per share (versus $1.23 per share in Q4 FY 2019), missing analysts’ consensus estimate of $0.23 per share.
The company’s quarterly revenues amounted to $3.551 bln (-20.0% y/y), missing analysts’ consensus estimate of $3.589 bln.
JWN closed Tuesday's trading session at $37.58 (-1.03%).
Hewlett-Packard Enterprise (HPE) reported Q1 FY 2021 earnings of $0.52 per share (versus $0.44 per share in Q1 FY 2020), beating analysts’ consensus estimate of $0.41 per share.
The company’s quarterly revenues amounted to $6.833 bln (-1.7% y/y), beating analysts’ consensus estimate of $6.747 bln.
The company also issued upside guidance for Q2 FY 2021, projecting EPS of $0.38-0.44 versus analysts’ consensus estimate of $0.38.
For the full FY 2021, the company guided EPS of $1.70-1.88 versus analysts’ consensus estimate of $1.68.
HPE traded at $14.50 (0.00%) in pre-market trading.

FXStreet reports that FX Strategists at UOB Group note that USD/JPY keeps the constructive stance unchanged and could extend the upside momentum above the 107.00 level in the next weeks.
24-hour view: “We highlighted yesterday that ‘upward momentum remains lackluster and while USD could edge above the major resistance at 107.00 from here, it is unlikely able to maintain a foothold above this level’. Our expectation did not materialize as USD eased off after touching 106.94. Upward momentum has dissipated and for today, USD is likely to trade sideways between 106.50 and 106.95.”
Next 1-3 weeks: “In our latest narrative from yesterday, we highlighted that ‘further USD strength is not ruled out’ and that ‘the next resistance is at 107.00’. USD subsequently rose to 106.88 and from here; a breach of 107.00 would not be surprising. That said, lackluster shorter-term momentum suggests the pace of any further advance is likely to be slow and the next resistance at 107.35 may not come into the picture so soon.”
- Overall fiscal impulse, stemming from national budgets and EU recovery fund, needs to remain supportive in 2021 and 2022
- Beyond 2022, EU fiscal policies should continue to take into account strength of the recovery, degree of economic uncertainty and fiscal sustainability considerations
FXStreet notes that NZD/USD has performed strongly in the first two months of the year, extending a strong finish to the previous year and now to levels last seen in 2018. Patrick Bennett from CIBC Capital Markets expects to see further gains as activity recovers and forecast the kiwi at 0.75 in the coming months.
“We see NZD continuing tracking to stronger levels as the economy rebound continues and global reflation pricing supports commodity prices, though we doubt the same pace of gains seen to date will be repeated over the next quarter.”
“RBNZ, as other central banks have done, has reconfirmed its commitment to keep policy accommodative for some extended time.”
“We doubt there are tools available to change the NZD outcome over more than the short-term. We forecast gains for the NZD against the USD and JPY, and some underperformance against the AUD.”
German economy robust enough to deal with a longer weaker phase
German inflation to be slightly stronger than expected this year
Extended lockdowns into Q2 would only delay the recovery process
ECB can flexibly adjust pace of PEPP purchases if needed
We see spillovers from rising US borrowing costs
Must very carefully analyse rise in bond yields
Financing conditions are still favourable
FXStreet reports that according to strategists at Credit Suisse, rising real yields should put further pressure on gold.
“Gold has finally bowed to rising yields and the strengthening USD and key support at $1761 has been finally removed for the completion of a top. Although the 38.2% retracement of the 2018/2020 bull trend at $1726 is essentially holding for now we look for a clear break in due course for a fall to $1670 next, then $1620/15.”
According to the report from Eurostat, in January 2021, industrial producer prices rose by 1.4% in both the euro area and the EU, compared with December 2020. In December 2020, prices increased by 0.9% in both the euro area and the EU.
In January 2021, compared with January 2020, industrial producer prices remained stable in the euro area and increased by 0.2% in the EU.
Industrial producer prices in the euro area in January 2021, compared with December 2020, increased by 3.5% in the energy sector, by 1.2% for intermediate goods, by 0.4% for capital goods and for durable consumer goods and by 0.1% for non-durable consumer goods. Prices in total industry excluding energy increased by 0.8%. In the EU, industrial producer prices increased by 3.6% in the energy sector, by 1.2% for intermediate goods, by 0.4% for capital goods and for durable consumer goods and by 0.1% for non-durable consumer goods. Prices in total industry excluding energy increased by 0.7%.
According to the report from IHS Markit/CIPS, February data indicated that a degree of stability returned to the UK service sector after the sharp downturn in output at the start of 2021. Restrictions on travel, leisure and hospitality due to the national lockdown continued to curtail overall activity, but there were some pockets of growth in technology and business services. Staffing levels decreased at the slowest pace since the coronavirus disease 2019 (COVID-19) pandemic first hit employment numbers last March. Furlough arrangements again softened the degree of job shedding among consumer service providers, while there were also reports that improving optimism towards the business outlook had helped to stabilise employment. Vaccine roll out progress and confidence about the prospect of looser restrictions on trade resulted in a fourth consecutive monthly rise in business expectations across the service economy.
The headline seasonally adjusted UK Services PMI Business Activity Index registered 49.5 in February, up sharply from an eight-month low of 39.5 in January. The headline index has posted below the crucial 50.0 no-change mark in each month since November 2020, but the latest reading signalled the slowest decline in service sector output over this period.
According to the report from IHS Markit, the eurozone’s private sector economy experienced a further modest drop in output during February. Seasonally adjusted Eurozone PMI Composite Output Index posted 48.8 in February, up from January’s 47.8 and also higher than the earlier flash reading.
The latest data again indicated a broadly two-speed economy. On the one hand, manufacturing registered its strongest expansion of output in four months, fuelled by strengthened demand from both domestic and international sources. In stark contrast, the service sector - especially those areas impacted the most by social-contact restrictions – recorded another marked contraction of activity.
The modest fall in activity was again closely linked to a decline in new orders. Latest data showed that new business fell for a fifth successive month, though February’s rate of contraction was marginal. This partly reflected the strongest increase in new export business for nearly three years.
On the employment front, there was some positive news as a net increase (albeit marginal) was recorded for the first time in 12 months. Growth in employment was however limited by ongoing spare capacity, as evidenced by a fall in levels of work outstanding in February. Although marginal, the latest cut in backlogs extended the current period of continuous decline to two years.
The Eurozone PMI Services Business Activity Index remained mired below the 50.0 nochange mark to signal a sixth successive monthly reduction in service sector activity. The index was little changed since January’s 45.4, recording 45.7 in February.
FXStreet reports that economists at Credit Suisse discuss USD/CHF prospects.
“We see resistance initially at 0.9195/0.9208 – the November high and the 38.2% retracement of the 2020 fall. Next resistance thereafter is seen at 0.9296/0.9322, which is the 38.2% retracement of the entire fall from 2019, where we now expect to see a more concerted effort to cap and ideally see a resumption of the core bear trend later in the year. Post a deeper correction and possibly an extensive period of sideways ranging, we still eventually look for a resumption of weakness with support seen initially at 0.9046/27, below which would turn the risks back lower for a move to the current YTD low at 0.8758.”
| Time | Country | Event | Period | Previous value | Forecast | Actual |
|---|---|---|---|---|---|---|
| 00:30 | Australia | Gross Domestic Product (QoQ) | Quarter IV | 3.4% | 2.5% | 3.1% |
| 00:30 | Australia | Gross Domestic Product (YoY) | Quarter IV | -3.8% | -1.8% | -1.1% |
| 01:45 | China | Markit/Caixin Services PMI | February | 52.0 | 51.5 | |
| 07:30 | Switzerland | Consumer Price Index (MoM) | February | 0.1% | 0.4% | 0.2% |
| 07:30 | Switzerland | Consumer Price Index (YoY) | February | -0.5% | -0.3% | -0.5% |
During today's Asian trading, the US dollar rose against the euro and the yen, but fell against the pound and the Canadian dollar.
The ICE Dollar index, which shows the value of the US dollar against six major world currencies, fell by 0.07%
The dollar remains on the defensive amid a decline in US government bond yields, which makes the US currency less attractive to investors.
The yield on 10-year US Treasuries fell below 1.45% this week after jumping to a year-high of 1.6% a week earlier.
The Australian dollar declined against the US dollar, while the New Zealand dollar lost 0.14% against the US dollar amid continued investor optimism about the resumption of economic activity in both countries.
Australia's economy expanded by 3.1% in the October-December quarter after rising by a revised 3.4% in the July-September quarter, according to the country's Bureau of Statistics. Analysts had forecast a rise of just 2.5%.
Reuters reports that иritain's finance minister Rishi Sunak will promise on Wednesday to do "whatever it takes", including a five-month extension of a huge jobs rescue plan, to steer the economy through what he hopes will be the final months of COVID restrictions.
"We're using the full measure of our fiscal firepower to protect the jobs and livelihoods of the British people," Sunak will say, according to excerpts of his speech which is due to begin around 1230 GMT.
"First, we will continue doing whatever it takes to support the British people and businesses through this moment of crisis," he will tell parliament.
"Second, once we are on the way to recovery, we will need to begin fixing the public finances - and I want to be honest today about our plans to do that. And, third, in today's budget we begin the work of building our future economy."
EUR/USD
Resistance levels (open interest**, contracts)
$1.2204 (3459)
$1.2161 (2317)
$1.2126 (4011)
Price at time of writing this review: $1.2098
Support levels (open interest**, contracts):
$1.2062 (3856)
$1.2033 (4209)
$1.1994 (7379)
Comments:
- Overall open interest on the CALL options and PUT options with the expiration date March, 5 is 103858 contracts (according to data from March, 2) with the maximum number of contracts with strike price $1,1950 (7379);
GBP/USD
Resistance levels (open interest**, contracts)
$1.4155 (304)
$1.4110 (398)
$1.4068 (1862)
Price at time of writing this review: $1.3978
Support levels (open interest**, contracts):
$1.3932 (209)
$1.3876 (175)
$1.3837 (315)
Comments:
- Overall open interest on the CALL options with the expiration date March, 5 is 15354 contracts, with the maximum number of contracts with strike price $1,4250 (2483);
- Overall open interest on the PUT options with the expiration date March, 5 is 18596 contracts, with the maximum number of contracts with strike price $1,3500 (1331);
- The ratio of PUT/CALL was 1.21 versus 1.20 from the previous trading day according to data from March, 2
* - The Chicago Mercantile Exchange bulletin (CME) is used for the calculation.
** - Open interest takes into account the total number of option contracts that are open at the moment.
According to the report from the Federal Statistical Office (FSO), the consumer price index (CPI) increased by 0.2% in February 2021 compared with the previous month, reaching 100.2 points (December 2020 = 100). Inflation was –0.5% compared with the same month of the previous year.
The 0.2% increase compared with the previous month can be explained by several factors including rising prices for clothing and footwear due to the end of the seasonal sales. Housing rentals also recorded a price increase, as did fuel. In contrast, prices for berries and medical products decreased
In January 2021, the Swiss Harmonised Index of Consumer Prices (HICP) stood at 100.24 points (base 2015=100). This corresponds to a rate of change of 0.0% compared with the previous month and of –0.6% compared with the same month the previous year.
In February 2021, the Swiss Harmonised Index of Consumer Prices (HICP) stood at 100.32 points (base 2015 = 100). This corresponds to a rate of change of +0.1% compared with the previous month and of 0.4% compared with the same month the previous year. Due to the effects of the pandemic, the same missing price imputation techniques used for the CPI were introduced for the HICP.
CNBC reports that the Chinese government is set to kick off an annual parliamentary meeting this week for approving national priorities for 2021.
The otherwise generally symbolic meeting takes on particular significance this year as it marks the beginning of China’s five-year development plan — the 14th such in the country’s history — and the 100th anniversary of the ruling Communist Party.
Authorities are expected to lay out details on topics ranging from employment targets to management of the semi-autonomous region of Hong Kong.
The “Two Sessions” parliamentary meeting is slated to begin Thursday with the opening of the Chinese People’s Political Consultative Conference, an advisory body. The National People’s Congress legislature is scheduled to kick off its annual gathering on Friday.
That’s usually when the government releases its economic work report, a document laying out GDP, employment, inflation and other growth goals.
Most economists do not expect authorities will release a GDP target this year, after making a rare decision not to do so at last year’s parliamentary meeting, which was delayed by about two months due to the coronavirus pandemic.
RTTNews reports that according to the report from the Australian Bureau of Statistics, Australia's gross domestic product gained a seasonally adjusted 3.1 percent on quarter in the fourth quarter of 2020. That beat forecasts for an increase of 2.5 percent following the upwardly revised 3.4 percent gain in the previous three months (originally 3.3 percent).
On a yearly basis, GDP was down 1.1 percent - again exceeding expectations for a decline of 1.8 percent after sinking 3.8 percent in the three months prior.
Capital expenditure was up 3.6 percent on quarter after slipping 0.1 percent in Q3. The GDP deflator gained 1.1 percent on quarter, accelerating from 0.6 percent in the previous quarter.
Domestic final demand contributed 3.2 percentage points to GDP growth. Household final consumption expenditure contributed 2.3 percentage points as constraints on households and businesses continued to lift. Private investment contributed a further 0.7 percentage points to growth.
Spending by households rose 4.3 percent this quarter but remained 2.7 percent down through the year.
The household saving to income ratio declined to 12.0 percent from 18.7 percent last quarter, remaining at elevated levels. Falls in gross disposable income and increases in household consumption both contributed to the decline in saving.
Private investment rose 3.9 percent for the quarter. Both housing and business investment increased, supported by government initiatives and improvements in conditions.
| Raw materials | Closed | Change, % |
|---|---|---|
| Brent | 62.83 | -1.38 |
| Silver | 26.762 | 0.97 |
| Gold | 1738.547 | 0.91 |
| Palladium | 2358.55 | 0.42 |
| Time | Country | Event | Period | Previous value | Forecast |
|---|---|---|---|---|---|
| 00:30 (GMT) | Australia | Gross Domestic Product (QoQ) | Quarter IV | 3.3% | |
| 00:30 (GMT) | Australia | Gross Domestic Product (YoY) | Quarter IV | -3.8% | |
| 01:45 (GMT) | China | Markit/Caixin Services PMI | February | 52.0 | |
| 07:30 (GMT) | Switzerland | Consumer Price Index (MoM) | February | 0.1% | |
| 07:30 (GMT) | Switzerland | Consumer Price Index (YoY) | February | -0.5% | |
| 08:50 (GMT) | France | Services PMI | February | 47.3 | 43.6 |
| 08:55 (GMT) | Germany | Services PMI | February | 46.7 | 45.9 |
| 09:00 (GMT) | Eurozone | Services PMI | February | 45.4 | 44.7 |
| 09:30 (GMT) | United Kingdom | Purchasing Manager Index Services | February | 39.5 | 49.7 |
| 10:00 (GMT) | Eurozone | Producer Price Index (YoY) | January | -1.1% | |
| 10:00 (GMT) | Eurozone | Producer Price Index, MoM | January | 0.8% | |
| 13:15 (GMT) | U.S. | ADP Employment Report | February | 174 | 125 |
| 13:30 (GMT) | Canada | Building Permits (MoM) | January | -4.1% | 3.5% |
| 14:45 (GMT) | U.S. | Services PMI | February | 58.3 | 58.9 |
| 15:00 (GMT) | U.S. | FOMC Member Harker Speaks | |||
| 15:00 (GMT) | U.S. | ISM Non-Manufacturing | February | 58.7 | 58.5 |
| 15:30 (GMT) | U.S. | Crude Oil Inventories | February | 1.285 | |
| 17:00 (GMT) | U.S. | FOMC Member Bostic Speaks | |||
| 18:00 (GMT) | U.S. | FOMC Member Charles Evans Speaks | |||
| 19:00 (GMT) | U.S. | Fed's Beige Book | |||
| 20:15 (GMT) | New Zealand | RBNZ Gov Orr Speaks | |||
| 23:05 (GMT) | U.S. | FOMC Member Kaplan Speak |
| Pare | Closed | Change, % |
|---|---|---|
| AUDUSD | 0.78207 | 0.66 |
| EURJPY | 128.966 | 0.34 |
| EURUSD | 1.20885 | 0.33 |
| GBPJPY | 148.907 | 0.26 |
| GBPUSD | 1.39579 | 0.28 |
| NZDUSD | 0.72923 | 0.38 |
| USDCAD | 1.26373 | -0.05 |
| USDCHF | 0.91429 | -0.05 |
| USDJPY | 106.679 | 0.03 |


© 2000-2026. All rights reserved.
This site is managed by Teletrade D.J. LLC 2351 LLC 2022 (Euro House, Richmond Hill Road, Kingstown, VC0100, St. Vincent and the Grenadines).
The information on this website is for informational purposes only and does not constitute any investment advice.
The company does not serve or provide services to customers who are residents of the US, Canada, Iran, The Democratic People's Republic of Korea, Yemen and FATF blacklisted countries.
Making transactions on financial markets with marginal financial instruments opens up wide possibilities and allows investors who are willing to take risks to earn high profits, carrying a potentially high risk of losses at the same time. Therefore you should responsibly approach the issue of choosing the appropriate investment strategy, taking the available resources into account, before starting trading.
Use of the information: full or partial use of materials from this website must always be referenced to TeleTrade as the source of information. Use of the materials on the Internet must be accompanied by a hyperlink to teletrade.org. Automatic import of materials and information from this website is prohibited.
Please contact our PR department if you have any questions or need assistance at pr@teletrade.global.
transfers