- Analytics
- News and Tools
- Market News
CFD Markets News and Forecasts — 03-08-2022
- NZD/USD struggles to defend buyers inside monthly rising wedge bears formation.
- Steady RSI, receding bullish bias of MACD tease sellers.
- Previous resistance line from April adds to the downside filters.
- Bulls have a bumpy road to the north unless crossing 0.6565 hurdle.
NZD/USD retreats towards 0.6250, fading the bounce off 21-DMA inside a one-month-old rising wedge bearish pattern amid Thursday’s initial Asian session.
In addition to the latest failures to defend buyers, the steady RSI (14) and the receding bullish bias of the MACD also teases the NZD/USD sellers.
However, a clear downside break of the aforementioned rising wedge’s support line, at 0.6245 by the press time, appears necessary for the bears.
Even so, the 21-DMA and the resistance-turned-support line from April, respectively around 0.6215 and 0.6100, could challenge the NZD/USD downside momentum before highlighting the yearly low marked in July at around 0.6060.
Alternatively, recovery moves may aim for the 0.6300 round figure ahead of the stated wedge’s upper line, close to 0.6380 at the latest.
Following that, highs marked in mid-June and a two-month-old horizontal resistance line, near 0.6400 and 0.6570 in that order, will be crucial hurdles to watch.
To sum up, NZD/USD buyers have limited upside room while the sellers can easily retake control.
NZD/USD: Daily chart
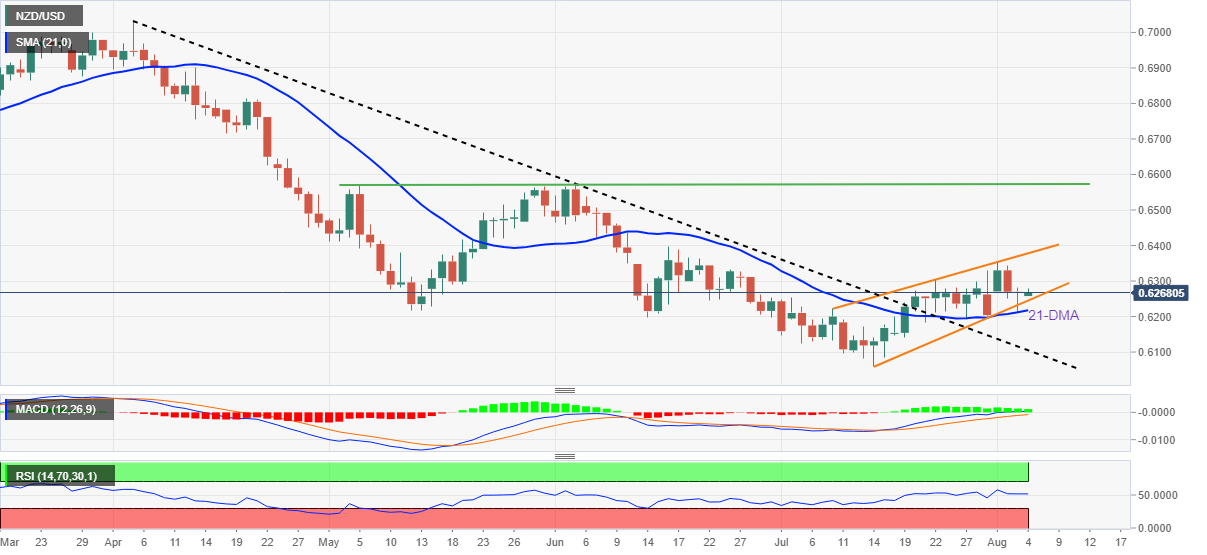
Trend: Pullback expected
- Gold price is turning to a balanced auction profile ahead of US NFP data.
- Soaring interest rates and a halt in the recruitment process by US firms will weigh on job opportunities.
- A preliminary estimate for the US NFP is 250k, lower than the prior release of 372k.
Gold price (XAU/USD) is displaying topsy-turvy moves above the immediate cushion of $1,760.00 in the early Asian session. Earlier, the precious metal displayed a responsive buying action after hitting a low of $1,756.00 on Wednesday. The bright metal defended its two-day low and has climbed to near $1,764.00. Going forward, the FX domain will prepare a base for the release of the US Nonfarm Payrolls (NFP), which will determine the further direction for the asset.
There is no denying the fact that rising interest rates by the Federal Reserve (Fed) have forced the corporate players to inculcate extra filters while scrutiny of the investment opportunities. Firms are doing a lot of brainstorming before investing costly dollars in projects. This has accelerated the odds of serious damage to the job creation process.
Apart from that, commentaries from giant techs discussing halting the recruitment process for the remaining year will result in a steep fall in employment opportunities. Therefore, investors have estimated 250k job additions in the labor market in the month of July against June’s print of 372k. A vulnerable figure from this number could drive gold prices significantly higher.
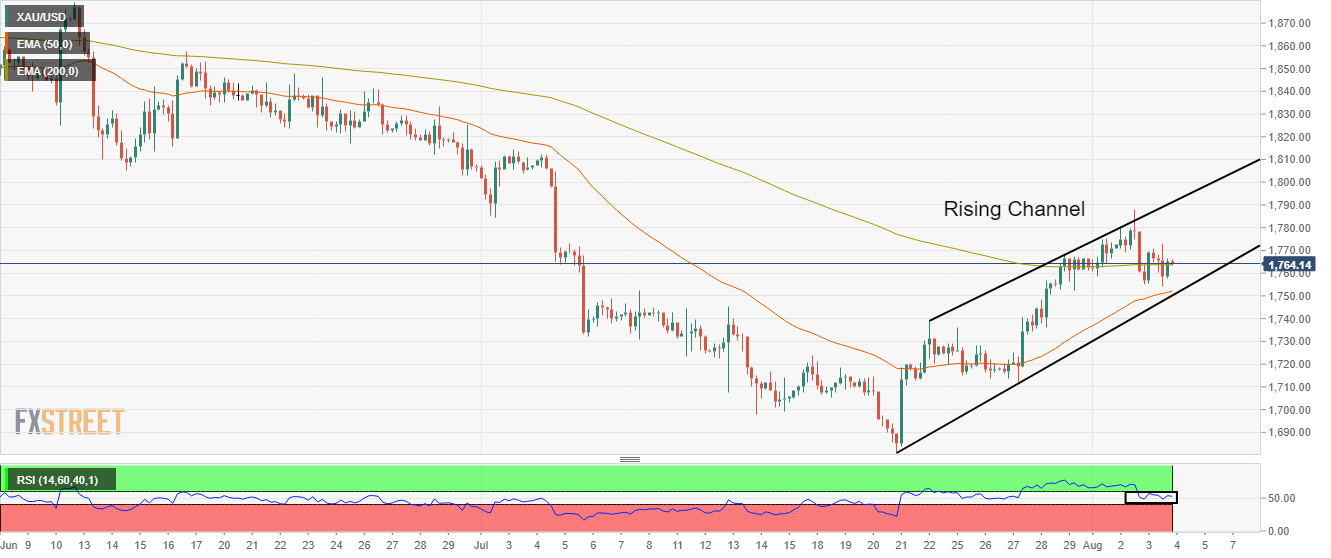
Gold technical analysis
On a four-hour scale, the gold prices will find significant bids near the lower portion of the Rising Channel placed from July 21 low at $1,681.87 while the upper portion is plotted from July 22 high at $1,739.37.
The gold prices are overlapping with the 200-period Exponential Moving Average (EMA) at $1,764.11, which indicates a make-or-break scenario for the gold bulls. While the 50-EMA at $1,752.16 is advancing will indicates an upside ahead.
Meanwhile, the Relative Strength Index (RSI) (14) has shifted into the 40.00-60.00 range, which indicates a consolidation ahead.
Gold four-hour chart
- AUD/JPY climbs almost 0.07% as the Asian session begins.
- An ascending wedge in the hourly chart might exert downward pressure on the pair.
- A break above 93.30 will find solid resistance around 93.70-85.
The AUD/JPY snaps four straight days of losses and escalates above the 100-day EMA at 92.73 as the Asian Pacific session begins. On Wednesday, the AUD/JPY started trading near the day’s lows at 91.72 before rallying towards the daily high at 93.225, for a gain of almost 150 pips. At the time of writing, the AUD/JPY is trading at 93.09.
AUD/JPY Price Analysis: Technical outlook
In the daily chart, the AUD/JPY trades within the boundaries of a descending channel and sits at the mid-central line, shy of the August 3 high at 93.22. Although the price is above the 100-day EMA, keeping the neutral-to-upwards bias intact, the Relative Strength Index (RSI) oscillates in bearish territory, signaling sellers could be leaning around the aforementioned area.
A break above 93.23 would pave the way for buyers to test the confluence of the 20 and 50-day EMAs around 93.73-82.
Otherwise, if AUD/JPY buyers struggle and the pair tumbles below 93.00, a fall towards the 100-day EMA at 92.73 is on the cards.
AUD/JPY 1-hour chart
In the near term, the AUD/JPY is neutral to downwards biased. Worth noting that although trending up for the last couple of days, price action formed an ascending-wedge, with bearish implications. Additionally, AUD/JPY sellers are lurking around solid resistance in the 93.31-93.60 area, a confluence of the August 1 high and the 200-hour EMA.
A break below the ascending-wedge bottom trendline will exacerbate a fall towards the daily pivot at 92.70. Once cleared, the cross could tumble towards the confluence of the S1 pivot and the 50-hour EMA at 92.05.
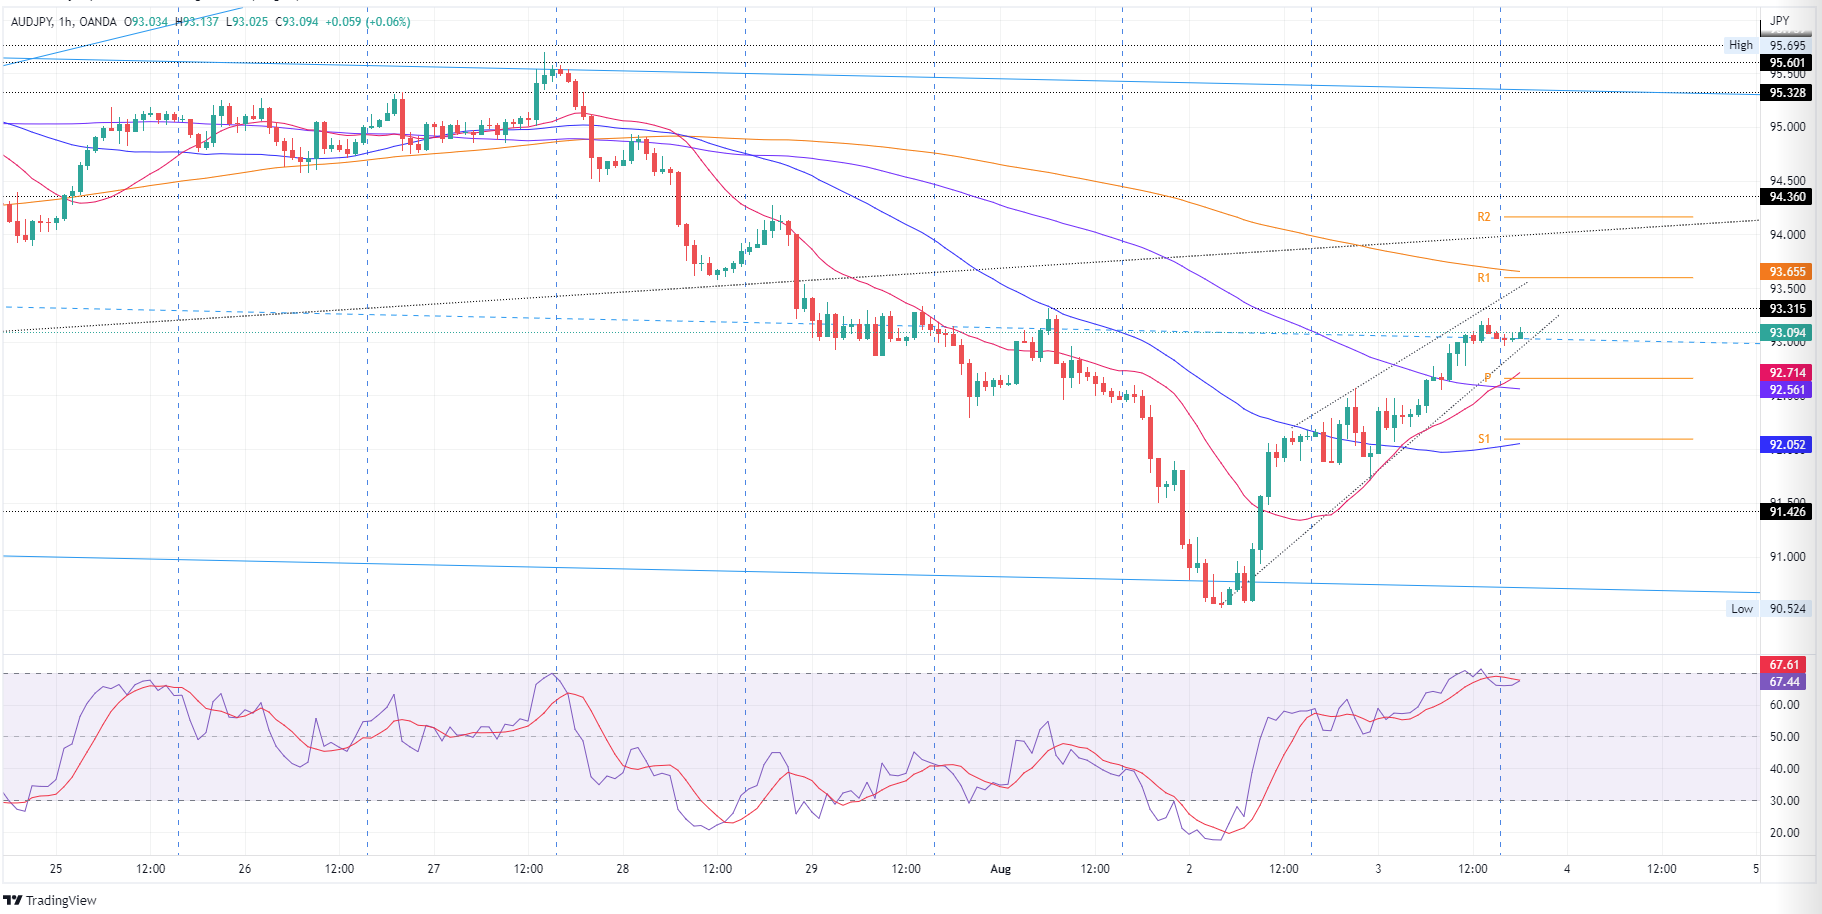
AUD/JPY Key Technical Levels
- USD/CAD holding up in the 1.2830s and a correction to mitigate the price imbalance between spot and 1.2865.
- Bears need a break of 1.2820 with the downside price imbalance between 1.2800 and 1.2780 then eyed.
As per the prior analysis, USD/CAD Price Analysis: Bulls eye 1.2880 but bears are lurking, the bulls have moved in for a deeper test of the bear's commitments but have since come under pressure. The focus is on the downside at this juncture for a daily extension.
USD/CAD daily chart, prior analysis
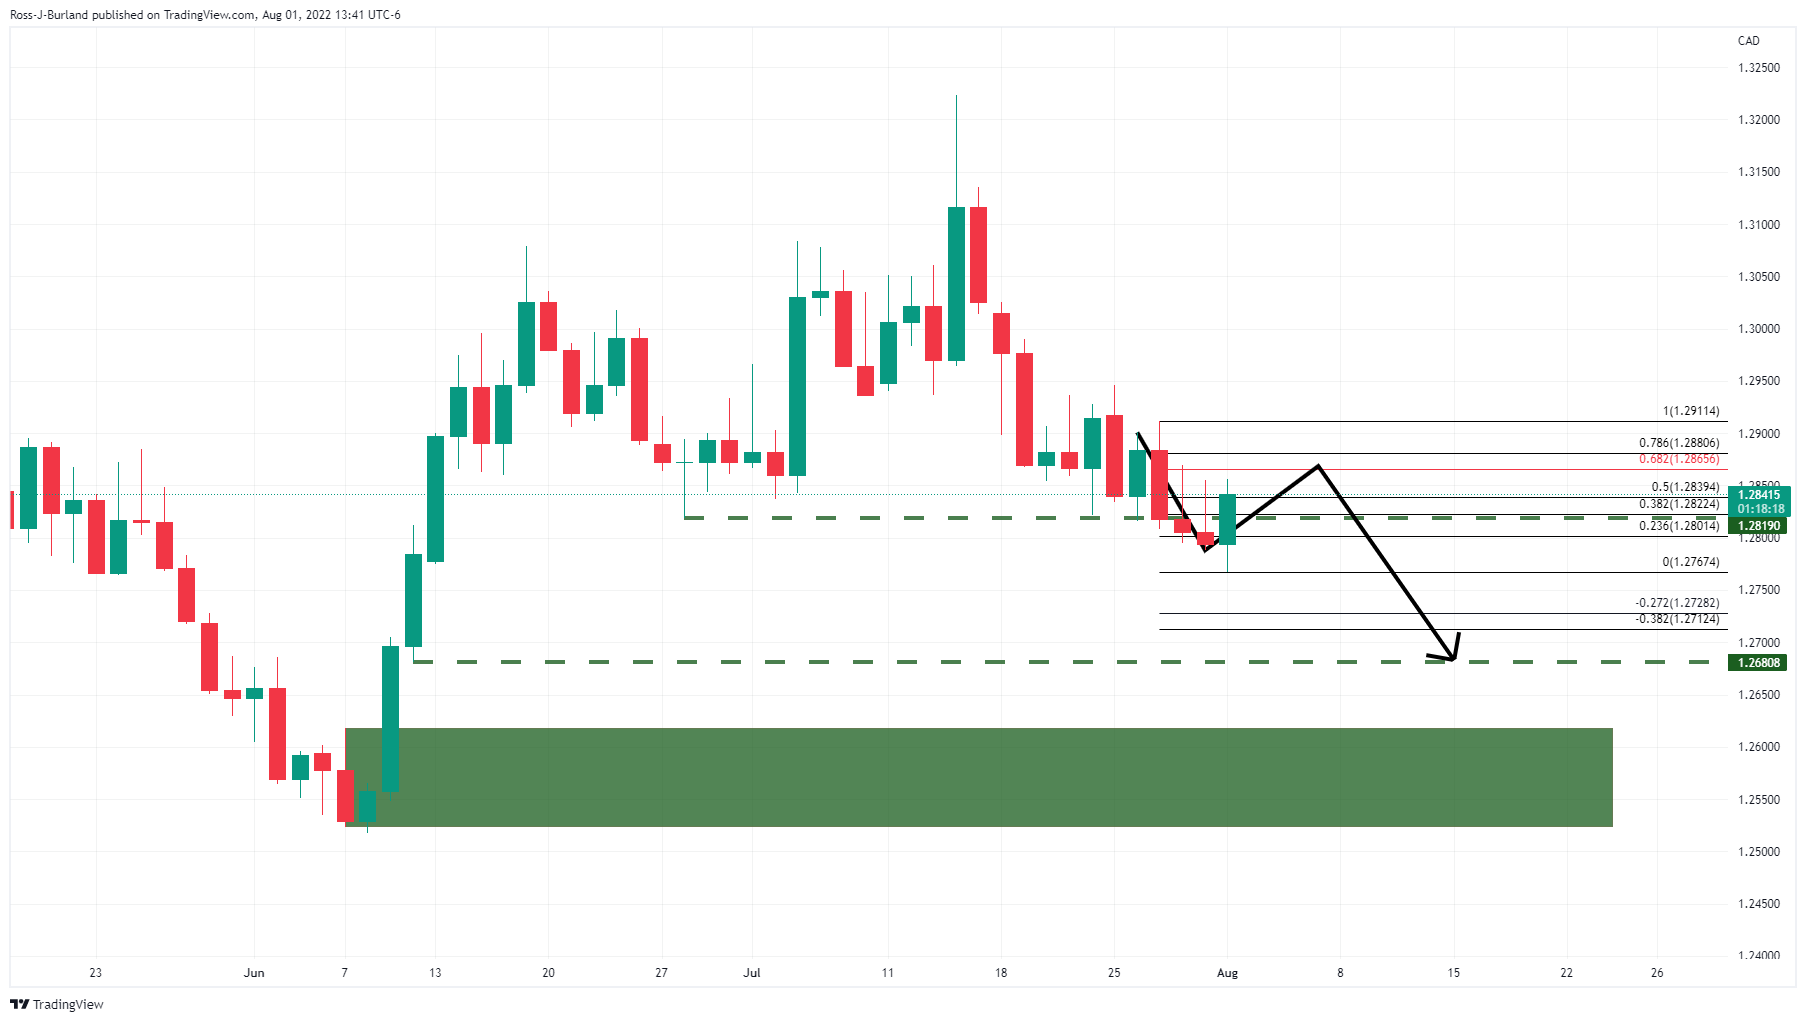
The daily chart's support structure near 1.2820 was pierced in a firm bearish impulse that took the price down to 1.2770 before it corrected at the start of the week. However, it was stated that ''so long as the 1.2900 area remains intact, the focus is on the downside with 1.26 and below eyed.''
USD/CAD H1 chart, prior analysis
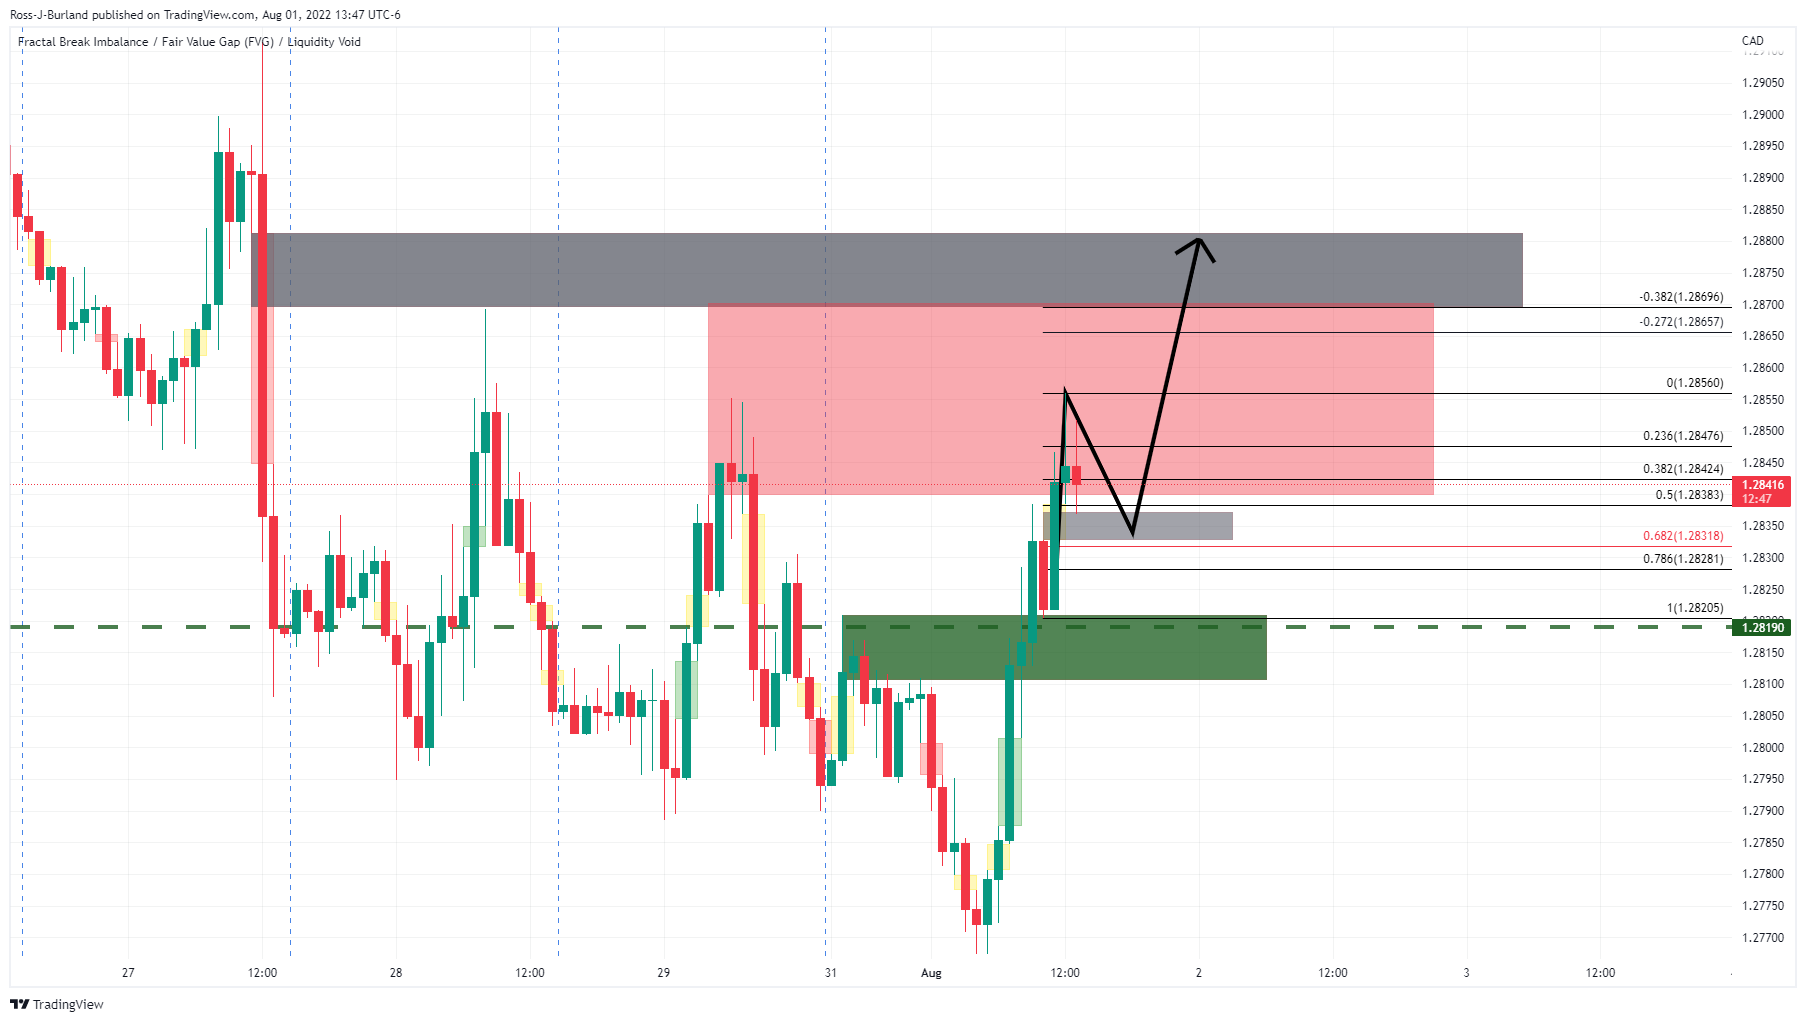
Meanwhile, the near-term price action was corrective and bullish according to the analysis on the hourly chart. 1.2880 was residing in an area of the imbalance of price which was anticipated to mitigate in due course so long as 1.2820 held up against any bearish meanwhile pressures.
USD/CAD H1, live market
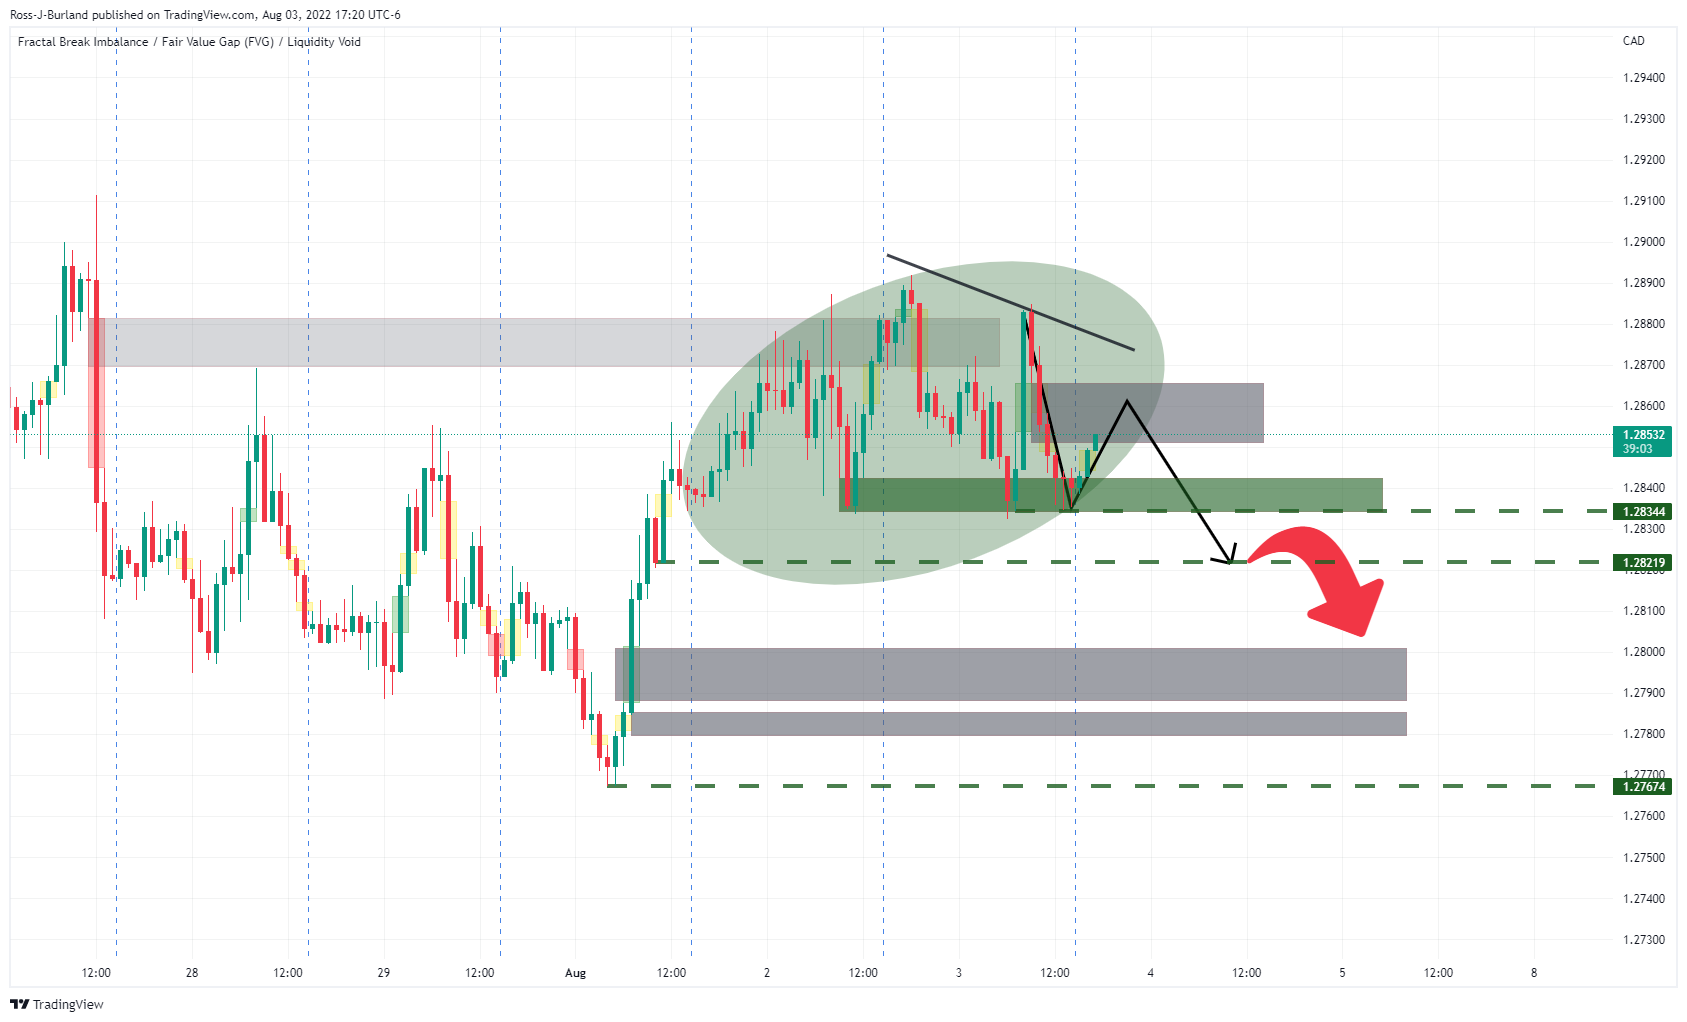
The price indeed moved in on the prior price imbalances and has since moved sideways in a bumpy ride and consolidative phase. There is little bias to go on although there has been a lower high of late printed. The price is holding up in the 1.2830s and a correction to mitigate the price imbalance between spot and 1.2865 could result in further supply in order to break down the support of 1.2820. In doing so, this will leave the price imbalance between 1.2800 and 1.2780 exposed.
- WTI crude oil picks up bids to consolidate recent losses at three-week low.
- OPEC+ delivered 100,000 bpd output increase on Wednesday.
- EIA weekly inventories marked surprise build amid fall in exports, lower run of refiners.
- Risk catalysts will be crucial for near-term directions.
WTI crude oil traders lick their wounds near the lowest levels since three weeks, picking up bids to $90.50 during Thursday’s Asian session.
The black gold slumped to the multi-day low the previous day after the weekly stockpile data from the US Energy Information Administration (EIA) marked a notable increase in inventories. In doing so, the commodity prices failed to respect the Organization of the Petroleum Exporting Countries (OPEC) and allies, collectively known as OPEC+, verdict on the output increase.
Reuters cited multiple sources familiar with the matters while confirming that the OPEC+ leaders have agreed to raise the oil output by 100,000 barrels per day (bpd) in September. In a statement published following its meeting, OPEC said that insufficient investment will impact the availability of adequate oil supply to meet growing demand beyond 2023, as reported by Reuters.
Elsewhere, the EIA statement mentioned that the US crude oil inventories rose unexpectedly last week as exports fell and refiners lowered their runs, while gasoline stocks also posted a surprise build as demand slowed, per Reuters. “Crude inventories rose by 4.5 million barrels in the week to July 29 to 426.6 million barrels, the EIA said, compared with analysts' expectations in a Reuters poll for a 600,000-barrel drop,” stated the news.
It’s worth noting that the US-China tussles over Taiwan jostle with the recently hawkish Fedspeak and firmer US data, as well as recession fears to confuse the oil traders. As a result, the latest rebound in the black gold appears less convincing.
To sum up, the energy benchmark prices may remain depressed around the multi-day low despite the recent recovery.
Technical analysis
WTI’s corrective pullback needs validation from the 200-DMA resistance near $94.20, until then the odds of witnessing further downside towards the latest swing low, around $88.35, can’t be ruled out.
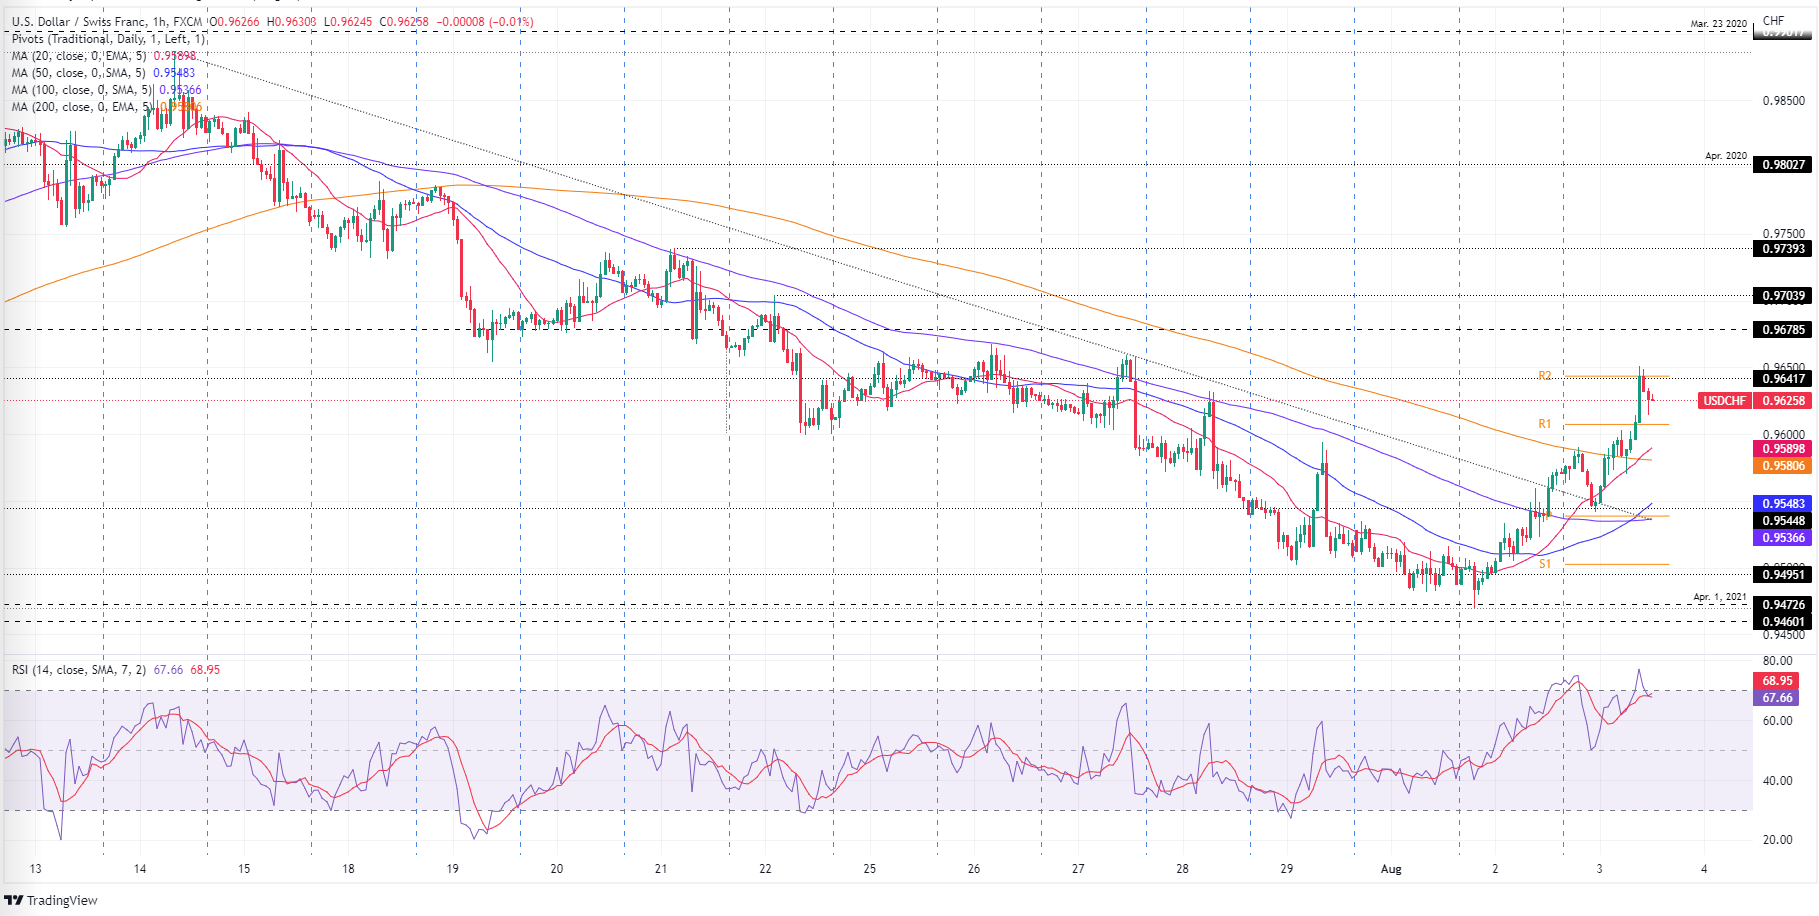
- USD/CHF has picked bids around 0.9600 after a healthy correction.
- The DXY surrendered gains after the release of the upbeat US ISM Services data.
- This week, the release of the US NFP will be the key event for the FX domain.
The USD/CHF pair has attempted a rebound after a corrective action towards the critical support of 0.9600. The asset is likely to display a sideways move for a while, however, the upside will remain favored as the Swiss Consumer Price Index (CPI) remained flat at 3.4%.
Investors were expecting an improvement in Swiss CPI to 3.5%, however, the data remained unchanged at 3.4%. Well, this doesn’t trim the odds of a rate hike by the Swiss National Bank (SNB) ahead, but hawkish guidance will get hurt badly.
Meanwhile, the US dollar index (DXY) surrendered its entire Wednesday’s gains after Wall Street capitalized on the upbeat US Institute of Supply Management (ISM) Services data. NASDAQ displayed 2.60% gains as US ISM Services New Orders Index gained to 59.9, solid than the former release of 55.6. This indicates that the demand for services will remain resilient going ahead. A firmer rebound in the risk-on impulse forced the DXY to surrender its intraday gains.
This week, investors’ entire focus will remain on the US Nonfarm Payrolls (NFP) data. As per the market estimates, the US economy has failed to outperform June’s job additions numbers and has added 250k jobs in the labor market in July. Also, the Unemployment Rate is seen flat at 3.6%. The commentary from big US corporate players indicated that the firms have halted their recruitment process for the remaining year, whose consequences will be displayed in the labor market data.
US inflation expectations, as per the 10-year breakeven inflation rate per the St. Louis Federal Reserve (FRED) data, recovered to 2.50% after a two-day downtrend by the end of Wednesday’s North American session. With this, the inflation gauge reverses the pullback from the highest levels since June 27.
It’s worth noting that the market’s latest fears of inflation took clues from the US activity numbers for July. Recently, US ISM Services PMI for July rose to 56.7 from 55.3 prior and the market expectation of 53.5. On the other hand, the Final reading of the US S&P Global Services PMI for July dropped to 47.3, marking the first contraction in two years, from 52.7 in June and the flash estimate of 47.
Given the firmer inflation expectations and the US Fed policymakers’ determination for higher rates, the market sentiment could fade the latest optimism amid fears of the Fed’s aggression amid the economic slowdown chatters. Also challenging the latest cautious optimism is the US-China tussles over Taiwan.
However, major attention will be given to Friday’s US Nonfarm Payrolls (NFP) for fresh impulses, which in turn keeps the traders on their toes ahead of the release.
Also read: Forex Today: Wall Street saved the day
- GBP/JPY grinds higher during three-day rebound from a 10-week low.
- 50-EMA, fortnight-old horizontal hurdle guards immediate upside.
- Convergence of 61.8% Fibonacci retracement level, 200-EMA appears a tough nut to crack for the bulls.
- 20-EMA, weekly support line could challenge pullback moves.
GBP/JPY bulls struggle to keep reins around 162.60 as traders await the key Bank of England (BOE) Monetary Policy decisions during the Asian session on “Super Thursday”.
Also read: Bank of England Preview: Bailey to deal blow to pound with dovish hike, what to watch for
A convergence of the 50-EMA and a horizontal resistance from July 22 appears to challenge the pair buyers of late. However, steady RSI and bullish MACD signals hint at the quote’s further upside.
It’s worth noting that the GBP/JPY bull’s dominance beyond the 50-EMA level of 162.85 and the aforementioned horizontal resistance near 163.00-05 won’t be too long. That said, a convergence of the 200-EMA and the 61.8% Fibonacci retracement of July 27 to August 02 move, near 163.70, appears a tough nut to crack for the pair buyers.
Should the GBP/JPY prices rise beyond 163.70, the odds of witnessing a run-up towards the late July swing high of 165.28 can’t be ruled out.
Alternatively, pullback remains elusive until the quote stays above the weekly support line and the 20-EMA, respectively around 162.30 and 162.15.
Following that, the 23.6% Fibonacci retracement level could act as the last defense for the GBP/JPY bulls before directing them to the monthly low of 159.44.
GBP/JPY: Four-hour chart
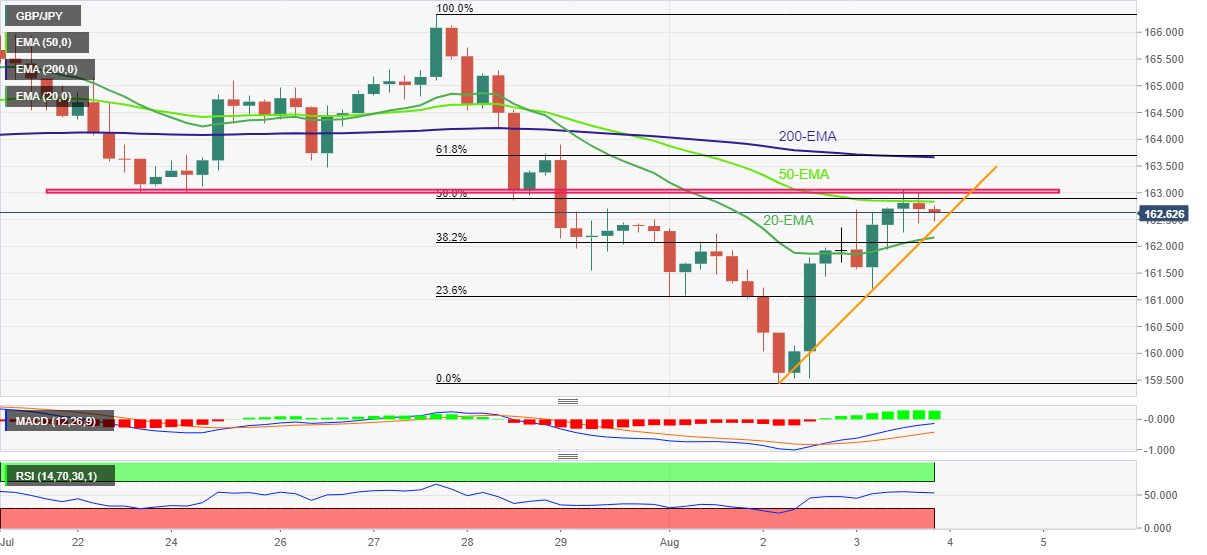
Trend: Limited upside expected
- A bearish megaphone formation accelerates the odds of a downside bias.
- The RSI (14) is attempting a downside break of 40.00, which will strengthen the greenback bulls.
- A bear cross, represented by the 20-and 50-period EMAs, adds to the downside filters.
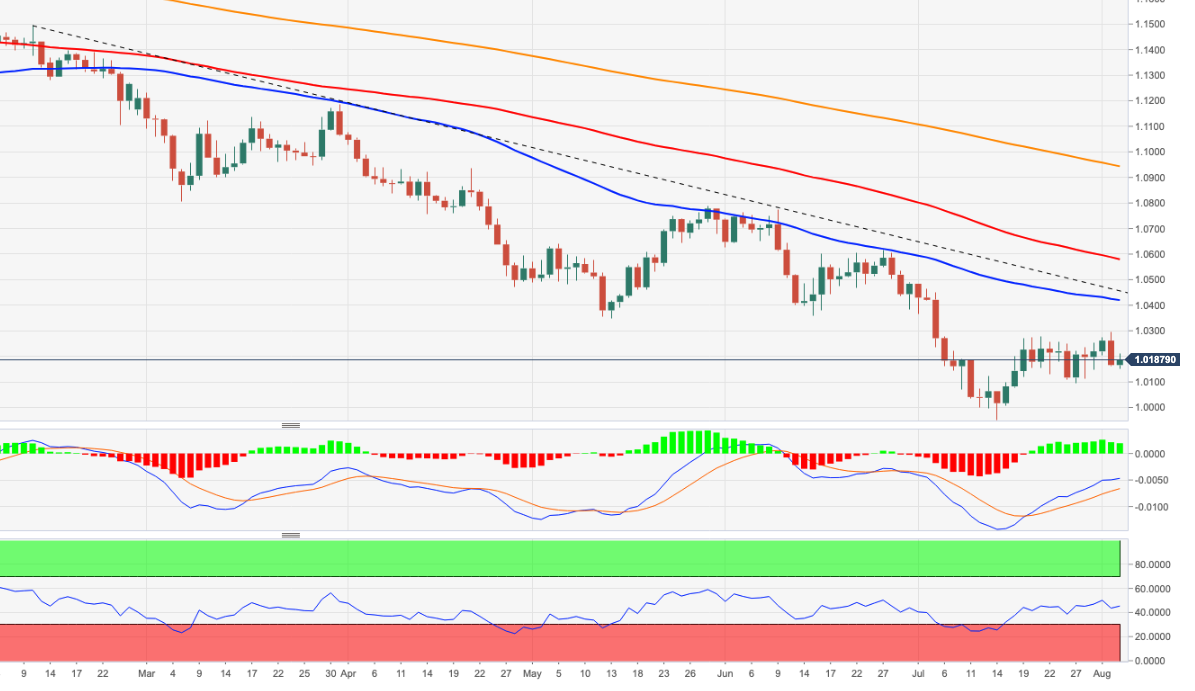
The EUR/USD pair has turned sideways after a juggernaut rally from Wednesday’s low at around 1.0130. The asset is oscillating in a 1.0163-1.0172 range but is likely to behave volatile ahead. Also, the asset defended its weekly lows on Wednesday, which signals the availability of buying interest at lower levels.
On a four-hour scale, the asset is auctioning in a bearish megaphone chart pattern that indicates a volatility contraction but in a wider range. The upward sloping trendline of the above-mentioned chart pattern is placed from July 28 high at 1.0234 while the horizontal support is plotted from July 28 low at 1.0114.
A bear cross represented by 20-and 50-period Exponential Moving Averages (EMAs) at 1.0194 adds to the downside filters.
Also, the Relative Strength Index (RSI) (14) is oscillating in the 40.00-60.00 range. The momentum oscillator is attempting a break below 40.00, which will intensify the downside momentum.
A downside break of a two-week low at 1.0100 will drag the asset towards July 14 high and low at 1.0050 and 0.9952 respectively.
On the contrary, the shared currency bulls could defend the downside bias and send the asset towards July 1 low at 1.0366, followed by July 4 high at 1.0463, if the asset manages to overstep Tuesday’s high at 1.0294.
EUR/USD four-hour chart
-637951624092598936.png)
- AUD/USD fades bounces off seven-day low, sidelined of late.
- Firmer sentiment, US dollar weakness favored bulls but fears surrounding Fed’s aggression, Sino-American tension probe upside moves.
- Mixed Aussie data also played its role in challenging the bulls.
- Australia/US trade numbers for June, Fedspeak could direct intraday moves but risk catalysts are more important.
AUD/USD seesaws around mid-0.6900s, after bouncing off the weekly low, as traders await fresh clues during the initial Asian session on Thursday.
The Aussie pair’s earlier rebound could be linked to the firmer equities and softer US dollar while the latest inaction seems to portray the anxiety ahead of the key trade numbers from Australia and the US, not to forget traders’ confusion amid mixed signals.
Wall Street managed to post notable gains on strong earnings and the US dollar’s failure to remain firmer, mainly due to receding economic fears emanating from China. The reason could be linked to the strong China Caixin Manufacturing PMI.
However, downbeat Aussie data and the firmer US data challenged the AUD/USD bulls afterward. That said, Australia’s July AIG Performance of Construction Index fell to 45.3 from 46.2 whereas S&P Global Services PMI improved to 50.9 versus 50.4 prior. On the other hand, US ISM Services PMI for July rose to 56.7 from 55.3 prior and the market expectation of 53.5. On the other hand, the Final reading of the US S&P Global Services PMI for July dropped to 47.3, marking the first contraction in two years, from 52.7 in June and the flash estimate of 47.
Elsewhere, St. Louis Federal Reserve Bank President James Bullard said, “(There is) still some ways to go to get to a restrictive monetary policy." The policymaker adds that he still wants to get to 3.75 to 4% this year while showing a preference for the type of frontloading.
On a different page, the US-China tussles over Taiwan escalated and tamed the risk-on mood. On the same line was a cautious mood ahead of today’s trade numbers and Friday’s US employment data.
Amid these plays, the equities were firmer and the Treasury yields dropped, which in turn drowned the US dollar.
Moving on, Australia’s Trade Balance for June, expected 14,000M versus 15,965M prior, will be the immediate catalyst for the AUD/USD traders ahead of the US Good and Services Trade Balance for the said month, expected $-80.1B versus $-85.5B prior.
Technical analysis
Despite bouncing off the 21-DMA support surrounding 0.6890, AUD/USD bears remain hopeful until witnessing a clear upside break of the support-turned-resistance line from July 14, around 0.7000 by the press time.
“Foreign secretary Liz Truss, a frontrunner in the race to become the next British prime minister, said she would look to change the Bank of England’s mandate to ensure it controlled inflation,” said the Financial Times (FT) during early Thursday morning in Asia.
The news also mentioned, “Speaking at a hustings of Conservative party members in Cardiff on Wednesday, she argued that inflation had been caused by “huge” supply side shocks after the pandemic and the Ukraine war and said she wanted to review the mandate of the central bank, which has a target of maintaining 2 percent inflation.”
Additional quotes
The best way of dealing with inflation is monetary policy and what I have said is I want to change the Bank of England’s mandate to make sure in the future it matches some of the most effective central banks in the world at controlling inflation.
The last time the mandate was looked at was in 1997 under Gordon Brown. Things are very, very different now.
What is simply wrong at this time is to be putting taxes up on ordinary people when they’re struggling to pay their fuel bills, they’re struggling to pay their food bills.
Her campaign received a boost on Wednesday when former health secretary Sajid Javid offered his support. In a comment piece in the Times newspaper, Javid praised the foreign secretary’s ‘sharp focus and willingness to challenge the status quo’.
Recent YouGov polling has placed Truss firmly ahead in the leadership race, with 69 percent of members favoring the foreign secretary, compared with 31 percent backing former chancellor Rishi Sunak.
GBP/USD retreats towards 1.2100
The news appeared to have helped the GBP/USD bears in posting the three-day downtrend as the quote remains pressured around 1.2140 after two consecutive days of south-run.
- EUR/JPY rallied 0.50%, trimming its weekly losses to 0.09%.
- A risk-on impulse capped the EUR/JPY rally above 136.40.
- In the near term, the EUR/JPY is neutral-upward, but a break below 136.00 will expose the pair to selling pressure.
The EUR/JPY begins the Asian session slightly up, extending its gains to three days in a row. On Wednesday, the cross-currency hit a daily high at 136.42 but retraced and closed the trading session around 136.05, gaining 0.50%. At the time of writing, the EUR/JPY is trading at 136.09.
Investors sentiment is upbeat after snapping a two-day drop. US equities registered solid gains between 1.29% and 2.73%. Meanwhile, Asian stock markets prepare for a higher open, while the EUR/JPY sellers remain hopeful as the USD/JPY slides, thus strengthening the yen.
EUR/JPY Price Analysis: Technical outlook
The EUR/JPY daily chart illustrates a neutral bias. Though buyers regained some control in the last couple of days, resistance ahead with the 100-day EMA at 137.83 and July’s 8 low shifted resistance at 136.85 would be difficult hurdles to pass, as buyers target a re-test of the July 21 high at 142.32.
Upside, the EUR/JPY first resistance will be 136.42. Break above will pave the way for further gains ahead of the 100-day EMA. On the other hand, the EUR/JPY path of least resistance is downwards, further cemented by the RSI sitting in bearish territory, beginning to aim lower. So a breach below 136.00 could send the pair sliding towards 135.00.
EUR/JPY 1-hour chart
The EUR/JPY 1-hour chart is neutral-to-upward biased, but the cross faces resistance at a 13-day-old downslope resistance trendline near the exchange rate. Nevertheless, the Relative Strength Index (RSI) is in bullish territory but crossed under its RSI’s 7-hour SMA and is aiming lower, meaning a drop towards the confluence of the 20-hour EMA and the daily pivot point at 135.82 is on the cards.
Therefore, the EUR/JPY first support would be 135.82. Once cleared, sellers’ next support will be the confluence of the 50-hour EMA and the S1 pivot at 135.13, followed by the August 2 low at 134.82.
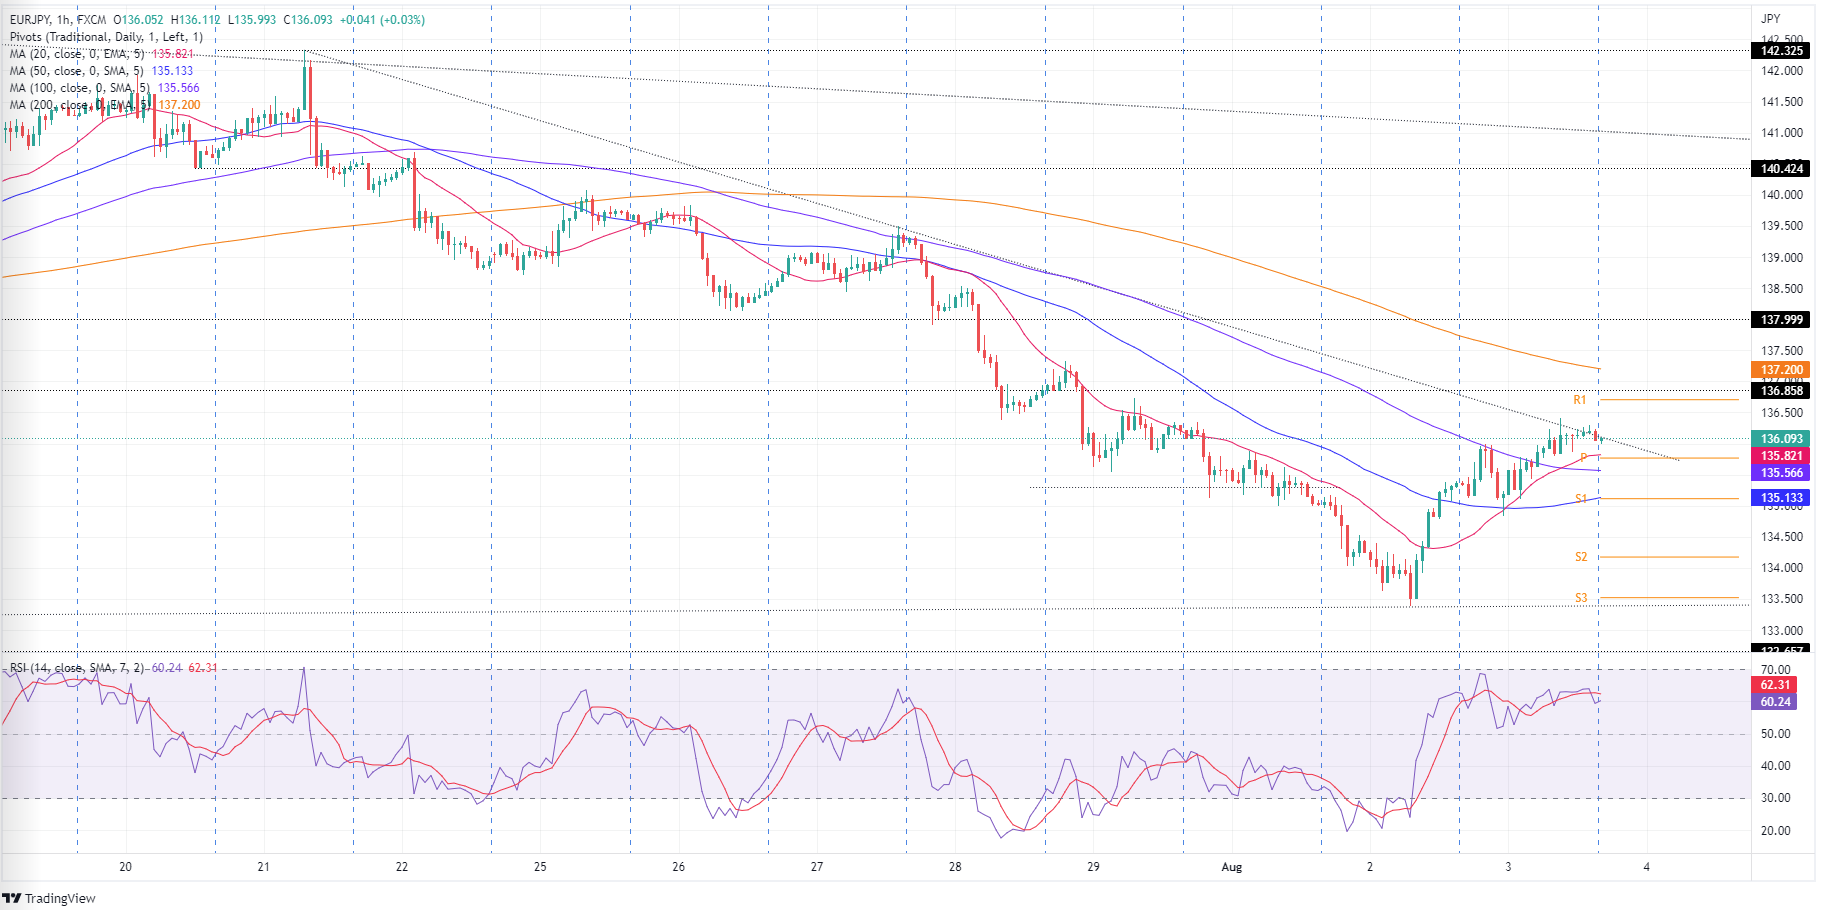
EUR/JPY Key Technical Level
- GBP/USD is struggling to surpass the immediate hurdle of 1.2150 after a pullback move.
- An expectation of a 50 bps rate hike by the BOE is not sufficient to offset the soaring inflation rate.
- The upbeat US ISM Services PMI data has improved the risk appetite of investors.
The GBP/USD pair is struggling to cross the immediate hurdle of 1.2150 after a minor pullback from 1.2100. The asset is likely to behave volatile as investors are awaiting the announcement of the interest rate decision by the Bank of England (BOE).
Considering the market expectations, the BOE will announce a rate hike by 50 basis points (bps). Featuring a rate hike by half of a percent by BOE Governor Andrew Bailey will push the interest rates to 1.75%. It is worth noting that price pressures in the UK area have climbed to 9.4%. Also, the inflation rate has not shown any sign of exhaustion yet, which indicates that the new normal 50 bps rate hike is not sufficient to offset the accelerating inflationary pressures.
Meanwhile, the US dollar index (DXY) surrendered its entire gains on Wednesday and settled flat despite the upbeat US Institute of Supply Management (ISM) Services data. The economic data landed at 56.7, higher than the estimates of 53.5 and the prior release of 55.3. Also, the US ISM Services New Orders Index was released at 59.9, lower than the consensus of 60.5 but remained solid than the former release of 55.6.
The upbeat US ISM Services economic data indicated that the demand is resilient and sent the tech stocks on fire. This tech-savvy index NASDAQ rose 2.59% and improved the risk appetite of investors swiftly.
Going forward, the US Nonfarm Payrolls (NFP) data will be the key event this week. A preliminary estimate for the employment generation is 250k, lower than the prior release of 372k.
- NZD/USD little changed compared to levels prevailing over employment data.
- Traders look to US Nonfarm Payrolls this Friday followed by US Consumer Price Index on August 10.
At 0.6270, NZD/USD is higher by some 0.34%, rising from a low of 0.6212 to a high of 0.6281. The kiwi has been pushed and pulled following the key second quarter Unemployment data that was released in the prior Asian session.
''NZ’s Q2 unemployment rate may have come in a little higher than we (or the Reserve Bank of New Zealand) were expecting, but in our view that doesn’t matter for the monetary policy outlook,'' analysts at ANZ Bank said.
''Flat employment growth despite still-high demand for labour suggests the economy has run out of labour resource to keep growing, and with wage inflation running higher than anyone was expecting, these data suggest pipeline domestic Consumer Price Index inflation pressures are far too strong.''
''The risk of a wage-price spiral clearly isn’t any lower despite the small lift in the unemployment rate. In fact, with average hourly earnings growth at 7% YoY (vs CPI inflation at 7.3%), the RBNZ should be very worried about high domestic inflation sticking around long after global inflation (ie tradables) has slowed.''
US dollar mixed
Meanwhile, greenback has dropped from the 109 area down to a recent low of 105.97 over the course of two weeks. Nevertheless, a trio of Fed officials signalled on Tuesday the central bank remains "completely united" on increasing rates to a level that will put a dent in the highest US inflation since the 1980s. This has given the greenback a booster and lifted it to 106.819 over the course of the past few sessions.
San Francisco Fed President Mary Daly said on Wednesday that 50 basis points would be a reasonable thing to do in September. ''We have a lot in the pipeline in tightening but yet to see that in data showing a slowing of the economy, but if we see inflation roaring ahead undauntedly then perhaps 75 be more appropriate.'' US rate futures pared back 75bp view in Sept after Fed's Daly comments.
Looking ahead, the US Nonfarm Payrolls this Friday followed by Consumer Price Index on August 10 will help to iron out the creases in the greenback. The consensus for Nonfarm Payrolls is 250k. That is down from 372k in June. The Unemployment Rate is expected to fall in at 3.6%.
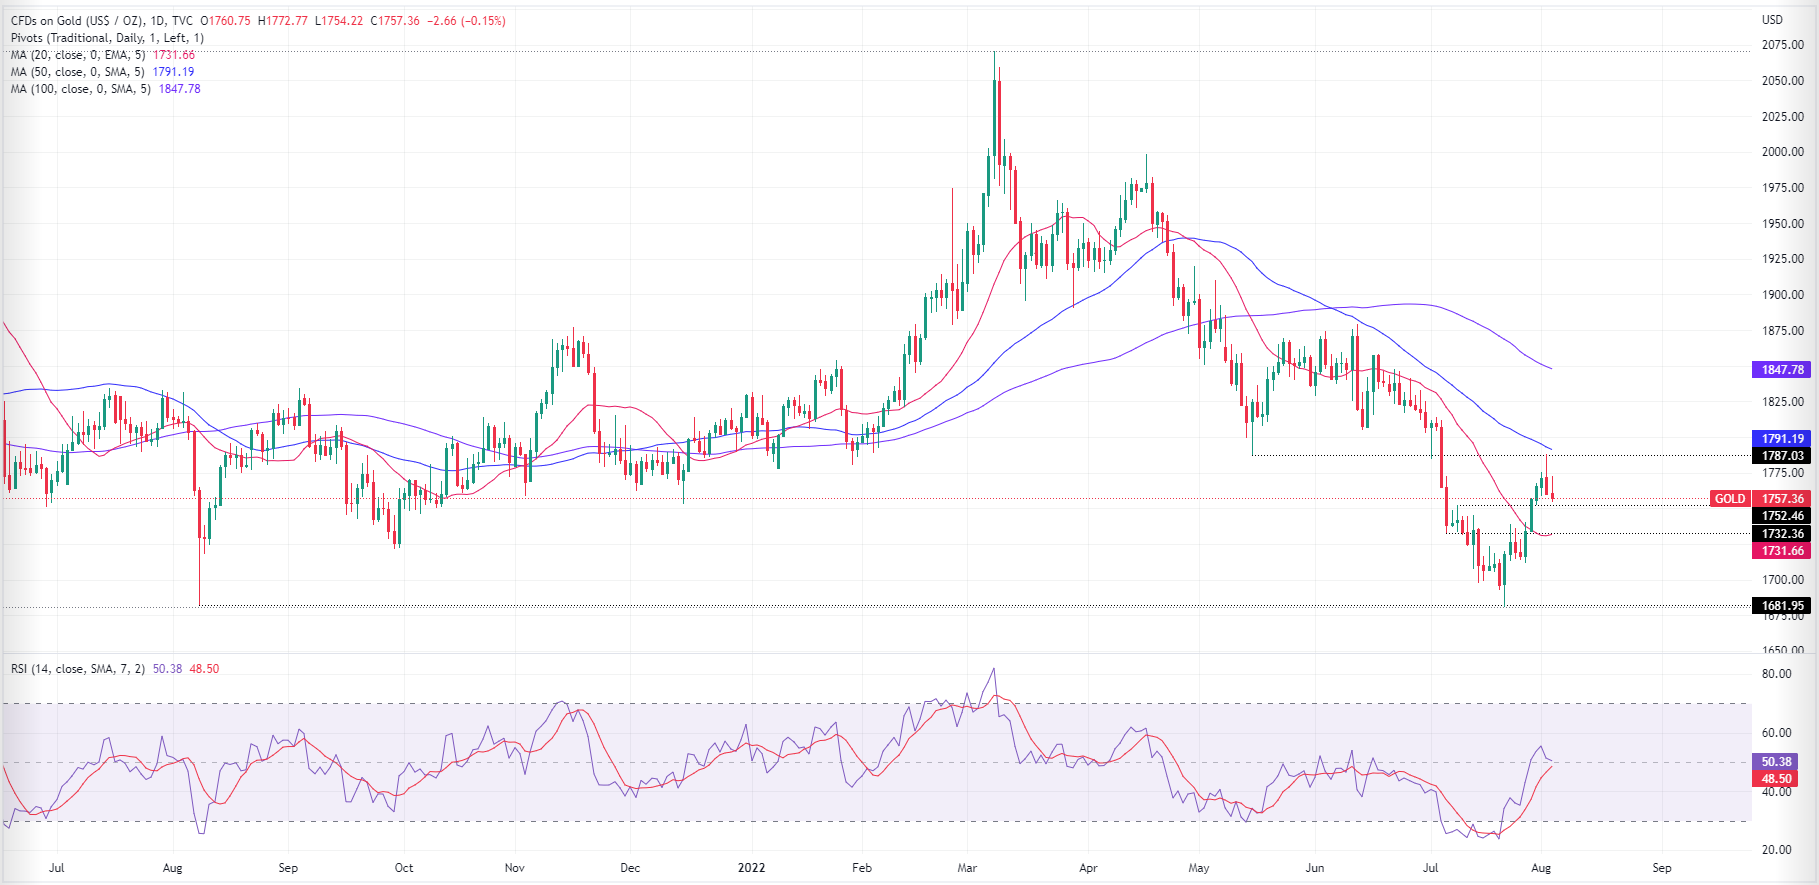
- Gold is holding up in the face of stronger stocks despite a firm US dollar.
- US yields slide into the closing hour of the US session.
Gold prices have been pushed and pulled on Wednesday, oscillating in and out of the hands of bulls and bears. At $1,765, the yellow metal is trading between $1,754.35 and $1,772.83, trading in the green by some 0.27%.
In futures, gold for December delivery closed down US$13.30 to settle at US$1,776.40 per ounce as US bond yields rose along with the greenback. While there is some relief over geopolitical worries that have eased since US House Speaker Nancy Pelosi ended her visit to Taiwan, there remains an underbelly of risk-off in markets with the Asian power boosting military activity around Taiwan to show its displeasure with Pelosi's move.
Earlier in the day, US Treasuries continued yesterday’s sell-off as markets are digesting the comments from Federal Reserve speakers that the central bank’s job on containing inflation isn’t done yet. ''The short covering rally is running out of steam. Fed Chair Powell catalyzed a short covering rally by tying another "unusually large" 75bp hike to data, which places a high bar for another jumbo-sized hike given the slowing trend in data,'' analysts at TD Securities said.
''However, on the other hand, we see risks that Fed speakers can push back against market expectations for an early Fed pivot. In that sense, the yellow metal may be hard pressed to receive another bullish catalyst that would spark a change in momentum trend signals and see CTAs cover their shorts.''
US yields give back gains
On the day, stronger US data also helped the move in US yields, bearish for gold since it offers no interest. However, the yield on the US 10-year note was last around 2.708%, down from the highs of 2.849% which enabled the yellow metal to climb in the remaining hour of the US forex session into the roll-overs. At the same time, equities pushed higher, helped by solid earnings results and stronger data. US factory orders for June were stronger than expected, rising 2% MoM vs. the expected: 1.2% and prior 1.8%. Durable goods orders also beat expectations, rising 2% vs. the expected 1.9% and previous 0.9%. Meanwhile, US Services ISM beat expectations, rising to 56.7 vs. the expected 53.5 vs. the previous 55.3. ''Taken together, the data may unwind some of the more negative sentiment that has surrounded the outlook for the US economy of late,'' analysts at ANZ Bank said.
Meanwhile, the analysts at TD Securities argued that ''gold markets are faced with a massive amount of complacent length held by prop traders, which still hold the title as the dominant speculative force in gold. We have yet to see capitulation in gold, suggesting the pain trade is still to the downside and we expect the recent rally will ultimately fade.''
Gold technical analysis
As per the prior analysis, Gold Price Forecast: XAU/USD bulls are back in play, it was explained that the price was running higher in a correction of the weekly M-formation:
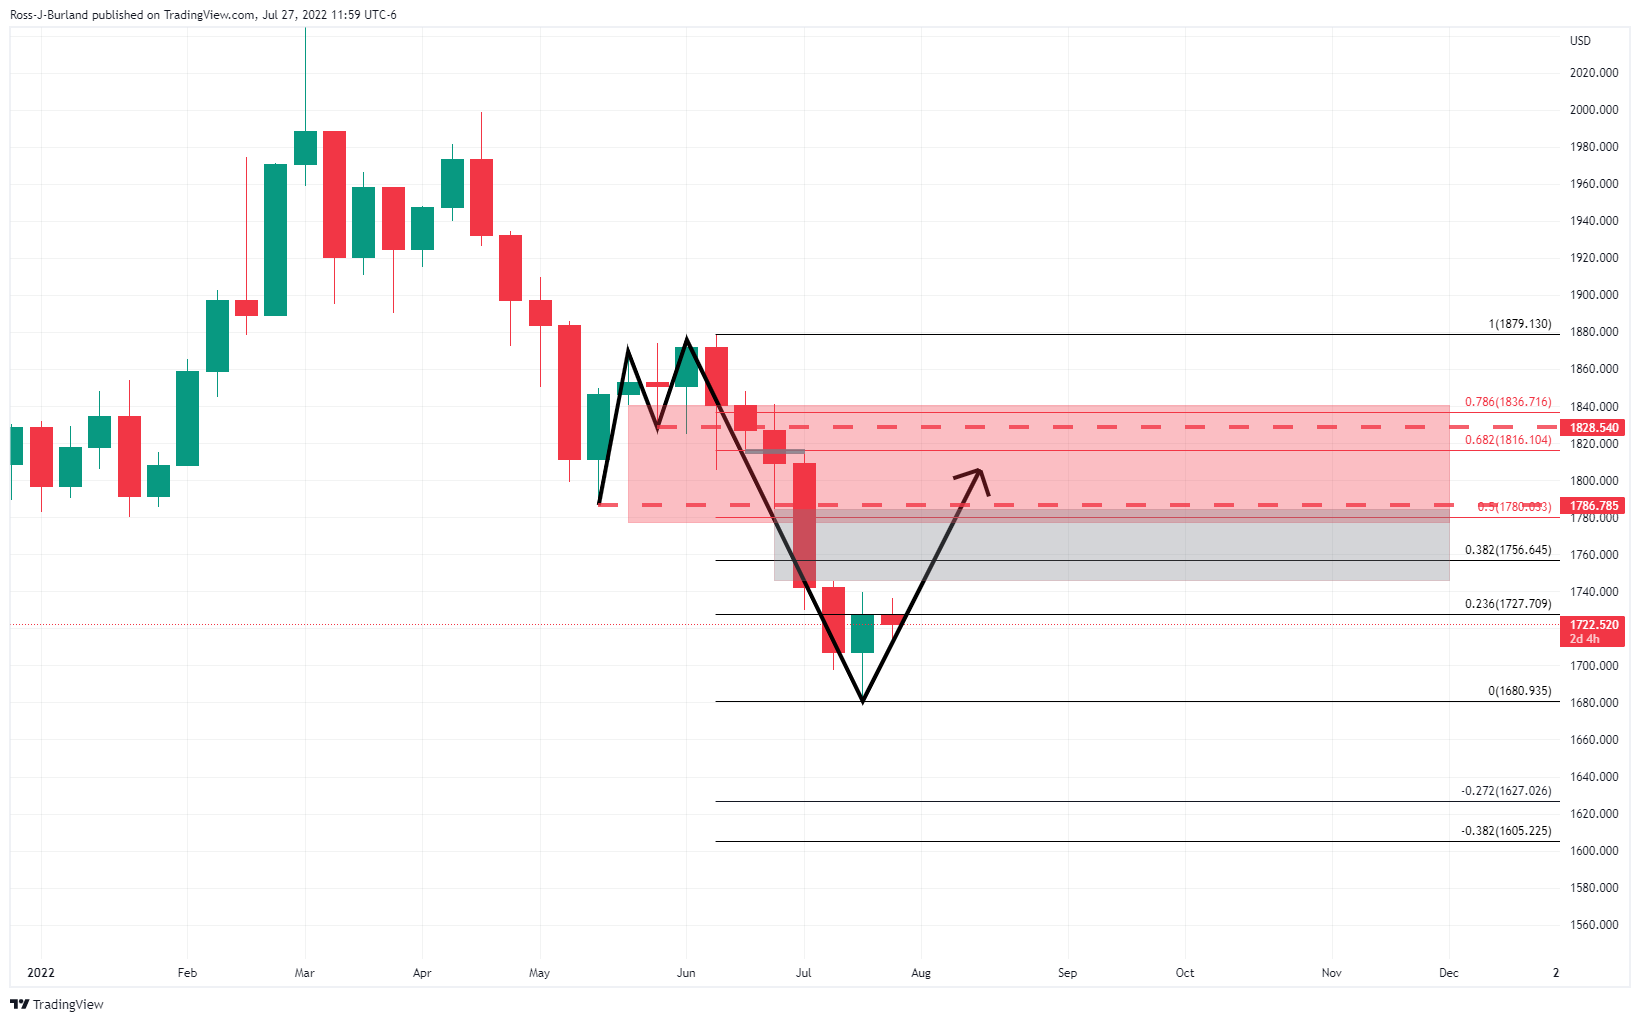
The grey area was a price imbalance that has now been mitigated by a 50% mean reversion:
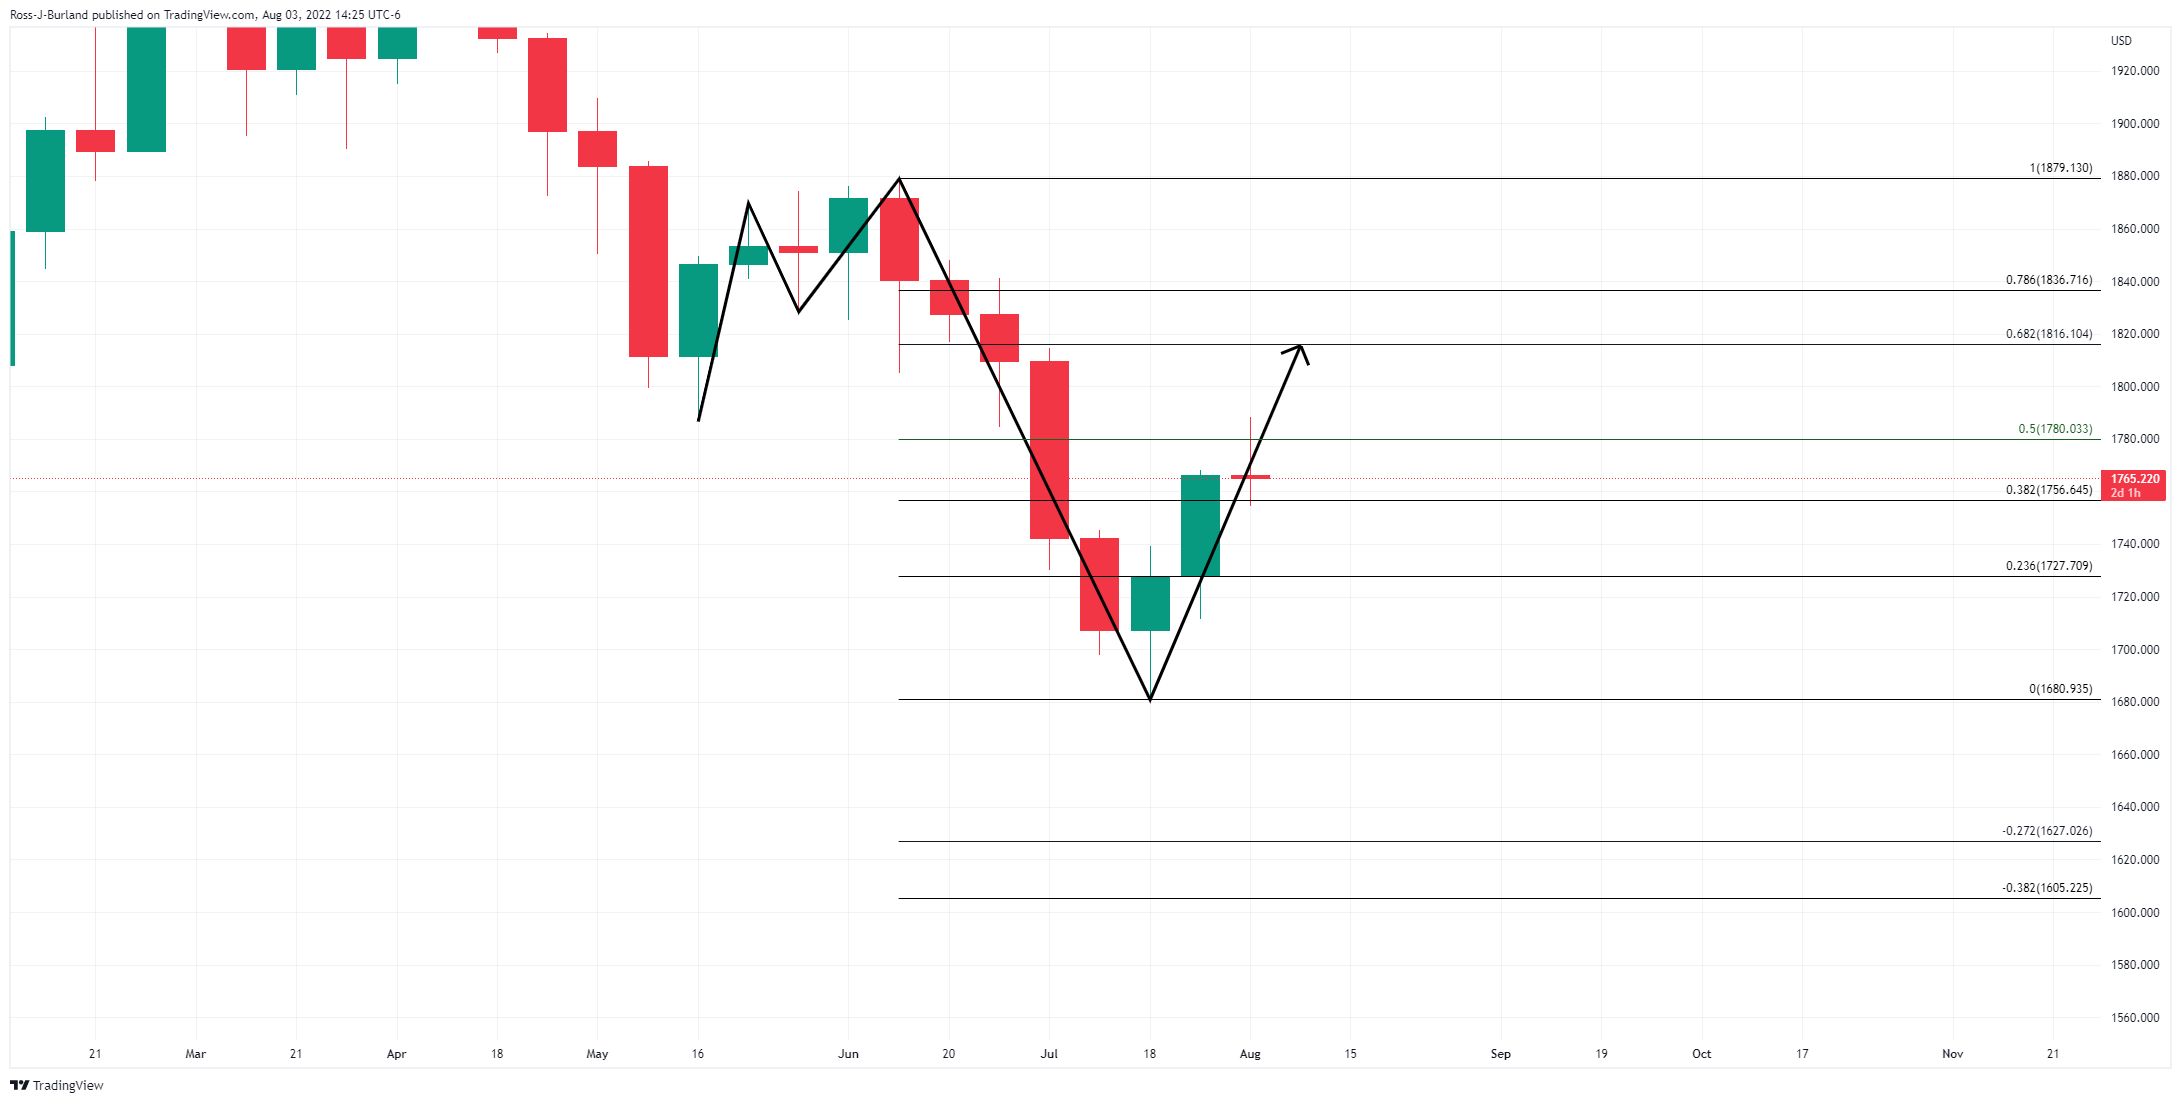
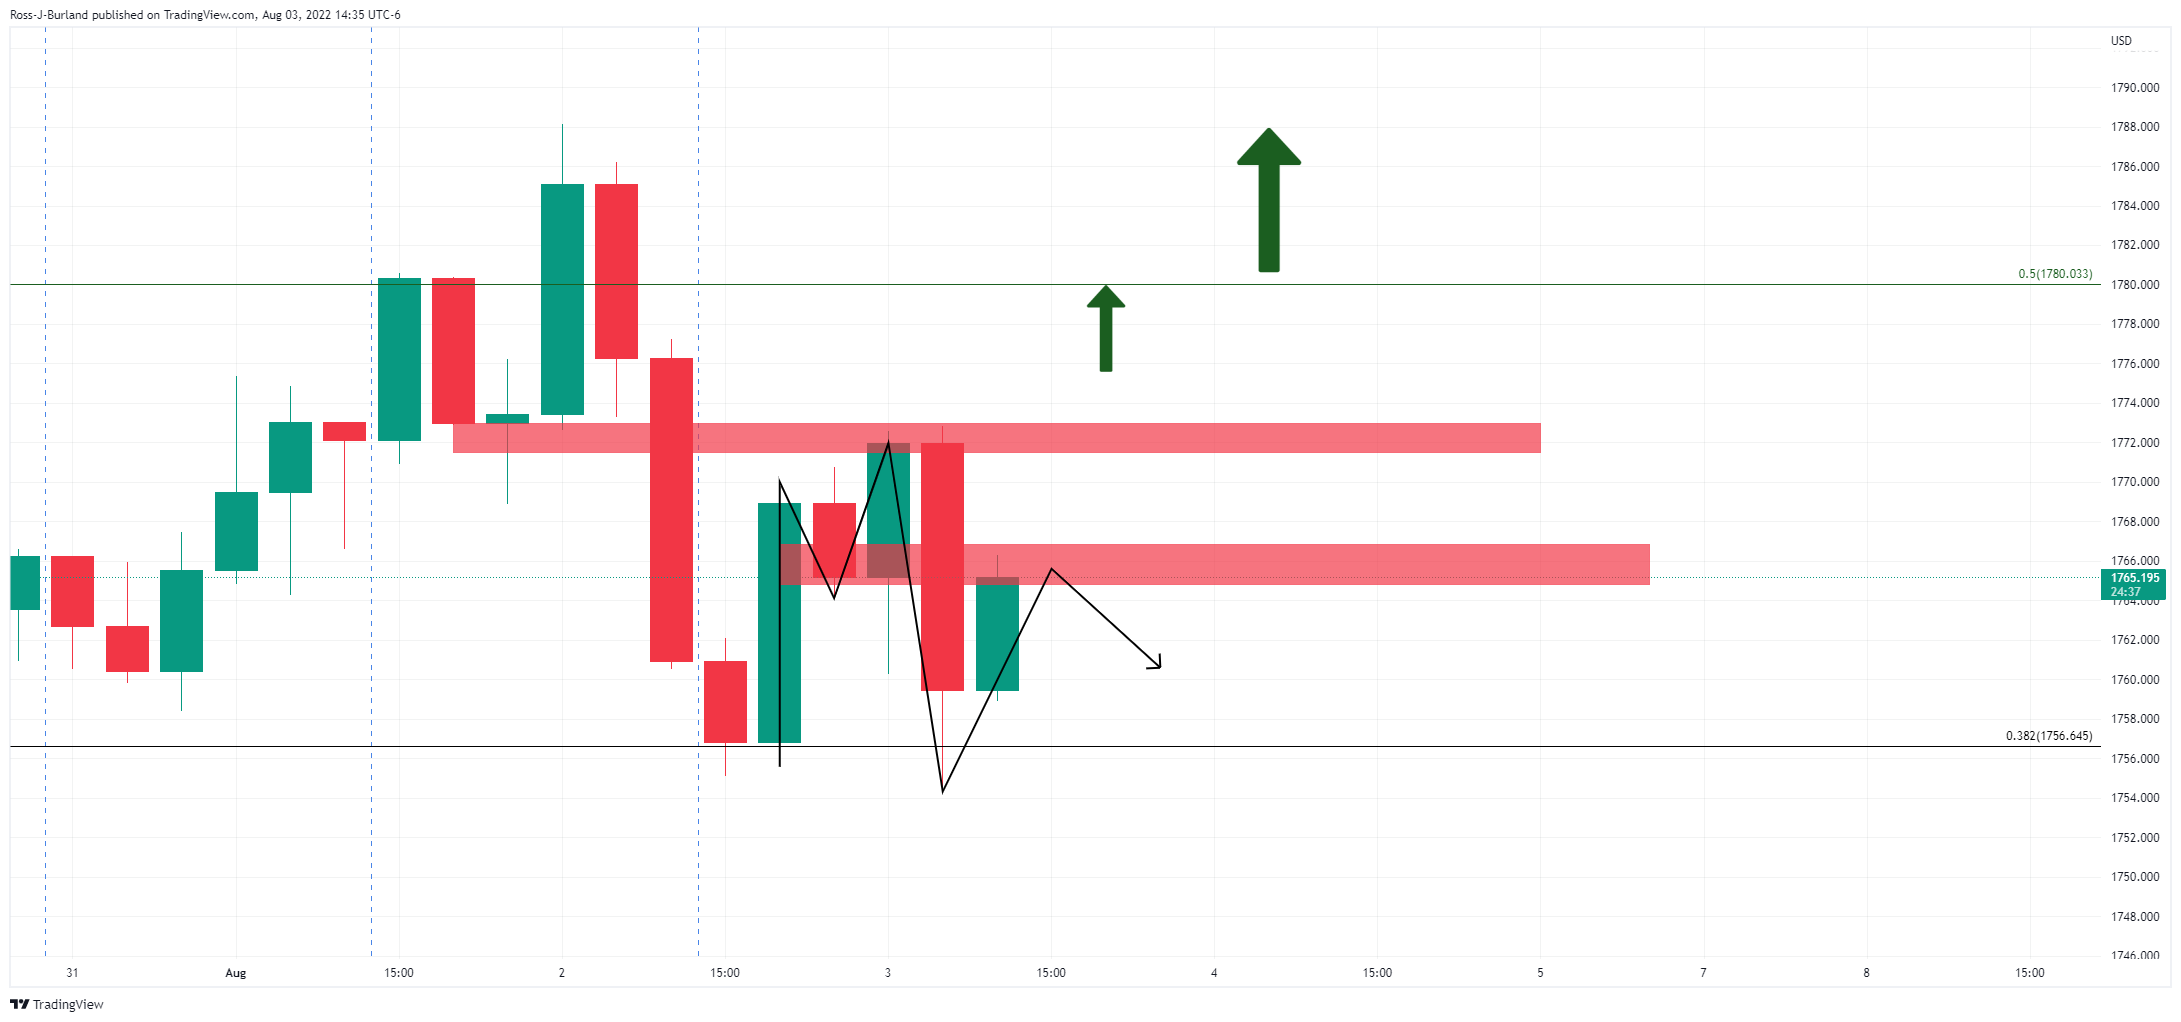
There are prospects for further upside with the 68.2% Fibonacci meeting prior structure around $1,800. However, there is some mean while resistance to break on the 4-hour chart as follows:
- USD/JPY grinds higher though struggles around resistance at 134.00.
- US Treasury bond yields retrace from daily highs, putting a lid on the USD/JPY upward move.
- The USD/JPY is upward biased in the near term, but a break above the 200-hour EMA is needed to pave the way towards 136.50s.
The USD/JPY advances sharply during the North American session, underpinned by high US Treasury yields, up 0.66% on an upbeat sentiment trading day, courtesy of US House Speaker Pelosi leaving Taiwan, while US equities remain in the positive, bolstered by companies earnings. At the time of writing, the USD/JPY is trading at 133.95.
USD/JPY Price Analysis: Technical outlook
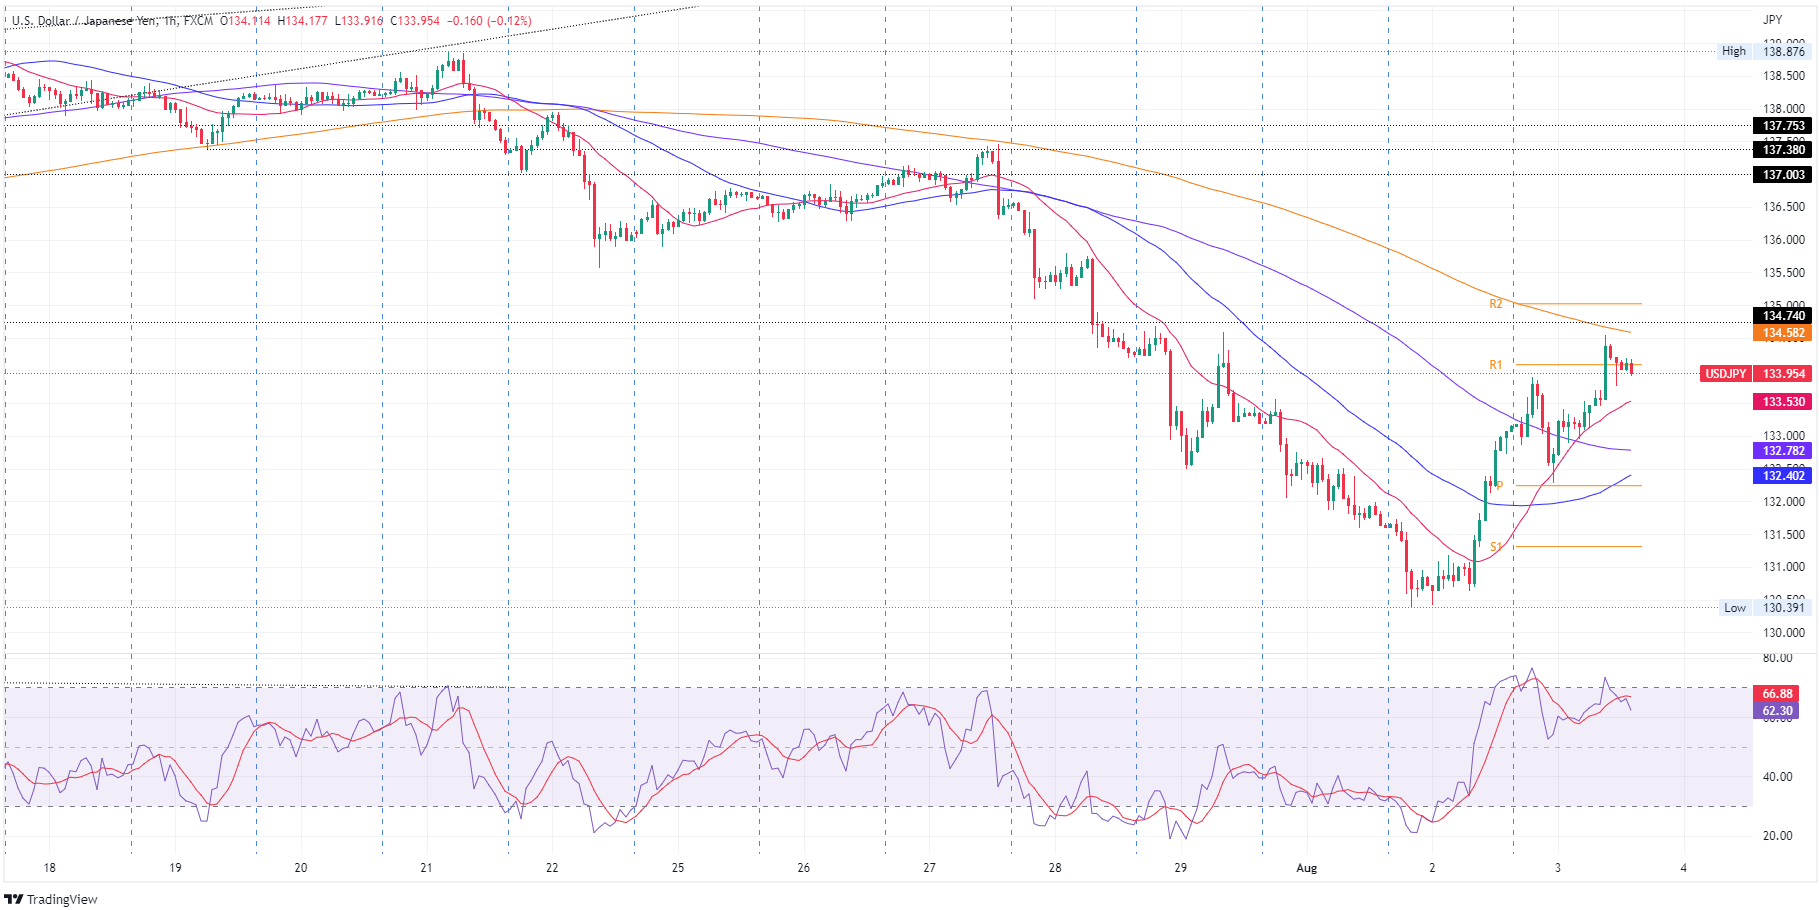
The USD/JPY is neutral-to-upward biased, but it’s facing solid resistance at134.57, the 50-day EMA. Even though buyers regained control, the Relative Strength Index (RSI) is still in negative territory, which means that sellers lost steam and could re-enter with confidence. Still, they will need a daily close below 134.00 to remain hopeful of lower prices.
USD/JPY 1-hour chart
In the hourly chart, the USD/JPY is neutral-to-upward biased. The hourly EMAs are located below the exchange rate, except for the 200-hour EMA at 134.58, which would be difficult resistance to hurdle. Nevertheless, price action in the last couple of days, breaking the August 1 daily high at 133.56, exacerbated the rally towards weekly highs at 134.54. That said, the USD/JPY in the near term is headed up.
Therefore, the USD/JPY’s first resistance would be the 200-hour EMA around 134.58. Break above will expose the R2 daily pivot at 135.00, followed by the July 27 daily high at 136.57. On the flip side, the USD/JPY first support would be the 20-hour EMA at 133.53. A breach of the latter will expose the 100-hour EMA at 132.78, followed by the 50-hour EMA at 132.40.
USD/JPY Price Analysis
What you need to take care of on Thursday, August 4:
Tensions eased a bit on Wednesday, pushing the greenback down across the FX board ahead of the US opening. The dollar, however, recovered its poise after the release of an upbeat ISM Services PMI, which indicated that the local economy remains resilient.
US indexes surged, capping the safe-haven dollar’s demand, partially helped by solid earnings reports and encouraging local data.
Meanwhile, different US Federal Reserve officials reinforce the market’s speculation the Fed is far from done with aggressive tightening, putting a 75 bps rate hike back on the table for September.
Recession fears maintain the US Treasury yield curve inverted, and the difference between the 2-year note and the 10-year note yields has widened to 36 bps. Nevertheless, Wall Street managed to post solid gains, helped by another batch of solid earnings reports.
The EUR/USD pair trades around 1.0160, as tepid European data undermined demand for the shared currency. The GBP/USD pair finished the day in the red at 1.2145.
Commodity-linked currencies, on the other hand, benefited from Wall Street’s strength. AUD/USD trades around 0.6950 while USD/CAD is marginally lower at 1.2840.
Gold price settled at $1,765 a troy ounce, while crude oil prices edged lower, as different OPEC+ sources suggest that they won’t increase output. Also, US weekly data showed slowing demand. WTI ended the day at $90.90 a barrel.
The Bank of England will announce its monetary policy decision on Thursday.
Bitcoin Price Prediction: A fundamental line in the sand
Like this article? Help us with some feedback by answering this survey:
Federal Reserve's Neel Kashkari, president of the Federal Reserve Bank of Minneapolis, is speaking and has said that the Fed moved too slowly in 2021 in tackling high inflation.
He said wages are climbing and there is a risk that this goes into a wage-driven inflation story. he said the fed is laser-focused on getting inflation down.
He said concerning inflation is spreading and the Fed need to act with urgency. ''It is likely we raise rates and sit there, as 2023 rate cuts are a very unlikely scenario.
He says a soft landing is possible but he does not know how likely.
Key quotes
- Fed moved too slowly in 2021 in tackling high inflation.
- Inflation is dragging wages up rather than the other way around.
- Wages are climbing; risk this goes to a wage-driven inflation story.
- Concerning inflation is spreading; we need to act with urgency.
- We are laser-focused on getting inflation down.
- Very unlikely scenario Fed will cut rates next year.
- More likely scenario is we raise rates and then sit there.
- I am not sure what markets are looking at.
- Where will eventually be a tradeoff between employment and inflation.
- Best data we have says inflation expectations are still anchored.
- Will probably take several years to get inflation back to 2%.
- In a supply-constrained world we still need to get inflation down to 2%.
US dollar remains in bullish territory
The US dollar has been changing hands between bulls and bears on Wednesday but held on to most of the previous day's gains over worries related to China and Us relations and Federal Reserve officials' hints at aggressive rate hikes.
- EUR/USD remains pinned to the floor despite a pick-up in risk appetite.
- US dollar firm on Fed expectations and market caution surrounding China/US relations.
At 1.0151, EUR/USD is under pressure by 0.14% and has fallen from a high of 1.0210 to a low of 1.0122. On Wednesday, US stock futures rose as investor apprehension over hostile US-China relations subsided, yet the euro remains on the backfoot with the greenback firm due to US treasuries declining as a result of hawkish Federal Reserve comments.
Markets have been calmer since US House Speaker Nancy Pelosi returned from a trip to Taiwan that sparked a furious response from China. US stocks on Wall Street have advanced with government bond yields after a services gauge unexpectedly advanced and new orders for factory goods beat expectations. This has implied that the projected hike in interest rates this year may not necessarily coincide with an economy in recession, a relief for risk assets in general.
On Tuesday, risk-off tones had been spurred by Fed officials saying the central bank has some distance to go to contain inflation. This resulted in the two-year treasury yield surging through 3% as traders reduced their bets on policy easing in 2023. Nevertheless, the USD dollar index, which tracks the greenback against six major peers, has softened from a two-decade high in mid-July as investors reined in expectations of Fed rate hikes.
Fed speak conflicting
The US dollar has fallen from the 109 area down to a recent low of 105.97 over the course of two weeks. Nevertheless, a trio of Fed officials signalled on Tuesday the central bank remains "completely united" on increasing rates to a level that will put a dent in the highest US inflation since the 1980s. This has given the greenback a booster and lifted it to 106.819 over the course of the past few sessions.
Meanwhile, San Francisco Fed President Mary Daly said On Wednesday that 50 basis points would be a reasonable thing to do in September. ''We have a lot in the pipeline in tightening but yet to see that in data showing a slowing of the economy, but if we see inflation roaring ahead undauntedly then perhaps 75 be more appropriate.'' US rate futures pared back 75bp view in Sept after Fed's Daly comments.
Meanwhile, US Nonfarm Payrolls this Friday followed by Consumer Price Index on August 10 will help set the tone for the greenback. The consensus for Nonfarm Payrolls is 250k. That is down from 372k in June. The Unemployment Rate is expected to fall in at 3.6%.
EUR shorts packing up
As for positioning, speculators’ net EUR short positions have moved lower slightly ahead of the surge the previous week.
''Speculators have been edgy recently given concerns related to gas shortages in Europe during the winter and fears that industry may suffer rationing. This scenario could focus the market on fragmentation risks, though reassurances have been provided by the Brothers of Italy party that reformist policies would be retained if it did well in the election,'' analysts at Rabobank explained.
- Silver price clings to the $20.00 figure, despite a risk-on market mood.
- Upbeat US Non-Manufacturing PMI data keeps investors’ spirits high, that the US could dodge a recession.
- Fed officials emphasized their commitment to bringing inflation down.
Silver prices are pressing against the $20.00 figure after tumbling on Tuesday due to US dollar appreciation amidst a gloomy market mood spurred by geopolitical tensions between the US and China. Nevertheless, on Wednesday, the white metal stages a comeback, though it’s facing solid resistance with the 50-day EMA lingering around the $20.43 mark. At the time of writing, XAGUSD is trading at $20.00.
Silver recovers as US bond yields retrace from daily highs
Sentiment improved throughout the day. US equities rally propelled by company earnings, whilst safe-haven assets, particularly precious metals, are taking a breather, recovering from earlier losses, as US Treasury yields remain elevated on Fed’s hawkish commentary.
In the meantime, US economic data, with the July ISM Non-Manufacturing PMI, showed that businesses are holding the fort, with the index rising to 56.7, more than estimated and higher than June’s 55.9. That pares back expectations of a recessionary scenario, which augmented when the ISM Manufacturing PMI expanded at its slowest pace in two years.
Aside from this, the Fed parade continued. Earlier during the day, the uber-hawk St. Louis Fed President Bullard said that he wants to get rates by the end of the year, around 3.75-4.00%. He added that the Fed “is going to move inflation back to 2% over time.” Later, San Francisco’s Fed Daly said she’s open to lifting rates by 50 or 75 bps, but it would depend on inflation data.
The buck’s reaction to the abovementioned factors had been positive, as shown by the US Dollar Index, rising 0.14%, at 106.483. Lately, US Treasury bond yields are receding from daily highs, one of the reasons silver prices are recovering, with the 10-year bond rate at 2.763%, almost flat.
What to watch
The US economic docket will feature Thursday employment data led by Initial Jobless Claims, alongside other Fed policymakers taking the spotlight. Then, silver traders’ focus will move to Friday’s Nonfarm Payrolls report.
Silver (XAGUSD) Key Technical Levels
- USD/CAD is down on the day as risk bounces mid-week.
- US/China tensions are eyed. Fed speakers, commodities and US data events are in focus.
At 1.2850, USD/CAD is down 0.23%, falling from a high of 1.2891 to a low of 1.2832 so far on the day. The Canadian dollar is correcting Tuesday's fall that occurred at the start of the week due to investors being concerned over the rising tensions between the United States and China.
Risk has bounced, however, on Wednesday on a combination of dialled down Fed rate hike expectations and the fact that US House of Representatives Speaker Nancy Pelosi to Taiwan has not led to WW3.
During a historic trip to Taiwan Wednesday, Pelosi said her visit was intended to make it "unequivocally clear" that the United States would "not abandon" the democratically governed island. However, China responded to Pelosi's trip by launching military exercises, which China's Ministry of Defense said began on Wednesday with drills in both the seas and airspace surrounding Taiwan.
Frictions after the highest-level US visit to Taiwan in 25 years are likely to help support the safe-haven US dollar for now, which is presumed to weigh on the Canadian dollar, especially considering Canada is a major producer of commodities, including oil, so the currency tends to be sensitive to such tensions.
Fed speakers in play
Nevertheless, the USD dollar index, which tracks the greenback against six major peers, has softened from a two-decade high in mid-July as investors reined in expectations of Fed rate hikes. It has sunk from the 109 area down to a recent low of 105.97 over the course of two weeks. However, a trio of Fed officials signalled on Tuesday the central bank remains "completely united" on increasing rates to a level that will put a dent in the highest US inflation since the 1980s. This has given the greenback a booster and lifted it to 106.819 over the course of the past few sessions.
However, its comeback has been halted by less hawkish comments from San Francisco Fed President Mary Daly who said on Tuesday that a year-end Federal Reserve interest rate of 3.4% is a "reasonable place" to get to. Daly, in an interview with Reuters, also said she does not believe the US central bank has yet reached the threshold for its policy rate to be considered restrictive, seeing that as more at the 3% level than the Fed's current policy rate range of 2.25% to 2.50% after last week's meeting.
She added, however, that 50 basis points would be a reasonable thing to do in September. ''We have a lot in the pipeline in tightening but yet to see that in data showing a slowing of the economy, but if we see inflation roaring ahead undauntedly then perhaps 75 be more appropriate.'' US rate futures pared back 75bp view in Sept after Fed's Daly comments.
Meanwhile, US monthly jobs data due on Friday followed by Consumer Price Index on August 10 will help set the tone for the greenback. The consensus for Nonfarm Payrolls is 250k. That is down from 372k in June. The Unemployment Rate is expected to fall in at 3.6%.
As for positioning, speculators’ CAD net long positions strode higher but remain well below recent highs. The market is still quite confident in the Bank of Canada matching the Fed in terms of raising rates.
- USD/CHF buyers reclaim 0.9600 and lift the major to a daily high of 0.9651.
- Broad US dollar strength amidst an augmented risk appetite, tailwind for the USD/CHF.
- A trendline break in the hourly chart exacerbates the USD/CHF rally above 0.9600.
The USD/CHF rallies above the 100-day EMA and extended its gains to two straight days, up by more than a half percent, on risk-on impulse, as US bond yields rise, underpinned by Fed’s hawkish commentary. The greenback is also trading positive, as depicted by the US Dollar Index, climbing 0.18%, sitting at 106.546. At the time of writing, the USD/CHF is trading at 0.9625.
USD/CHF Price Analysis: Technical outlook
In yesterday’s article, I mentioned that “the USD/CHF edged higher, forming a bullish-engulfing chart pattern, a reversal pattern indicating buyers outweigh sellers, keeping risks skewed to the upside.” On Wednesday, the USD/CHF advanced sharply, cracking the 100-day EMA at 0.9626, as the major extended its gains towards the daily high at 0.9651. Although the USD/CHF is retracing, the major remains neutral-to-bullish biased. That said, USD/CHF traders should be aware of a move towards the confluence of the 50 and 20-day EMAs around 0.9674-77.
USD/CHF 1-hour chart
The USD/CHF is upward biased once the major broke solid resistance at a fifteen-day-old downslope trendline around 0.9559, putting a lid on Tuesday’s rally towards 0.9600. Additionally, the major reclaimed the 200-hour EMA at 0.9580, which exacerbated a jump above the 0.9600 area. That said, the USD/CHF first resistance would be the R2 daily pivot at 0.9644, shy of Wednesday’s daily high at 0.9651. Once cleared, the USD/CHF’s following resistance levels will be the July 22 daily high at 0.9704 and July 21 high at 0.9739.
USD/CHF Key Technical Levels
Analysts at CIBC consider that the decision of the Bank of Japan to continue with its easing policy will keep the yen limited. They forecast the USD/JPY at 135 by the end of the third quarter and at 132 by year-end.
Key Quotes:
“To no surprise, the BoJ maintained its commitment to broad monetary policy easing at its recent meeting. We would expect that any change in the policy environment is set to be left to Kuroda’s successor after Q1 2023.”
“The scale of holdings, amplified by recent measures to defend the 0.25% yield cap, may eventually prompt the BoJ to consider an adjustment in the YCC threshold. However, for now, we remain biased towards a perpetuation of easy policy, maintaining a broad defensive status for JPY.”
“BoJ policy inertia needs to be set against a downgrade in growth assumptions and an upgrade in the CPI profile. In terms of the former, the growth assumption for the current fiscal year was trimmed from 2.9% in April to 2.4% now.”
“Yet while inflationary pressures for the current year are revised up, core prices for fiscal year 2023 remain well below target at 1.4%, previously 1.2%. BoJ Governor Kuroda will likely see that tame underlying trend as justification for the BoJ to remain a broad central bank outlier, even if they face the inflation impetus of a modest further depreciation of the yen in the next few months. The lack of any further Fed tightening in 2023 should see the yen recover some lost ground next year.”
The AUD/USD pair is trading around 0.6935 on Wednesday, recovering after reaching weekly lows earlier at 0.6883. Analysts at CIBC expect the pair to re-test the July lows around 0.6600-0.6700.
Key Quotes:
“We have previously highlighted the growing headwinds to domestic and global activity through inflation and hawkish central bank responses that have pressured the AUD to lower levels. We see scope for further underperformance ahead, underscored by the procyclical and high-beta nature of the currency. A prominent illustration of the pro-cyclical exposure of the AUD is now developing via the path of weaker commodity prices.”
“Commodities are being pressured as a result of building concerns over global growth and demand. Correlations between AUD and global commodities including copper and iron ore remain significant. The correlation between the AUD and commodity and equity indices is similarly noteworthy.”
“The balance of current risks still points to further AUD weakness. We expect a re-test of spot toward lows of around 0.6600-0.6700 will be seen before a major low is recorded.”
- USD/MXN is correcting lower after Tuesday’s rally.
- Still looking at 20.80/21.00, but signals are mixed.
The USD/MXN is falling sharply, after having on Tuesday the best day in weeks. The pair peaked at 20.82 and then started to move to the downside. The 20.80 zone has become a strong barrier and a consolidation above should open the doors to 20.90. Above attention would turn to 21.00. A daily close above 21.00 would strengthen the bullish outlook.
If the bearish correction extends, a support area emerges at 20.45 and below at 20.25. A break under 20.25 would negate the bullish bias, exposing 20.00.
Technical indicators area mixed, with Momentum and the RSI moving around midlines, undecided. Price is near flats 20 and 200-day Simple Moving Averages.
USD/MXN Daily chart
-637951417509330986.png)
On the weekly chart, USD/MXN continues to be unable to post a close above 20.60 which should point to further gains in the medium term.
USD/MXN weekly chart
-637951417792536024.png)
- GBP/USD falls for the second straight day, as sellers hold 1.2200, alongside a risk-on impulse.
- Broad US dollar strength keeps the greenback afloat against most G10 currencies.
- Fed officials hawkish commentary bolstered the buck, a headwind for GBP/USD.
- The Bank of England (BoE) is expected to hike rates on the August 4 interest rate decision.
The British pound losses ground and falls during Wednesday’s US session by almost 0.26%. Higher US Treasury yields, “hawkish” commentary by Fed officials, and an improvement in sentiment are headwinds for the GBP/USD.
The GBP/USD is trading at 1.2146, down after hitting a daily high at 1.2207, just above the 50-day EMA, but buyers unable to hold, left the major exposed to selling pressure, so the GBP/USD dived towards a daily low at 1.2100.
GBP/USD weighed by risk-on mood, buoyant US dollar
European and US equities are trading in the green. US data from the Institute for Supply Management revealed that July Non-Manufacturing activity, also known as Services PMI, surprisingly exceeded expectations, rose by 56.7, vs. estimations of 53.5, and higher than June’s 55.9. Data showed consumers shifting from goods to services, as the US ISM Manufacturing report depicted signs of slowing down.
Meanwhile, Fed officials remain crossing wires. San Francisco’s Fed Mary Daly commented that hiking 50 bps “would be reasonable to do in September,” but it would depend on data. She added that if inflation remains higher, a “75 bps hike would be more appropriate.” In the meantime, Richmond’s Fed President Thomas Barkin said that he said that recession fears are inconsistent with the labor market growing nearly 400K a month, with a 3.6% unemployment rate.
Earlier, the St. Louis Fed James Bullard commented that he wants to get the Federal funds rate (FFR) to 3.75-4.00% by year’s end while adding, “We’re going to move inflation back to 2% over time.”
On the UK side, final S&P Global Services and Composite PMIs for July. The former fell to 52.6 vs. 53.3 estimated, while the latter slid to 52.1 vs. 52.8 preliminary. UK’s stagflation fears keep rising while GBP/USD traders prepare for Thursday’s Bank of England (BoE) monetary policy decision, where the “old lady” is expected to raise rates by 50 bps to 1.75%.
What to watch
The UK economic docket will feature the BoE monetary policy decision alongside the S&P Global Construction PMI. Across the pond, the US calendar will feature Initial Jobless Claims, alongside further Fed officials crossing wires.
GBP/USD Key Technical Levels
Federal Reserve Bank of Richmond President Thomas Barkin reiterated on Wednesday that the Fed is committed to getting inflation under control and to returning it to the 2% target, as reported by Reuters.
Additional takeaways
"Fed may not get help from global events and supply chains but it has tools and credibility to deliver that outcome."
"Expecting inflation to come down but not immediately, not suddenly and not predictably."
"Seeing inflation coming down due to flattening demand, supply chain improvements and easing of commodity pressures."
"Recession fears a little inconsistent with monthly jobs growth of nearly 400,000, 3.6% unemployment rate."
"Returning to a normal environment doesn't have to require a calamitous decline in activity."
Market reaction
The dollar preserves its strength against its rivals with the US Dollar Index clinging to daily gains at 106.65.
"We have a lot in the pipeline in tightening but yet to see that in data showing a slowing of the economy," San Francisco Fed President Mary Daly said on Wednesday, as reported by Reuters.
Additional takeaways
"Consumers want to see directional improvement, not getting prices lower than they were some months ago."
"This is a journey, not going to happen overnight."
"I expect unemployment rate to rise a bit as we slow the economy."
"I don't see people experiencing recession right now."
"Not sure if jobs data due this week will show easing of hiring yet, still demand for workers outstripping supply."
"Haven't seen a single piece of data yet indicating we're near a pain point on joblessness."
"About 50% of the elevated inflation we're seeing is from demand factors, 50% from supply factors."
"Firms are reducing vacancies, not laying off workers en masse, supports optimism for soft landing."
"50 bps hike would be a reasonable thing to do in September but if we see inflation roaring ahead undauntedly then perhaps 75 bps hike would be more appropriate."
Market reaction
The US Dollar Index showed no immediate reaction to these remarks and was last seen rising 0.3% on the day at 106.65.
An unexpected rise in the July ISM Service PMI helped the US Dollar on Wednesday. The index showed a “broad pickup in the sector”, point out analysts at Wells Fargo. They consider the jump in new orders bodes well for coming demand, and an array of measures suggests supply chain pressures continue to ease.
Key Quotes:
“The ISM services index not only defied the consensus expectation for a decline but rose by the most in five months in July.”
“While the overall report indicates still solid activity in the sector, some selected industry comments from purchasing managers did point to a weakening economic environment and coming headwinds for sales. Growing fears of recession are likely weighing on optimism to some extent.”
“The employment component remained below the 50-threshold designating expansion from contraction, but it did improve 1.7 points last month to 49.1. This suggests the labor market is cooling, but not rapidly deteriorating as feared given increased concern of an imminent recession.”
“Given the uptick in current activity and new orders, service-providers are still finding it necessary to hire, even if the need for labor is not as great as it has been over the past two years.”
“We expect demand for labor is starting to ease more meaningfully as the labor market shows signs of cooling.”
- US dollar gains momentum versus G10 currencies.
- DXY up for the second day in a row.
- EUR/USD with bearish bias after being rejected from near 1.0300.
The EUR/USD is falling for the second day in a row, and recently printed a fresh six-day low at 1.0121. From Tuesday’s high it has fallen almost 175 pips amid a recovery of the US dollar.
The greenback is rising again on Wednesday, particularly versus G10 currencies as US yields climb further. The 10-year Treasury yield hit 2.85%, the highest level since July 22, before pulling back to 2.79%.
Economic data from the US contribute to the move higher of the USD. The ISM Service PMI rose unexpectedly in July to 56.7 from 55.3, against the market consensus of 53.5. The key report will be on Friday with the non-farm payrolls.
An improvement in risk sentiment limits the upside of the dollar. In Wall Street, the Dow Jones is up by 0.92% and the Nasdaq soars 1.82%. Stocks are breaking a two-day negative streak.
Looking at crucial support
The slide in EUR/USD pushed the price under the 20-day Simple Moving Average (1.0155). Now it is moving closer to the critical short-term support area around 1.0100, a consolidation below should open the doors to more losses.
On the upside, now 1.0150 is the immediate resistance followed by 1.0210 (20-SMA in four hours). As long as below 1.0300, gains seem limited for the pair.
Technical levels
San Francisco Fed President Mary Daly said on Wednesday that they are not yet done with the fight against high inflation, as reported by Reuters.
Additional takeaways
"We are committed to get it down closer to our 2% target."
"Markets are ahead of themselves in expecting rate cuts next year."
"We are united in delivering on both sides of our mandate."
"In my book, 3.4% is a reasonable place for us to get to on rates by year-end."
"June Fed projections remain a reasonable guide for rate path."
"What happens at remaining meetings this year depends on incoming data."
"The early glimmers of progress on inflation really need to show through in the data."
"I am optimistic we can get inflation down with a rate path that does not trigger a deep recession."
"Nothing in the lines of sight right now that indicates the soft landing outcome is not possible."
"I do not think we should ratchet up rates fast and high only to lower rates a few months after that."
"That would be hard on families and businesses."
"Holding rates high for a while could be longer than the period the markets had begun to price in for rate cuts."
Market reaction
The US Dollar Index clings to daily gains after these comments and was last seen rising 0.32% on the day at 106.68.
- Gold price recedes from $1770s as US bond yields climb.
- Overall US dollar strength and a risk-on impulse, headwinds for gold.
- Gold Price Forecast (XAUUSD): Sellers’ failure at $1787 sent the pair stumbling towards the $1750 area.
Gold price slides from around $1770s highs due to high US Treasury yields spurred by Fed policymakers reiterating that they are not done hiking rates, despite the ongoing slowdown in the US economy. Nevertheless, money market futures are still pricing in a 50 bps rate hike in September, while odds of a 75 bps increase lie at 80%. At the time of writing, XAUUSD is trading at $1757.36.
XAUUSD drops as sentiment improves, and Fed commentary
Global equities remain firm one hour after the New York ringing bell. The US House Speaker Nancy Pelosi’s trip to Taiwan finished without casualties yet. July’s US ISM Non-Manufacturing PMIs surprised economists, beating expectations, with the index increasing by 56.7 from 55.3 in June, data showed Wednesday. The services reports contradict Monday’s Manufacturing report, which showed production is slowing its pace, so demand for goods is down due to consumers’ shift to services.
Fed speakers pushed vs. dovish tilt
Since Tuesday, Fed officials reiterated the Fed’s commitment to bring inflation to the 2% target, led by San Francisco Fed Daly, saying that “we are still resolute and completely united” in getting inflation down. Following suit, Cleveland’s Fed Mester said that she needs to see “compelling evidence” of prices getting lower, while Chicago’s Evans commented that “50 bps are reasonable” and added that 75 bps might be needed as data comes out.
On Wednesday, the St. Louis Fed President Bullard said the Q2 slowdown was more concerning than Q1. By the year’s end, Bullard wants to lift the Federal funds rate (FFR) to 3.75-4.00%.
Meanwhile, US Treasury yields are rising sharply, led by 2s, while the US 10-year benchmark note coupon is yielding just 2.801%, compared with the former at 3.151%. So the US 2s-10s yield curve inversion further deepened to -0.346%, as investors have positioned ahead of an impending US recession.
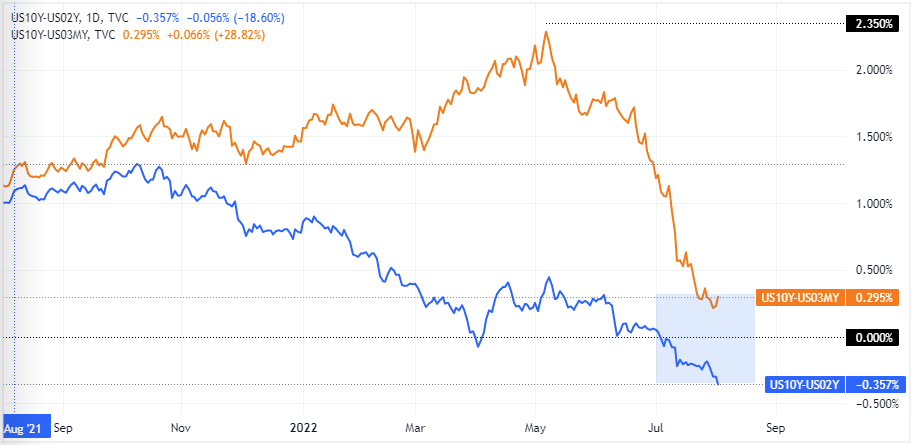
US 2s-10s yield curve inversion
Underpinned by firm US bond yields, the greenback is rising, as shown by the US Dollar Index, gaining 0.34%, at 106.711. The buck has recovered some strength in the last few days, bolstered by safe-haven flows amidst geopolitical jitters.
What to watch
The US calendar will feature Initial Jobless Claims, alongside further Fed officials crossing wires.
Gold Price Forecast (XAUUSD): Technical outlook
Still, XAUUSD is neutral-to-downward biased. Buyers’ failure to crack the May 16 low-turned-resistance at $1787.03 was a solid ceiling level as sellers stepped in, dragging prices to their daily low at $1755.00. However, the XAUUSD downtrend could be capped around the 20-day EMA at $1731.65.
Therefore, XAUUSD’s first support would be the July 29 low at 1752.27. Once cleared, gold will dive to the 20-day EMA. Otherwise, if gold buyers stepped in, their first resistance would be $1772.77.
- US ISM Services PMI came in higher than expected in July.
- Price pressures in the service sector eased modestly.
- US Dollar Index continues to push higher after the data.
The business activity in the US service sector expanded at a more robust pace in July than in June with the ISM Services PMI rising to 56.7 from 55.3. This reading came in better than the market expectation of 53.5.
Further details of the publication revealed that the Prices Paid Index declined to 72.3 from 80.1, compared to the market forecast of 81.6, and the Employment Index improved to 49.1 from 47.4.
Commenting on the survey, "the slight increase in services sector growth was due to an increase in business activity and new orders," noted Anthony Nieves, Chair of the Institute for Supply Management (ISM) Services Business Survey Committee. "Availability issues with overland trucking, a restricted labor pool, various material shortages and inflation continue to be impediments for the services sector."
Market reaction
The US Dollar Index gained traction after this report and was last seen rising 0.25% on the day at 106.60.
- USD/JPY gains positive traction for the second straight day and inches closer to the weekly high.
- The widening US-Japan yields differential, and the risk-on impulse undermine the safe-haven JPY.
- Bulls now seem to wait for sustained strength beyond the 134.00 mark before placing fresh bets.
The USD/JPY pair catches fresh bids near the 132.30-132.25 region and steadily climbs back closer to the weekly high set earlier this Wednesday. The pair is currently trading around the 133.65-133.70 area, up nearly 0.40% for the day and is supported by a combination of factors.
A further rise in the US Treasury bond yields, bolstered by the overnight hawkish remarks by several Fed officials, widens the US-Japan rate differential. This, along with the risk-on impulse, undermines the safe-haven Japanese yen and pushes the USD/JPY higher for the second successive day.
Looking at the broader picture, the post-FOMC sharp downfall stalled on Tuesday near the 130.40-130.35 confluence support. The mentioned area comprises the 100-day SMA and the 50% Fibonacci retracement level of the April-July rally, which should now act as a pivotal point for the USD/JPY pair.
Bullish traders, meanwhile, might wait for some follow-through buying beyond the 134.00 mark before positioning for any further gains. The USD/JPY pair could then climb to the 134.75 intermediate hurdle en-route to the 135.00 psychological mark and the 23.6% Fibo. level, around the 135.15 region.
On the flip side, the 38.2% Fibo. level, around the 132.50 area, now seems to protect the immediate downside ahead of the 132.00 round figure and the 131.65-131.60 region. Failure to defend the said support levels could make the USD/JPY pair vulnerable to sliding back below the 131.00 mark.
The downward trajectory could further get extended towards the 130.40-130.35 confluence support. A convincing break below the latter would be seen as a fresh trigger for bears and set the stage for an extension of the recent corrective slide from the 24-year peak touched on July 14.
USD/JPY daily chart
-637951317212664641.png)
Key levels to watch
- USD/TRY clinches new 2022 highs just below 18.00.
- Türkiye inflation extended the upside in July at 79.60% YoY.
- Producer Prices also came on the strong side in July.
The Turkish lira extends the weekly depreciation vs. the greenback and lifts USD/TRY to new YTD tops around 17.97 on Wednesday.
USD/TRY up on elevated July CPI
USD/TRY adds to Tuesday’s gains and trades at shouting distance from the key hurdle at the 18.00 mark midweek.
The selling bias in the lira intensified after inflation figures tracked by the CPI rose 79.60% in the year to July, the fastest pace in the last 24 years. The CPI print, however, was lower than what consensus was expecting and remained propped up by elevated energy and commodity prices.
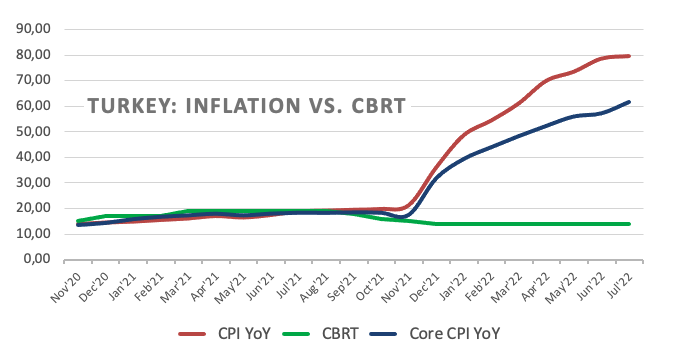
In addition, the Core CPI rose 61.69% YoY and Producer Prices surged 144.61% over the last twelve months.
What to look for around TRY
The upside bias in USD/TRY remains unchanged and stays on course to revisit the key 18.00 zone.
In the meantime, the lira’s price action is expected to keep gyrating around the performance of energy prices, which appear directly correlated to developments from the war in Ukraine, the broad risk appetite trends and the Fed’s rate path in the next months.
Extra risks facing the Turkish currency also come from the domestic backyard, as inflation gives no signs of abating, real interest rates remain entrenched in negative figures and the political pressure to keep the CBRT biased towards low interest rates remain omnipresent. In addition, there seems to be no Plan B to attract foreign currency in a context where the country’s FX reserves dwindle by the day.
Key events in Türkiye this week: Inflation Rate, Producer Prices (Wednesday).
Eminent issues on the back boiler: FX intervention by the CBRT. Progress (or lack of it) of the government’s new scheme oriented to support the lira via protected time deposits. Constant government pressure on the CBRT vs. bank’s credibility/independence. Bouts of geopolitical concerns. Structural reforms. Presidential/Parliamentary elections in June 23.
USD/TRY key levels
So far, the pair is gaining 0.08% at 17.9425 and faces the immediate target at 17.9658 (2022 high August 3) seconded by 18.2582 (all-time high December 20) and then 19.00 (round level). On the other hand, a breach of 17.1903 (weekly low July 15) would pave the way for 17.0474 (55-day SMA) and finally 16.0365 (monthly low June 27).
- US S&P Global Services PMI fell into contraction territory in July.
- US Dollar Index continues to fluctuate above 106.00 after the data.
The business activity in the US service sector declined for the first time in over two years in July with the S&P Global Services PMI dropping to 47.3 from 52.7 in June. This reading came in slightly better than the market expectation and the flash estimate of 47.
Further details of the publication revealed that the Composite PMI fell to 47.7 in July from 52.3 in June.
Commenting on the survey's findings, "US economic conditions worsened markedly in July, with business activity falling across both the manufacturing and service sectors," said Chris Williamson, Chief Business Economist at S&P Global Market Intelligence. "Excluding pandemic lockdown months, the overall fall in output was the largest recorded since the global financial crisis and signals a strong likelihood that the economy will contract for a third consecutive quarter."
Market reaction
The US Dollar Index showed no immediate reaction to this report and was last seen trading flat on the day at 106.30.
In a statement published following its meeting, OPEC said that insufficient investment will impact the availability of adequate oil supply to meet growing demand beyond 2023, as reported by Reuters.
"The severely limited availability of excess capacity necessitates utilizing it with great caution in response to severe supply disruptions," the group added.
Market reaction
Crude oil prices turned south and erased a large portion of the daily gains. As of writing, the barrel of West Texas Intermediate (WTI) was trading at $94.60, where it was down 0.85% on a daily basis.
- GBP/USD gains some positive traction on Wednesday, though lacks follow-through.
- The risk-on impulse is undermining the safe-haven USD and offering some support.
- Rising US bond yields help limit the USD losses and keep a lid on any further gains.
- Investors also seem reluctant ahead of the BoE on Thursday and the NFP on Friday.
The GBP/USD pair defends support marked by the lower end of a nearly three-week-old ascending channel and attract some buying near the 1.2135 region on Wednesday.
The risk-on impulse - as depicted by a generally positive tone around the equity markets - undermines the safe-haven US dollar and offers some support to the GBP/USD pair. That said, a further rise in the US Treasury bond yields, bolstered by hawkish comments by several Fed officials on Tuesday, helps limit losses for the greenback.
The GBP/USD pair, meanwhile, struggles to find acceptance above the 1.2200 round figure and remains at the mercy of the USD price dynamics. Traders now look forward to the US ISM Services PMI for a fresh impetus, though the focus would be on the Bank of England meeting on Thursday and the US monthly jobs report (NFP) on Friday.
In the meantime, the ascending trend-channel support, near the 1.2135 area, might continue to protect the immediate downside. A convincing break below could prompt some technical selling and drag the GBP/USD pair further towards testing the 1.2100 mark. This is closely followed by the 200-period SMA on the 4-hour chart.
Some follow-through selling below the latter would be seen as a fresh trigger for bearish traders and make the GBP/USD pair vulnerable. The downfall could then accelerate towards the 1.2030-1.2025 intermediate support en-route the 1.2000 psychological mark and the next relevant support near the 1.1975-1.1970 horizontal zone.
On the flip side, the 1.2200 mark now seems to act as an immediate hurdle, above which the GBP/USD could climb back to the 1.2250 resistance. Sustained strength beyond the latter should pave the way for an extension of the recent recovery from the lowest level since March 2020 and allow spot prices to aim to conquer the 1.2300 level.
GBP/USD 4-hour chart
-637951295022889255.png)
Key levels to watch
US ISM Services PMI Overview
The Institute of Supply Management (ISM) will release the Non-Manufacturing Purchasing Managers' Index (PMI) - also known as the ISM Services PMI – at 14:00 GMT this Wednesday. The gauge is expected to drop to 53.5 in July from 55.3 in the previous month. Given that the Fed looks more at inflation than growth, investors will keep a close eye on the Prices Paid sub-component, which is expected to rise to 81.6 from 80.1 in June.
According to Eren Sengezer, European Session Lead Analyst at FXStreet: “Markets should pay close attention to the Employment component as well. Ahead of Friday’s jobs report, a print below 50 would point to a contraction in the service sector employment and put additional weight on the USD’s shoulders.”
How Could it Affect EUR/USD?
Ahead of the key release, the risk-on impulse in the equity markets was seen undermining the safe-haven US dollar. A weaker-than-expected US macro data could exert additional downward pressure on the buck. That said, a further rise in the US Treasury bond yields, bolstered by the overnight hawkish comments by several Fed officials, should limit deeper USD losses.
Conversely, a stronger print would be enough to provide a modest lift to the greenback and prompt fresh selling around the EUR/USD pair. The immediate market reaction, however, is more likely to be short-lived as investors might prefer to wait on the sidelines ahead of the US monthly jobs report (NFP) on Friday. Nevertheless, a significant divergence from the expected reading would still influence the USD and produce some meaningful trading opportunities around the EUR/USD pair.
Eren Sengezer, meanwhile, outlined important technical levels to trade the major: “EUR/USD faces immediate resistance at 1.0200 (psychological level, 50-period SMA on the four-hour chart). As long as this level stays intact, buyers could opt to remain on the sidelines. In case the pair reclaims that level and starts using it as support, additional gains toward 1.0230 (Fibonacci 38.2% retracement level of the latest downtrend), 1.0275 (200-period SMA) and 1.0300 (Fibonacci 50% retracement) could be witnessed.”
“On the downside, 1.0150 (Fibonacci 23.6% retracement) aligns as first support ahead of 1.0100 (psychological level, static level). A four-hour close below the latter could be seen as a significant bearish development and trigger another leg lower toward parity,” Eren added further.
Key Notes
• US July ISM Services PMI Preview: Inflation component holds the key
• EUR/USD Forecast: Euro to have a tough time regathering recovery momentum
• EUR/USD Price Analysis: Next on the upside comes 1.0300
About the US ISM manufacturing PMI
The Institute for Supply Management (ISM) Manufacturing Index shows business conditions in the US manufacturing sector. It is a significant indicator of the overall economic condition in the US. A result above 50 is seen as positive (or bullish) for the USD, whereas a result below 50 is seen as negative (or bearish).
- EUR/USD resumes the upside and advances above 1.0200.
- The next target emerges at the August top near 1.0300.
EUR/USD regains buying interest and reclaims part of the ground lost following Tuesday’s sell-off to the 1.0160 zone.
The continuation of the recovery is predicted to target the August high at 1.0293 (August 2). Above the latter spot could accelerate its losses to the next hurdle at the 55-day SMA, today at 1.0417.
In the longer run, the pair’s bearish view is expected to prevail as long as it trades below the 200-day SMA at 1.0941.
EUR/USD daily chart
Citing a source familiar with the matter, Reuters reported on Wednesday that the Organization of the Petroleum Exporting Countries (OPEC) and allies, collectively known as OPEC+, have agreed to raise the oil output by 100,000 barres per day in September.
Market reaction
Crude oil prices gained traction on this headline. As of writing, the barrel of West Texas Intermediate (WTI) was trading at $96.30, where it was up 2.6% on a daily basis. Meanwhile, the barrel of Brent was up 2% at $101.90.
- USD/CAD witnesses an intraday turnaround from a one-week high touched earlier this Wednesday.
- A pickup in crude oil prices underpins the loonie and exerts pressure amid modest USD weakness.
- Rising US bond yields could lend some support to the USD and limit any further losses for the pair.
The USD/CAD pair attracts some selling in the vicinity of the 1.2900 mark on Wednesday and stalls this week's recovery move from its lowest level since June 10. The pair continues losing ground through the mid-European session and drops to the 1.2835 region in the last hour, snapping a two-day winning streak to a one-week high.
The US dollar struggles to capitalize on the overnight bounce from a multi-week low and meets with a fresh supply, which, in turn, exerts some downward pressure on the USD/CAD pair. A goodish recovery in the global risk sentiment - as depicted by a generally positive tone around the equity markets - is weighing on the safe-haven greenback.
Apart from this, a goodish pickup in crude oil prices undermines the commodity-linked loonie and also contributes to the offered tone surrounding the USD/CAD pair. Expectations that OPEC+ producers would keep output steady - amid fears that a slowdown in global growth will hit fuel demand - turn out to be a key factor boosting crude oil prices.
That said, indications that the current tight supply is abating could act as a headwind for crude oil prices. Apart from this, some follow-through rise in the US Treasury bond yields, bolstered by the overnight hawkish comments by several Fed officials, could revive the USD demand and help limit any further losses for the USD/CAD pair.
Investors might also refrain from placing aggressive bets and prefer to wait on the sidelines ahead of this week's important macro releases. The closely-watched monthly employment details from the US and Canada are scheduled on Friday. The NFP report, especially, would influence the USD and provide a fresh directional impetus to the USD/CAD pair.
In the meantime, traders on Wednesday would take cues from the US ISM Services PMI. This, along with the US bond yields and the broader risk sentiment, would drive the USD demand. Traders would further take cues from the headlines coming out of the OPEC+ meeting and oil price dynamics to grab short-term opportunities around the USD/CAD pair.
Technical levels to watch
Win Thin, Global Head of Currency Strategy at BBH, maintains the medium-term bullish outlook for the US dollar amid more hawkish remarks by Fed officials on Tuesday.
Key Quotes:
“The dollar outlook has improved as the Fed pushes back against the perceived pivot. DXY traded as high as 106.549 today but has since fallen back to trade near 106.20.
Clean break above 106.518 would set up a test of the July 27 high near 107.246.”
“We maintain our strong dollar call as Fed officials are making it clear that markets misread the Fed’s commitment to lowering inflation. However, the greenback is unlikely to get much more traction in the absence of strong economic data. This week’s U.S. data will be key for the medium-term dollar outlook.”
“It should leave no doubt as to the Fed's intent to keep hiking rates until inflation comes down, no matter the cost to growth and employment. The full court press by the Fed is likely to continue today. Bullard, Harker, Daly, Barkin, and Kashkari all speak and likely to maintain the hawkish tone established yesterday.”
“While yields are sharply higher, the needle hasn't moved much in terms of Fed expectations, as the swaps market still sees a terminal Fed Funds rate of 3.5% Eventually, we think this will adjust higher to something closer to Evans' 3.75-4.0% call.”
- DXY reverses the earlier bull run to the 106.50/55 band.
- The resumption of the selling bias could extend to 105.00.
DXY leaves behind Tuesday’s strong advance and sparked a corrective downside soon after hitting new 3-day peaks in the mid-106.00s on Tuesday.
Tuesday’s bounce did not clear any up barrier of note and thus leaves the index vulnerable to further weakness in the very near term at least. On this, the dollar faces the tangible chance to slip back to the multi-week lows in the 105.00 region (August 2) in the short term. This initial area of contention remains propped up by the proximity of the 55-day SMA, today at 104.84.
Furthermore, the broader bullish view in the dollar remains in place while above the 200-day SMA at 99.62.
DXY daily chart
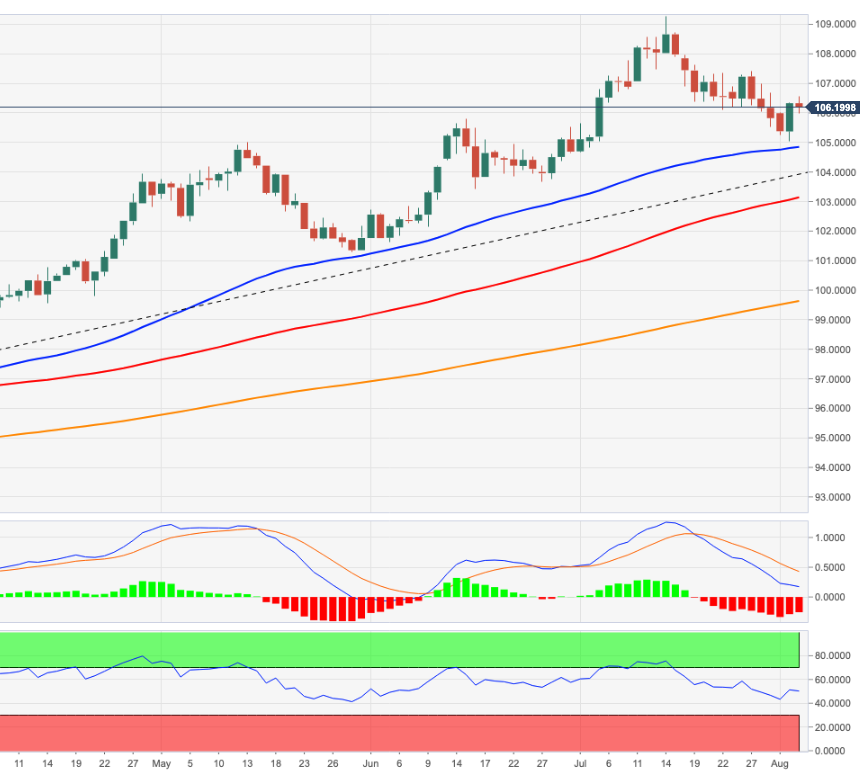
In an interview with CNBC on Wednesday, St. Louis Federal Reserve Bank President James Bullard said that he still expects the Gross Domestic Product (GDP) growth to be positive in the second half of the year, as reported by Reuters.
Additional takeaways
"Second quarter slowdown was more concerning than the first quarter."
"Fed is following data very carefully; think we'll get it right."
"Still some ways to go to get to a restrictive monetary policy."
"Still want to get to 3.75 to 4% this year; I prefer this type of frontloading."
"We're going to move inflation back to 2% over time."
Market reaction
These comments don't seem to be having a noticeable impact on the dollar's performance against its rivals. As of writing, the US Dollar Index was down 0.2% on the day at 106.22.
The Organization of the Petroleum Exporting Countries (OPEC) and allies, collectively known as OPEC+, are highly likely to consider a modest increase in oil production at Wednesday's meeting, Reuters reported on Thursday, citing two sources.
Earlier in the day, the Financial Times reported that Saudi Arabia was warming to the idea of raising the oil output.
Market reaction
Crude oil prices showed no immediate reaction to this headline. As of writing, the barrel of West Texas Intermediate (WTI) was trading at $93.70, where it was virtually unchanged on a daily basis.
Economist at UOB Group, Ho Woei Chen, CFA, assesses the latest inflation figures in South Korea vs. the tightening bias from the Bank of Korea (BoK).
Key Takeaways
“South Korea’s headline inflation rose to fresh high in nearly 24 years, at 6.3% y/y in Jul (Bloomberg est: 6.3%, Jun: 6.0%) and core inflation (excluding agricultural products & oils) also strengthened to 4.5% y/y (Bloomberg est: 4.5%, Jun: 4.4%).”
“Headline inflation is likely to stay above 6.0% for at least another two more months. We maintain our forecast for 2022 and 2023 inflation at 5.0% and 2.5% respectively.”
“Higher inflation in Jul likely cements another interest rate hike at the upcoming monetary policy decision on 25 Aug but Bank of Korea (BOK) is expected to revert to 25 bps increase.”
“Despite weakening PMI in recent months, South Korea’s export has held up fairly well. However, higher import costs again drove the trade gap as the trade deficit widened to USD4.67 bn in Jul from USD2.58bn, the largest in six months. This has continued to weigh on the Korean won.”
- EUR/JPY adds to Tuesday’s bounce off the 133.40 region.
- The 200-day SMA at near 133.70 holds the downside so far.
EUR/JPY extends the rebound to the boundaries of 136.00 after bottoming out in the vicinity of the 200-day SMA on Tuesday (133.71).
Further upside in the cross appears in store for the time being, with the interim hurdles at the 100- and 55-day SMAs at 137.78 and 139.45, respectively.
While above the 200-day SMA, the outlook for the cross is expected to remain constructive.
EUR/JPY daily chart
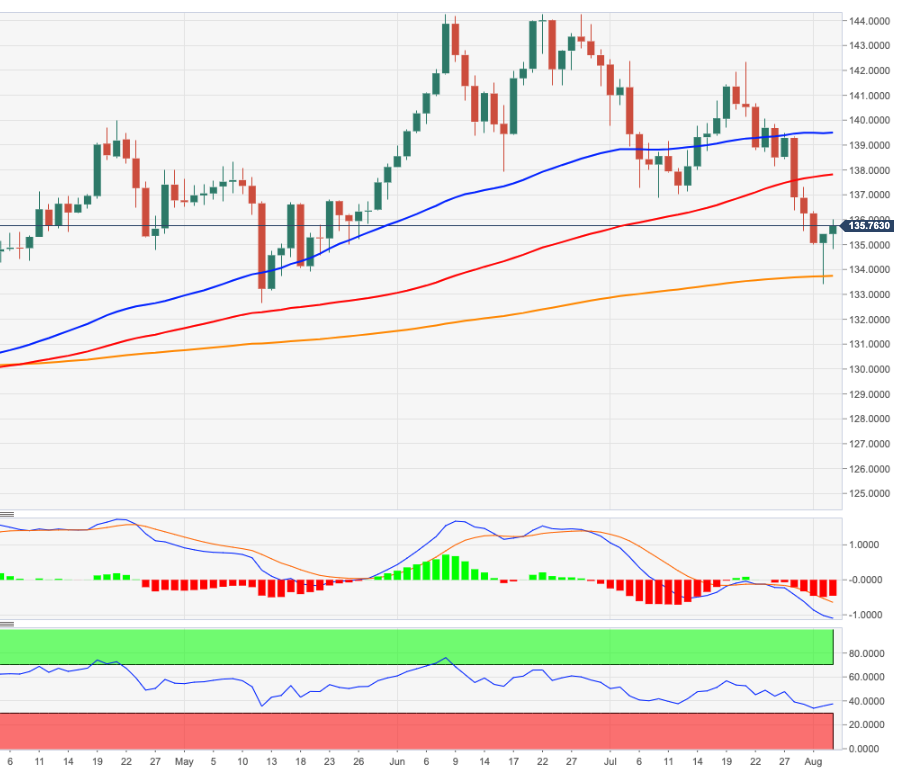
The Global Strategy Team at TD Securities (TDS) provided a quick analysis of Wednesday's mixed employment details from New Zealand, which reaffirmed bets for a further policy tightening by the RBNZ.
Key Quotes:
“As we expected, Q2'22 labour market softened slightly with the unemployment rate edging higher to 3.3% (cons: 3.1%, Q1'22: 3.2%) after hitting a record low last quarter. Employment growth disappointed expectations and was flat at 0% q/q (cons: 0.4%, TD: 0.5%. Q1: 0.1%) while participation rate also inched lower to 70.8% (Q1: 70.9%).”
“Despite the labour market report disappointing expectations, it still highlights a tight labour market with little spare capacity as the underutilisation stayed unchanged at 9.2%. Wages rose 1.3% q/q (cons: 1.1%, RBNZ: 1.2%), bringing annual wage growth to 3.4%, the fastest since 2008.“
“This is likely to add to non-tradeables inflation (domestic prices) in the quarters ahead. We expect the RBNZ to continue hiking by 50 bps at its August meeting given record high inflation and a tight labour market.”
- USD/CHF gains traction for the second successive day on Wednesday despite a softer USD.
- A positive risk tone undermines the safe-haven CHF and remains supportive of the uptick.
- Investors now look forward to the US ISM Services PMI for short-term trading opportunities.
The USD/CHF pair attracts some dip-buying near the 0.9540 area on Wednesday and turns positive for the second successive day. The momentum lifts spot prices to a four-day high during the first half of the European session, with bulls now awaiting a sustained move beyond the 0.9600 round-figure mark.
Despite tensions caused by US House Speaker Nancy Pelosi's Taiwan visit, largely impressive corporate earnings boosted investors' confidence. This is evident from a generally positive tone around the equity markets, which is undermining the safe-haven Swiss franc and lending some support to the USD/CHF pair.
The US dollar, on the other hand, failed to capitalize on the overnight goodish rebound from a multi-week low amid a mixed performance in the US bond markets. This could be the only factor holding back bulls from placing aggressive bets around the USD/CHF pair and capping any further gains, at least for the time being.
That said, hawkish remarks by several Fed officials, hinting that more interest rate hikes are coming in the near term, might continue to act as a tailwind for the USD. This, in turn, should support the USD/CHF pair to build on the previous day's strong recovery move from the 0.9470 region, or a four-month low.
Market participants now look forward to the release of the US ISM Services PMI, due later during the early North American session. This, along with the US bond yields, could drive the USD and provide some impetus to the USD/CHF pair. Traders would also take cues from the broader risk sentiment to grab short-term opportunities.
Technical levels to watch
Economist at UOB Group Lee Sue Ann reviews the latest RBA event (August 2).
Key Takeaways
“The Reserve Bank of Australia (RBA) decided to increase the cash rate target by 50bps to 1.85%. It also increased the interest rate on Exchange Settlement balances by 50bps to 1.75%. This is the third consecutive month that the RBA has raised rates by 50bps, and at 1.85%, the cash rate is at its highest since Apr 2016.”
“For some time, though, we have been forecasting that the RBA will soon slow to 25bps increments. Today’s accompanying statement reinforces our view, with the RBA noting that “it is not on a preset path”. We see this as a tweak to its policy language, hinting a slower pace of rate hikes ahead. We still expect the RBA to hike in coming months but hikes are likely to be slower and shallower. Our forecast remains for the OCR to reach 2.10% by year-end, and for it to reach 2.50% by mid2023.”
“We acknowledge the uncertainty surrounding our forecasts and are mindful of the RBA’s desire to be data dependent as it closely monitors global and domestic developments. Attention will now turn to the quarterly release of the RBA’s Statement on Monetary Policy (SoMP) on Fri (5 Aug), followed by 2Q22 wage price index data on 17 Aug.”
Commerzbank, one of Germany’s biggest corporate lenders, warned of “a chain reaction with unforeseeable consequences” for the economy, in the wake of a serious shortage of natural gas supplies, the Financial Times (FT) reports on Wednesday.
Key quotes
Warns of a “severe recession” in the country if Russia cut off gas supplies, saying it could trigger an economic crisis similar “to the one that occurred after the financial crisis in 2009”.
The rationing of gas would then “probably be inevitable.”
“The impact of shortages would spread quickly through the German economy since natural gas is not just a crucial source of energy but also an important raw material used in other industries.”
- Gold regains positive traction on Wednesday amid escalating US-China tensions over Taiwan.
- The emergence of fresh USD selling turns out to be another factor lending support to the metal.
- The overnight hawkish remarks by several Fed officials keep a lid on any meaningful upside.
Gold attracts some dip-buying near the $1,755 region on Wednesday and stalls the previous day's sharp retracement slide from a four-week high. The XAU/USD maintains its bid tone through the first half of the European session and is currently trading around the $1,766 area, just below the daily high.
Heightened geopolitical tensions caused by US House Speaker Nancy Pelosi's Taiwan visit turns out to be a key factor offering support to the safe-haven gold. China condemned the highest-level US trip to Taiwan in 25 years and responded with a flurry of military exercises, and announcing the suspension of several agricultural imports from Taiwan.
The intraday uptick is further supported by the emergence of some US dollar selling, which tends to benefit the dollar-denominated commodity. A mixed performance around the US Treasury bond yields fails to assist the USD to capitalize on the overnight bounce from a multi-week low, though bets for further Fed rate hikes help limit losses.
In fact, several Fed officials sounded hawkish on Tuesday and hinted that more interest rate hikes are coming in the near term. The markets were quick to react and assisted the US Treasury bond yields to recover swiftly from the lowest level since April. This is holding back bulls from placing aggressive bets around the non-yielding gold.
Furthermore, investors seem reluctant and prefer to wait for a fresh catalyst before positioning for the resumption of the recent recovery from the $1,680 area, or a 15-month low touched in July. Hence, the market focus would remain glued to the release of the closely-watched US monthly jobs report - popularly known as NFP on Friday.
The data would play a key role in influencing the near-term USD price dynamics and help determine the next leg of a directional move for gold. In the meantime, traders on Wednesday might take cues from the release of the US ISM Services PMI. This, along with the US bond yields, could drive the USD demand and provide some impetus.
Technical levels to watch
Further consolidation in USD/CNH remains in place for the timebeing, likely between 6.7350 and 6.8000, noted FX Strategists at UOB Group Lee Sue Ann and Quek Ser Leang.
Key Quotes
24-hour view: “Our view for USD to ‘strengthen further to 6.8000’ was incorrect as it whipsawed between 6.7494 and 6.7945 before closing slightly lower at 6.7768. The volatile price actions have resulted in a mixed outlook. Further choppy movement is not ruled out for today, likely between 6.7500 and 6.7910.’
Next 1-3 weeks: “Yesterday (02 Aug, spot at 6.7900), we held the view that USD is likely to advance to 6.8100. Our view was invalidated quickly as USD dropped below our ‘strong support’ level at 6.7500 (low has been 6.7494). It appears that USD is not ready to head higher. From here, USD is likely trade between 6.7350 and 6.8000.”
Analysts at TD Securities offer a sneak peek at what to expect from the Bank of England (BOE) interest rate decision due on ‘Super Thursday’.
Also read: BOE Rate Decision Preview: Bailey to follow Powell’s footsteps with a dovish hike
Key quotes
“We expect a relatively dovish 50bps hike, alongside a very cautious tone on the outlook. Inflation is likely to be revised up (esp near-term), but at the same time the forecasts will show slack opening up and inflation falling below target by 2025.”
“A cautious hike should support our view of GBP rates outperformance vs. EUR. Meanwhile, details on QT argues for cheapening of the 10y ASW from their current rich levels.”
“Buy the rumor, sell the fact. With the BoE expected to caution against extrapolating 50bps hikes and some dissenters, GBP may not get much lift from this meeting. External factors are more likely to be relevant.”
Ahead of the OPEC and its allies (OPEC+) meeting on Wednesday, Kazakhstan Energy Minister Bolat Akchulakov said the alliance might have to raise oil production to avoid market overheating.
Akchulakov said, "we have always said that the preferred price corridor is $60-80 per barrel. Today the price is $100. So we might have to raise output to avoid overheating.”
The OPEC has been increasing output in line with its targets by about 430,000-650,000 barrels per day a month in recent months. The market has been largely expecting OPEC+ to keep output steady or opt for a slight increase in Wednesday’s meeting.
Market reaction
WTI is struggling to extend the recovery above the $93 mark. The black gold is trading at $92.88, down 0.32% on the day, as of writing.
- USD/JPY struggles to gain any meaningful traction and remains below the weekly high.
- Modest USD weakness turns out to be a key factor acting as a headwind for the major.
- The Fed-BoJ policy divergence, a positive risk tone undermines the JPY and offers support.
The USD/JPY pair fails to capitalize on the previous day's solid bounce from a nearly two-month low and seesaws between tepid gains/minor losses on Wednesday. Spot prices seem to have stabilized below the weekly high and held steady around the 133.25 region through the first half of the European session.
The US dollar meets with some supply amid a mixed performance around the US Treasury bond yields, which turns out to be a key factor acting as a headwind for the USD/JPY pair. That said, signs of stability in the equity markets, along with the Fed-Bank of Japan policy divergence, undermine the safe-haven Japanese yen and offer some support to the major.
It is worth recalling that several Fed officials hinted that more interest rate hikes are coming in the near term. In contrast, the Japanese central bank has repeatedly stuck to its dovish stance and called for continued monetary easing in the absence of wage growth. This, in turn, supports prospects for a further appreciating move for the USD/JPY pair.
Investors, however, seem reluctant and await a fresh catalyst before positioning for the next leg of a directional move. Hence, the focus would remain glued to the release of the closely-watched US monthly jobs report - popularly known as NFP on Friday. The data would play a key role in influencing the USD and determining the near-term trajectory for the USD/JPY pair.
In the meantime, traders on Wednesday would take cues from the US ISM Services PMI, due later during the early North American session. Apart from this, the US bond yields, would drive the USD demand and provide some impetus to the USD/JPY pair. Traders would further take cues from the broader market risk sentiment to grab short-term opportunities.
Technical levels to watch
- Eurozone Retail Sales stood at -1.2% MoM in June vs. 0.0% expected.
- Retail Sales in the bloc arrived at -3.7% YoY in June vs. -1.7% expected.
Eurozone’s Retail Sales fell by 1.2% MoM in June versus 0.0% expected and 0.4% last, the official figures released by Eurostat showed on Wednesday.
On an annualized basis, the bloc’s Retail Sales came in at -3.7% in June versus 0.4% recorded in May and -1.7% estimated.
Separately, Eurozone’s Producer Price Index (PPI) arrived at 35.8% and 1.1%, YoY and MoM respectively. Both readings surpassed market expectations.
FX implications
The euro is holding the renewed upside below 1.0200 on the mixed Eurozone data. At the time of writing, the major is trading at 1.0190, higher by 0.24% on the day.
About Eurozone Retail Sales
The Retail Sales released by Eurostat are a measure of changes in sales of the Eurozone retail sector. It shows the performance of the retail sector in the short term. Percent changes reflect the rate of changes of such sales. The changes are widely followed as an indicator of consumer spending. Usually, the positive economic growth anticipates "Bullish" for the EUR, while a low reading is seen as negative, or bearish, for the EUR.
- UK Final Services PMI sees a downward revision to 52.6 in July.
- GBP/USD keeps its recovery mode intact around 1.2200 on the dismal data.
- Eyes on US-Sino tensions over Taiwan and US ISM Services PMI data.
The UK services sector activity expanded less than expected in July, the final report from IHS Markit confirmed this Wednesday.
The seasonally adjusted S&P Global/CIPS UK Services Purchasing Managers’ Index (PMI) was revised lower to 52.6 in July versus 53.3 expected and 53.3 – last month’s flash reading.
The S&P Global/CIPS UK Composite PMI arrived at 52.1 in July vs. 52.8 expected and 52.8 previous reading.
Key points
Slowest output growth in 17 months of expansion.
Employment rises markedly again, despite subdued order books.
Input cost inflation softens to its lowest since December 2021.
Tim Moore, Economics Director at S&P Global Market Intelligence, which compiles the survey
“UK service providers reported their worst month for business activity expansion since the national lockdown in February 2021. Reduced levels of discretionary consumer spending and efforts by businesses to contain expenses due to escalating inflation have combined to squeeze demand across the service economy.”
“The near-term outlook also looks subdued, as new order growth held close to June's 16-month low and business optimism was the second-weakest since May 2020.”
FX implications
GBP/USD keeps its range near 1.2200 on the downbeat UK data. The spot is up 0.18% on the day.
- NZD/USD bounces from a one-week low touched in reaction to the mixed domestic jobs report.
- A positive risk tone underpins the safe-haven USD and offers support to the risk-sensitive kiwi.
- Recession fears, hawkish remarks by Fed officials limit the USD downside and cap the major.
The NZD/USD pair trims a part of its heavy intraday losses to a one-week low and climbs back above mid-0.6200s during the early European session. The attempted recovery, however, lacks follow-through and spot prices remain in the red, down around 0.20% for the day.
The US dollar edges lower during the first half of trading action on Wednesday, which, in turn, helps the NZD/USD pair to attract some buying near the 0.6215-0.6210 area. Signs of stability in the equity markets fail to assist the safe-haven buck to capitalize on the overnight bounce from a multi-week low and offer some support to the risk-sensitive kiwi. That said, a combination of factors contributes to keeping a lid on any meaningful recovery for the major.
The New Zealand dollar continues to be weighed down by Wednesday's mixed employment details, showing that the jobless rate unexpectedly rose from a record low to 3.3% in the second quarter. This, to a larger extent, overshadowed strong wage growth data, which accelerated to 3.4%, or the fastest pace since 2008. The data suggests that the Reserve Bank of New Zealand (RBNZ) may need to keep raising interest rates, though did little to impress bulls.
Investors remain concerned about the growing risk of a global economic downturn. Apart from this, diplomatic tensions over US House Speaker Nancy Pelosi's Taiwan visit are capping optimistic moves in the markets. Furthermore, the overnight hawkish remarks by Fed officials, hinting that more interest rates are coming in the near term, act as a tailwind for the buck. This, in turn, is holding back bulls from placing fresh bets around the NZD/USD pair.
Market participants now look forward to Wednesday's release of the US ISM Serviced PMI, due later during the early North American session. Apart from this, the US bond yields could influence the USD price dynamics and provide some impetus to the NZD/USD pair. Traders might further take cues from the broader market risk sentiment, though the focus would remain glued to the closely-watched US monthly jobs report - popularly known as NFP on Friday.
Technical levels to watch
- EUR/USD leaves behind Tuesday’s pullback and approaches 1.0200.
- Germany final Services PMI remained in contraction territory in July.
- US ISM Non-Manufacturing takes centre stage later in the NA session.
The generalized improvement in the risk complex lifts EUR/USD back to the vicinity of the 1.0200 neighbourhood on Wednesday.
EUR/USD up on dollar weakness
Following Tuesday’s sudden retracement, EUR/USD manages to regain balance and resumes the upside with immediate target at the 1.0200 region midweek ahead of the weekly top near 1.0300 (August 2).
The recovery in the pair follows diminishing risk aversion in the global markets, despite developments from Pelosi’s visit to Taiwan should keep gathering attention in the very near term.
No news from the euro docket, where final prints saw the Services PMI in Germany at 49.7 and 51.2 in the broader Euroland. Earlier in the session, the German trade surplus widened to €6.4B in June.
Across the pond, the attention is expected to be on the ISM Non-Manufacturing seconded by the final S&P Global Services PMI, Factory Orders and the speech by Philly Fed P.Harker.
What to look for around EUR
EUR/USD’s rebound came short of the 1.0300 region so far on Tuesday amidst a moderate recovery in the greenback, which appeared propped up by the re-emergence of the risk aversion.
Price action around the European currency, in the meantime, is expected to closely follow dollar dynamics, geopolitical concerns, fragmentation worries and the Fed-ECB divergence.
On the negatives for the single currency emerges the so far increasing speculation of a potential recession in the region, which looks propped up by dwindling sentiment readings among investors and the renewed downtrend in some fundamentals.
Key events in the euro area this week: Germany Balance of Trade, Final Services PMI (Wednesday) – Germany Construction PMI (Thursday).
Eminent issues on the back boiler: Continuation of the ECB hiking cycle. Italian elections in late September. Fragmentation risks amidst the ECB’s normalization of monetary conditions. Impact of the war in Ukraine on the region’s growth prospects and inflation.
EUR/USD levels to watch
So far, spot is advancing 0.20% at 1.0180 and a breakout of 1.0293 (monthly high August 2) would target 1.0417 (55-day SMA) en route to 1.0615 (weekly high June 27). Next on the downside comes the next support at 1.0096 (weekly low July 26) seconded by 1.0000 (psychological level) and finally 0.9952 (2022 low July 14).
According to FX Strategists at UOB Group Lee Sue Ann and Quek Ser Leang, USD/JPY is now seen side-lined with the 131.30-135.60 range in the next few weeks.
Key Quotes
24-hour view: “We highlighted yesterday that ‘further USD weakness would not be surprising but it is left to be seen if 130.00 would come into the picture today’. USD subsequently dropped to 130.39 before staging a dramatic turnaround as it rocketed to 133.18. USD extended its advance during early Asian hours and could rise further. In view of the overbought conditions, the resistance at 134.60 is unlikely to come under threat (there is another resistance at 134.00). Support is at 133.00 followed by 132.40.”
Next 1-3 weeks: “The USD weakness that started late last week came to a sudden end as it blew past our ‘strong resistance’ level at 132.90 yesterday. The current price actions are likely the early stages of a broad consolidation phase and USD is expected to trade between 131.30 and 135.60 for now.”
- The index climbs to the 106.50 region and recedes afterwards.
- The risk complex regains momentum and weighs on the dollar.
- ISM Non-Manufacturing, Factory Orders next of relevance in the docket.
The US Dollar Index (DXY), which tracks the greenback vs. a basket of its main competitors, revisits the 106.00 neighbourhood after the initial bullish attempt faltered in the 106.50/55 band on Wednesday.
US Dollar Index looks to data, Taiwan
The index has rapidly faded the initial climb to the mid-106.00s, as the risk aversion sentiment appears to have lost some impulse on Wednesday.
The move lower in the buck comes in line with a mild continuation of Tuesday’s upside in US yields across the curve, also reflecting the better mood in the risk-associated universe.
In the meantime, investors’ attention remains on Pelosi’s trip to Taiwan amidst escalating tensions between Washington and Beijing.
In the US data space, weekly MBA Mortgage Applications are due in the first turn ahead of the final S&P Global Services PMI, Factory Orders and the ISM Non-Manufacturing. In addition, Philly Fed P.Harker (2023 voter, hawk) is due to speak.
What to look for around USD
Risk aversion looks diminished and the index gives away part of the advance to the mid-106.00s on Wednesday.
The very-near-term outlook for the dollar has deteriorated somewhat in recent sessions, particularly following the latest US GDP figures and the prospects for further tightening by the Fed in the next months, which carry the potential to drag further the economy into the contraction territory.
Among the positives for the buck still emerge the Fed’s divergence vs. most of its G10 peers (especially the ECB) in combination with bouts of geopolitical effervescence and occasional re-emergence of risk aversion.
Key events in the US this week: MBA Mortgage Applications, Factory Orders, ISM Non-Manufacturing (Wednesday) – Balance of Trade, Initial Claims (Thursday) – Non-Farm Payrolls, Unemployment Rate, Consumer Credit Change (Friday).
Eminent issues on the back boiler: Hard/soft/softish? landing of the US economy. Escalating geopolitical effervescence vs. Russia and China. Fed’s more aggressive rate path this year and 2023. US-China trade conflict. Future of Biden’s Build Back Better plan.
US Dollar Index relevant levels
Now, the index is retreating 0.11% at 106.23 and faces the next support at 105.04 (monthly low August 2) seconded by 104.84 (55-day SMA) and finally 103.67 (weekly low June 27). On the upside, a break above 107.42 (weekly high post-FOMC July 27) would expose 109.29 (2022 high July 15) and then 109.77 (monthly high September 2002).
- GBP/USD bounces off the weekly low touched on Wednesday amid modest USD weakness.
- A positive tone around the equity markets is seen undermining the safe-haven greenback.
- Recession fears, US-China tensions, hawkish remarks by Fed officials to limit the USD losses.
- Investors also seem reluctant ahead of the BoE decision on Thursday and the NFP on Friday.
The GBP/USD pair stalls this week's downfall from the highest level since late June and attracts some buying near the 1.2135 area, or a weekly low touched this Wednesday. The pair refreshes daily high during the early European session, with bulls now looking to build on the momentum beyond the 1.2200 mark.
The US dollar struggles to capitalize on the overnight goodish bounce from a multi-week low and edged lower on Wednesday, which, in turn, offers support to the GBP/USD pair. A modest recovery in the global risk sentiment - as depicted by a generally positive tone around the equity markets - is undermining the safe-haven buck. That said, a combination of factors could limit any deeper USD losses and cap the upside for the major, at least for the time being.
Against the backdrop of growing recession fears, mounting diplomatic tensions over US House Speaker Nancy Pelosi's Taiwan visit should keep a lid on any optimistic move in the markets. Furthermore, the overnight hawkish remarks by Fed officials, hinting that more interest rates are coming in the near term, might act as a tailwind for the greenback. This could hold back bulls from placing aggressive bets around the GBP/USD pair ahead of the central bank event risk.
The Bank of England is scheduled to announce its monetary policy decision on Thursday and is expected to hike interest rates by 50 bps, marking the largest increase since 1995. The markets, however, seem divided over further rate hikes. Hence, the focus would be on the near-term policy outlook, which will influence the British pound. Traders would then shift the focus to the release of the closely-watched US monthly jobs report, popularly known as NFP on Friday.
In the meantime, Wednesday's release of the final UK Services PMI and the US ISM Serviced PMI would be looked upon for short-term opportunities around the GBP/USD pair. That said, any meaningful market reaction is more likely to remain short-lived, warranting some caution before determining the next leg of a directional move.
Technical levels to watch
Siemens Energy CEO said on Wednesday that they have currently one turbine running at the Nord Stream compressor station and added that they need 5 turbines to reach 100% capacity, as reported by Reuters.
"We are trying everything to deliver the turbine, cannot understand what the hold-up is," the CEO further noted.
Commenting on the same matter, "the turbine is ready, there is no reason for it not to be transported to Russia," German Chancellor Olaf Scholz said.
"We have to prepare ourselves that even if the transport of the turbine actually happens there could be further supply disruptions down the line," Scholz added and explained that's why they have taken numerous measures to diversify away from Russia fast.
Market reaction
These comments don't seem to be having a significant impact on the shared currency's performance against its rivals. As of writing, the EUR/USD pair was up 0.15% on the day at 1.0180.
- AUD/USD stages a modest bounce from a nearly two-week low touched earlier this Wednesday.
- Strong domestic data, upbeat Chinese PMI, a positive risk tone offer some support to the aussie.
- The overnight hawkish remarks by Fed officials could revive the USD demand and cap the upside.
The AUD/USD pair reverses an intraday dip to the 0.6885 region, or a nearly two-week low touched on Wednesday and holds steady near the daily high during the early European session. The pair, for now, seems to have stalled this week's retracement slide from the vicinity of mid-0.7000s, or its highest level since June 17 touched on Monday.
The Australian dollar draws support from strong domestic data and the upbeat Chinese service-sector activity report. In fact, Australian retail sales volumes recorded the third consecutive quarterly increase and rose 1.4% during the April-June period to reach a new record. Separately, China's Caixin Services PMI improved further and shot to a 15-month high of 55.5 in July.
This, along with subdued US dollar price action, assists the AUD/USD pair to attract some buying at lower levels. Signs of stability in the equity markets turn out to be a key factor acting as a headwind for the safe-haven greenback and offering additional support to the risk-sensitive aussie. That said, any meaningful recovery seems elusive, warranting caution for bulls.
Several Federal Reserve officials sounded hawkish on Tuesday and hinted that more interest rates are coming in the near term. Furthermore, growing recession fears and mounting diplomatic tensions over US House Speaker Nancy Pelosi's Taiwan visit should keep a lid on any optimistic move in the markets. This, in turn, could revive the USD demand and cap gains for the AUD/USD pair.
This makes it prudent to wait for strong follow-through buying before positioning for any further appreciating move. Market participants now look forward to the US ISM Services PMI, due for release later during the early North American session. This, along with the US bond yields and the broader risk sentiment, would influence the USD and provide some impetus to the AUD/USD pair.
Technical levels to watch
- USD/CHF extends the recovery from the lowest levels since late April, renews daily top of late.
- Firmer RSI, U-turn from previous resistance favor bulls to challenge 200-HMA hurdle.
- Multiple supports around 0.9500 adds to the downside filters.
USD/CHF picks up bids to approach the intraday high near 0.9585 during the initial hour of the European session on Wednesday.
In doing so, the Swiss currency (CHF) pair extends the latest bounce off the resistance-turned-support line from July 14, towards the 200-HMA hurdle surrounding 0.9590.
It’s worth observing that the firmer RSI (14), not overbought, joins the pair’s successful rebound from the previous key resistance line to keep USD/CHF buyers hopeful of crossing the immediate resistance.
Following that, July 22 swing low near 0.9600 could test the pair bulls before directing them to the 0.9700 and the 61.8% Fibonacci retracement of July 14 to August 01 downside, around 0.9730.
Alternatively, pullback remains elusive until the quote stays beyond the resistance-turned-support line, around 0.9540 by the press time.
Following that, there are multiple swing lows marked during late July close to 0.9500 which could challenge the USD/CHF bears.
In a case where USD/CHF drops below 0.9500, the latest swing low near 0.9470 and March’s high near 0.9460 could act as the last defenses for bulls.
USD/CHF: Hourly chart
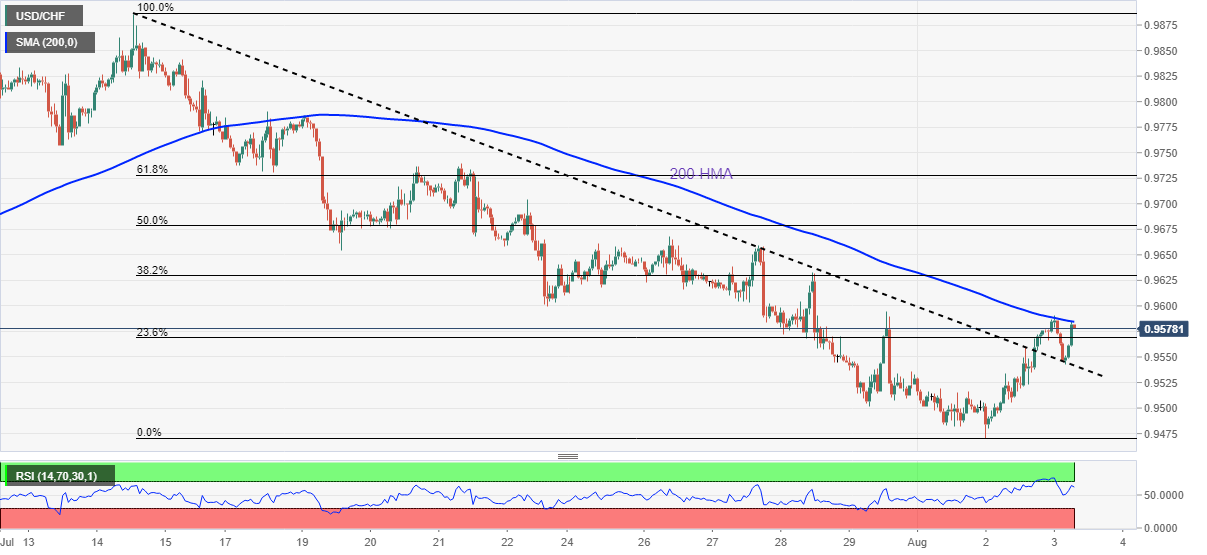
Trend: Further upside expected
Here is what you need to know on Wednesday, August 3:
The US Dollar Index (DXY) snapped a four-day losing streak on Tuesday as escalating geopolitical tensions allowed safe-haven flows to continue to dominate the financial markets. There seems to be a modest improvement in risk mood early Wednesday with US stock index futures rising between 0.2% and 0.3% and the DXY consolidating its recovery gains above 106.00. The European economic docket will feature June Retail Sales data before the ISM releases the July Services PMI report for the US later in the day. Investors will keep a close eye on political developments and Fedspeak as well.
Despite China's stern warnings, US House of Representatives Speaker Nancy Pelosi has landed in Taiwan, becoming the most senior US politician to visit the country in 25 years. With the initial response, the Chinese Foreign Ministry published a statement, noting that Pelosi's visit seriously violated the sovereignty and territorial integrity. Additionally, China announced that it will hold military exercises, including live-fire drills, in areas surrounding Taiwan from August 4. Earlier in the day, "we want Taiwan to always have freedom with security, we are not backing away from that," Pelosi told a news conference.
In the meantime, Chicago Fed President Charles Evans said on Tuesday that a 50 basis points rate hike would be a reasonable assessment for the September policy meeting if inflation does not improve. These comments helped the US T-bond yields push higher and the benchmark 10-year US yield rose more than 6% on a daily basis and climbed above 2.7% on Tuesday before going into a consolidation phase early Wednesday.
In the early Asian session, the data from New Zealand showed that the Unemployment Rate edged higher to 3.3% in the second quarter from 3.2% in the first quarter. The Participation Rate was virtually unchanged at 70.8% in the same period. NZD/USD declined toward 0.6200 with the initial reaction but recovered above 0.6250 heading into the European session.
EUR/USD pair lost more than 100 on Tuesday and closed the day below 1.0200. The pair is having a difficult time gaining traction in the European morning and fluctuating in a tight range above 1.0150.
GBP/USD fell sharply on Tuesday as the British pound failed to find demand in the risk-averse market atmosphere. The pair stays relatively quiet above mid-1.2100s early Wednesday. The S&P Global will release the final version of the Services and Composite PMı data for the UK later in the session.
Fueled by surging US Treasury bond yields, USD/JPY rose decisively from the two-month low it set at 130.43 and gained nearly 200 pips on the day. The pair fluctuates in a narrow channel above 133.00 on Wednesday.
Gold turned south on rising US yields and the broad-based dollar strength on Tuesday and close in negative territory for the first time since last Wednesday. Nevertheless, XAU/USD seems to have regathered its bullish momentum and was last seen advancing toward $1,770.
Bitcoin continues to move sideways near $23,000 and Ethereum is struggling to find direction while holding steady above $1,600.
- Gold price fades recovery moves as traders struggle for clear directions.
- China Caixin Services PMI, mixed Fedspeak favor XAU/USD buyers.
- US-China tensions over Taiwan, recession woes keep sellers hopeful.
- US ISM Services PMI, Factory Orders may entertain traders but risk catalysts are more important.
Gold price (XAU/USD) fails to extend daily gains around $1,770 amid the early Wednesday morning in Europe. In doing so, the yellow metal buyers struggle for fresh clues to stretch the latest recovery moves inside a trend-widening chart pattern.
Mixed concerns over Taiwan and an absence of strongly hawkish Fed comments seem to restrict immediate XAU/USD moves. Also challenging the gold price is the upbeat prints of China Caixin Services PMI for July contrasting to the official activity numbers at home and abroad, as well as broad recession woes.
US House Speaker Nancy Pelosi vows to not abandon Taiwan amid Chinese pressure, per Bloomberg, while Taiwan President shows readiness to retaliate Beijing military moves, if any. On the other hand, the private services gauge from the dragon nation rose to 55.5 versus 48 expected and 54.5 prior.
Elsewhere, St. Louis Federal Reserve President James Bullard and Cleveland Fed President Loretta Mester talked down US recession concerns while supporting chatters about the 50 basis points (bps) rate hike in September. However, San Francisco Fed President Mary Daly said that she is looking for incoming data to decide if they can downshift the rate hikes or continues at the current pace, as reported by Reuters.
Amid these plays, S&P 500 Futures rise 0.25% intraday while the US 10-year Treasury yields drop 1.5 basis points (bps) to 2.726% at the latest.
Given the market’s indecision, gold traders should wait for the US Factory Orders for June and ISM Services PMI for July. Also important will be to the headlines surrounding China, Taiwan and Fed.
Also read: US July ISM Services PMI Preview: Inflation component holds the key
Technical analysis
Gold price pares daily gains inside a one-week-old megaphone trend widening technical chart formation on the hourly play.
That said, the XAU/USD’s latest pullback from the 50-HMA, at $1,770 by the press time, lacks support from the MACD, which in turn hints at the quote’s further advances towards the previous day’s high near $1,788.
However, upper line of the aforementioned megaphone pattern, near $1,790, could challenge the bullion’s further upside.
Meanwhile, pullback moves may initial aim for the stated formation’s support line, close to $1,755, before directing gold sellers towards the 50% Fibonacci retracement of July 27 to August 02 upside, near $1,749.
Also acting as the downside filter is the 61.8% Fibonacci retracement level around $1,740.
Overall, gold price grinds higher and may witness further volatility inside the megaphone.
Gold: Hourly chart
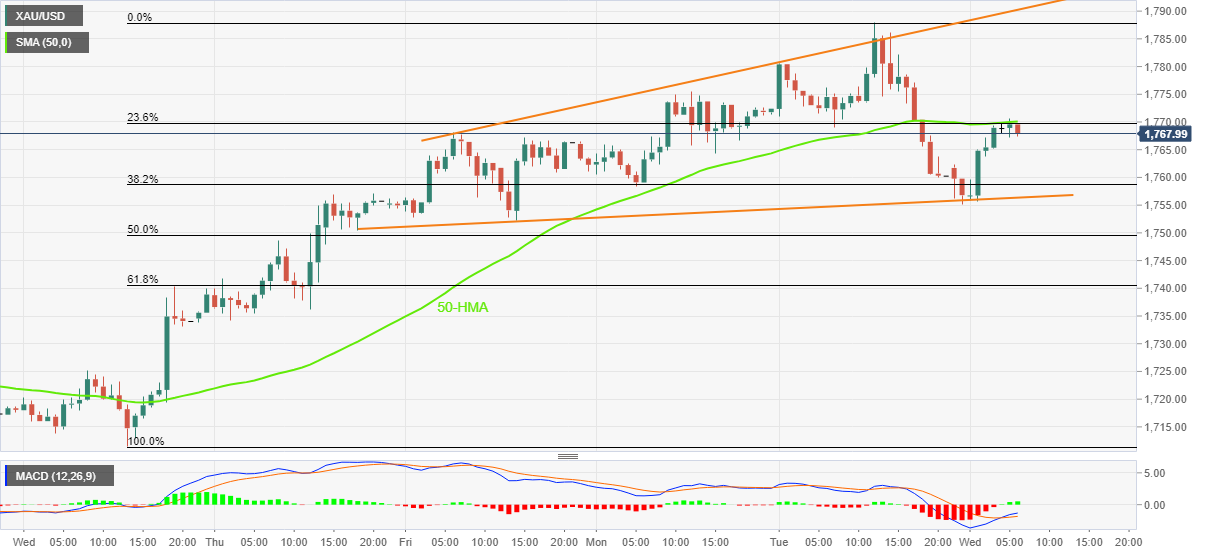
Trend: Further recovery expected
Analysts at Australia and New Zealand (ANZ) banking group provide their afterthoughts on the Australian Q2 Retail Sales released early Thursday.
Key quotes
“Retail volumes rose 1.4% q/q in Q2 this year, despite very strong inflation (+1.7% q/q for retail products) and recession-level consumer confidence.”
“Dining/takeaway volumes grew 8.6% q/q, department store volumes grew 3.0% q/q and clothing grew 3.9% q/q, both building on strong Q1 growth and casting doubt on whether a discretionary spending squeeze is in progress so far.“
“ANZ-observed spending for July has not fallen off a cliff, with discretionary spending categories such as non-food retail, dining/takeaway and travel excluding petrol showing continued momentum.”
Further downside in AUD/USD could drag the pair to the 0.6840 region in the next weeks, comment FX Strategists at UOB Group Lee Sue Ann and Quek Ser Leang.
Key Quotes
24-hour view: “The outsized sell-off in AUD came as a surprise (we were expecting AUD to trade sideways). AUD dropped to 0.6913 before extending its decline during early Asian hours. While oversold, the weakness in AUD has not stabilized. AUD could weaken further but in view of the oversold conditions, a break of the major support at 0.6840 is unlikely (there is another support at 0.6870). Resistance is at 0.6930 followed by 0.6960.”
Next 1-3 weeks: “After AUD rose to 0.7048, we highlighted yesterday (02 Aug, spot at 0.7025) that upward momentum has not improved. We added, ‘AUD has to break the major resistance at 0.7070 before a sustained advance is likely’. AUD did not break 0.7070 but instead dropped sharply to a low of 0.6913 during NY session before extending its decline during early Asian hours. The rapid build-up in downward momentum suggests AUD is likely to trade with a downward bias towards 0.6840. On the upside, a break of 0.6990 (‘strong resistance’ level) would indicate that the downside risk has dissipated.”
Considering preliminary readings from CME Group for natural gas futures markets, traders trimmed their open interest positions by more than 2K contracts after two daily builds in a row on Tuesday. On the other hand, volume went up for the second consecutive day, now by around 7.7K contracts.
Natural Gas appears supported near $7.50
Prices of natural gas dropped markedly on Tuesday, although the move was on the back of declining open interest, hinting at the idea that a deeper retracement looks unlikely for the time being. So far, the $7.50 mark per MMBtu seems to hold the downside.
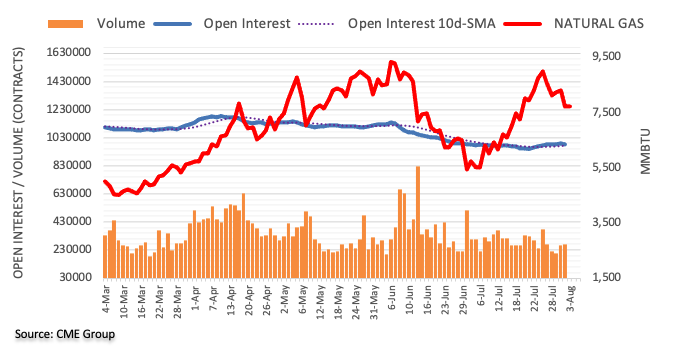
FX option expiries for August 3 NY cut at 10:00 Eastern Time, via DTCC, can be found below.
- EUR/USD: EUR amounts
- 1.0100 695m
- 1.0150 589m
- 1.0200 928m
- 1.0250 459m
- 1.0285 318m
- USD/JPY: USD amounts
- 131.50 457m
- 132.25 400m
- 134.00 349m
- USD/CHF: USD amounts
- 0.9445 300m
- 0.9760 250m
- AUD/USD: AUD amounts
- 0.6835 301m
- 0.7150 1b
- NZD/USD: NZD amounts
- 0.6040 420m
In the opinion of FX Strategists at UOB Group Lee Sue Ann and Quek Ser Leang, GBP/USD seems to have now moved into a 1.2040-1.2255 range fore the time being.
Key Quotes
24-hour view: “We highlighted yesterday that ‘the rapid rise appears to be running ahead but there is scope for GBP to move above 1.2300 first before the risk of a pullback would increase’. We did not expect the sharp and rapid drop to 1.2158 (high has been 1.2279). Downward momentum is building and GBP could weaken to 1.2100. For today, the next support at 1.2040 is not expected to come under threat. Resistance is at 1.2195 followed by 1.2225.”
Next 1-3 weeks: “GBP dropped sharply to a low of 1.2158 yesterday. While our ‘strong support’ at 1.2135 is still intact, upward momentum has fizzled out. In other words, the GBP strength that started late last week has come to an abrupt end. GBP appears to have moved into a consolidation phase and is likely to trade within a range of 1.2040/1.2255 for now.”
Open interest in crude oil futures markets dropped by around 8.2K contracts on Tuesday following three consecutive daily builds, according to advanced prints from CME Group. Volume followed suit and went down by around 108.7K contracts after two daily builds in a row.
WTI looks supported around $90.00
The WTI charted an inconclusive session on Tuesday amidst shrinking open interest and volume, exposing the continuation of the range bound theme in the very near term. So far, the commodity remains supported by the vicinity of the $90.00 mark per barrel.
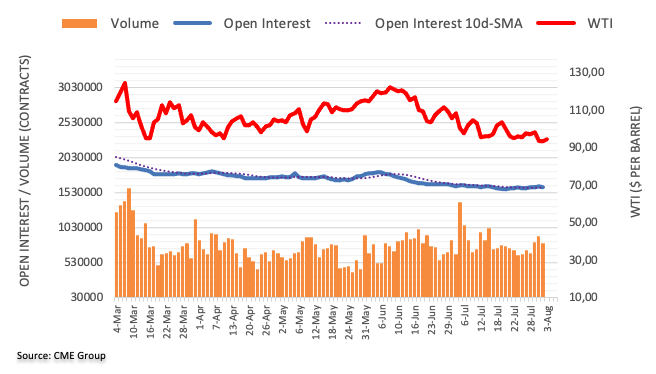
- Oil prices are likely to tumble further on bearish pennant formation.
- Bears have defended the 20-EMA at $97.35 firmly.
- The RSI (14) is eyeing a drop below 40.00 for the first time in CY2022.
West Texas Intermediate (WTI), futures on NYMEX, has defended reversion to intraday low at $92.79 but is likely to remain sideways as investors are awaiting the outcome of the OPEC meeting on the fresh addition of oil to the global supply. On a broader note, the oil prices are oscillating in a $9 wide range.
On a daily scale, the oil prices are auctioning in a Bearish Pennant chart pattern. The above-mentioned chart pattern displays an inventory distribution, which is followed by a sheer downside. Usually, the inventory distribution phase supports investors to initiate shorts with low risk-reward opportunities. Also, an earlier establishment of a bearish bias bolsters the odds of a forward decline.
The black gold has faced selling pressure while attempting to cross the 20-period Exponential Moving Average (EMA) at $97.35. Also, the 50-EMA at $101.52 is trading higher, which signals that the short-term trend is bearish.
Meanwhile, the Relative Strength Index (RSI) (14) is on the verge of falling into the bearish range of 20.00-40.00 for the first time in CY2022.
Should the asset drops below Monday’s low at $91.72, bears will drag the oil prices towards July 14 low at $88.34, followed by the 10 October 2021 high at $85.00.
Alternatively, bulls could defend the escalating downside odds and may drive the black gold towards April 21 high at $105.24 and June 2 low at $109.96 after surpassing Friday’s high at $100.95 confidently.
WTI daily chart
-637951045002257025.png)
- USD/CAD extends pullback from weekly top to refresh intraday low, snaps two-day uptrend.
- WTI consolidates recent losses ahead of OPEC+ meeting.
- Risk-aversion ebbs on surprise bear of China’s Caixin Services PMI for July.
- US ISM Services PMI, Factory Orders can entertain traders.
USD/CAD takes offers to renew intraday low near 1.2850 ahead of Wednesday’s European session.
The Loonie pair rose during the last two days before reversing from the weekly top of 1.2891. The pullback moves, however, take clues from the recently firmer prices of Canada’s main export item, namely WTI crude oil. Also keeping the USD/CAD prices heavy is the US dollar’s pullback amid cautious optimism ahead of the key US data.
That said, WTI crude oil prices snap a two-day downtrend, up 0.63% intraday near $93.75, amid increasing hops of no major change in the oil producers’ policy during today’s meeting of the Organization of the Petroleum Exporting Countries (OPEC) and allies including Russia, a group known as OPEC+.
Additionally, recently firmer prints of China’s Caixin Services PMI for July appeared to have favored the steel buyers of late. The private services gauge from the dragon nation rose to 55.5 versus 48 expected and 54.5 prior.
Earlier in the day, the US-China tussles over Taiwan joined hawkish Fedspeak to challenge the risk appetite and underpin the USD/CAD run-up.
While portraying the mood, S&P 500 Futures rise 0.25% intraday while the US 10-year Treasury yields drop three basis points (bps) to 2.71% at the latest.
Looking forward, USD/CAD traders should pay attention to the headlines surrounding China, Taiwan and Fed for immediate directions. Also important will be the US Factory Orders for June and ISM Services PMI for July.
Technical analysis
Despite the latest retreat, USD/CAD buyers remain hopeful until witnessing successful trading below the 100-DMA support near 1.2780.
EUR/USD is still seen within the 1.0100-1.0260 range in the next weeks, suggested FX Strategists at UOB Group Lee Sue Ann and Quek Ser Leang.
Key Quotes
24-hour view: “Yesterday, we highlighted that ‘upward momentum is beginning to build but it is left to be seen if EUR could break the major resistance at 1.0300’. The major resistance at 1.0300 remains intact as EUR fell sharply from 1.0293 (low has been 1.0162). The rapid drop could extend but is unlikely to threaten the major support at 1.0100 (there is another support at 1.0130). On the upside, a breach of 1.0210 (minor resistance is at 1.0195) would indicate that the current downward pressure has eased.”
Next 1-3 weeks: “We highlighted yesterday that the risk for EUR is shifting to the upside but EUR has to break 1.0300 first before a sustained advance is likely. EUR did not break 1.0300 as it dropped sharply from 1.0293. The build-up in upward momentum fizzled out quickly. The price actions suggest that EUR is still in a consolidation phase and it is likely to trade between 1.0100 and 1.0260. Looking ahead, EUR has to break the major support at 1.0100 before a sustained decline is likely.”
CME Group’s flash data for gold futures markets noted open interest shrank for the third session in a row on Tuesday, this time by nearly 5K contracts. Volume, instead, reversed three consecutive daily drops and increased by around 45.8K contracts.
Gold still looks capped by $1,800
Prices of the ounce troy of gold advanced to the vicinity of the key $1,800 mark on Tuesday, just to recede afterwards and end the session with moderate losses. The downtick was on the back of shrinking open interest, suggesting that extra losses appear out of favour for the time being.
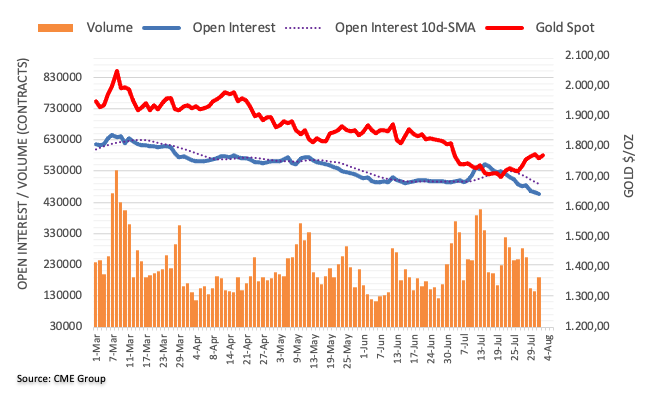
- EUR/GBP rebounds from 14-week low, grinds higher of late.
- Previous support line from March guards immediate upside.
- Nearly oversold RSI, 78.6% Fibonacci retracement level challenge bears.
EUR/GBP pares losses around the lowest levels in May, up 0.14% intraday near 0.8365 heading into Wednesday’s European session. With this, the cross-currency pair justifies the nearly oversold RSI (14) amid mixed fundamentals.
However, bearish MACD signals and a clear downside break of an ascending trend line from early March, at 0.8380 by the press time, challenge the EUR/GBP buyers.
Even if the pair rises past 0.8380, the 61.8% Fibonacci retracement of the March-June upside, near the 0.8400 threshold, could also question the pair’s further advances.
It’s worth noting that the 200-DMA surrounding 0.8445 acts as the last defense of the EUR/GBP bears, a break of which could give control to the buyers.
Meanwhile, the pair’s fresh weakness could aim for the latest multi-day low of 0.8340. Following that, the downside moves could aim for the 78.6% Fibonacci retracement level of 0.8310.
In a case where EUR/GBP drops below 0.8310, the 0.8300 threshold and mid-April lows near 0.8250 can entertain sellers ahead of directing them to March’s bottom close to 0.8200.
EUR/GBP: Daily chart
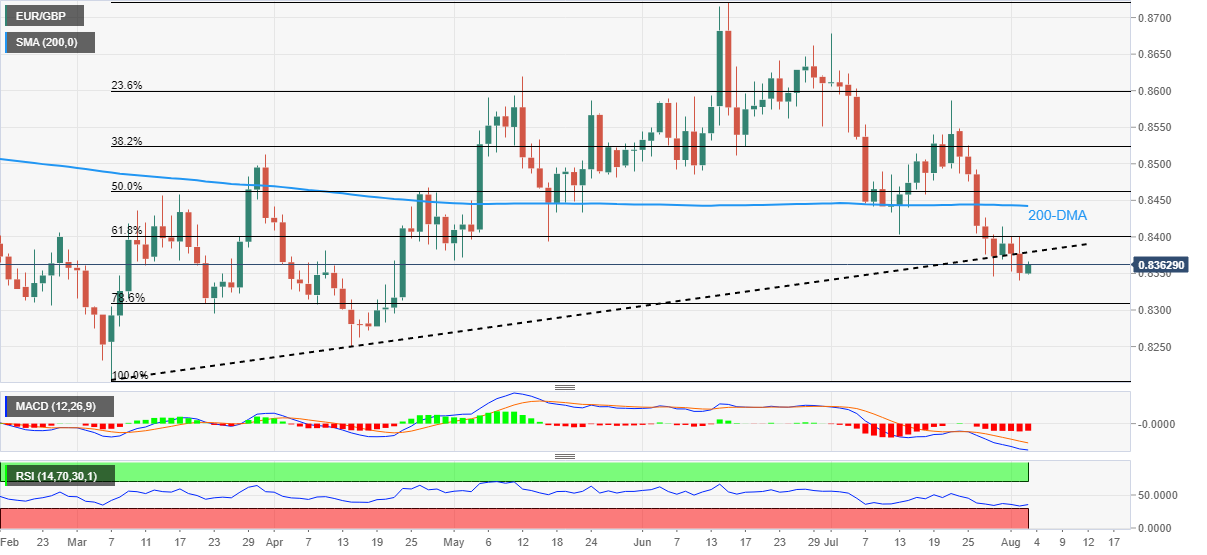
Trend: Limited recovery expected
Economist at UOB Group Lee Sue Ann suggested the BoE is seen tightening its monetary policy further in the next months.
Key Quotes
“The forward guidance language for higher interest rates was much stronger, endorsed by all the BOE’s voters. We are thus now penciling in more rate hikes in the coming months.”
“We look for an additional 100bps hike for the rest of this year, after which we expect the BOE to press pause on its hiking cycle. This should see the Bank Rate at 2.25% by year-end.”
- GBP/JPY has attempted a rebound after a corrective move to near 161.20.
- The BOE is expected to elevate interest rates by 50 bps to 1.75%.
- Despite a less-hawkish commentary from the BOE, BOE-BOJ policy divergence is invincible.
The GBP/JPY pair has concluded its corrective move after printing a low of 161.20 in the Asian session and has resumed its upside journey. Earlier, the cross displayed a responsive buying action after printing a fresh monthly low of around 159.50 on Tuesday.
An interest rate decision by the Bank of England (BOE) will guide the next move in the asset. On Thursday, BOE Andrew Bailey will dictate the monetary policy and may announce a rate hike by 50 basis points (bps).
Taking into account the inflation rate at which the households in the UK are spending to cater to their needs and desires is 9.4%. Price pressures have not displayed any exhaustion sign yet and the market participants are expecting that the inflation rate could hit the two-digit figure going forward. Therefore, a rate hike by a quarter to a percent is unable to offset the multiplier effects of roaring inflation.
Well, subdued economic data and political instability have added troubles for BOE policymakers. The BOE is unable to tighten its policy significantly, which may push the consequences of higher inflation for a prolonged period.
On the Tokyo front, investors are worried over a further escalation in BOE-Bank of Japan (BOJ) policy divergence. BOJ Governor Haruhiko Kuroda is committed to spurting the growth rate in Japan and is addressing the same with an ultra-loose monetary policy on the loop. Although, the odds are favoring that the BOE won’t be extremely hawkish, however, an escalation of policy divergence is imminent.
- Steel price remains firmer near one-month high, sidelined near daily top of late.
- China’s Caixin Services PMI, an absence of major action surrounding Taiwan seems to favor buyers.
- Resumption of output facilities could join Fed hawks to challenge upside momentum.
Steel price lures buyers’ attention while taking rounds to the monthly high, flashed earlier in Asia. That said, the recent shift in the market’s risk appetite seems to favor the upside momentum heading into Wednesday’s European session.
With this in mind, the construction steel rebar on the Shanghai Futures Exchange (SFE) rose 1.7% around 4,130 yuan per metric tonne ($615) while the hot-rolled coil climbed 1.8% and stainless steel gained 0.2%, per Reuters.
The US-China tussles over Taiwan have been challenging the risk appetite but the recently firmer prints of China’s Caixin Services PMI for July appeared to have favored the steel buyers of late. The private services gauge from the dragon nation rose to 55.5 versus 48 expected and 54.5 prior. While portraying the mood, S&P 500 Futures rise 0.25% intraday while the US 10-year Treasury yields drop three basis points (bps) to 2.71% at the latest.
Elsewhere, the Fed policymakers have flashed mixed signals while keeping the 0.50% rate hike for September on the table.
It should be noted that the recent increase in the steel companies’ profits has acquired more attention and pushed the manufacturers to restart the previously halt output facilities. In this regard, Reuters reported that a total of 23 blast furnaces in China resumed production between July 21 and Aug. 1, according to metals industry information provider SMM, among dozens of such facilities idled for maintenance amid weak domestic steel demand.
Looking forward, updates surrounding Taiwan and Chinese mills seem to direct short-term steel price moves. Also important will be the US Factory Orders for June and ISM Services PMI for July.
- Asian equities are holding themselves at elevated levels despite soaring Sino-US tensions.
- An upbeat Caixin Services PMI data has supported the Chinese equities.
- The DXY is finding a cushion around 106.00 after a steep fall.
Markets in the Asian domain are displaying a mixed performance on escalating US-China tensions over Taiwan. The collection of Russian naval ships and Chinese ships at the Taiwanese disputed island has created havoc in the global markets. The speech from US House Speaker Nancy Pelosi on supporting economic exchanges between the US and Taiwan is making China anxious. In retaliation to China’s military move, Taiwan’s Defence Ministry has cited that they will counter any move from China that will violate Taiwan's territorial sovereignty.
At the press time, Japan’s Nikkei225 added 0.40%, SZSE Component gained 0.24, Hang Seng jumped 0.63%, while Nifty50 eased 0.20%.
Chinese indices are mostly trading positive as IHS Markit has reported upbeat Caixin Services PMI data. The Caixin Services PMI data has landed at 55.5, significantly higher than the expectations of 48 and the prior release of 54.5. A higher-than-expected improvement in the economic data has supported the Chinese equities despite the geopolitical tensions.
Meanwhile, the US dollar index (DXY) has attempted a rebound after printing an intraday low of 106.00 in the Asian session. The DXY is likely to dance to the tunes of US Nonfarm Payrolls (NFP), which are due on Friday. A halt in the recruitment process by big US corporate players and soaring interest rates by the Federal Reserve (Fed) may trim the job additions than their prior release. The jobless rate is seen unchanged at 3.6%.
- USD/TRY struggles to extend latest recovery, sidelined of late.
- Fears of record inflation keeps pair buyers hopeful as CBRT refrains from rate hike.
- Receding risk aversion on China’s upbeat PMI seems to challenge bulls.
- Updates concerning Taiwan, Fedspeak and US Factory Orders for July are also important for fresh impulse.
USD/TRY remains steady around 17.95, fading the previous day’s run-up heading into Wednesday’s European session. In doing so, the Turkish lira (TRY) pair portrays the markets’ cautious mood ahead of the key data from the US and Turkiye.
It’s worth noting that the fears of witnessing another bumper inflation number from Turkiye battle with the US dollar’s failure to extend the recovery moves from a monthly low to confuse USD/TRY traders.
On Wednesday, Central Bank of the Republic of Türkiye’s (CBRT) Governor Sahap Kavcioglu defended the Turkish central bank's loan policies at a meeting with a business group on Tuesday, repeating that recent measures create favorable conditions for exporters to increase production, per Reuters. The news also mentioned, “Speaking to the Union of Chambers and Commodity Exchanges of Turkey (TOBB), Kavcioglu said the central bank had partially succeeded in efforts for targeted loans to reach the right companies. He also appeared to dismiss criticism that companies cannot access affordable financing.”
It is widely known that the CBRT has been reluctant to increase the rate hike despite the record inflation and has rather concentrated on qualitative measures which have failed to tame the woes of late. Alternatively, the Fed policymakers have flashed mixed signals while keeping the 0.50% rate hike for September on the table.
On the other hand, the US-China tussles over Taiwan have been challenging the risk appetite but the recently firmer prints of China’s Caixin Services PMI for July appeared to have challenged the USD/TRY buyers. That said, the private services gauge from the dragon nation rose to 55.5 versus 48 expected and 54.5 prior. While portraying the mood, S&P 500 Futures rise 0.25% intraday while the US 10-year Treasury yields drop three basis points (bps) to 2.71% at the latest.
Moving on, the Turkish Consumer Price Index (CPI) for July, expected 80.5% YoY versus 78.62% prior, will be crucial for the USD/TRY traders. Following that, the US Factory Orders for June and ISM Services PMI for July will join the US-China jitters and recession talks to direct the pair moves.
Technical analysis
The higher-low formation joins a successful rebound from the 10-DMA, around 17.85 by the press time, to keep USD/TRY bulls hopeful of refreshing the record high marked in 2021 at around 18.35.
- USD/INR picks up bids to snap five-day uptrend, rebounds from five-week low.
- Improvement in RSI, MACD hints at further recovery towards weekly resistance line, 200-SMA.
- Multiple supports challenge bear’s re-entry, 78.40 limits immediate downside.
USD/INR recovers from the lowest levels in five weeks, refreshing intraday high near 78.75 amid early Wednesday morning in Europe. In doing so, the Indian rupee (INR) pair prints the first daily gains in six while bouncing off the 61.8% Fibonacci retracement of the June-July upside.
Given the RSI’s rebound from the oversold territory and the impending bull cross of the MACD, USD/INR is likely to extend the latest rebound from the key Fibonacci (Fibo.) support level near 78.40.
That said, a one-week-old descending trend line resistance near 78.80 guards the USD/INR pair’s further recovery.
Following that, an upside momentum towards the 200-SMA level near 79.20 can’t be ruled out.
In a case where the USD/INR buyers keep reins past 79.20, the 79.70 level could act as the last defense for the bears.
Alternatively, a downside break of 78.40 could recall the USD/INR bears. However, multiple horizontal lines stretched from June challenge the pair’s further weakness around 78.10, 77.90 and 77.60.
Should the pair remains bearish past 77.60, the odds of its slump to June’s bottom surrounding 77.40 can’t be ruled out.
USD/INR: Four-hour chart
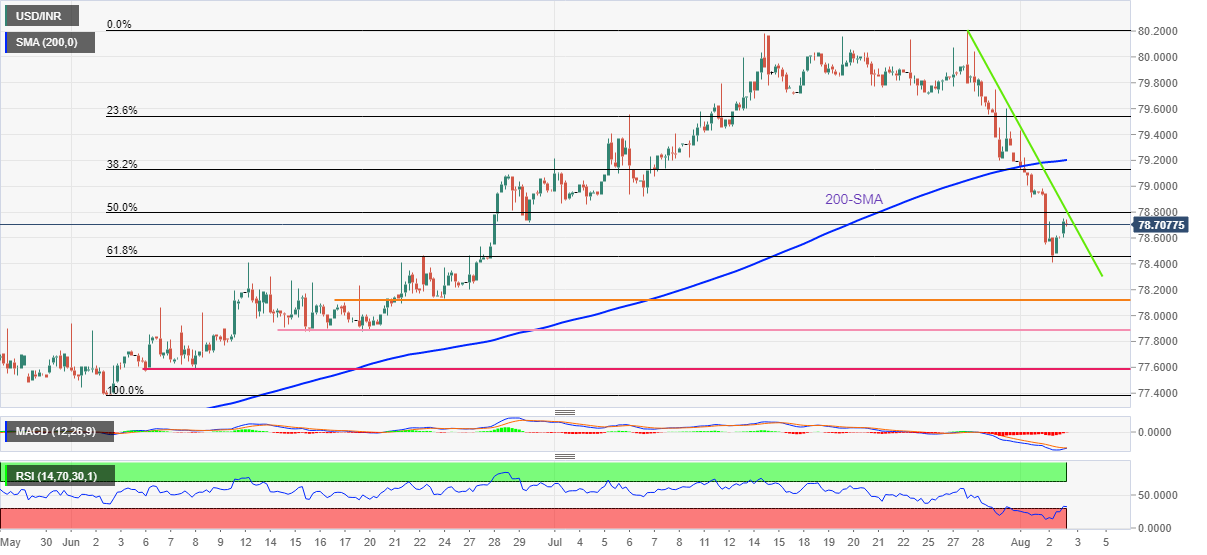
Trend: Further recovery expected
- Gold price has recaptured the crucial hurdle of $1,770.00 as risk-off fades dramatically.
- Taiwan’s defense ministry is prepared to counter any military action from China.
- A lower consensus for US NFP will keep the DXY on the tenterhooks.
Gold price (XAU/USD) has displayed a responsive buying action after printing a low of $1,755.00 in the Asian session. The precious metal entered a corrective wave after a juggernaut rally for the past two weeks. Apart from that, a rebound in the positive market sentiment has bolstered the gold bulls.
Risk sentiment was turned sour earlier on escalating Sino-US tensions over Taiwan. The situation has yet not been fixed as Russian naval ships have joined Chinese ships near the Taiwanese disputed island. In retaliation to that, Taiwan’s Defence Ministry has cited that they will counter any move from China that will violate Taiwan's territorial sovereignty.
The US dollar index (DXY) was enjoying liquidity from the market participants on Tuesday after investors underpinned the risk-off impulse. Now, the downbeat consensus for the US Nonfarm Payrolls (NFP) is dragging the DXY lower. The DXY has printed a low of 106.00 as job additions are seen at 250k, lower than the prior release of 372k. While the jobless rate is seen unchanged at 3.6%. Major US corporate players have ditched the recruitment process for the remaining whose consequences will be observed in the employment data.
Gold technical analysis
The gold price has reclaimed the 20-period Exponential Moving Average (EMA) at $1,764.23 swiftly. On a four-hour scale, the precious metal is auctioning in a Rising Channel whose upper portion of the above-mentioned chart pattern is placed from July 22 high at $1,739.37 while the lower portion is plotted from July 21 low at $1,681.87.
The 50-period EMA at $1,750.00 has remained untouched and is advancing, which adds to the upside filters. Also, the Relative Strength Index (RSI) (14) is attempting to recapture the bullish range of 60.00-80.00 to accelerate the upside move.
Gold four-hour chart
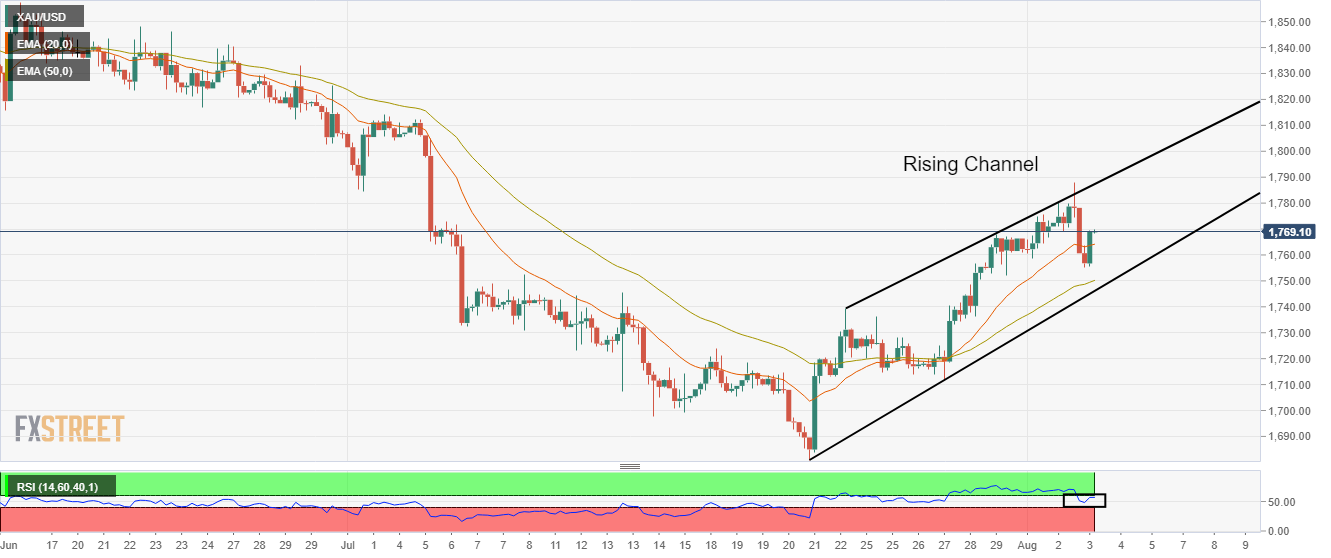
“While respecting our one China policy, our solidarity with Taiwan is more important than ever,” said US House Speaker Nancy Pelosi during her Taiwan visit.
The US diplomat also added, per Reuters, “While china has stood in the way of Taiwan attending certain meetings, hopes they understand they cannot stand in the way of people coming to Taiwan.”
When asked about the economic consequences Taiwan has to face as a result of her visit, US House Speaker Pelosi said, per Reuters, “The US chips act opens the door for better economic exchanges.”
Earlier in the day Taiwan President Tsai Ing-wen said, “Taiwan is committed to maintaining status quo across the Taiwan Strait.” The National Leader also mentioned that military exercises are unnecessary reaction.
More comments
We are supporters of the status quo, we don't want anything to happen to Taiwan by force.
Taiwan's strengths have been in its technological advancement and democratic development, we have to show the world Taiwan's success in those respects.
We want Taiwan to always have freedom with security, we are not backing away from that.
We are supporters of the status quo, we don't want anything to happen to Taiwan by force.
Risk-on remains intact
The news fails to weigh on the market sentiment as the S&P 500 Futures remains mildly bid around 4,100 by the press time.
Also read: US House Speaker Pelosi: Want to increase parliamentary exchanges with Taiwan
- EUR/USD consolidates the biggest daily loss in one week around short-term key support line.
- China’s Caixin Services PMI, mixed comments from the Fed policymakers favor corrective pullback.
- Sino-American tussles over Taiwan, fears of Fed’s aggression keep bears hopeful.
- EU Retail Sales, US ISM Services PMI will decorate the calendar.
EUR/USD picks up bids to refresh the intraday high near 1.0195 while reversing the previous day’s pullback from the monthly top. In doing so, the major currency pair respects the latest shift in the market’s sentiment during early Wednesday morning in Europe.
Although the US-China tussles over the Taiwan issue have been challenging the risk appetite, the recently firmer prints of China’s Caixin Services PMI for July appeared to have recalled the EUR/USD buyers ahead of multiple data from Europe and the US. That said, the private services gauge from the dragon nation rose to 55.5 versus 48 expected and 54.5 prior. While portraying the mood, S&P 500 Futures rise 0.15% intraday while the US 10-year Treasury yields drop three basis points (bps) to 2.71% at the latest.
Additionally, keeping the EUR/USD buyers hopeful are the mixed signals from the US Federal Reserve (Fed) policymakers. , St. Louis Federal Reserve President James Bullard rejected US recession fears while favoring the 50 basis points (bps) rate hike. Also, San Francisco Fed President Mary Daly said that she is looking for incoming data to decide if they can downshift the rate hikes or continues at the current pace, as reported by Reuters. However, Chicago Fed President Charles Evans showed support for a 50 basis points (bps) rate hike for the September policy meeting if inflation does not improve, as reported by Reuters. Furthermore, Cleveland Fed President Loretta Mester, on the other hand, said she does not think the country is suffering a recession, adding that the labor market is in great shape. On inflation, however, she noted that it has not decreased "at all."
Previously, China’s warnings to the US to not play with the Taiwan card and promises to punish Taipei independence supporters, as well as blocking natural sand exports to the Asian economy, seemed to have spoiled the mood and drowned the US dollar.
It should be noted that the European Central Bank’s (ECB) latest communication suggesting economic improvement in the bloc also might have favored the EUR/USD rebound. “The fiscal support provided to the euro area economies amidst the Russia-Ukraine war is boosting the bloc’s GDP while temporarily lowering inflation,” said the ECB in its pre-release of monthly bulletin per Bloomberg.
Looking forward, German trade numbers for June will join the final readings of July PMIs for the Eurozone and the bloc’s Retail Sales for June to entertain EUR/USD bulls ahead of the US Factory Orders for June and ISM Services PMI for July. Given the recent market optimism, the pair may witness further advances should the region’s data arrive as positive.
Technical analysis
EUR/USD clings to an upward sloping support line from July 14, around 1.0180 at the latest. However, the corrective pullback needs validation from the 21-day EMA level surrounding 1.0225 to mark another attempt to cross the fortnight-old horizontal resistance area near 1.0275-80.
- A rebound in risk-on impulse is dragging the USD/CAD pair towards 1.2850.
- Russian naval ships have joined Chinese ships in the disputed territory of Taiwan.
- Oil prices have resumed the downside move on easing supply worries.
The USD/CAD pair is likely to turn sideways after a perpendicular downside move from near 1.2900 in the Asian session. The downside pressure will remain favored and the asset may drag further towards 1.2850 as investors have shrugged off the negative market sentiment. Earlier, investors shifted their liquidity to the US dollar index (DXY) on escalating geopolitical tensions between the US and China.
So far, it’s calm on the military front, however, Russian naval ships have joined Chinese ships near the Taiwanese disputed island. The risk sentiment will continue to remain on tenterhooks as an occurrence of military action on the visit of US House Speaker Nancy Pelosi will escalate tensions further.
The DXY has tumbled to the edge of 106.00 after a super-bullish Tuesday as investors are shifting their focus towards the US Institute of Supply Management (ISM) Services PMI data. A preliminary estimate for the economic data is 53.5, significantly lower than the prior release of 55.3. The US ISM Services New Orders Index data will be worth watching as US techs have lowered their guidance for the rest of the year.
On the loonie front, investors are awaiting the release of the employment data. The Net Change in Employment is seen at 20k, while the economy showed a jobless situation in June by 43.2k. However, the Unemployment Rate may increase to 5% from the prior release of 4.9%.
Meanwhile, oil prices have resumed their downside move after a pullback towards $94.00 in the Asian session. The oil prices are expected to display more losses ahead of the OPEC meeting as the oil cartel is expected to promise additional oil in the global supply.
“Chinese drills have invaded Taiwan's territorial space,” said Taiwan’s Defense Ministry during early Wednesday morning in Europe. The office also mentioned that China continues to launch psychological warfare on Taiwan and citizens should not believe in rumours.
Also read: US House Speaker Pelosi: Want to increase parliamentary exchanges with Taiwan
More comments
Chinese drills amount to a blockade of Taiwan's air and sea space.
Chinese drills have violated UN rules.
China continues to launch psychological warfare on Taiwan and citizens should not believe in rumors.
Will firmly defend National Security.
Urge Taiwan citizens to report fake news to government.
Will enhance alertness level with the principle of not asking for a war.
Chinese drills seriously violated Taiwan's sovereignty.
Market sentiment dwindles
The news fails to register any major impact as the S&P 500 Futures keeps the recent mild gains around 4,100 by the press time.
- USD/JPY fades bounce off two-month low, holds lower ground near daily bottom.
- Bearish MACD signals another attempt to break 100-day EMA.
- Three-week-old descending trend line adds to the upside filters.
USD/JPY consolidates the biggest daily gains in six weeks around 133.00 during Wednesday’s Asian session. In doing so, the yen pair fades bounce off the 100-day EMA while reversing from the 50-day EMA.
Given the bearish MACD signals and the US dollar’s failure to remain firmer, the USD/JPY prices are likely to extend the latest pullback moves.
That said, the 61.8% Fibonacci retracement of May-July upside near 131.30 could lure the short-term sellers.
However, clear downside break of the 100-day EMA, around 130.40 by the press time, becomes necessary to convince USD/JPY bears. Even so, the 130.00 threshold could test the south-run.
Alternatively, recovery moves need a daily closing beyond the 50-day EMA level near 134.00 to challenge the 38.2% Fibonacci retracement resistance of 134.40.
Following that, a downward sloping resistance line from mid-July, close to 136.10, will be important as it holds the key to the USD/JPY rally towards refreshing the yearly high near 139.40. In doing so, the 140.00 psychological magnet will be on the bull’s radar.
USD/JPY: Daily chart
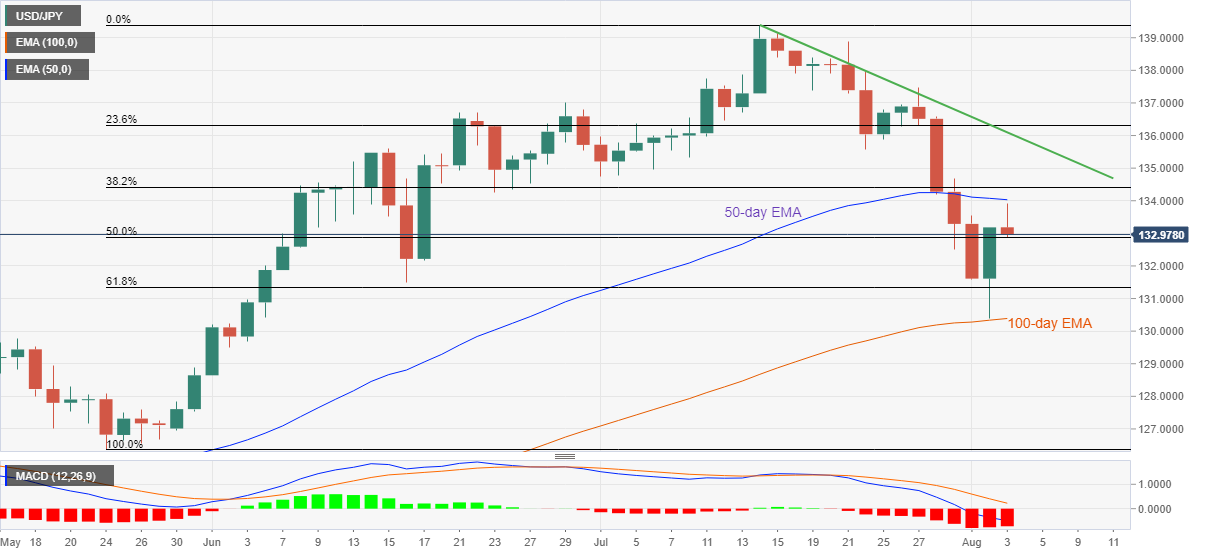
Trend: Further weakness expected
- GBP/USD has climbed to 1.2177 as risk-on impulse returns confidently to the FX domain.
- The DXY is likely to remain uncertain ahead of the US NFP data.
- Investors are hoping for a 25 bps rate hike by the BOE.
The GBP/USD pair has surpassed the immediate hurdle of 1.2172 as investors have ignored the US-China tensions and have returned to risk-perceived currencies. The cable picked significant bids below 1.2140 and displayed a vertical upside move. The asset has printed an intraday high of 1.2175 and is likely to extend gains.
Earlier, the risk-sensitive currencies were underperforming as escalating Sino-US tensions improved the safe-haven appeal. Also, a pullback move in the DXY was highly expected. The DXY is likely to entertain short-term investors ahead of the US Nonfarm Payrolls (NFP) data, which is due on Friday.
The employment data is likely to remain downbeat as the market participants are expecting a downward shift in the employment generation to 250k than the prior release of 372k. Also, the Unemployment Rate is expected to remain unchanged at 3.6%. Investors should be aware of the fact that the US economy is operating on full-employment levels and a prolonged increment in job creation at an increasing rate cannot sustain. However, a satisfactory jump should be expected.
On the UK front, investors are hoping for a rate hike by the Bank of England (BOE) in its monetary policy meeting on Thursday. BOE Governor Andrew Bailey is expected to hike the interest rate by 25 basis points (bps). Considering the inflation rate at 9.4%, a rate hike by 25 bps is unable to offset price pressures. However, the downbeat economic indicators and political instability are restricting the BOE to go all in unhesitatingly.
- AUD/USD is eyeing a stabilization above 0.6900 on stellar Caixin Services PMI data.
- Aussie bulls failed to capitalize on hawkish commentary by the RBA.
- The RBA elevated its OCR by 50 bps to 1.85%.
The AUD/USD pair has surpassed the immediate hurdle of 0.6900 swiftly and is likely to establish above the same as IHS Markit has reported stellar Caixin Services PMI numbers. The pair have witnessed a responsive buying action after printing a low of 0.6886 in the Asian session.
The Caixin Services PMI data has landed at 55.5, significantly higher than the expectations of 48 and the prior release of 54.5. It is worth noting that Australia is a leading trading partner to China and upbeat China economic data supports the aussie bulls.
On Tuesday, the asset witnessed a steep fall after the escalation of US-China tensions triggered negative market sentiment. The intention of visiting Taiwan by US House Speak Nancy Pelosi was followed by death threats from China. No doubt, the event is likely to result in sanctions on China.
Also, the antipodean failed to capitalize on the hawkish stance considered by the Reserve Bank of Australia (RBA) in its monetary policy meeting. RBA Governor Philip Lowe featured a third consecutive rate hike by 50 basis points (bps). An interest rate hike by 50 bps pushed the Official Cash Rate (OCR) to 1.85%.
The RBA has preferred not to take the bullet and elevate the interest rates to contain soaring price pressures in the Australian economy. Earlier, the Australian inflation rate landed at 6.1% for the second quarter of CY2022, much higher than the prior release of 5.1%.
Analysts at Goldman Sachs align with the market consensus for a 50 bps Bank of England (BOE) rate hike this Thursday. The decision will be announced at 11:30 GMT followed by Governor Andrew Bailey’s press conference at 11:30 GMT.
Key quotes
“The Bank of England meet Thursday, a rate hike is widely expected.“
"We expect all MPC members to vote for a 50bp hike next Thursday.”
“However, it is possible we get one dissent for a smaller 25bp hike from External MPC member Tenreyro.”
| Raw materials | Closed | Change, % |
|---|---|---|
| Silver | 19.988 | -1.71 |
| Gold | 1761.35 | -0.58 |
| Palladium | 2052.35 | -6.29 |
- NZD/USD picks up bids to pare the biggest daily loss in a month.
- China Caixin Services PMI offered positive surprise in July.
- Recovery needs validation from immediate descending trend line.
- Bearish MACD signals, downbeat RSI challenge upside momentum.
NZD/USD takes the bids to refresh intraday high around 0.6240 after China flashed upbeat services activity numbers for July during Wednesday’s Asian session.
Not only the data but the 100-SMA and a two-week-long ascending support line also recall the Kiwi pair buyers after the bears cheered the biggest daily slump in a month the previous day. That said, RSI remains downbeat and the MACD signals also flash red marks, which in turn challenge the quote’s recent rebound.
It’s worth noting that China Caixin Services PMI for July rose to 55.5 versus 48 expected and 54.5 prior.
With this in mind, NZD/USD buyers approach an immediate descending trend line resistance, near 0.6270, but may have to struggle inside the fortnight-old bullish channel.
Hence, the stated channel’s upper line, near 0.6345, as well as the recent peak of 0.6353 could challenge the upside moves.
Alternatively, the 100-SMA and the aforementioned support line, close to 0.6220 and 0.6210 in that order, could restrict the NZD/USD pair’s immediate downside.
Also acting as the key downside filter is the 61.8% Fibonacci retracement of the quote’s upside from July 14, around 0.6170.
NZD/USD: Four-hour chart
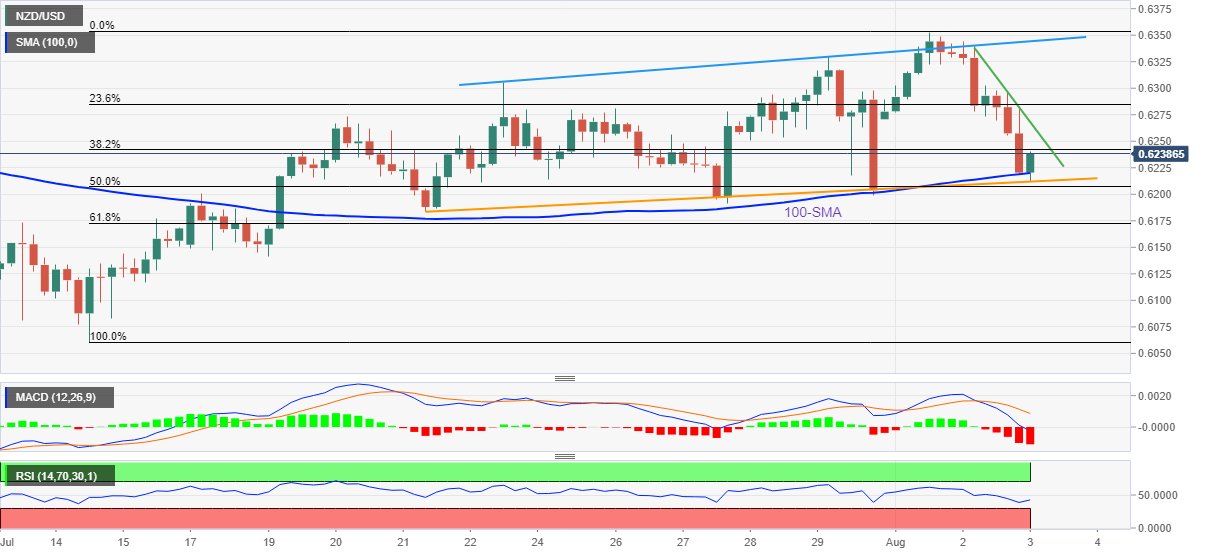
Trend: Limited upside expected
US House Speaker Nancy Pelosi told Taiwan parliament's deputy head on Wednesday that they want to increase parliamentary exchanges with Taiwan.
Its calm so far on the military front, although Russian naval ships have made independent transits and joined with Chinese ships sailing near disputed Taiwan islands. It’s worth noting that China and Russia recently pledged a 'no limits' friendship.
Meanwhile, China has continued to impose trade sanctions on Taiwan, as Beijing continues its dismay over Pelosi's visit to Taiwan through August 4. Since Monday, China Customs Administration has suspended imports of more than 2,000 of about 3,200 food products from Taiwan.
“The Chinese Communist party is extremely hostile towards Tsai’s DPP, which it describes as “Taiwan independence elements” despite the fact that the party supports keeping the status quo in the Taiwan Strait,” per the Financial Times (FT).
Market reaction
Risk sentiment is on a firmer footing so far during this Wednesday’s Asian trading, with S&P 500 futures 0.13% higher on the day.
At the press time, AUD/USD is flipping to gains near 0.6920 on upbeat Chinese Caixin Services PMI and a thaw in the US-China tensions over Taiwan.
- Gold price picks up bids to reverse the previous day’s pullback from monthly high.
- Upbeat China data, absence of major moves on Taiwan issue seemed to have favored gold buyers.
- US dollar’s failures to stay firmer also appear to have triggered XAU/USD recovery.
- Headlines surrounding Taiwan, Fedspeak and US data will provide fresh impulse.
Gold price (XAU/USD) renews its intraday high at around $1,765 while consolidating the biggest daily fall in a fortnight during Wednesday’s Asian session. In doing so, the yellow metal cheers the US dollar’s pullback from the weekly top amid a sluggish Asian session. The recovery moves also respect the firmer activity data from China.
The US Dollar Index (DXY) retreats from the weekly top near 106.55 to 106.34 by the press time as the market’s risk-aversion ebbs after firmer China Caixin Services PMI for July. That said, the private services gauge from the dragon nation rose to 55.5 versus 48 expected and 54.5 prior.
While portraying the mood, S&P 500 Futures rise 0.10% intraday while the US 10-year Treasury yields drop 1.5 basis points (bps) to 2.72% at the latest.
Earlier in the day, the US-China tussles over Taiwan gains major attention and extended the previous day’s risk-off mood, which in turn weighed on the gold prices. Recently, Taiwan's Defence Ministry said that China's drills around Taiwan demonstrate the country's determination to destroy regional peace and stability. It should be noted that China’s warning to the US to not play with the Taiwan card and promises to punish Taipei independence supporters, as well as blocking natural sand exports to the Asian economy, seemed to magnify the risk-off mood and drowned the US dollar. The fears grew stronger on concerns that tussles among the world’s top-two economies will have more negative consequences for the world amid recession fears.
Elsewhere, St. Louis Federal Reserve President James Bullard rejected US recession fears while favoring the 50 basis points (bps) rate hike. Further, San Francisco Fed President Mary Daly said that she is looking for incoming data to decide if they can downshift the rate hikes or continues at the current pace, as reported by Reuters. However, Chicago Fed President Charles Evans showed support for a 50 basis points (bps) rate hike for the September policy meeting if inflation does not improve, as reported by Reuters. Furthermore, Cleveland Fed President Loretta Mester, on the other hand, said she does not think the country is suffering a recession, adding that the labor market is in great shape. On inflation, however, she noted that it has not decreased "at all."
Moving on, the US Factory Orders for June and ISM Services PMI for July will join headlines surrounding China and the Fed to direct short-term XAU/USD moves.
Technical analysis
Gold price takes a U-turn from the 23.6% Fibonacci retracement of the April-July downturn amid bullish MACD signals and firmer RSI (14). However, the upside momentum needs validation from a 3.5-month-old resistance line, around $1,770 by the press time, to please the buyers.
Even so, an 11-week-old horizontal resistance zone and the 50-DMA, respectively near $1,785 and $1,791, could challenge the XAU/USD upside.
On the contrary, downside break of the immediate Fibo. support near $1,755 could direct the gold prices towards a fortnight-old support line, close to $1,747 at the latest.
Following that, the 21-DMA level around $1,732 could offer an intermediate halt during the anticipated fall targeting the yearly low near $1,680.
Gold: Daily chart
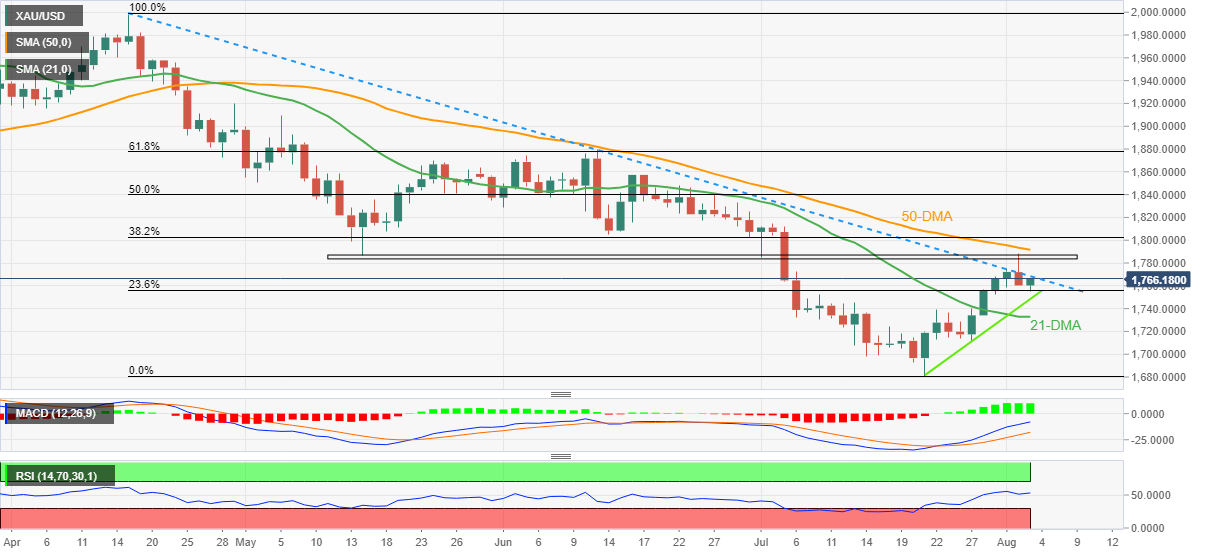
Trend: Sideways
- EUR/USD is stalling on the downside and there is a focus on the potential of a key break of structure.
- Bulls need to get over the 1.0171 swing point in the 15-min time frame.
Following the prior analysis, EUR/USD Price Analysis: Bulls could be about to make a move, the price of EUR/USD has stalled in an area that was presumed to be support. This could result in a bullish correction that could eventually result in an upside continuation leaving behind the outcome of an inverted head and shoulders.
EUR/USD daily chart
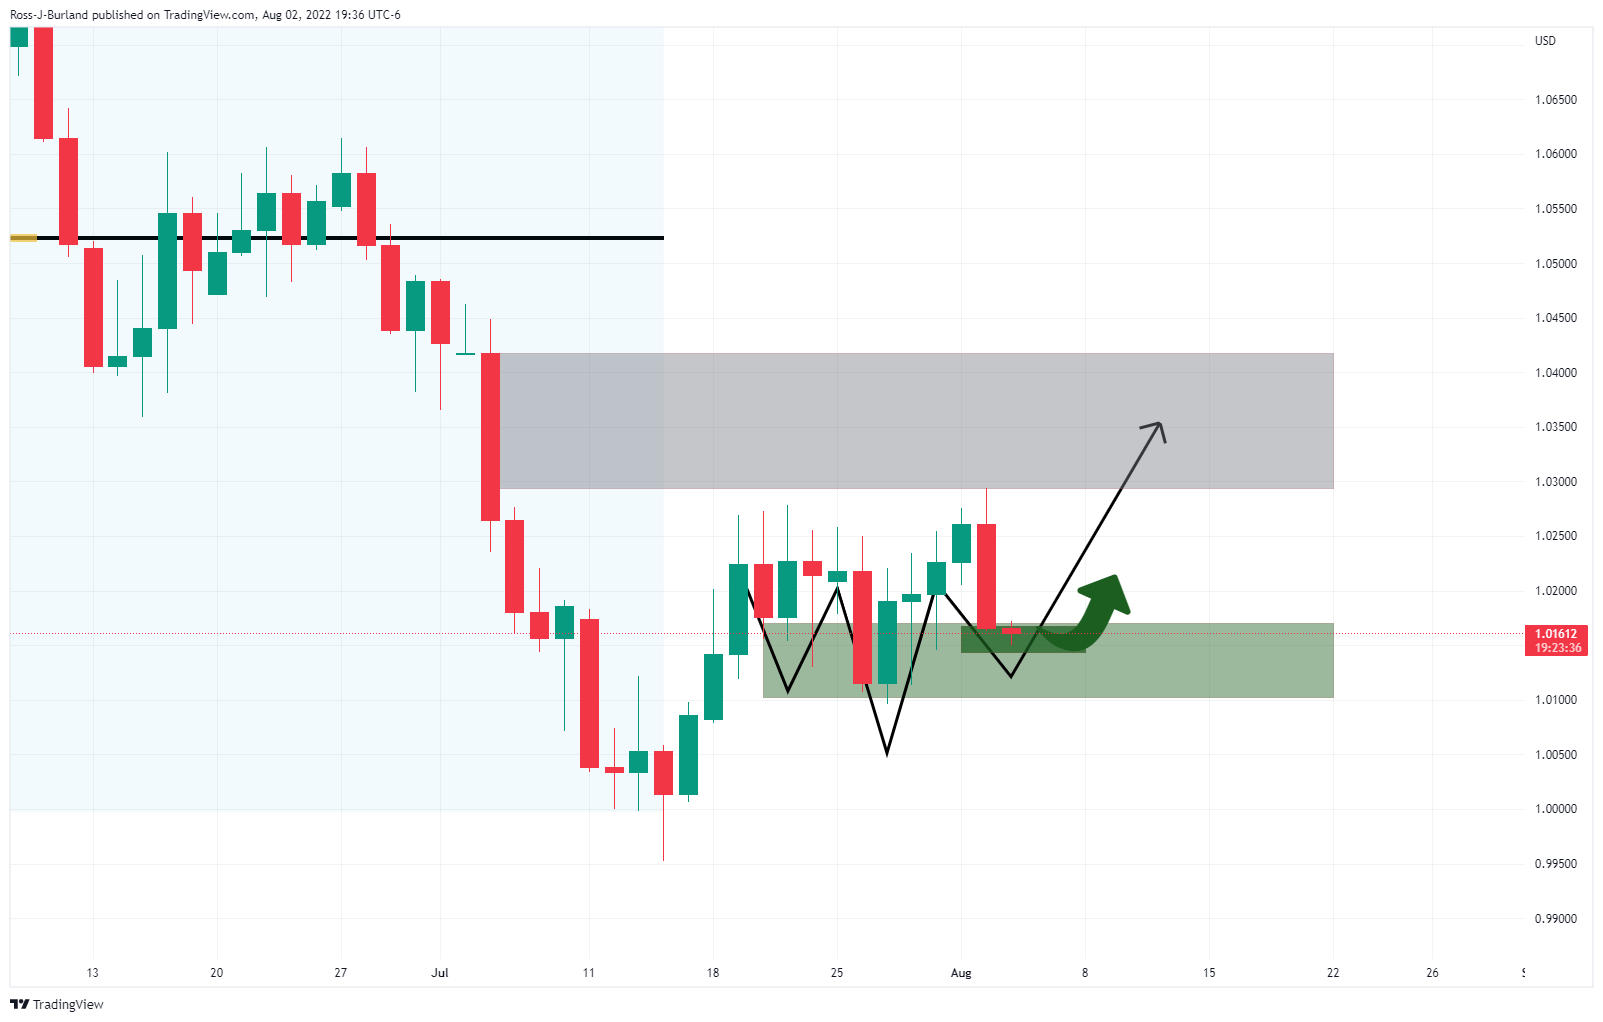
From a lower time frame, the price is breaking the trendline resistance which could lead to a basis of a bullish correction in the higher time frames:
EUR/USD M15 chart
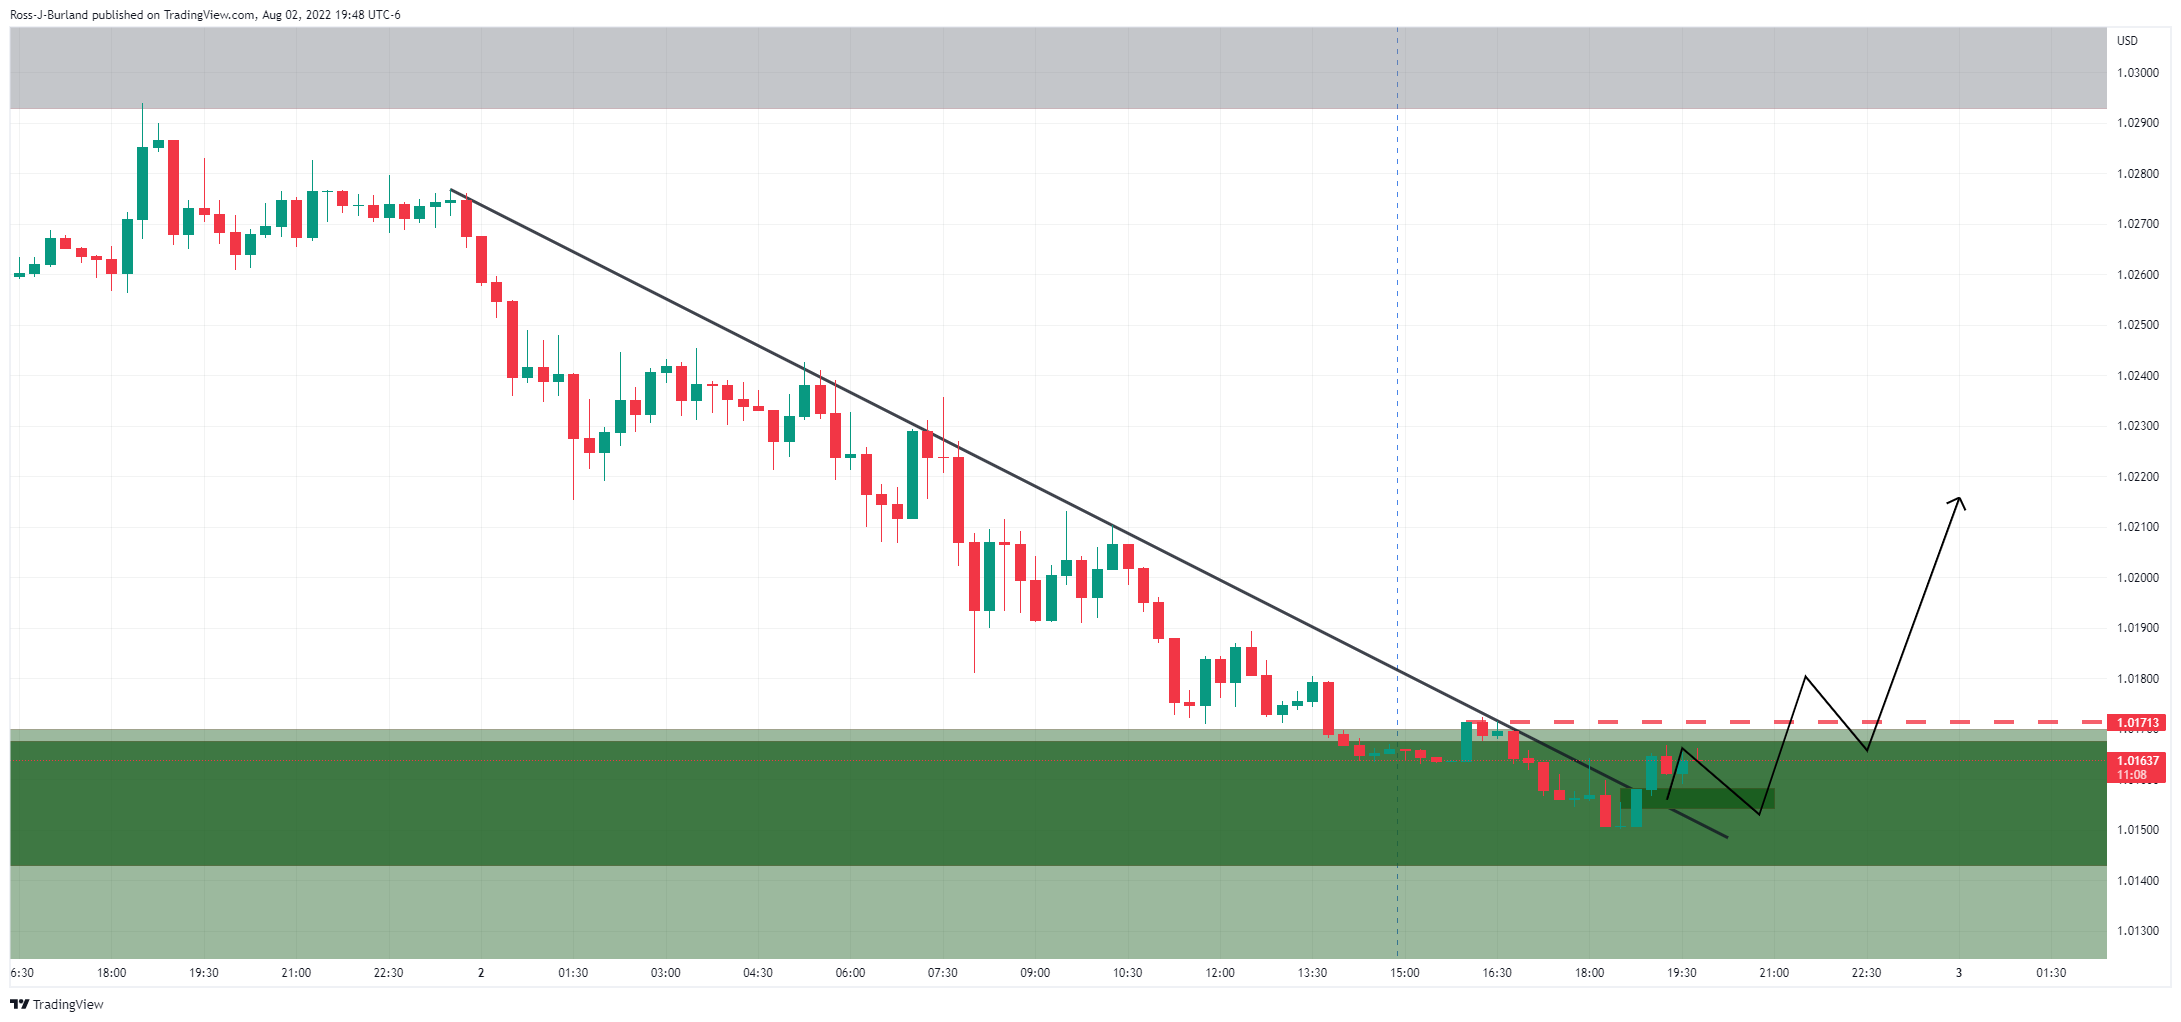
1.0171 is a swing point on the 15-min time frame that, it broken, could be a significant development in the bull's quest for higher levels.
China's Caixin services PMI for July arrived at 55.5 vs. 48.0 expected and 54.5 prior, showing that the country’s services activity expanded at the fastest pace in 15 months.
July survey data signaled a further recovery in Chinese services activity amid looser pandemic restrictions and the return to more normal business conditions.
Wang Zhe, Senior Economist at Caixin Insight Group said, “Supply and demand in the services sector expanded. Although Covid restrictions hurt the businesses of some service companies, the economic fallout from this round of outbreaks was fading. Gauges for business activity and new business were both in expansionary territory in July, hitting their highest readings in 15 and nine months respectively.”
“The pandemic situation overseas restricted external demand, with the measure for new export orders in contractionary territory for the seventh straight month,” Wang added.
AUD/USD holds above 0.6900
The above-forecast print of the Chinese Services PMI helps maintain the rebound in the aussie dollar, as AUD/USD is trading at 0.6909, down 0.14% on the day, at the time of writing.
- USD/CNH extends the previous day’s pullback from the highest levels since mid-May.
- 200-HMA, 61.8% Fibonacci retracement lures sellers amid steady RSI.
- Weekly horizontal area restricts immediate upside moves ahead of the monthly peak.
USD/CNH takes offers to refresh the intraday low around 6.7680 during Wednesday’s Asian session, extending the previous day’s pullback from a multi-day top.
With the offshore China yuan (CNH) pair’s pullback on Tuesday, the quote highlighted the importance of the weekly horizontal resistance area surrounding 6.7850. Also favoring the bearish bias is the RSI (14) during the latest weakness.
Hence, the USD/CNH sellers are well in condition to break the immediate support near the 200-HMA, at 6.7600 by the press time.
However, the 61.8% Fibonacci retracement of July 29 to August 02 upside and the short-term rising trend line, near 6.7545 and 6.7535 in that order, could challenge the USD/CNH bears afterward.
On the flip side, the pair buyers need validation from the weekly horizontal resistance zone near 6.7850 to retake control.
Following that, the 6.8000 threshold and the monthly peak of 6.7955 will be crucial to watch for the pair buyers.
Overall, USD/CNH is on the bear’s radar but the downside appears limited.
USD/CNH: Hourly chart
-03082022-637950880315072104.png)
Trend: Limited downside expected
- Silver prices remain pressured as sellers poke short-term key support.
- Bearish MACD signals, downbeat RSI line favor sellers.
- 200-SMA, previous resistance line from early June restricts immediate downside.
- Recovery moves need sustained break of $20.51 to lure buyers.
Silver price (XAG/USD) extends the previous day’s losses as bears approach the $19.75 key support during Wednesday‘s Asian session.
In doing so, the bright metal justifies the double-top bearish formation as it pokes the 200-SMA and a two-month-old previous resistance line. That said, the bearish MACD signals and downward sloping RSI, not oversold, also favors the metal sellers.
With this, the XAG/USD bears are likely to break the $19.75 immediate support, which in turn could direct the quote towards the monthly horizontal support area near $19.50-40.
In a case where silver sellers dominate past $19.40, the $19.00 and the $18.70 mark may offer an intermediate halt during the anticipated south-run targeting the yearly low near $18.15.
Alternatively, recovery moves remain elusive until the quote stays below the $20.51 horizontal hurdle, also the double-top area.
Following that, an upward trajectory towards the 61.8% Fibonacci retracement of the June-July downturn, near $20.85, can’t be ruled out.
However, the XAG/USD upside past $20.85 hinges on its ability to stay firmer beyond June 27 swing high near $21.55.
Silver: Four-hour chart
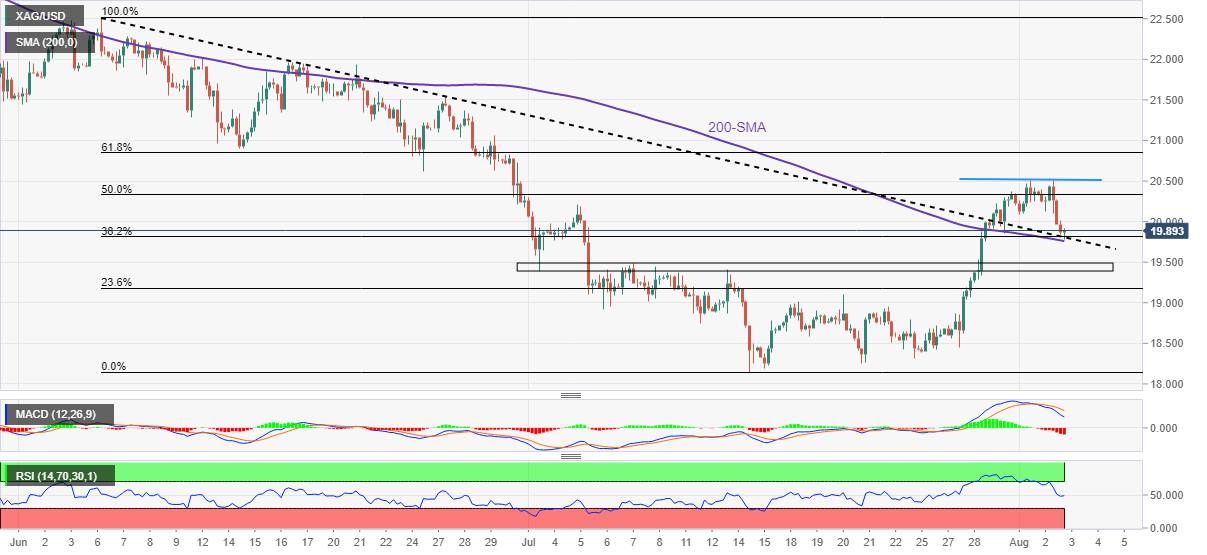
Trend: Further weakness expected
In recent trade today, the People’s Bank of China (PBOC) set the yuan (CNY) at 6.7813 vs. the previous fix of 6.7462 and the prior close of 6.7500.
About the fix
China maintains strict control of the yuan’s rate on the mainland.
The onshore yuan (CNY) differs from the offshore one (CNH) in trading restrictions, this last one is not as tightly controlled.
Each morning, the People’s Bank of China (PBOC) sets a so-called daily midpoint fix, based on the yuan’s previous day's closing level and quotations taken from the inter-bank dealer.
- NZD/USD takes offers to refresh intraday low as risk-aversion favors US dollar bulls.
- Fed’s Bullard rules out US recession while supporting 50 bps rate hike in September.
- China warns US over Taiwan issue, suspends natural sand exports to Taipei.
- Risk catalysts, China Caixin Services PMI could entertain traders ahead of US data.
NZD/USD pleases bears while refreshing the weekly low around 0.6210 during Wednesday’s Asian session. In doing so, the Kiwi pair justifies the markets’ risk-off mood, as well as hawkish comments from the US Federal Reserve (Fed) policymakers. That said, New Zealand (NZ) employment data for the second quarter (Q2) drowned the pair earlier in the day.
New Zealand employment numbers for the second quarter (Q2) raised concerns over the Reserve Bank of New Zealand’s (RBNZ) hawkish mood and drowned the New Zealand Dollar (NZD) on release. That said, NZ Unemployment Rate surprisingly grew to 3.3% versus 3.1% expected and 3.2% prior while the Employment Change dropped to 0.0% versus 0.4% market forecasts and 0.1% previous readings.
Elsewhere, St. Louis Federal Reserve President James Bullard rejected US recession fears while favoring the 50 basis points (bps) rate hike. Further, San Francisco Fed President Mary Daly said that she is looking for incoming data to decide if they can downshift the rate hikes or continues at the current pace, as reported by Reuters. However, Chicago Fed President Charles Evans showed support for a 50 basis points (bps) rate hike for the September policy meeting if inflation does not improve, as reported by Reuters. Furthermore, Cleveland Fed President Loretta Mester, on the other hand, said she does not think the country is suffering a recession, adding that the labor market is in great shape. On inflation, however, she noted that it has not decreased "at all."
It should be noted that China’s recent warning to the US to not play with the Taiwan card and promises to punish Taipei independence supporters, as well as blocking natural sand exports to the Asian economy, seemed to magnify the risk-off mood and drowned the US dollar. The fears growth stronger tussles among the world’s top-two economies will have more negative consequences for the world amid recession fears.
Against this backdrop, the Wall Street benchmarks closed negative for the second consecutive day while the S&P 500 Futures print mild losses by the press time. It should be observed, however, that the US 10-year Treasury yields pause the previous day’s rebound from the four-month low and test the US Dollar Index run-up.
Looking forward, monthly prints of China’s Caixin Services PMI could direct immediate NZD/USD moves ahead of the US Factory Orders for June and ISM Services PMI for July. Above all, headlines surrounding China and Fed will be important to watch for clear directions.
Technical analysis
A successful downside break of the three-week-old ascending trend line, at 0.6270 by the press time, directs NZD/USD prices towards the 21-DMA support level near 0.6210 at the latest. In a case where the Kiwi pair remains weak past 0.6210, the 0.6200 threshold may act as a validation point for the downward trajectory to refresh the yearly low near 0.6060.
- USD/CHF is heading towards 0.9600 as US-China trade tensions have triggered a risk-off impulse.
- The downbeat consensus for US NFP could halt the DXY’s rally.
- A preliminary estimate for the Swiss CPI is 3.5% vs. 3.4% recorded earlier.
The USD/CHF pair is marching swiftly towards the critical barricade of 0.9600 as the US dollar index (DXY) has strengthened on souring market mood. The pair witnessed a firmer reversal on Tuesday after defending Monday’s low around 0.9480 as the risk-aversion theme improved the DXY’s appeal.
Escalating tensions between US and China after US House Speaker Nancy Pelosi visited Taiwan to support their local government against the willingness of China. Death threats to Pelosi on her personal visit to Taiwan are likely to be followed by sanctions on China by the US, which underpinned the negative market sentiment.
Meanwhile, the DXY has printed a three-day high of 106.55, however, the rally could get uncertain ahead of the US Nonfarm Payrolls (NFP), which are due on Friday. As per the market expectations, the US economy has managed 250k job additions in the labor force in July.
Many big tech companies in the US have ditched the recruitment process for a while, whose multiplier effects could be witnessed in the payrolls data. An occurrence of the same will force the Federal Reserve (Fed) to sound a little light on policy rates.
On the Swiss franc front, investors are awaiting the release of the Consumer Price Index (CPI) data. A preliminary estimate for the annual inflation rate is 3.5%, a little higher than the prior release of 3.4%. This will compel the Swiss National Bank (SNB) to elevate interest rates further.
- USD/JPY's daily chart's higher Fibonaccis remain vulnerable.
- USDJPY's four-hour chart has left behind a W-formation.
USD/JPY bulls remain in charge but there are prospects of a pullback for the coming sessions and days ahead. The following illustrates the market structure on the daily and 4-hour time frames.
USD/JPY daily chart
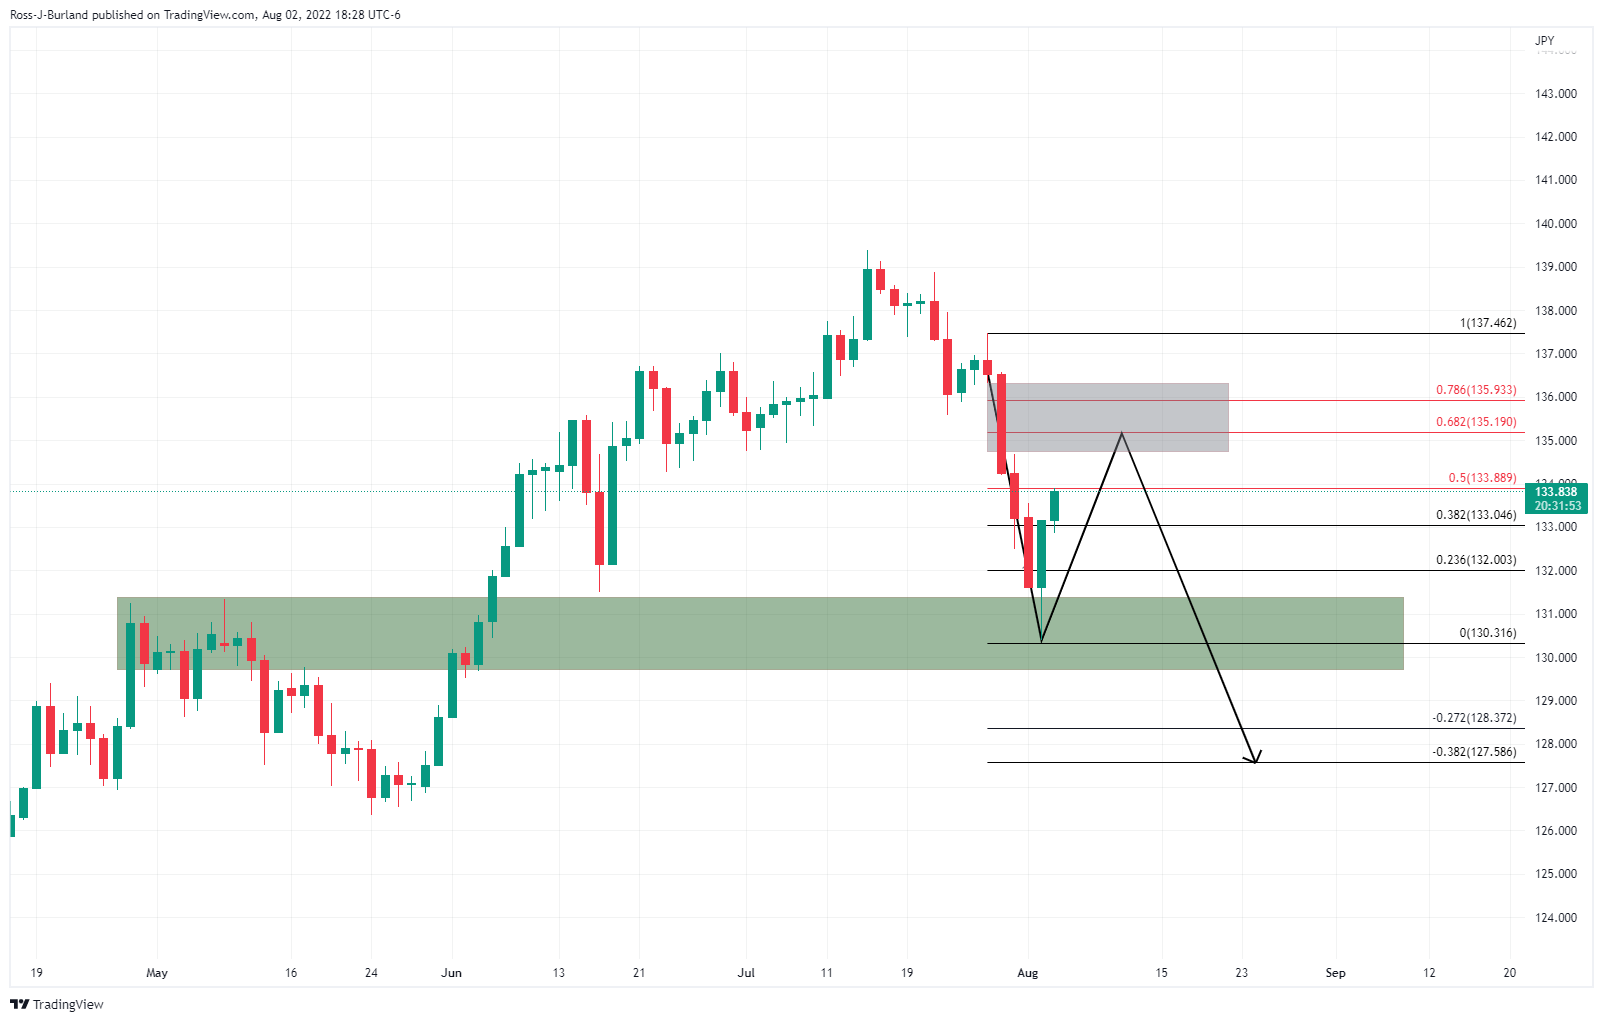
The price of USD/JPY has corrected from the lower quarter of the 130 area in a determined two-day rally to a 50% mean reversion of the prior bearish impulse. From here, should the bulls commit, the price could be attracted to a higher volume area on the chart where there is a price imbalance aligning with the 61.8% and 78.6% Fibonacci levels.
USD/JPY H4 chart
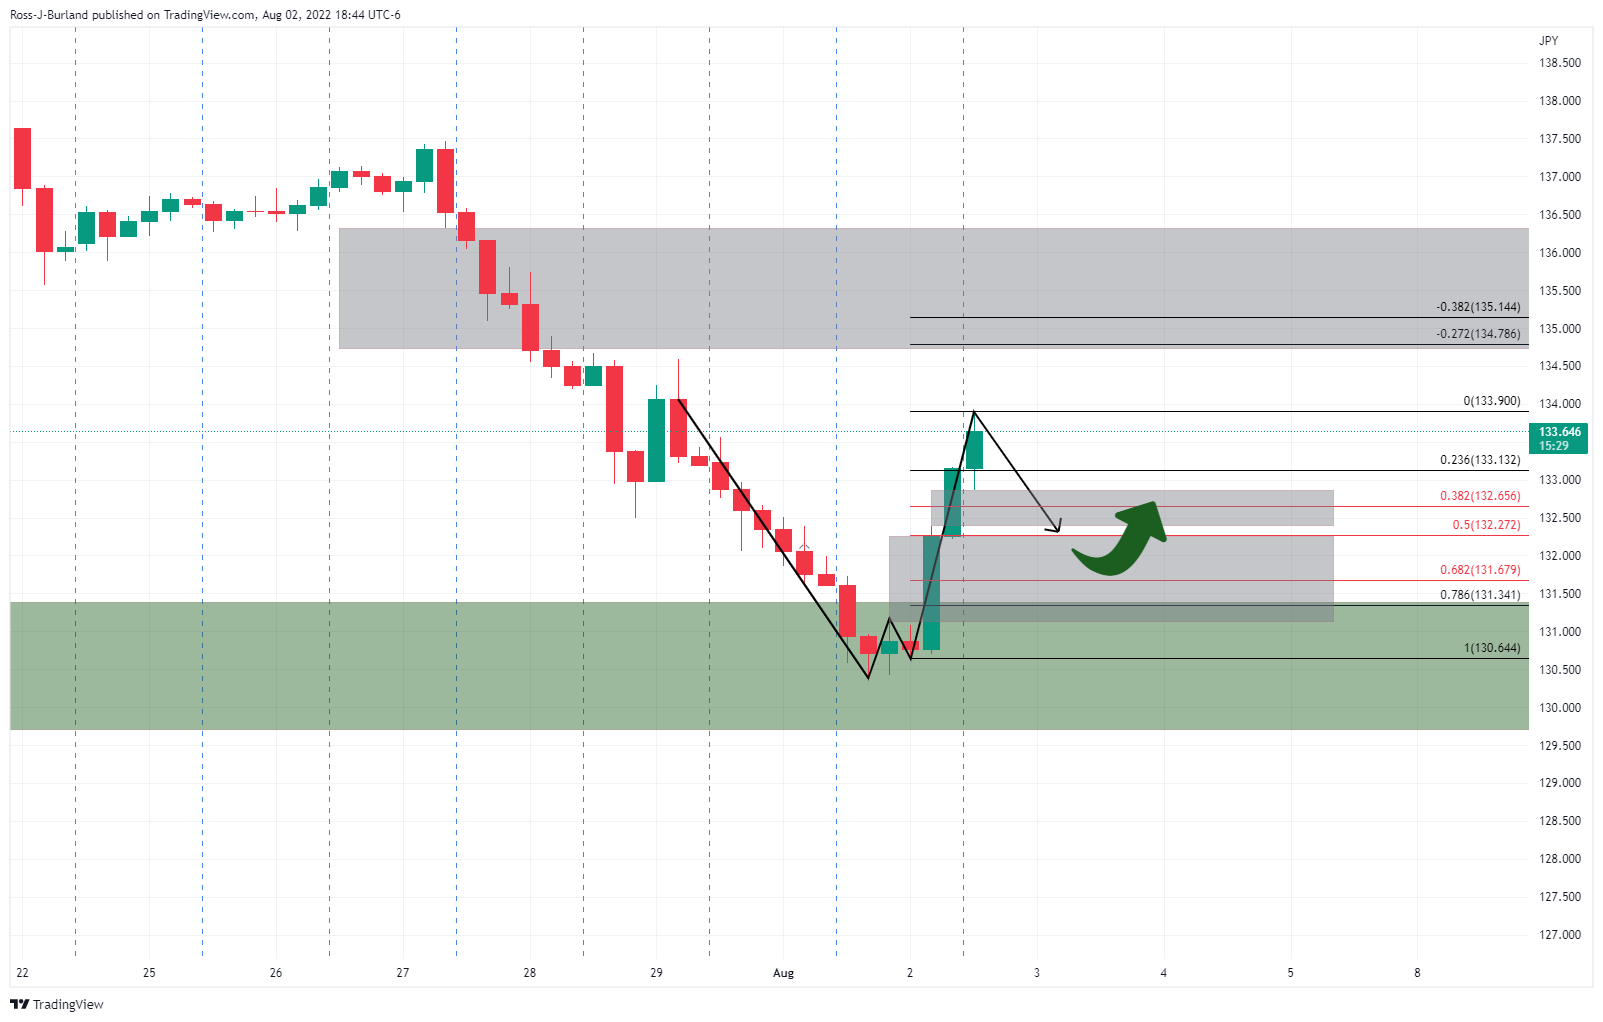
However, USDJPY's four-hour chart has left behind a W-formation following the recent bullish correction. This is a reversion pattern that would be expected to see a pullback in due course. There are a couple of areas of price imbalances below the current spot. A 50% mean reversion idles between these areas which could be a compelling area of interest near 132.30.
- AUD/USD extends pullback from monthly high, takes offers to refresh daily bottom.
- Sustained break of 50-day EMA, three-week-old ascending trend line favors sellers.
- Bulls need to wait for 0.7045-50 break for re-entry.
- Ascending trend line from early May restricts immediate downside.
AUD/USD remains on the back foot for the second consecutive day as it refreshes a weekly low around 0.6890 amid Wednesday’s Asian session.
In doing so, the Aussie pair sellers extend the previous day’s downside break of the 50-day EMA and an upward sloping trend line from July 14.
Given the recently downbeat RSI and an impending bear cross on the MACD, the recent AUD/USD weakness is likely to persist.
However, an upward sloping support line from May 12, close to 0.6880 by the press time, restricts immediate declines of the pair.
Following that, the 0.6765-60 area will be crucial to watch for the AUD/USD sellers as it holds the key for the pair’s south-run towards refreshing the yearly low, around 0.6670.
Meanwhile, recovery moves need to cross the 50-day EMA and the previous support line, respectively around 0.6960 and 0.6970, for fresh entry.
Even so, a convergence of the 100-day EMA and a downward sloping resistance line from April 20, close to 0.7045-50, appears a tough nut to crack for the AUD/USD bulls.
AUD/USD: Daily chart
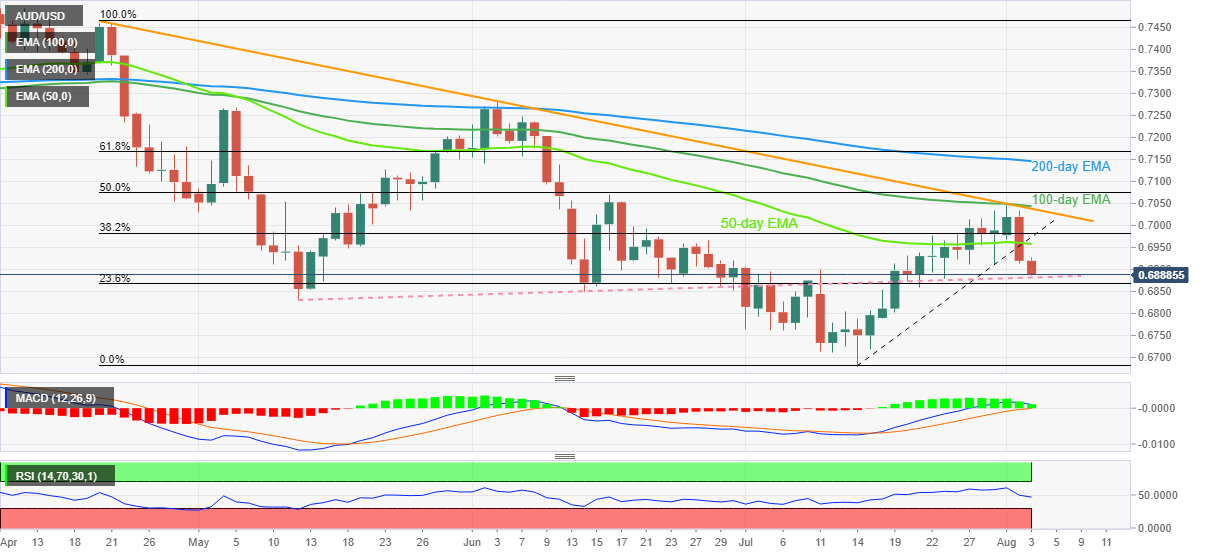
Trend: Further weakness expected
| Index | Change, points | Closed | Change, % |
|---|---|---|---|
| NIKKEI 225 | -398.62 | 27594.73 | -1.42 |
| Hang Seng | -476.63 | 19689.21 | -2.36 |
| KOSPI | -12.63 | 2439.62 | -0.52 |
| ASX 200 | 5.1 | 6998.1 | 0.07 |
| FTSE 100 | -4.29 | 7409.11 | -0.06 |
| DAX | -30.43 | 13449.2 | -0.23 |
| CAC 40 | -27.06 | 6409.8 | -0.42 |
| Dow Jones | -402.23 | 32396.17 | -1.23 |
| S&P 500 | -27.44 | 4091.19 | -0.67 |
| NASDAQ Composite | -20.22 | 12348.76 | -0.16 |
- DXY picks up bids to renew weekly high after rising the most in three weeks the previous day.
- Hawkish Fedspeak, US-China tussles underpin the US dollar’s safe-haven demand.
- Lack of negative action from Beijing on Pelosi’s Taiwan visit appears to tame the bulls of late.
- Anxiety ahead of US ISM Services PMI, Factory Orders also propel US Dollar Index.
US Dollar Index (DXY) extends the previous day’s rebound from the monthly low as it refreshes in the intraday top around 106.50 during Wednesday’s Asian session. That said, the greenback’s gauge versus the six major currencies rallied the most in three weeks on Tuesday amid geopolitical tension and hawkish Fedspeak.
While joining the line of the hawkish Fed speakers, St. Louis Federal Reserve President James Bullard reiterated support for the hawkish Fed moves and favored the DXY bulls of late. “Federal Reserve and the European Central Bank may both be able to execute a "relatively soft landing" that avoids a harsh recession for their respective economies as they raise interest rates to rein in inflation,” the policymaker said.
Previously, San Francisco Fed President Mary Daly said that she is looking for incoming data to decide if they can downshift the rate hikes or continues at the current pace, as reported by Reuters. However, Chicago Fed President Charles Evans showed support for a 50 basis points (bps) rate hike for the September policy meeting if inflation does not improve, as reported by Reuters. Furthermore, Cleveland Fed President Loretta Mester, on the other hand, said she does not think the country is suffering a recession, adding that the labor market is in great shape. On inflation, however, she noted that it has not decreased "at all."
It should be noted that the geopolitical tension between the US and China, recently over Taiwan, offers more strength to the US dollar due to its haven appeal. The fears growth stronger tussles among the world’s top-two economies will have more negative consequences for the world amid recession fears. “US House of Representatives Speaker Nancy Pelosi arrived in Taiwan late on Tuesday on a trip she said shows an unwavering American commitment to the Chinese-claimed self-ruled island, but China condemned the highest-level U.S. visit in 25 years as a threat to peace and stability in the Taiwan Strait,” said Reuters.
Not only the Taiwan issue but talks of likely US restrictions on the chip-making machinery’s exports to China also magnified the Sino-American tussles. It’s worth noting that Beijing’s policymakers also showed a lack of confidence in this year’s Gross Domestic Product (GDP) and favored the DXY bulls.
Amid these plays, the Wall Street benchmarks closed negative for the second consecutive day while the S&P 500 Futures print mild losses by the press time. It should be observed, however, that the US 10-year Treasury yields pause the previous day’s rebound from the four-month low and test the US Dollar Index run-up.
Moving on, headlines surrounding China and Fed could direct immediate DXY moves ahead of the US Factory Orders for June and ISM Services PMI for July.
Technical analysis
US Dollar Index pokes a three-week-old descending resistance line around 106.45, a break of which could direct buyers towards the 21-DMA hurdle surrounding 107.00. Meanwhile, the 50-DMA level near 105.10 restricts the DXY’s short-term downside.
- WTI is likely to extend losses as the DXY has accelerated broadly on escalating US-China tensions.
- The oil cartel may promise a modest addition to the global oil supply.
- Recession fears in the global economy will keep the oil prices on the back foot.
West Texas Intermediate (WTI), futures on NYMEX, is declining sharply towards $90.00 after failing to sustain above the critical hurdle of $95.00 on Tuesday. The black gold has witnessed an extreme sell-off as escalating US-China tensions brought a juggernaut rebound in the US dollar index (DXY). Also, the market participants are expecting a promise of pumping modest oil quantity in the global supply by the OPEC in its meeting on Wednesday.
On a broader note, the oil prices are oscillating in a$9 wide range for the past three weeks and the downside remains favored due to various catalysts. The odds of a recession are advancing sharply as various nations have come forward with lower manufacturing activities. Oil’s leading consumer, China reported a downbeat Caixin Manufacturing PMI on Monday as the resurgence of Covid-19 in July hit their economic activities.
Also, the ongoing US-China tensions amid death threats to US House Speaker Nancy Pelosi on her personal visit to Taiwan may result in embargos with China. This may further deteriorate their oil demand. Meanwhile, with more oil supply from OPEC in times when demand is not picking up, oil prices could be filthier ahead.
Many western central banks have elevated interest rates to squeeze liquidity from the market heavily. This will force the corporate to inculcate more filters on investment avenues. Fewer investments will squeeze economic activities and eventually, will trim the demand forecast for oil.
| Pare | Closed | Change, % |
|---|---|---|
| AUDUSD | 0.69185 | -1.55 |
| EURJPY | 135.329 | 0.18 |
| EURUSD | 1.01631 | -0.93 |
| GBPJPY | 161.929 | 0.38 |
| GBPUSD | 1.21613 | -0.73 |
| NZDUSD | 0.62515 | -1.19 |
| USDCAD | 1.2878 | 0.28 |
| USDCHF | 0.95738 | 0.79 |
| USDJPY | 133.16 | 1.13 |
- A usual corrective move may drag the cable towards 1.2100.
- The 50-EMA at 1.2129 is still untouched but is likely to get tested sooner.
- A range shift by the RSI (14) to 40.00-60.00 indicates that the cable has surrendered the upside momentum.
The GBP/USD pair has corrected to near 1.2140 after surrendering the critical support of 1.2180 on Tuesday. The cable witnessed an extreme sell-off on Tuesday after failing to recapture monthly highs at 1.2293. A corrective move is likely to expand further as investors have underpinned risk-off impulse due to escalating US-China tensions over Taiwan.
On a four-hour scale, the cable is auctioning in a Rising Channel formation that favors a north-side on a broader note but faces various healthy corrections in the upside journey. The upper portion of the above-mentioned chart pattern is placed from July 13 high at 1.1968 while the lower portion is plotted from July 14 low at 1.1760.
The asset has surrendered the 20-period Exponential Moving Average (EMA) at 1.2190 while the 50-EMA at 1.2129 is still untouched but is likely to be tested sooner.
Meanwhile, the Relative Strength Index (RSI) (14) has slipped into the 40.00-60.00 range, which indicates that gold prices are not carrying bullish momentum for a while.
A minor pullback towards 1.2150 will be a bargain sell for the market participants. This will drag the cable towards the round-level support at 1.2100. A decisive slippage below 1.2100 will unleash the greenback bulls and the cable will drag further to July 29 low at 1.2063.
On the flip side, the cable may start a fresh bullish impulsive wave if the asset oversteps the 20-EMA at 1.2190. An occurrence of the same will drive the asset towards July 29 high at 1.2246, followed by a monthly high at 1.2294.
GBP/USD four-hour chart
-637950815904487747.png)


© 2000-2026. All rights reserved.
This site is managed by Teletrade D.J. LLC 2351 LLC 2022 (Euro House, Richmond Hill Road, Kingstown, VC0100, St. Vincent and the Grenadines).
The information on this website is for informational purposes only and does not constitute any investment advice.
The company does not serve or provide services to customers who are residents of the US, Canada, Iran, The Democratic People's Republic of Korea, Yemen and FATF blacklisted countries.
Making transactions on financial markets with marginal financial instruments opens up wide possibilities and allows investors who are willing to take risks to earn high profits, carrying a potentially high risk of losses at the same time. Therefore you should responsibly approach the issue of choosing the appropriate investment strategy, taking the available resources into account, before starting trading.
Use of the information: full or partial use of materials from this website must always be referenced to TeleTrade as the source of information. Use of the materials on the Internet must be accompanied by a hyperlink to teletrade.org. Automatic import of materials and information from this website is prohibited.
Please contact our PR department if you have any questions or need assistance at pr@teletrade.global.
transfers