- Analytics
- News and Tools
- Market News
CFD Markets News and Forecasts — 01-08-2022
- USD/JPY pauses four-day downtrend near the lowest levels since early June.
- Yields remain pressured amid “technical recession” fears, mixed concerns over Fed’s next moves.
- Expected increase in Japan’s minimum wage also underpins JPY strength.
- Fedspeak, China-linked headlines could entertain traders.
USD/JPY bears keep reins around the lowest levels in eight weeks as they flirt with the 131.50 level during Tuesday’s Asian session. The pair’s latest weakness could be linked to the downbeat yields and the recent positive headlines concerning Japan, not to forget mixed chatters surrounding the Fed and China.
The US 10-year Treasury yields refreshed a four-month low to around 2.58% the previous day as US data amplified the economic slowdown concerns. The same drowned the US dollar as traders await the key US employment data for July, up for publishing on Friday. That said, US Dollar Index (DXY) refreshed it's monthly low, before bouncing off 105.25 on Monday.
US ISM Manufacturing PMI dropped to the lowest since 2020 in July as the activity gauge dropped to 52.8 versus 53.0 prior. However, the actual figures were better than the 52.0 market forecast. Also, final readings of the US S&P Manufacturing PMI eased below 52.3 initial estimates to 52.2, compared to 52.7 prior. Furthermore, Germany’s Retail Sales dropped 8.8% YoY in June versus -8.0% market consensus and -3.6% prior.
It should be noted that the second consecutive day quarterly decline in the US Gross Domestic Product (GDP) triggered a “technical recession” the previous week and weighed on the US dollar. On the same line were Fed Chair Jerome Powell’s indirect signals that the hawks are running out of steam.
On a different page, Reuters quotes three sources familiar with the matter to mention that US House of Representatives Speaker Nancy Pelosi was set to visit Taiwan on Tuesday as the United States said it wouldn't be intimidated by Chinese threats to never "sit idly by" if she made the trip to the self-ruled island claimed by Beijing.
Amid these plays, Wall Street closed with mild losses while the US 10-year Treasury yields refreshed a four-month low of around 2.58%. That said, the S&P 500 Futures print mild losses of around 4,120 by the press time.
Looking forward, speeches from Chicago Fed President Charles L. Evans and President of the Federal Reserve Bank of St. Louis James Bullard will be important for short-term USD/JPY directions.
Technical analysis
A horizontal area comprising highs marked during April and May, near 131.25-35, could challenge USD/JPY bears amid oversold RSI (14).
- The DXY printed a fresh three-week low around 105.20 as forward demand may drop further.
- Oversold indicators are underpinning the odds of a pullback move.
- The lower consensus for US NFP will keep the DXY on the tenterhooks.
The US dollar index (DXY) is displaying signals of downside exhaustion around 105.40 as momentum indicators are displaying oversold signals on a lower timeframe. The DXY printed a fresh three-week low of 105.24 on Monday after the release of the downbeat US Institute of Supply Management (ISM) Manufacturing New Orders Index data.
Forward demand to remain weak
The US economy managed to report almost flat US ISM Manufacturing PMI data. The economic data landed at 52.8, higher than the estimates of 52 but remained lower than the prior release of 53. Moving to the US ISM Manufacturing New Orders Index, a vulnerable performance has been recorded.
The economic data indicates forward demand by the retailers and producers. The data remained lower than the estimates of 52 and the prior print of 49.2 at 48. A meaningful trim in the demand forecast indicator resulted in a steep fall in the DXY.
US NFP to remain in the spotlight
The US dollar index (DXY) is facing the heat of lower consensus for the US Nonfarm Payrolls (NFP) as the labor market is likely to display addition of 250k jobs in July, lower than the prior release of 372k.
A meaningful drop in the labor market is highly expected as higher interest rates by the Federal Reserve (Fed) have forced the corporate to levy more filters on investment avenues. Lower investment opportunities tend to keep employment generation in check.
Also, the commentary from big tech firms and automobile companies in their second-quarter earnings announcement on hiring indicated that the recruitment process will remain sluggish for the rest of 2022.
Key data this week: JOLTS Job Openings, Factory Orders, ISM Services PMI, Goods Trade Balance, Initial Jobless Claims, NFP, and Unemployment Rate.
Major events this week: RBA interest rate decision, Fed’s Evans speech, Fed’s Bullard speech, and BOE monetary policy.
- NZD/USD holds onto the upside break of 50-DMA at six-week high.
- Bullish MACD signals, sustained trading above the previous resistance line adds strength to the bulish bias.
- Mid-June high, 100-DMA lure buyers ahead of June’s peak.
NZD/USD grinds higher around the 1.5-month top after crossing the 50-DMA hurdle the previous day. That said, the Kiwi pair seesaws near 0.6335-40 during Tuesday’s Asian session.
In addition to the 50-DMA breakout, the pair’s successful trading beyond the downward sloping resistance line from April, now support around 0.6140, also keep buyers hopeful. Furthermore, bullish MACD signals and the higher low formation add strength to the bullish bias for the quote.
It’s worth noting that the pair’s further upside could aim for the mid-June swing high near 0.6400. However, the 38.2% Fibonacci retracement of the April-July downturn and the 100-DMA, respectively near 0.6435 and 0.6485, could challenge the NZD/USD buyers afterward.
On the flip side, pullback moves need validation from the 50-DMA level of 0.6302 to recall the sellers.
Following that, the previous resistance line from April and the recent lows, close to 0.6140 and 0.6060 in that order, could lure the NZD/USD bears.
Overall, NZD/USD prices recently crossed the key hurdle to the north and are likely to reverse the three-month-old downtrend.
NZD/USD: Daily chart
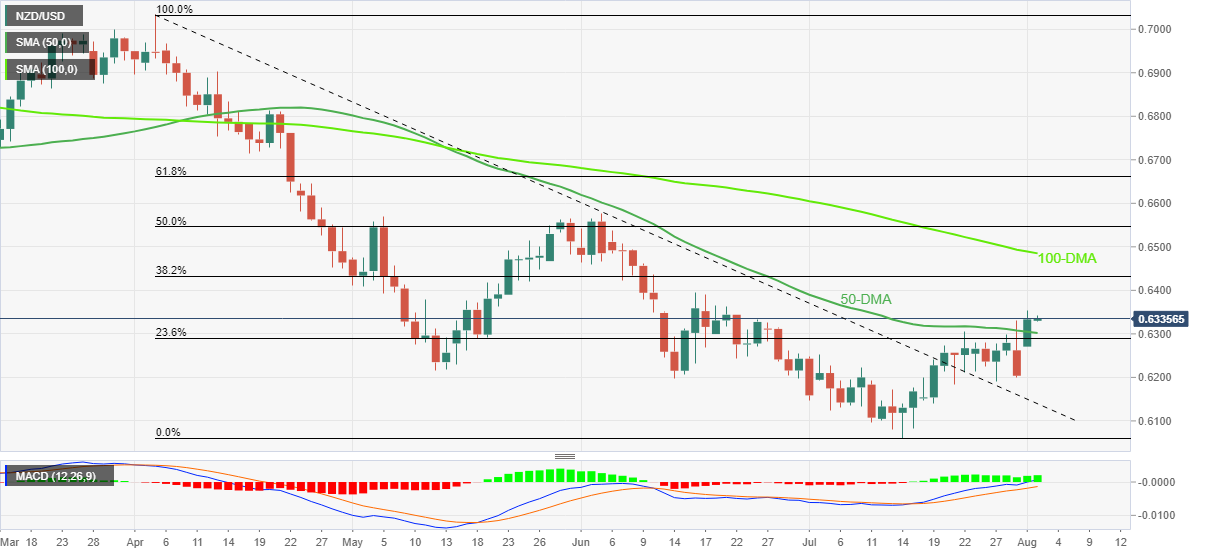
Trend: Further upside expected
Goldman Sachs (GS) conveyed its bearish bias for the EUR/USD pair in its latest research. That said, the US bank revised down its three-month and six-month forecasts to 0.99 and 1.02, compared to 1.05 and 1.10 respective prior estimations. GS also sounds bearish on the EUR/GBP prices as it expected the cross-currency pair to ease to 0.83 and 0.84, from 0.88 and 0.90 previously.
Key quotes
The next 6 months seem likely to be challenging for the Euro area, which is likely to keep EUR/USD close to parity.
Our economists now expect the Euro area to be in recession in the second half of this year; spot data are already slowing materially and further production disruptions are likely.
We think the recent move lower in EUR/USD reflects this shifting growth outlook, and is likely to extend somewhat further given the continued downside risks to activity from more severe gas disruptions and the scope for a much deeper downturn.
Even if the near-term picture improves a bit, we think recent disruptions will be enough to command an ongoing discount in EUR/USD.
Our commodity strategists have highlighted that weather-related uncertainty will be particularly elevated in the first half of winter.
Also read: EUR/USD Forecast: Bulls hesitate near critical Fibonacci resistance
- AUD/NZD has faced hurdles around 1.1100 as investors are anxious ahead of RBA policy.
- A third consecutive rate hike by 50 bps is expected by the RBA.
- Upbeat employment data is expected from the kiwi zone.
The AUD/NZD pair is facing barricades around the round-level resistance of 1.1100 in the early Tokyo session. The cross displayed a minor pullback after printing a fresh weekly low of 1.1076. The pair is likely to display volatile moves as investors are awaiting the announcement of the interest rate decision by the Reserve Bank of Australia (RBA) and employment data in the kiwi zone.
As per the market consensus, the RBA will elevate its Official Cash Rate (OCR) by 50 basis points (bps), consecutively for the third time. An announcement of the same will accelerate the OCR to 1.85%. RBA Governor Philip Lowe is bound to announce a rate hike as price pressures have climbed to 6.1% in the second quarter of CY2022 in Australia. Earlier, the inflation rate was recorded at 5.1%. A 100 bps increment in price pressures could be contained by policy tightening measures.
On the kiwi front, investors are focusing on the release of the employment data, which is due on Wednesday. A decent performance is expected on the labor front as the Employment Change is likely to improve significantly to 0.4% from the prior print of 0.1%. Also, the Unemployment Rate is expected to trim to 3.1% vs. 3.2% in the previous figure.
One thing is worth considering that the Labor Cost Index is expecting an improvement to 1.1% from 0.7% on a quarterly basis. The inflation rate is sky-rocketing in the kiwi zone and households need higher paychecks to offset the higher consumer expenditure.
- WTI remains pressured at a fortnight low after breaking monthly symmetrical triangle.
- Bearish MACD signals add strength to the downside bias directing prices towards 61.8% FE.
- Recovery remains elusive unless crossing 200-SMA, $95.75 guards immediate upside.
WTI crude oil prices remain depressed after breaking the one-month-old symmetrical triangle to the south. That said, the black gold holds lower ground near $93.00, the lowest levels in two weeks, during Tuesday’s Asian session.
Given the bearish MACD signals joining the triangle’s breakdown, the commodity prices are likely to decline further.
In doing so, the $90.00 threshold may act as immediate support ahead of directing the quote towards July’s low of $88.34.
It’s worth noting, however, that the RSI (14) is nearly oversold and hence any further downside past the recent lows appears less likely. Even so, the energy benchmark’s weakness below $88.34 could make it vulnerable to testing the 61.8% Fibonacci Expansion (FE) of June-July moves, near $85.65.
Meanwhile, the corrective pullback could aim to challenge the triangle’s support line, around $95.65 by the press time.
Following that, the $100.00 psychological magnet may test the WTI bulls before directing them to the stated triangle’s upper line, near $100.70 at the latest. Also acting as the upside filter is the 200-SMA level surrounding $101.10.
WTI: Four-hour chart
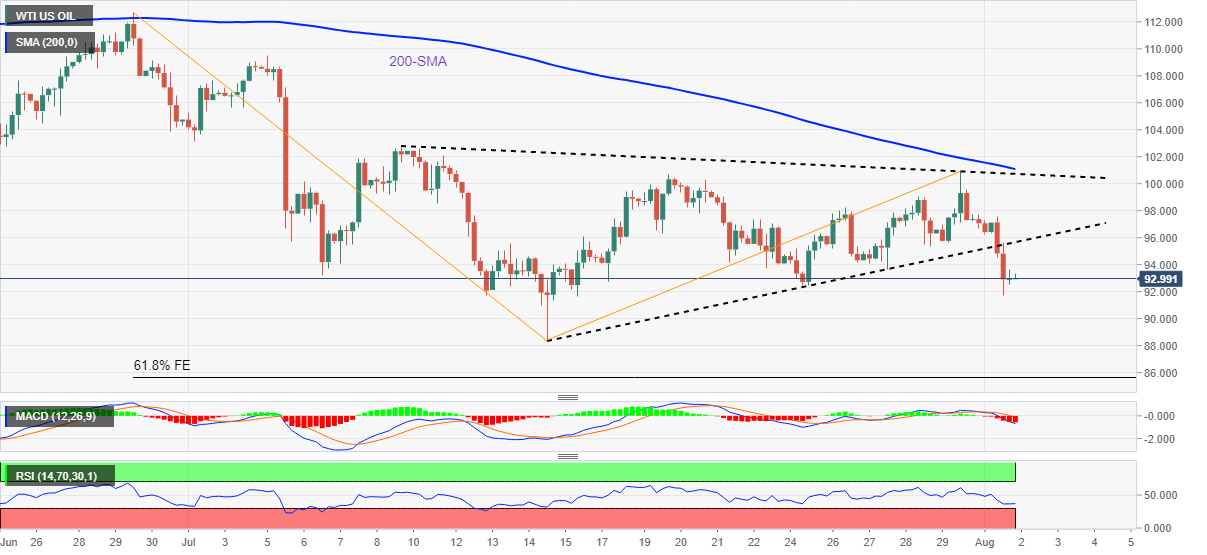
Trend: Further downside expected
- GBP/USD is starting to correct the recent bullish impulse.
- Bulls have eyes set on a full-on breakout, away from the counter trendline.
GBP/USD is a touch higher in early Asia following a bullish impulse at the start of this week. The pair has been in the hands of the bulls for the most part of Monday but there is still room to go to the upside before bullish territory. The following illustrates the longer-term prospects for a move higher while noting the hourly chart structure and the possibility of a meanwhile correction.
GBP/USD daily chart
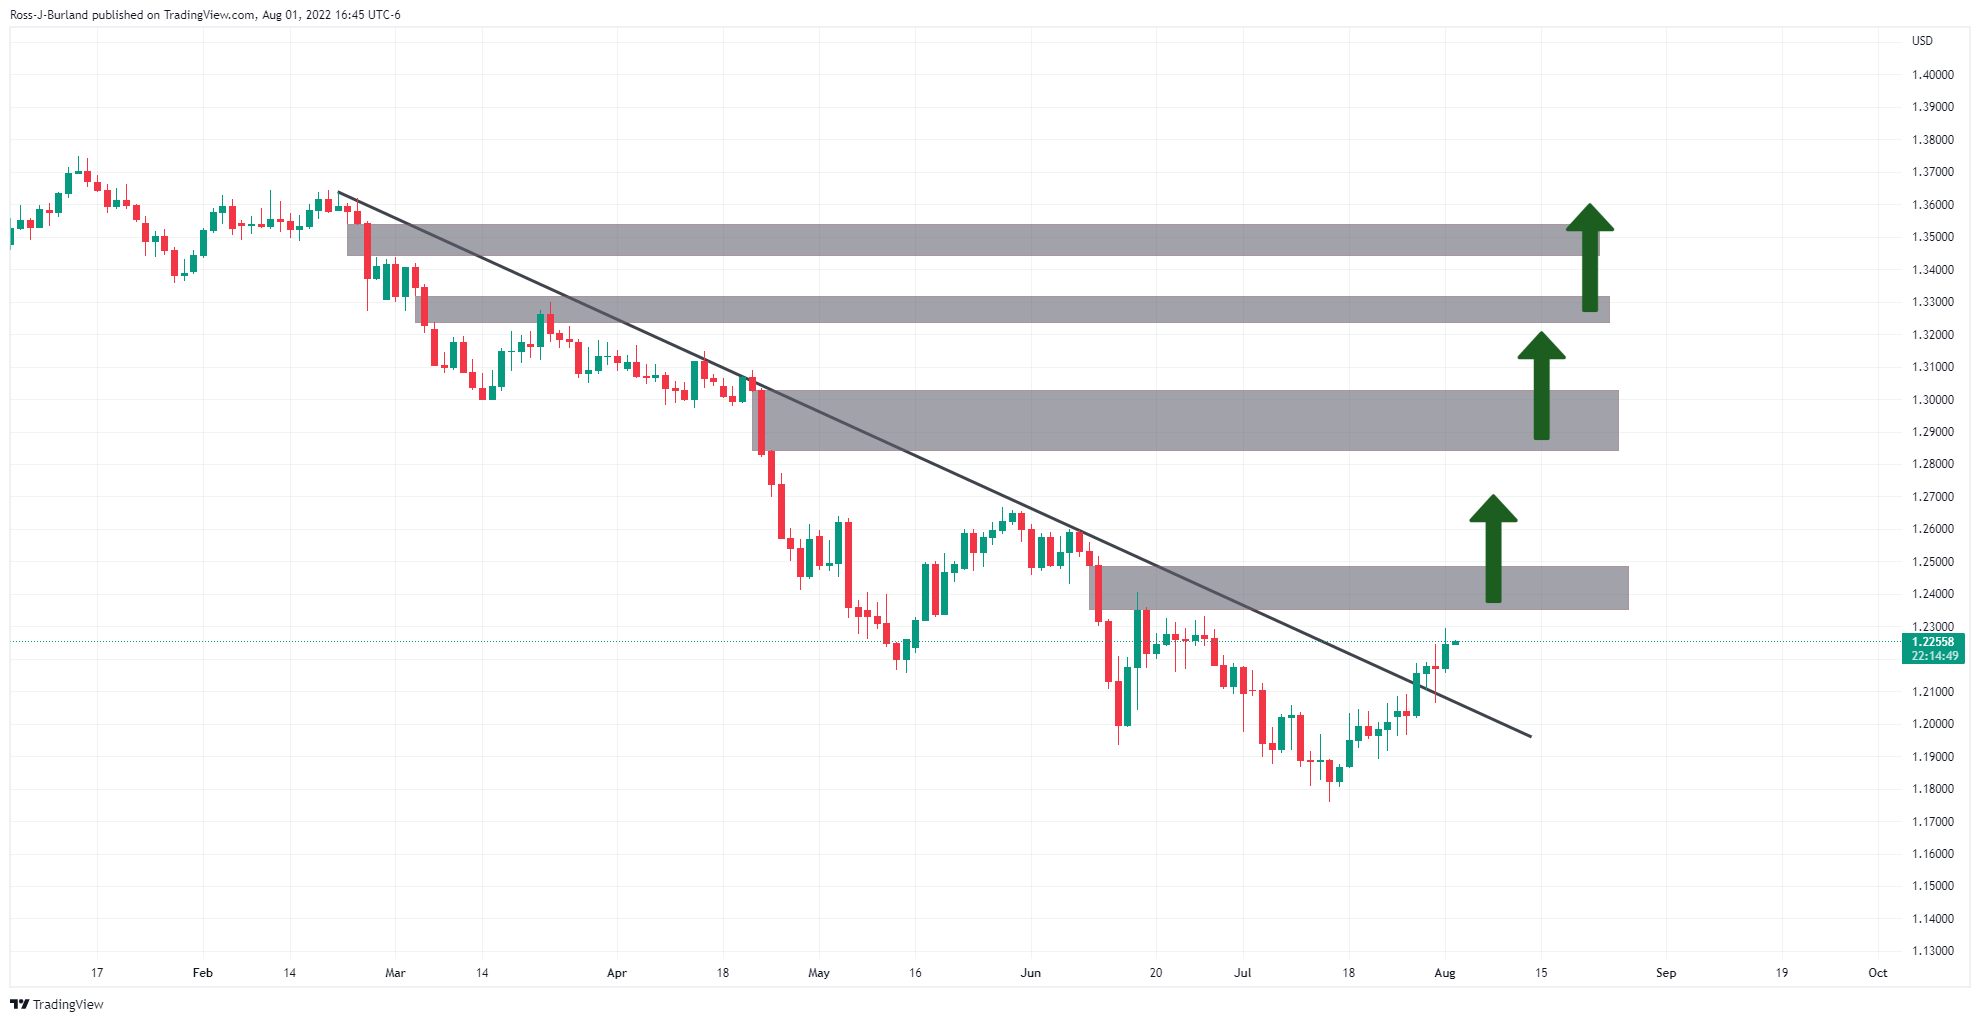
The greyed areas on the daily chart above are areas of price imbalance. The bulls have broken a trendline resistance but are still below the key structure near 1.2380. Until this is broken, a phase of price discovery could play out in a sideways range for the days ahead.
GBP/USD H4 chart
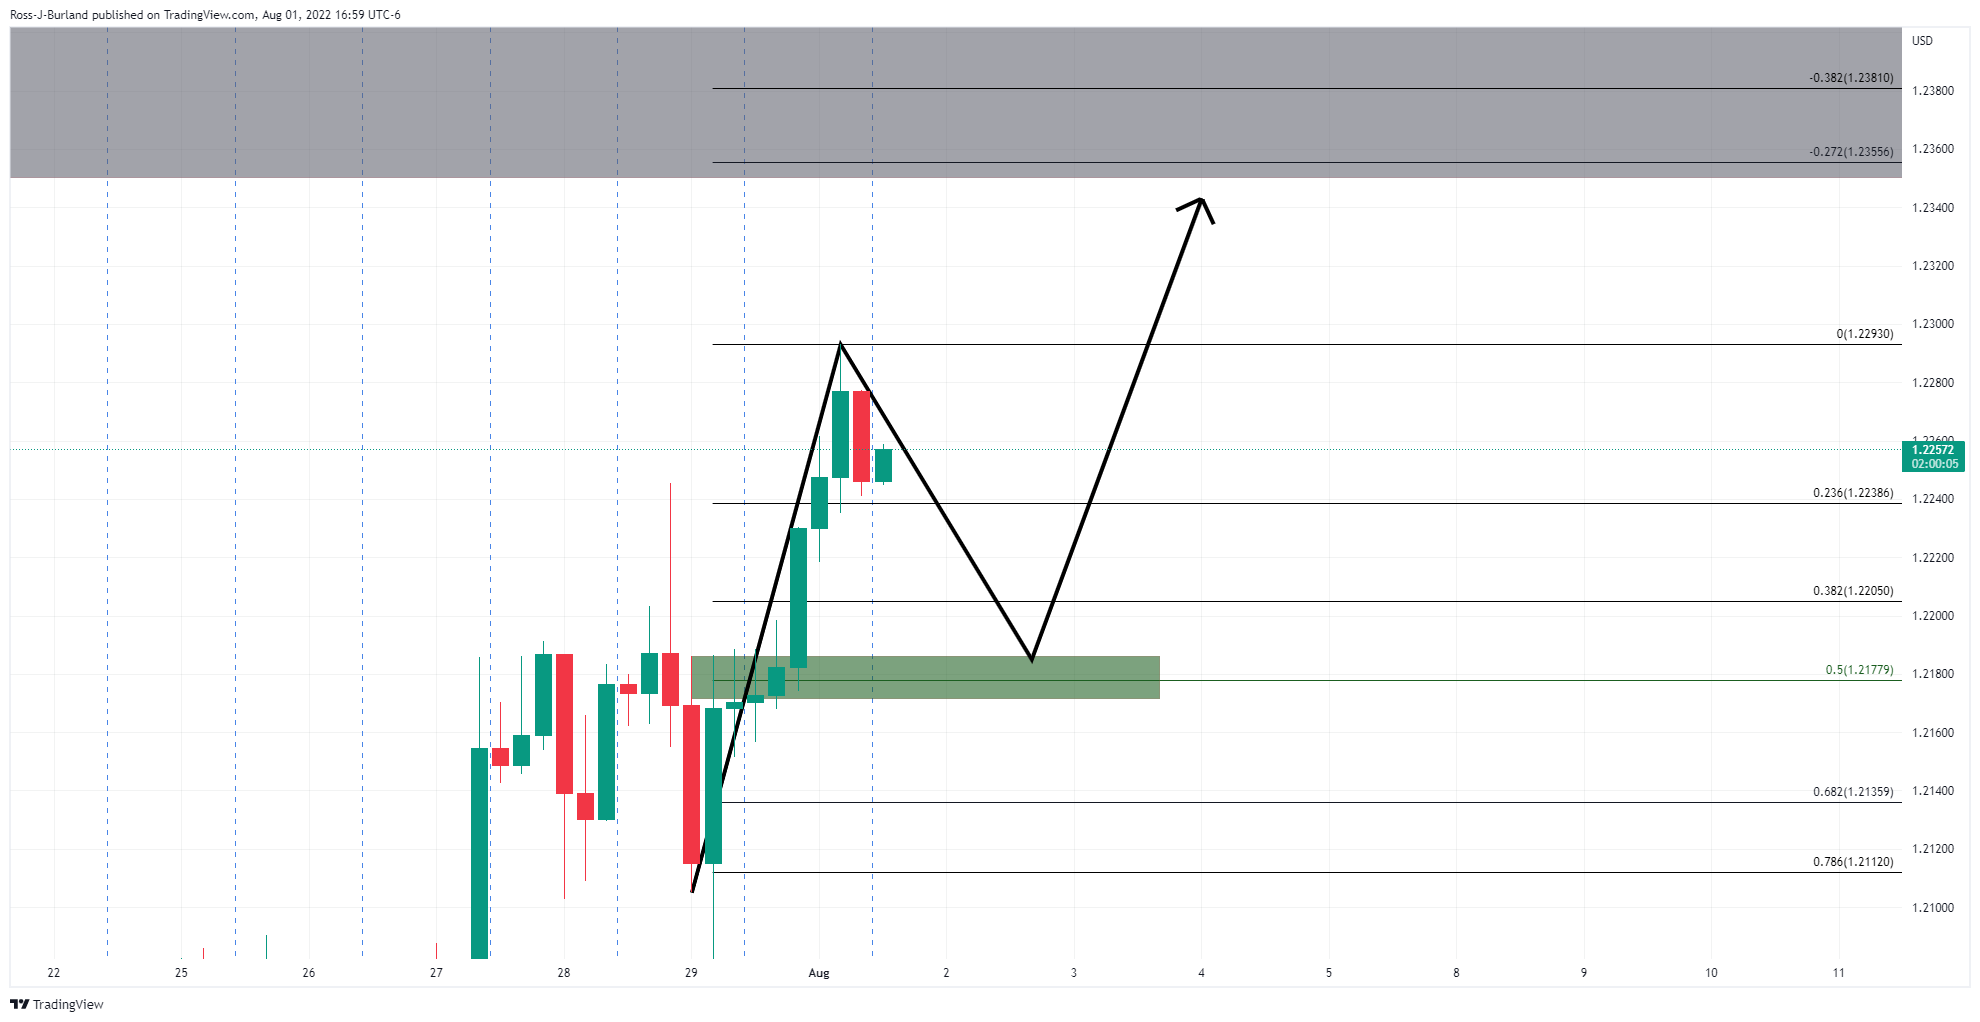
This opens the risk of a correction in the near term and the 50% mean reversion level on the hourly chart aligns with the prior structure near 1.2180.
- Silver price consolidates above $20.00 as the US 10-year bond yield plunges from 3% in the last ten days.
- US ISM PMI remains in the expansionary territory while prices paid by managers tumble.
- Fed’s Kashkari: He will back a 75 bps rate hike if core inflation keeps higher.
Silver price appears to have peaked but finished Monday’s session registering decent gains of 0.17%. The US Dollar weakened on falling US bond yields amidst a dampened mood spurred by increasing tensions between the US and China regarding the visit of US House Speaker Nancy Pelosi to Taiwan. Alongside the aforementioned, US Fed policymakers reiterating the commitment to bringing inflation down turned sentiment sour. At the time of writing, the XAGUSD is trading at $20.34.
Risk-aversion put a lid on XAGUSD prices, as US PMI stays in expansionary territory
US equities finished with losses, while Asian futures are set to open lower. During the North American session, better-than-expected gives the Fed room to operate, as the July ISM PMI reading beat expectations but trailed June’s reading. New orders dropped some, below 50, but it’s worth noticing that the price index component plunged sharply, from 78.50 to 60, as manufacturers began to feel higher interest rates.
In the meantime, the Minnesota Fed President Neil Kashkari commented that he was surprised by the markets’ reaction that the Fed would soon begin to “back off” and said that 50 bps rate hikes at upcoming meetings would be reasonable. He added that higher core inflation readings would push him for another 75 bps increase.
Elsewhere, the US Dollar Index (DXY), a gauge of the buck’s value vs. six currencies, dips to 105.408, down 0.40%, while US Treasuries are tumbling, led by the US 10-year Treasury yield, down at 2.588%.
What to watch
The US calendar will unveil the JOLTs Job Openings, and Fed speaking with Chicago Fed President Charles Evans will cross the wires.
Silver (XAGUSD) Key Technical Levels
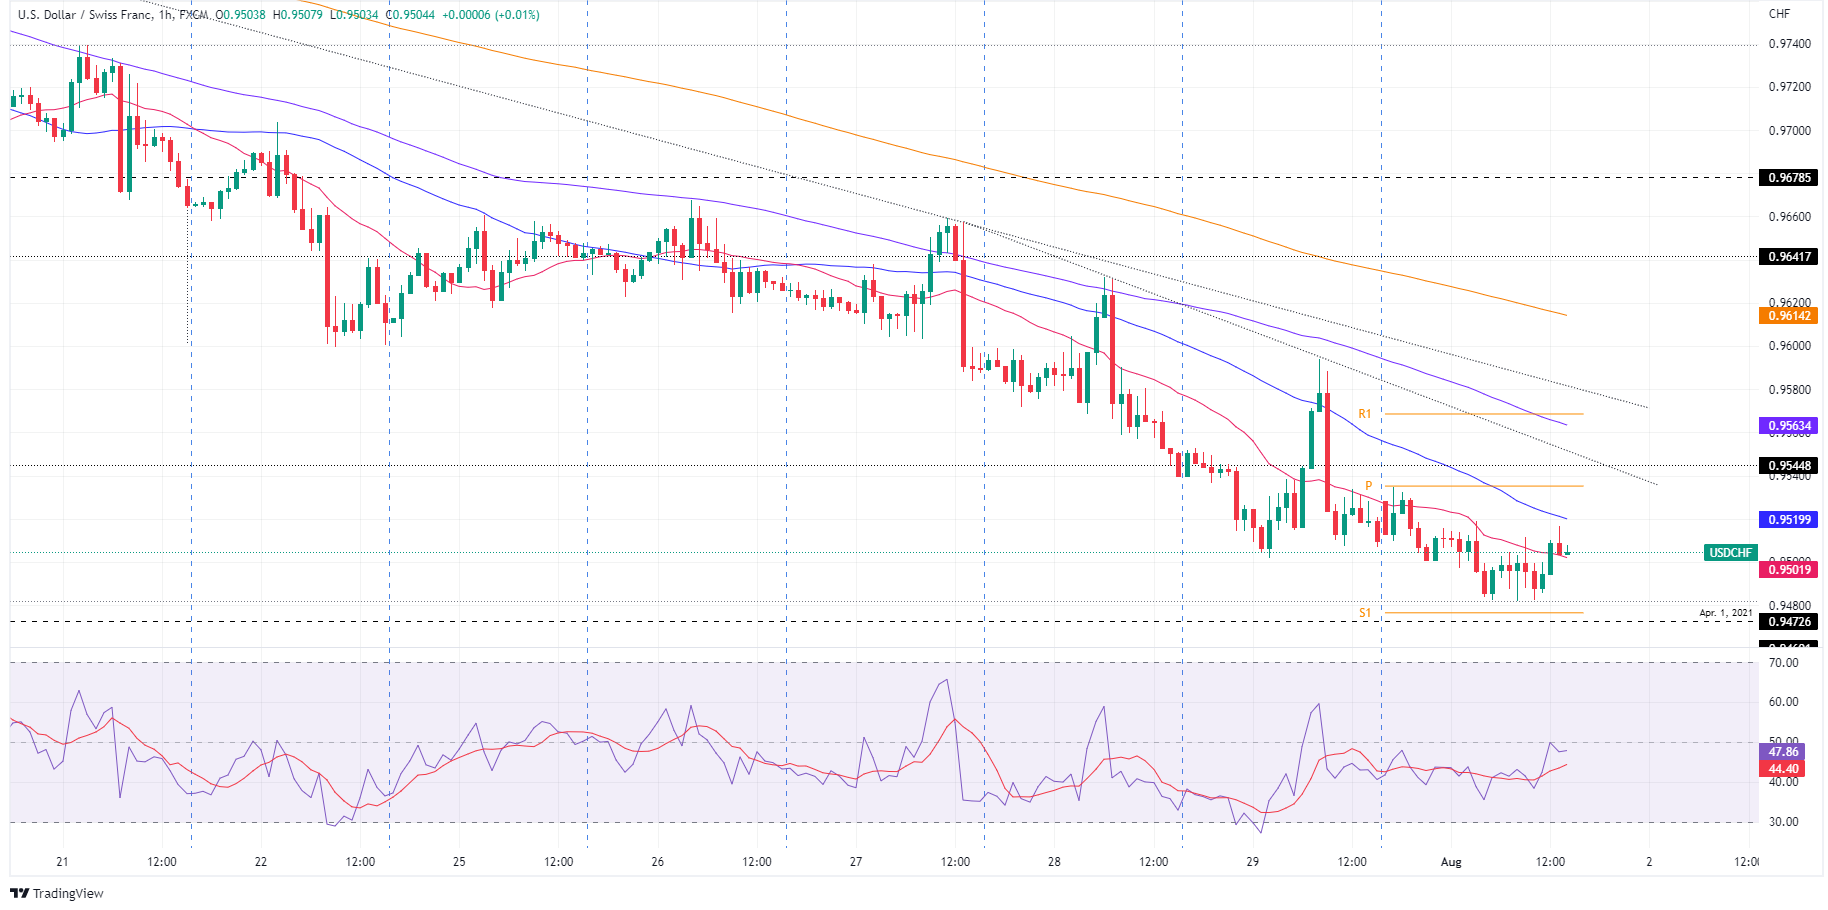
- USD/CHF pauses the five-day downtrend around the lowest levels since late April.
- Market sentiment dwindles amid recession fears and likely fresh Sino-American tussles.
- Second-tier Swiss data, Federal Reserve speakers could entertain traders after Switzerland’s long weekend.
USD/CHF bears take a breather after declining to the lowest levels in 14 weeks the previous day, which also marked the five-day downtrend. That said, the Swiss currency (CHF) pair recently seesaws around 0.9500 as traders await fresh clues as the Swiss traders return from the holiday on Tuesday.
The USD/CHF pair’s recent losses could be linked to the US dollar’s broad weakness amid fears of the “technical recession”, as well as anxiety ahead of Friday’s Nonfarm Payrolls (NFP). However, the recent shift in the market sentiment, due to the expected US-China tussles, appeared to have put a floor under the prices.
US Dollar Index (DXY) refreshed its monthly low, before bouncing off 105.25 on Monday, as fears of economic slowdown joins Fed Chair Jerome Powell’s indirect signals that the hawks are running out of steam. Even so, disappointing statistics from the US and Europe, as well as the Sino-American tensions, might have probed the greenback bears of late.
US ISM Manufacturing PMI dropped to the lowest since 2020 in July as the activity gauge dropped to 52.8 versus 53.0 prior. However, the actual figures were better than the 52.0 market forecast. Also, final readings of the US S&P Manufacturing PMI eased below 52.3 initial estimates to 52.2, compared to 52.7 prior. Furthermore, Germany’s Retail Sales dropped 8.8% YoY in June versus -8.0% market consensus and -3.6% prior.
Elsewhere, Reuters quotes three sources familiar with the matter to mention that US House of Representatives Speaker Nancy Pelosi was set to visit Taiwan on Tuesday as the United States said it wouldn't be intimidated by Chinese threats to never "sit idly by" if she made the trip to the self-ruled island claimed by Beijing.
On the same line was the news suggesting that the US is considering limiting shipments of American chipmaking equipment to memory chip makers in China.
Against this backdrop, Wall Street closed with mild losses while the US 10-year Treasury yields refreshed a four-month low of around 2.58%. That said, the S&P 500 Futures print mild losses of around 4,120 by the press time.
Moving on, the Swiss SECO Consumer Climate Index for three-month to the third quarter (Q3) and SVME Purchasing Managers’ Index for July could entertain traders ahead of speeches from Charles L. Evans, the ninth President and Chief Executive Officer of the Federal Reserve Bank of Chicago, as well as from is the President of the Federal Reserve Bank of St. Louis James Bullard.
Given the recent risk-aversion and a light calendar ahead, USD/CHF may witness lackluster moves heading into the key PMIs and US jobs report.
Technical analysis
Considering the nearly oversold RSI (14), March’s high of 0.9460 appears to be the last defense for the USD/CHF buyers before directing the quote towards the 200-DMA support near 0.9415.
On the contrary, the previous support line, at 0.9605 by the press time, guards the recovery moves of the pair.
- USD/CAD is juggling around 1.2840 as investors await US and Canadian employment data.
- Subdued oil prices on weaker Caixin Manufacturing PMI weakened the Canadian dollar.
- The loonie region may show job additions by 20k against the lay-off of 43.2k jobs in June.
The USD/CAD pair has turned sideways after printing a two-day high of 1.2856 on Monday. In the first trading session of August, the asset displayed a responsive buying action after slipping below the cushion of 1.2790. A responsive buying action drove the asset swiftly higher and greenback bulls are aiming to recapture the weekly high of 1.2900 sooner.
The asset defended the downside break after oil prices plunged on Monday as weaker manufacturing activities triggered oil bears. A subdued performance by the Caixin Manufacturing PMI resulted in a steep fall in the oil prices. The economic data landed at 50.4, lower than the expectations of 51.5 and the prior release of 51.7. It is worth noting that China is the largest consumer of oil in the world and a plunge in Chinese manufacturing activities is sufficient to impact oil prices.
Also, Canada is the leading exporter of oil to the US and a meaningful drop in oil prices strengthened the greenback against the Canadian dollar.
This week, the employment data from the US and Canada is of utmost importance. The US Nonfarm Payrolls (NFP) is seen lower at 250k than the former print of 372k. This has resulted in a downside move in the US dollar index (DXY). The DXY printed a fresh-three-week low at 105.28 on Monday. Also, the US jobless rate is seen unchanged at 3.6%.
On the loonie front, the Net Change in Employment is seen at 20k, while the economy showed a jobless situation in June of 43.2k. The Unemployment Rate may increase to 5% from the prior release of 4.9%.
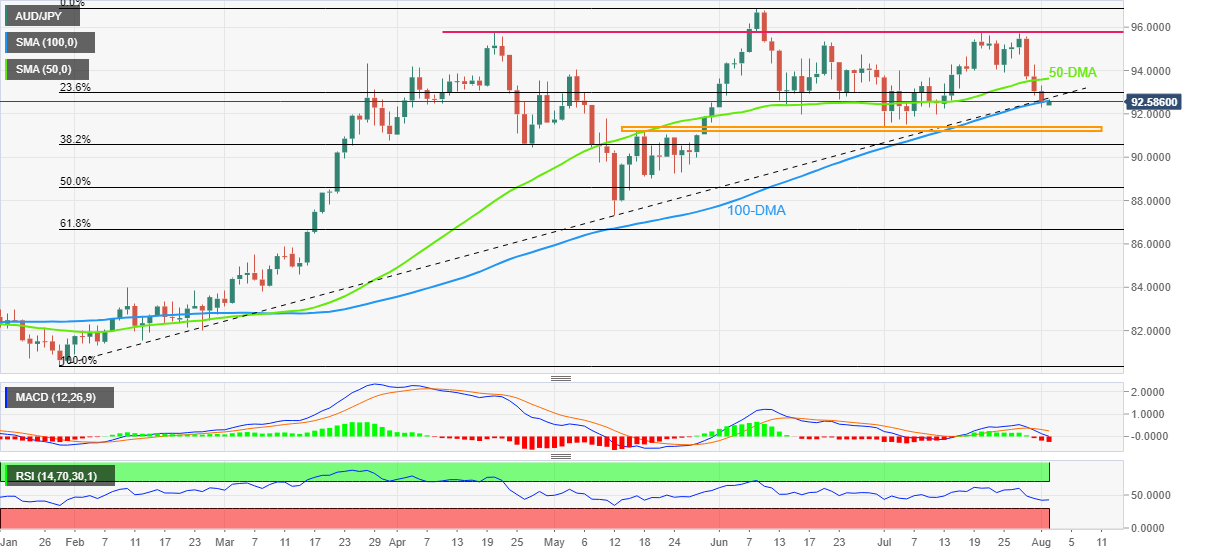
- AUD/JPY holds lower grounds at three-week bottom after breaking 100-DMA, ascending support line from late January.
- Bearish MACD signals, downbeat RSI adds strength to the downside bias.
- 50-DMA adds to the upside filters before directing bulls to key horizontal resistance from April.
- RBA is likely to announce 0.50% rate hike, the fourth consecutive rate increase.
AUD/JPY licks its wounds at the lowest levels in three weeks as traders await the Reserve Bank of Australia’s (RBA) Interest Rate Decision during Tuesday’s Asian session. That said, the quote broke the key 92.65 support confluence on Monday, taking rounds to 92.50-55 of late.
In addition to the clear downside break of the 100-DMA and an upward sloping trend line from early January, the bearish MACD signals and the downbeat RSI (14) also keep AUD/JPY sellers hopeful.
That said, a horizontal area comprising multiple levels marked since mid-May, between 91.15 and 91.45, appears to lure the short-term bears.
However, the quote’s weakness past 91.15 could make it vulnerable to drop towards the 38.2% and 50% Fibonacci retracements of January-June upside, respectively near 90.55 and 88.60.
Alternatively, recovery moves need to stay beyond the support-turned-resistance level surrounding 92.65 to aim for the 50-DMA hurdle surrounding 93.65.
Following that, a horizontal line from April 20, close to 95.70-75, will be in focus.
Overall, AUD/JPY is on the bear’s table even as the RBA is likely to announce the fourth consecutive rate hike.
Also read: AUD/USD bulls take a breather below 0.7050 ahead of RBA Interest Rate Decision
AUD/JPY: Daily chart
Trend: Further weakness expected
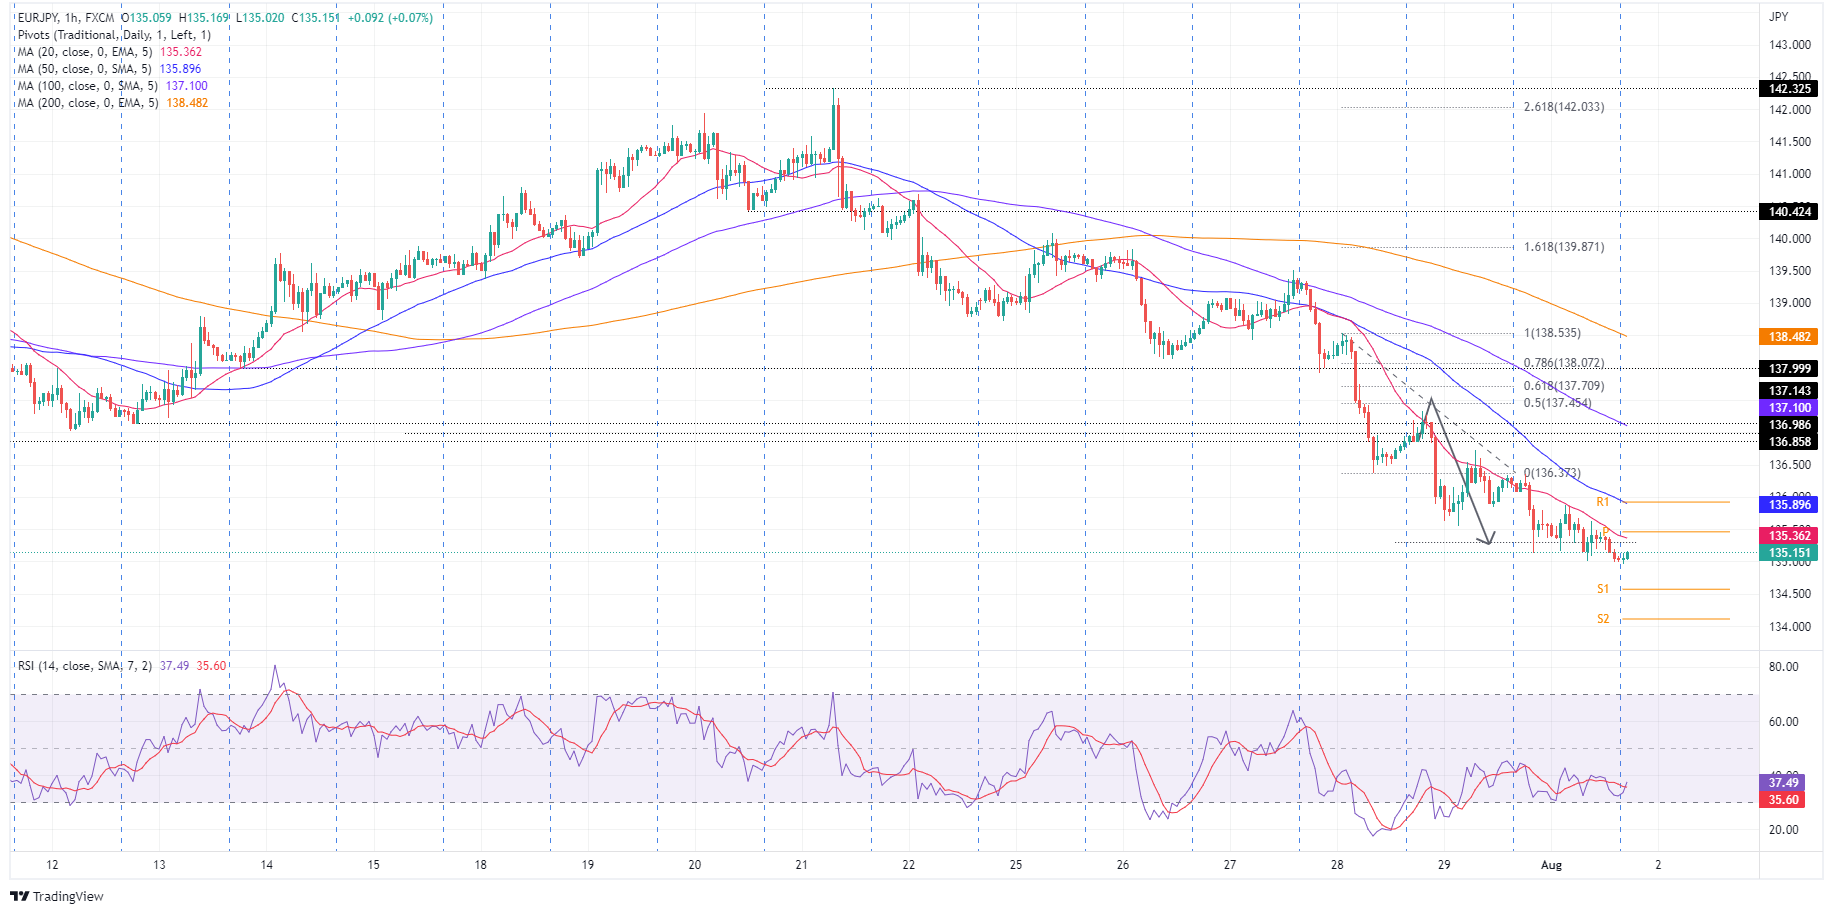
- The shared currency is soft, vs. the Japanese yen, which is staging a comeback against most G10 peers.
- The EUR/JPY daily chart illustrates the pair as neutral-to-downwards, but the downtrend losses steam.
- In the short term, the EUR/JPY might print a leg-up before dipping towards 134.00.
The EUR/JPY creeps lower for the third consecutive day, shifting its bias from neutral to neutral-to-downwards due to heightened tensions between the US and China ahead of the visit of US House Speaker Pelosi to Taiwan. Also, traders scaled back their bets in the US stock market as Fed officials pushed back against a possible “dovish” tilt, while a tranche of policymakers would cross wires on Tuesday. At the time of writing, the EUR/JPY is trading at 135.15.
EUR/JPY Price Analysis: Technical outlook
The EUR/JPY daily chart illustrates the pair as neutral-to-downward biased. Once the EUR/JPY broke below the July 8 daily low at 136.85, it accelerated its dive towards the 135.00 mark. Nevertheless, the EUR/JPY downtrend is on its way to the 200-day EMA at 133.69, but near term, a correction towards the 136.00 figure is on the cards.
EUR/JPY 1-hour chart
In the short term, the EUR/JPY shows that the cross is consolidating around the low 135.00, confirmed by the Relative Strength Index (RSI), trapped within the 30-45 readings. Therefore, EUR/JPY sellers are taking a breather before pushing the pair towards fresh three-month lows, below 134.96. If EUR/JPY bulls step in, the EUR/JPY will challenge the confluence of the 50-hour EMA and the R1 daily pivot at 135.89.
If that play works, the EUR/JPY first support would be 135.00. Break below will expose the S1 daily pivot at 134.57. Once cleared, the next support would be the S2 pivot point at 134.11.
EUR/JPY Key Technical Levels
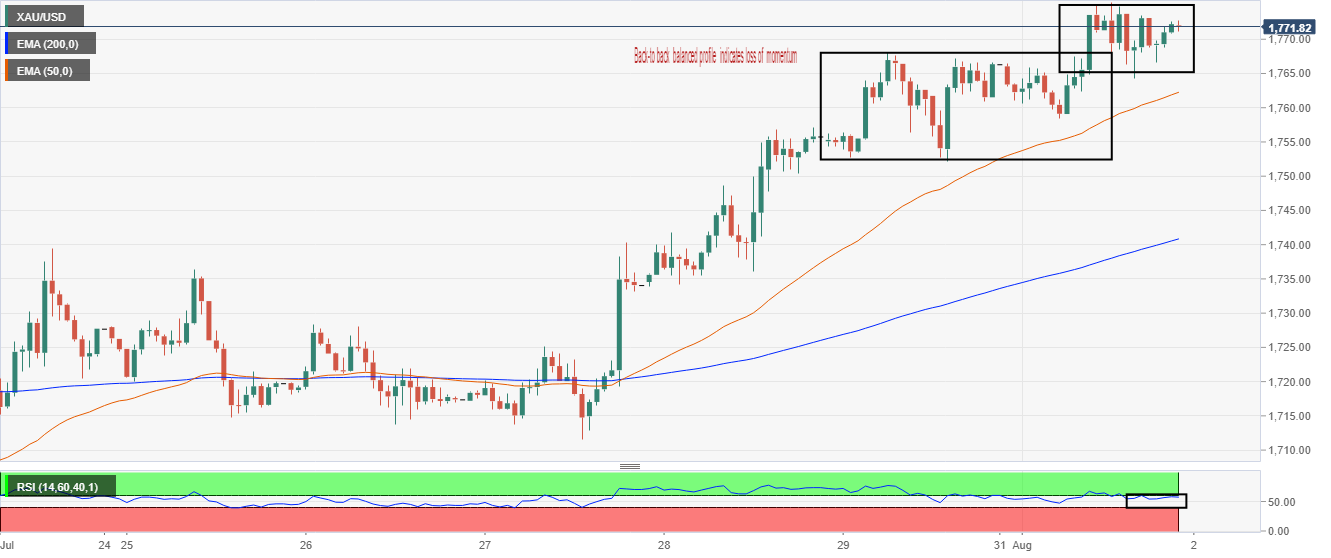
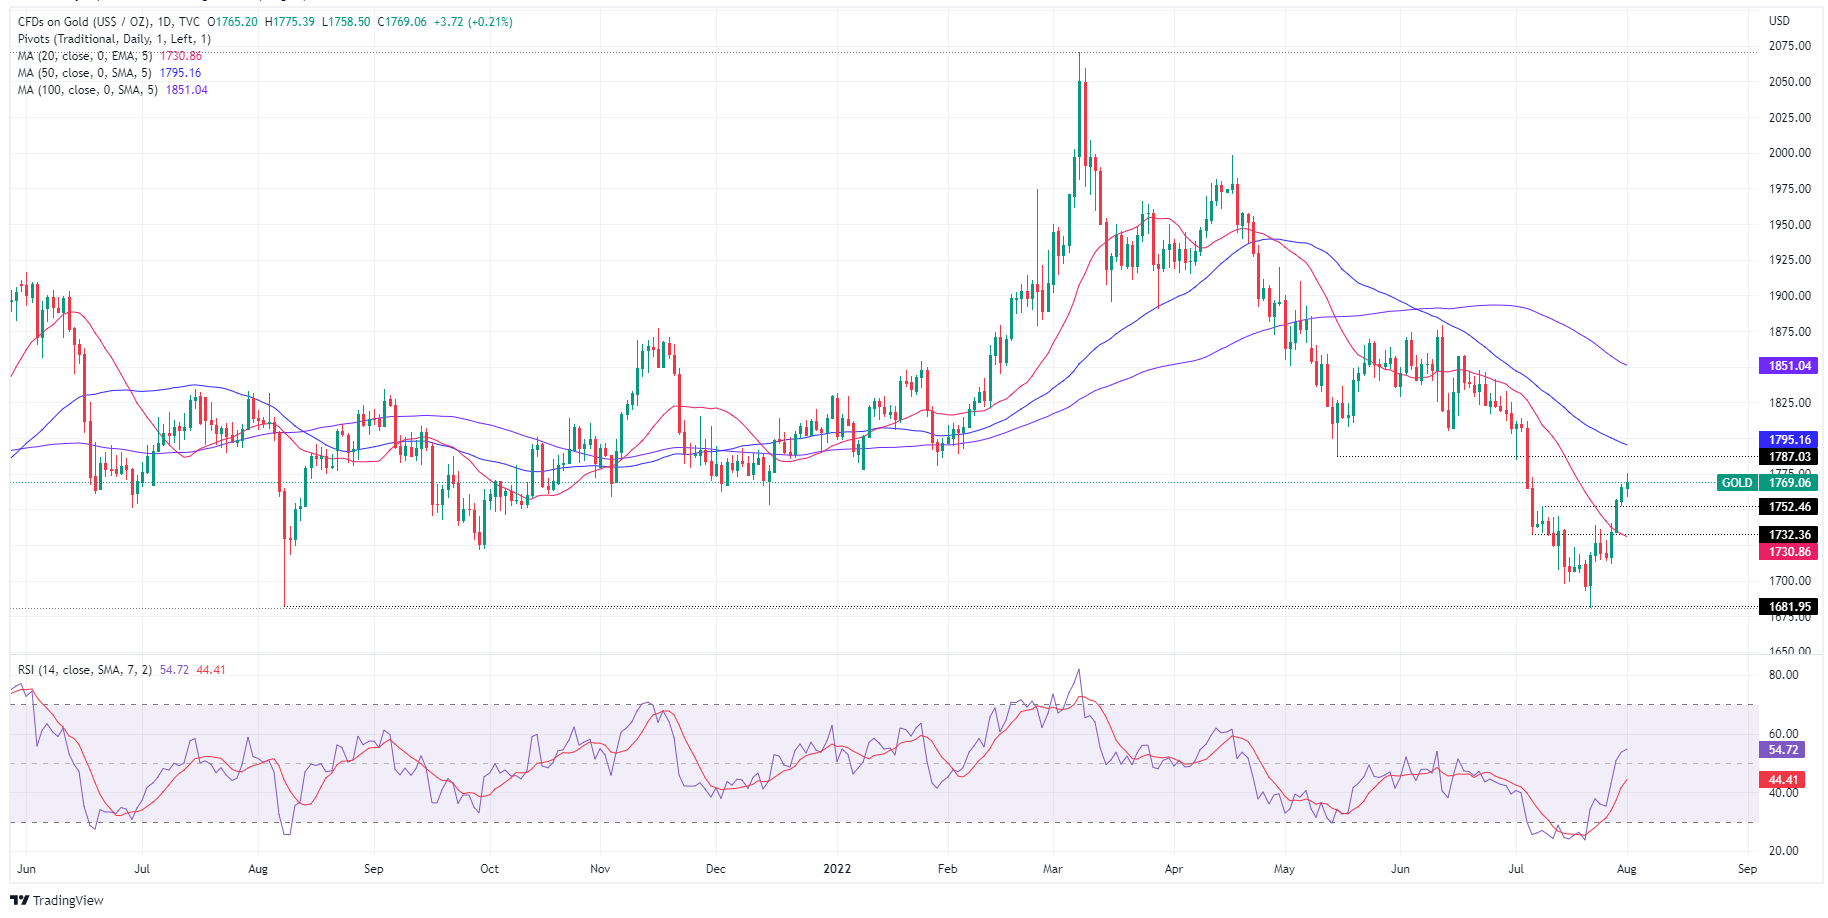
- Gold price is oscillating in a wide range of $1,764.26-1,775.38 as the focus shifts to US NFP.
- Lower consensus for US NFP dragged the DXY to a fresh three-week low around 105.28.
- Fed’s rate hikes have trimmed employment generation in the US labor market.
Gold price (XAU/USD) has advanced towards $1,772.00 after a minor corrective move to near $1,766.67 in the late New York session. Broadly, the asset has turned sideways and is auctioning in a range of $1,764.26-1,775.38. Considering the ongoing upside momentum in the gold price and weakness in the US dollar index (DXY), bulls are expected to establish assets above $1,770.00 first. However, the odds of a decent correction are healthy.
The US dollar index (DXY) is facing the heat of lower consensus for the US Nonfarm Payrolls (NFP), which is due on Friday. The DXY has printed a fresh three-week low at 105.28 as the labor market is likely to display addition of 250k jobs in July, lower than the prior release of 372k.
A meaningful drop in the labor market is highly expected as higher interest rates by the Federal Reserve (Fed) have forced the corporate to levy more filters on investment avenues. Lower investment opportunities tend to keep employment generation in check.
Also, the commentary from big tech firms and automobile companies in their second-quarter earnings announcement indicated that the recruitment process will remain sluggish for the rest of 2022. Therefore, plenty of evidence is warranting lower job additions in July and more sluggishness ahead. This will keep the gold bulls underpinned against the greenback.
Gold technical analysis
On an hourly scale, the gold price is displaying signs of exhaustion after a juggernaut rally. The precious metal has displayed a back-to-back balanced profile around the critical hurdle of $1,770.00. A consecutive balanced profile formation indicates exhaustion of bullish momentum and bolsters the odds of a correction ahead.
The 50-and 200-period Exponential Moving Averages (EMAs) at $1,762.30 and $1,741.00 respectively are still advancing, which favors an upside ahead.
Also, the Relative Strength Index (RSI) (14) has slipped to a 40.00-60.00 range, which indicates that the bulls are not strengthened anymore.
Gold hourly chart
- AUD/USD seesaws near six-week high, fades upside momentum of late.
- Market sentiment dwindles as downbeat PMIs signal recession risk amid pre-NFP caution.
- RBA is expected to announce rate hike worth 0.50%, the fourth so far.
- Aussie housing data, Fedspeak will also be important for clear directions.
AUD/USD portrays the typical pre-event cautious mood while taking rounds to 0.7020-30 ahead of the Reserve Bank of Australia’s (RBA) Interest Rate Decision. In addition to the RBA-linked anxiety, the shift in the market’s sentiment also contributes to the Aussie pair’s inaction around the six-week high during Tuesday’s initial Asian session.
AUD/USD began the week on a front foot, despite China’s downbeat PMIs and mixed data at home. The reason could be linked to the US dollar’s weakness amid fears of “technical recession” and Fed Chair Jerome Powell’s indirect signals that the hawks are running out of steam. However, figures from the US and Europe have been disappointing and backed the economic slowdown fears, which in turn weighed on the risk barometer pair.
That said, China’s official NBS Manufacturing PMIs for July dropped to 49.0 versus 50.4 expected and 50.2 prior whereas Caixin Manufacturing PMI for July eased to 50.4 versus 51.5 expected and 51.7 prior.
At home, Australia’s AiG Performance of Manufacturing Index for July also eased to 52.5 from 54.00. Also, final prints of Australia’s S&P Global Manufacturing PMI confirmed the 55.7 mark but the prior readings were revised upwards to 56.2. That said, the TD Securities Inflation for the Pacific nation also improved during July, up 5.4% YoY versus 4.7% prior.
Elsewhere, US ISM Manufacturing PMI dropped to the lowest since 2020 in July as the activity gauge dropped to 52.8 versus 53.0 prior. However, the actual figures were better than the 52.0 market forecast. Also, final readings of the US S&P Manufacturing PMI eased below 52.3 initial estimates to 52.2, compared to 52.7 prior. Furthermore, Germany’s Retail Sales dropped 8.8% YoY in June versus -8.0% market consensus and -3.6% prior.
It should be noted that the fresh Sino-American tussles over Taiwan join Friday’s hawkish comments from Minneapolis Fed President Neil Kashkari and a firmer print of the Fed’s preferred inflation gauge to also exert downside pressure on the AUD/USD prices.
Amid these plays, Wall Street closed with mild losses while the US 10-year Treasury yields refreshed a four-month low of around 2.58%.
Moving on, the RBA is expected to announce the fourth rate hike and is likely to favor buyers with the 50 basis points (bps) of a lift to the benchmark rate. However, a recently downbeat economic forecast from the Aussie Treasury and the looming fears of a recession could probe the policymakers to be alert for the next move, which in turn might trigger the AUD/USD pair’s pullback if marked.
Also read: Reserve Bank of Australia Preview: How aggressive can it be?
Technical analysis
Although the 100-day EMA challenges AUD/USD bulls around 0.7050, the pair’s downside remains challenged by the previous resistance line from April, around 0.6910 at the latest.
- EUR/USD is sensing barricades around 1.0260 as estimates for Eurozone Retail Sales shift lower.
- The DXY has hit a fresh three-week low as the recruitment process seems vulnerable in July.
- Eurozone's stable jobless rate may remain a hurdle for the ECB in hiking interest rates.
The EUR/USD pair has failed to violate the immediate hurdle of 1.0260 as investors are discounting an expected underperformance from the Eurozone Retail Sales data. The shared currency bulls seem to lack strength as the pair has been unable to perform despite broader weakness in the US dollar index (DXY).
A preliminary estimate for the Eurozone Retail Sales is -1.7%, extremely lower than the prior release of 0.2%. It is worth noting that households in Europe are facing the headwinds of higher price pressures, which are forcing them to higher consumption expenditure despite a minor change in quantity purchased. Therefore, the Retail Sales data should be higher. And, a lower estimate for the economic demand indicates a serious fall in the retail demand.
Also, the unchanged Unemployment Rate is going to act as a major hurdle for the European Central Bank (ECB) while brainstorming for a rate hike. Investors should be informed that Eurostat released the jobless rate at 6.6%, in line with the expectations and the prior release.
On the dollar front, the US dollar index (DXY) printed a fresh three-week low of 105.28 on Monday. The DXY extended its losses as investors have started punishing the DXY on expectations of weak US Nonfarm Payrolls (NFP) data. As per the market expectations, the US economy has managed 250k job additions in the labor force in July. Many US big tech companies have ditched the recruitment process for a while, whose multiplier effects could be witnessed in the payrolls data.
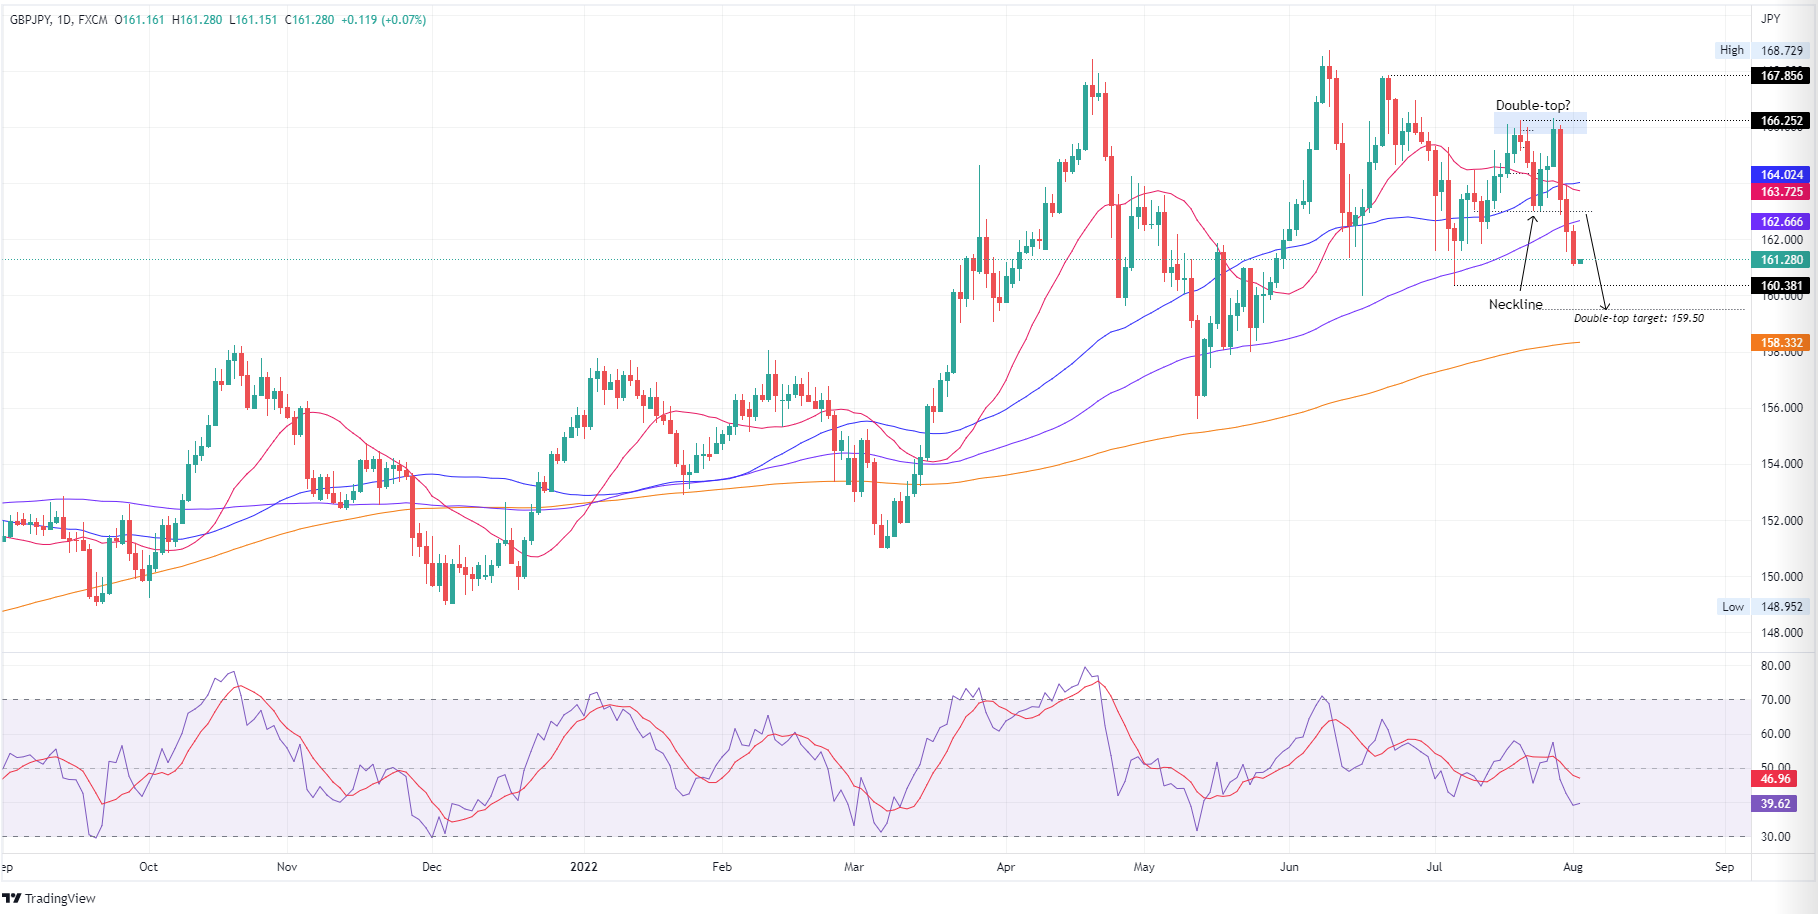
- The British pound weakens vs. the Japanese yen and drops 0.69%.
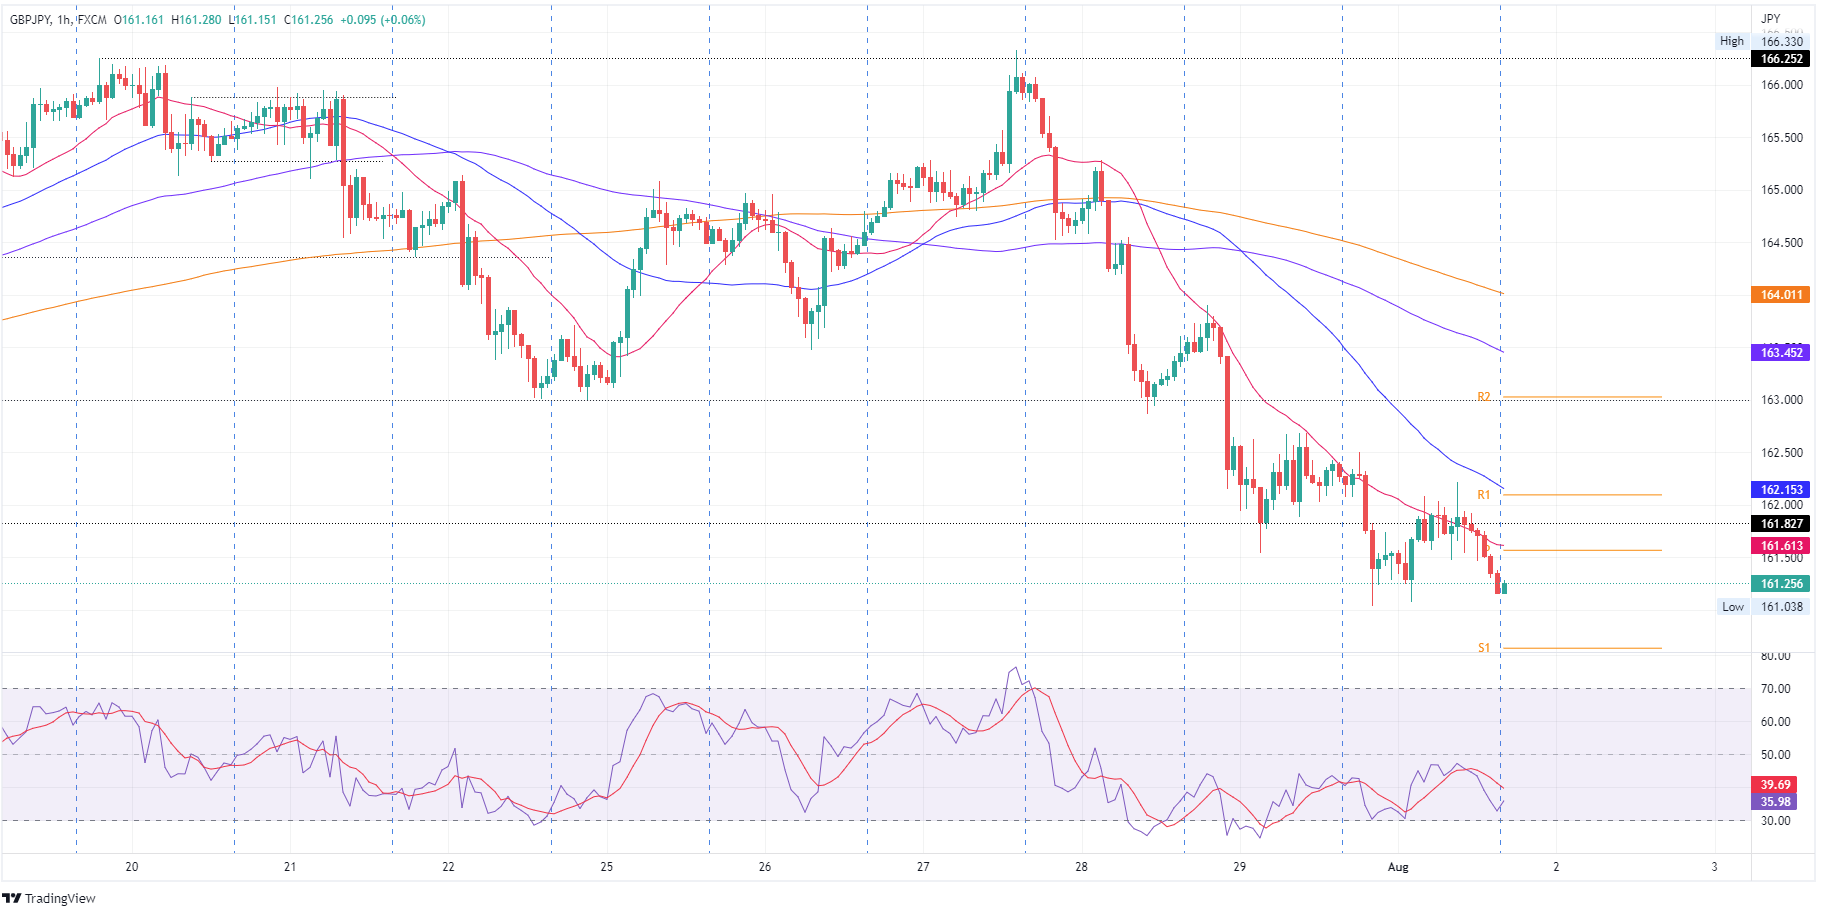
- The GBP/JPY daily chart illustrates the double-tops stays in play, and the exchange rate is about to reach its target.
- In the near term, the GBP/JPY might correct to 161.61 before nose-diving towards the double-top target at 159.50.
The GBP/JPY sinks for the third straight day, and the cross-currency pair accelerates towards the double-top price target at 159.50. At 161.25, the GBP/JPY reflects a dampened market mood, spurred by Fed policymakers led by Minnesota’s Fed President Kashkari, who pushed back against a Fed “dovish” tilt and opened the door for further tightening. That, alongside geopolitical tensions between the US and China, arising as the US House Speaker Nancy Pelosi could visit Taiwan.
GBP/JPY Price Analysis: Technical outlook
The GBP/JPY daily chart depicts the pair as neutral-to-downward biased. Break below 163.00, the double-top “neckline” exacerbated the fall, and on its way down, the GBP/JPY cleared the 20, 50, and 100-day EMAs. Traders should notice that the Relative Strength Index (RSI) is in negative territory and with enough room to spare before reaching oversold conditions. Therefore, a move towards the double-top target at 159.50 is on the cards, but firstly, GBP/JPY sellers need to clear the July 6 swing low at 160.38.
GBP/JPY 1-hour chart
In the near term, the GBP/JPY hourly chart illustrates the pair as neutral-to-downward biased, but risks are skewed to the upside. Be aware that the Relative Strength Index (RSI) at 36.72 aims to cross over the 7-hour RSI’s SMA, which could lift the pair, at least towards the confluence of the daily pivot and the 20-hour EMA at 161.61. Nevertheless, failure to do so, the GBP/JPY could dip below the 161.00 mark, towards the 160.00 figure, ahead of the double-top target at 159.50.
GBP/JPY Key Technical Levels
- NZD/USD bulls eye a deeper correction for the session ahead.
- The US dollar is on the back foot as markets weigh the Fed.
NZD/USD is up on the day trading higher by 0.67% after correcting a significant amount of the prior bearish impulse. The pair initially fell from a high of 0.6352 to a low of 0.6275 but a weaker greenback leaves the bulls in play for the final hours of the US session.
Investors are weighing the likelihood that the Federal Reserve will not raise interest rates as aggressively as some had expected following last week's dovish outcome at the Fed meeting.
WIRP suggests a 50 bp hike on September 21 is fully priced in, with 30% odds of a larger 75 bp move, analysts at Brown Brothers Harriman explained. ''The swaps market is now pricing in 100 bp of tightening over the next 6 months that would see the Fed Funds rate peak near 3.50%, followed by 50 bp of easing over the subsequent 6 months. We cannot believe that the Fed would make such a quick pivot with inflation still well above target and the labour market at full employment.''
The analysts also think that Fed officials will push back against the market’s dovish take on its decision. ''With the media blackout over, prepare for more Fed comments that tilt decidedly hawkish. Evans, Mester, and Bullard speak Tuesday. Mester speaks again Thursday.''
The analysts also noted that, over the weekend, uber-dove Kashkari reiterated that the Fed is focused on lower inflation, noting that “we are committed to bringing inflation down and we’re going to do what we need to do. We are a long way away from achieving an economy that is back at 2% inflation, and that’s where we need to get to.”
Meanwhile, the rest of this week in the US will be focused on Nonfarm Payrolls as well as JOLTS.'' With the Fed focused on the labour market, any signs of a turning point may see the market further unwind Fed pricing further, causing more DXY weakness,'' analysts at ANZ Bank said.
NZD/USD technical analysis
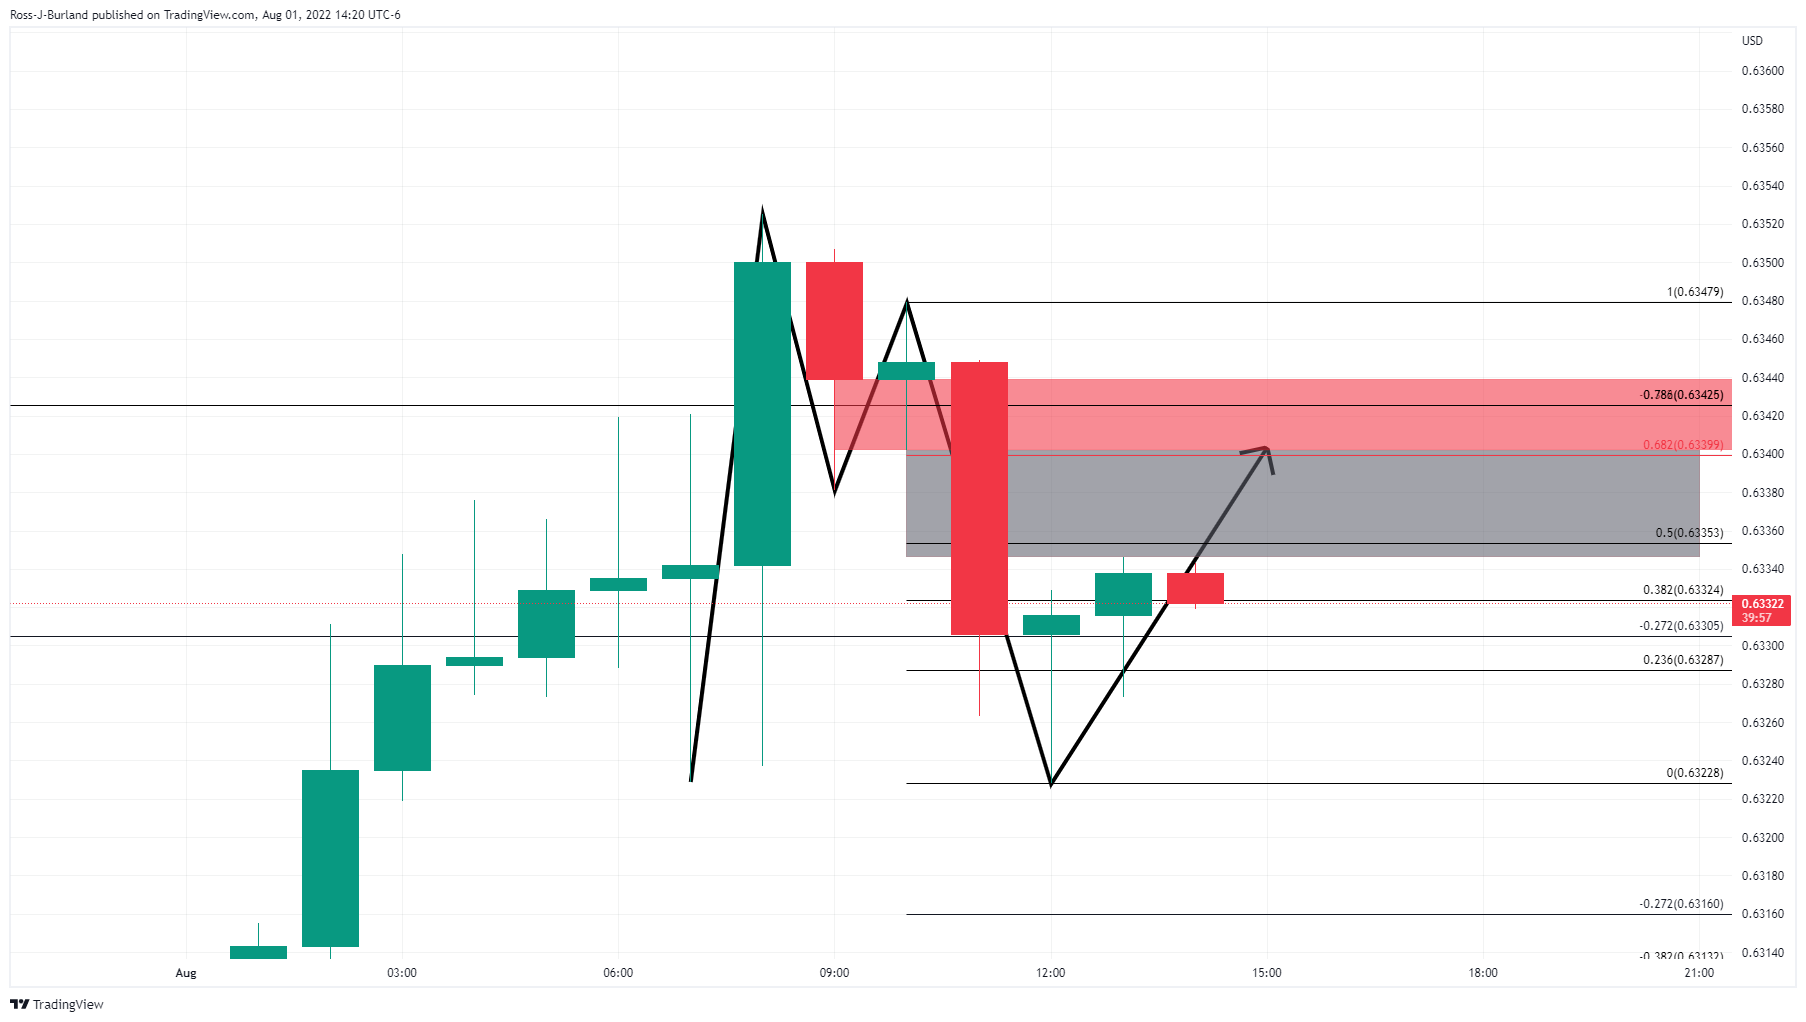
The hourly M-formation is playing out with the bulls pushing towards the neckline of the formation and an area of price imbalance, the greyed area, between 0.6340 and 0.6347 that guards the neckline of the pattern and resistance.
What you need to take care of on Tuesday, August 2:
The greenback edged lower on Monday, although the slide pared mid-US session as Wall Street lost its earnings-inspired strength and lost some ground. Market participants remained focused on the risk of a global recession.
At the beginning of the day, China published the official NBS Manufacturing PMI, which contracted to 49 in July, worse than anticipated, while the services index came in better than expected, improving to 53.8. Also, S&P Global downwardly revised its Manufacturing PMIs for some European countries and the US.
The US July ISM Manufacturing PMI fell by less than anticipated, down from 53 in June to 52.8. A sharp drop in prices paid hints at easing inflationary pressures, but new orders also contracted, according to ISM, in line with increased risks of a recession.
The yield on the 10-year US Treasury note ticked lower and is currently around 2.59%, while the 2-year note yields 2.89%, unchanged for the day.
The EUR/USD pair neared the 1.0280 area again, finishing the day at 1.0255. GBP/USD extended gains beyond 1.2200, now changing hands at 1.2250. The AUD/USD pair trades above 0.7000 as market players await the RBA monetary policy decision. The central bank is widely anticipated to hike rates by 50 bps, although it is unclear if they can hike by more or less.
USD/CAD surged amid lower oil prices, ending the day at 1.2845. Crude oil prices edged lower, losing roughly 4% on Monday amid fears of easing demand, following weaker than expected Chinese figures released at the beginning of the day. WTI settled at $93.80 a barrel.
Gold continued to advance, reaching an intraday high of $1,775.43 a troy ounce, trading nearby early in the Asian session.
Safe-haven currencies advanced against the greenback. USD/CHF trades around 0.9500 while USD/JPY ended the day at 131.65.
Bitcoin Price Prediction: “Anything too clean is probably dirty”
Like this article? Help us with some feedback by answering this survey:
- USD/CAD near-term price action is corrective and bullish.
- Bulls eye the 1.2880 area that resides in an area of the imbalance of price.
USD/CAD finds itself at a crossroads on the daily and hourly chart with a meanwhile bias to the upside on the shorter-term time frame but poised for a bearish extension on the daily chart. When taking into account that speculators’ CAD net long positions remain well below recent highs along with the recent break of daily support structure, the bias remains firmly in the hands of the bears.
USD/CAD daily chart
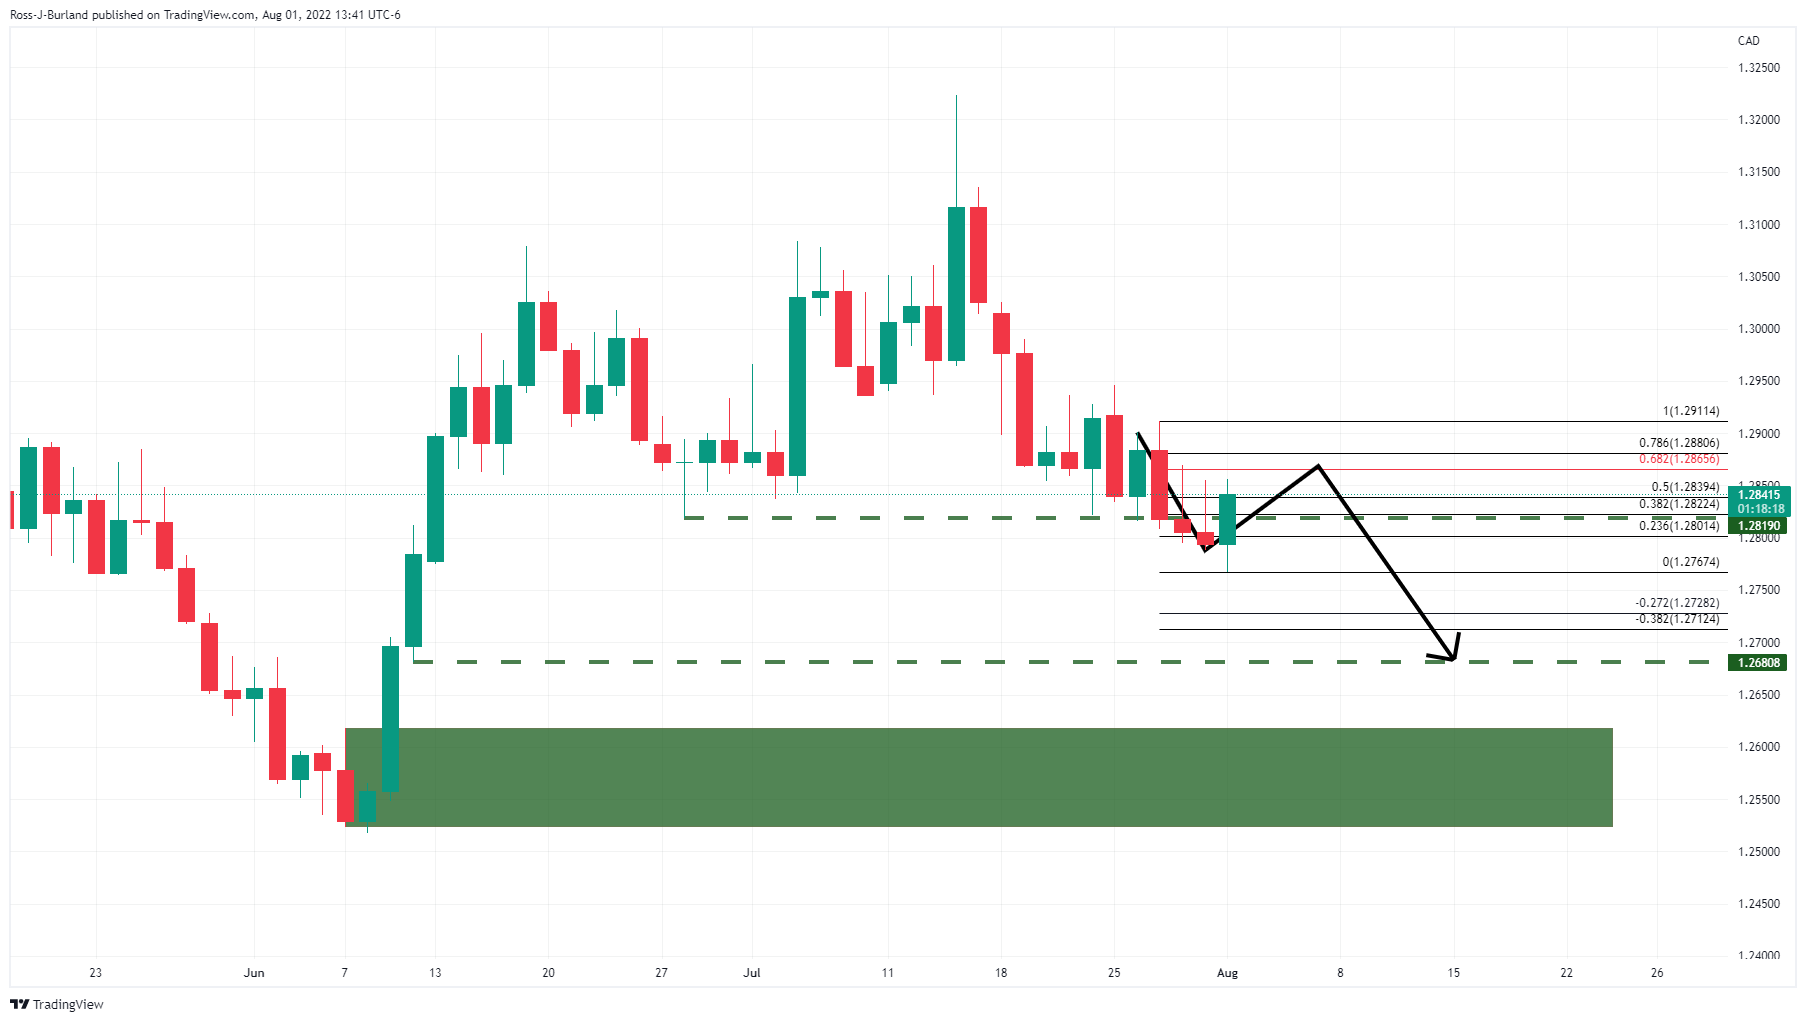
The daily chart's support structure near 1.2820 has been pierced in a firm bearish impulse that took the price down to 1.2770 before it corrected at the start of the week. However, so long as the 1.2900 area remains intact, the focus is on the downside with 1.26 and below eyed.
USD/CAD H1 chart
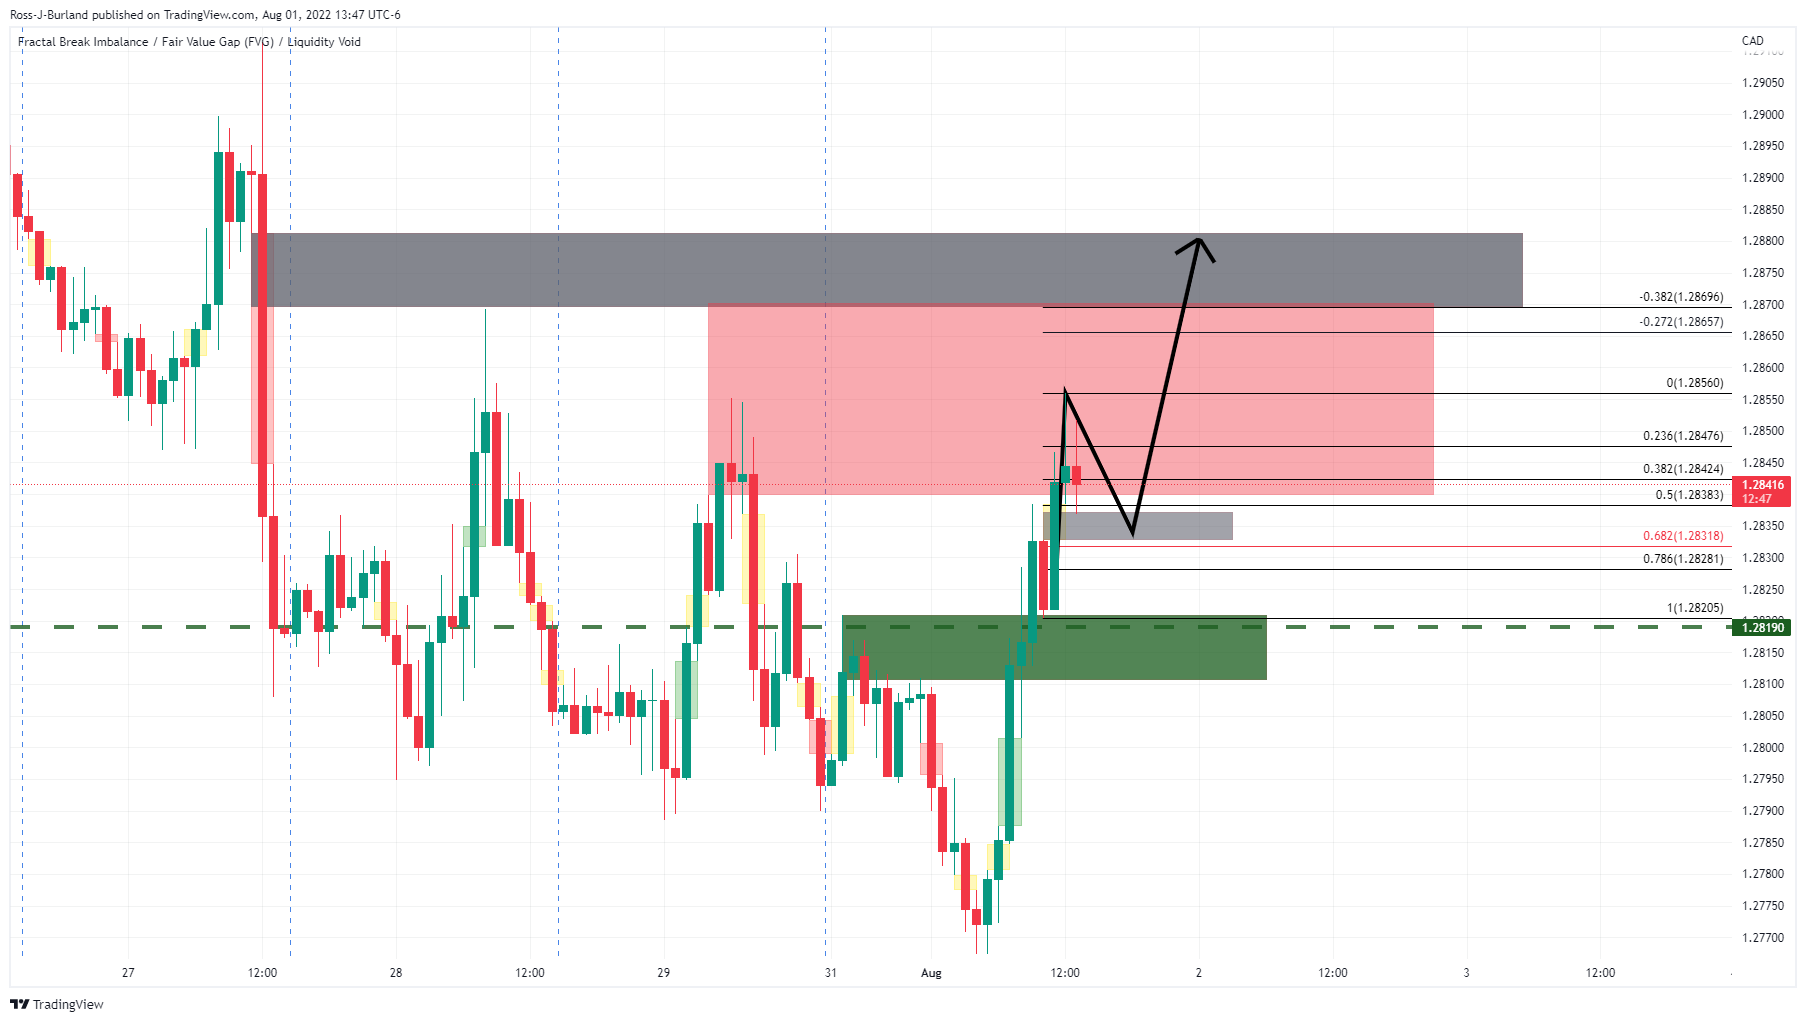
Meanwhile, the near-term price action is corrective and bullish. 1.2880 resides in an area of the imbalance of price which could be mitigated in the coming sessions so long as 1.2820 holds up against any bearish meanwhile pressures.
- The Swiss franc strengthens vs. the greenback due to pessimistic investors’ mood, weighing on the US dollar.
- A break below 0.9495 would send the USD/CHF to the 200-day EMA.
- In the hourly chart, the USD/CHF might correct towards 0.9519-35 before testing the June lows around 0.9495.
The USD/CHF dwindles on Monday, for the fifth consecutive day, down 0.05%, as trader’s sentiment shifted sour, as Fed officials pushed back against a “dovish” tilt, while the US manufacturing slowed down but remained in expansionary territory, keeping Fed hopes of a “soft landing” alive. At the time of writing, the USD/CHF is trading at 0.9508.
USD/CHF Price Analysis: Technical outlook
The USD/CHF is neutral-to-downward biased after sliding below the 20, 50, and 100-day EMAs. Nevertheless, to further strengthen the bias, USD/CHF sellers need to reclaim the June 29 low at 0.9495, which, once cleared, would pave the way for further losses. If that scenario plays out, USD/CHF traders should expect a fall towards the 200-day EMA at 0.9410. On the other hand, an impulse towards 0.9600 is on the cards.
USD/CHF 1-hour chart
The USD/CHF is downward biased and about to plunge below the 20-hour EMA at 0.9502. The Relative Strength Index (RSI) at 48.68 is in bearish territory, but as it aims higher, that might propel the USD/CHF exchange rate to the 50-hour EMA at 0.9519, or the daily pivot at 0.9535, before resuming downwards.
Therefore, the USD/CHF first support would be the June 29 daily low at 0.9495. Once cleared, the next USD/CHF support will be the S1 daily pivots at 0.9476, followed by the S2 pivot at 0.9443.
USD/CHF Key Technical Levels
- USD/JPY is under pressure despite a softer US dollar.
- Yen is picking up a safe haven bid as traders look ahead to key US data.
At 131.95, USD/JPY is down 0.93% and sinking from a high of 133.55 while printing a low of 131.59, the lowest level since mid-June. The pair was down from a late 1998 peak of nearly 140 yen which it hit last month.
The US dollar has been offered and weighed by the likelihood that the Federal Reserve will not raise interest rates as aggressively as some had expected. Since the meeting, growth numbers showed that the US economy contracted in Q2 for the second straight quarter, which is a textbook definition of a recession. Core PCE data for June and ECI data for Q2 showed price and wage inflation remain elevated and are a reminder that the Fed still has much to do.
The US dollar index (DXY) had been volatile after data showed US manufacturing activity slowed less than expected in July. This comes ahead of a key report for investors this week that will be Nonfarm Payrolls Friday. US employment likely continued to advance firmly in July, analysts at TD Securities said, but at a more moderate pace after four consecutive job gains at just below 400k in March-June. ''High-frequency data, including Homebase, still point to above-trend job creation. We also look for the UE rate to stay at 3.6% for a fifth straight month, and for wage growth to remain steady at 0.3% MoM (4.9% YoY).''
Meanwhile, JPY net short positions moved higher. In the spot market, the JPY has recovered some ground. ''Expectations of higher wage inflation are keeping alive speculation that the BoJ could adjust its YCC policy in the foreseeable future. Safe haven demand has also been JP supportive,'' analysts at Rabobank said. Safe haven inflows have also lent the JPY support recently vs the greenback. Nevertheless, Japan’s current account position which has been undermined by expensive energy imports this year. The current firmer position of the JPY shifts the lime-light from Bank of Japan policies.
- Gold price advances on falling US Treasury yields and US dollar weakness.
- US equities rise, despite cooling manufacturing data, illustrating Fed actions are being felt.
- Fed policymakers pushed back against a “dovish” tilt, per the market’s reaction.
- Gold Price Forecast (XAUUSD): If buyers reclaim $1800, the bias shift to neutral-upwards; otherwise, a leg down to $1730 is viable.
Gold price climbs for the fourth consecutive day, extending its ongoing recovery. The US dollar remains heavy, undermined by falling US Treasury yields, as investors assessed that the Federal Reserve might hike rates, but not as aggressive as expected. At the time of writing, XAUUSD is trading at $1771.15, up 0.32%.
US ISM held stubbornly to expansionary territory, price index down from 78.5 to 60
European and US equities fluctuate, reflecting a fragile sentiment. Meanwhile, tensions between China and the US, with US House Speaker Pelosi visiting Taiwan, increased military activity on China’s side. That dragged European equities lower, while traders are optimistic that the Fed’s “dovish” pivot, as perceived by the markets, was reinforced by weaker US ISM PMI readings.
The Institute for Supply Management (ISM) reported that July’s Manufacturing PMI clung to expansionary territory, beating the estimations. Nevertheless, it trailed June’s reading, while some components, like new orders, dropped while the price index plunged, showing signs that higher interest rates are beginning to be felt.
In the meantime, the Minnesota Fed President Neil Kashkari commented that he was surprised by the markets’ reaction that the Fed would soon begin to “back off” and said that 50 bps rate hikes at upcoming meetings would be reasonable. He added that higher core inflation readings would push him for another 75 bps increase.
All that said, XAUUSD prices soared to fresh four-week highs around $1775.39, bolstered by broad US dollar weakness. The US Dollar Index (DXY), a gauge of the buck’s value vs. six currencies, falls towards 105.427, down 0.38%, undermined by US Treasuries tumbling across the yield curve. Additionally, real yields, as depicted by the US 10-year Treasury Inflation-Protected Securities (TIPS) bond yield, sit at 0.109%, down from YTD highs of 0.893%, a headwind for higher gold prices.
What to watch
The US calendar will unveil the JOLTs Job Openings, and Fed speaking with Chicago Fed President Charles Evans will cross the wires.
Gold Price Forecast (XAUUSD): Technical outlook
XAUUSD is still neutral biased, despite rising above the $1750 figure, as buyers set their eyes to May’s 16 low shifted resistance at $1787.03. If gold buyers reclaim the previously mentioned, that will open the door for a test of the 100-day EMA at $1795.16, followed by the $1800 mark. A breach of the latter would shit the bias to neutral upwards. Otherwise, failure to do so, a XAUUSD correction towards the 20-day EMA at $1730.84 is on the cards.
- GBP/USD bulls settle back near 1.2250 but keep charge.
- The US dollar is weighed following dialled-down Fed monetary policy.
GBP/USD is trading at 1.2254 and higher on the day on a weaker US dollar after the Federal Reserve meeting on Wednesday and a statement that left the futures markets tied to Fed policy expectations tilted towards a more moderate increase for the next meeting.
Domestically, there has been no UK data but investors are second-guessing the Bank of England's next move. The central bank meets on August 4. and markets are pricing the central bank to continue its tightening cycle with the possibility of a larger 50-bp increase.
Nevertheless, doused in political and economic woes, the pound has been one of the laggards this year despite The Old Lady out of the traps with policy tightening relatively early. Net short GBP positions edged lower for a second week with the market expecting more rate rises in the offing if Truss becomes the next UK PM in view of her tax-cutting agenda. Nevertheless, the poor outlook for growth in the UK remains a significant concern for speculators.
''GBP has been trading under a cloud of negative sentiment for large swaths of this year,'' analysts at Rabobank noted. ''It was notable in May that the BoE’s (as expected) rate hike failed to stop the pound from falling as the market latched on to the Bank’s downside growth revision.''
''Around this time the OECD forecast that the UK would see no growth in 2023, a little worse than our house forecast of 0.2%. The BoE, like most other central banks, is committed to reigning in inflation, even at the cost of growth. However, the absence of the latter has provided a strong headwind for the pound.''
Meanwhile, the US dollar has also been juggled between the bears and bulls depending on risk sentiment. The weakness in the euro has benefitted the US dollar due to the gas woes in Europe and poor business sentiment from Germany on Monday. Additionally, an overall gloomy outlook for world growth as forecasted by the International Monetary fund has helped to buoy the greenback for its safe haven allure.
The DXY has been trading on the backfoot since since the US central bank raised interest rates by 75 basis points, as was widely anticipated, while comments from Fed Chair Jerome Powell spurred hopes for a slower hiking path.
On Thursday, the US Gross Domestic Product was reported to have fallen at a 0.9% annualized rate last quarter, the Commerce Department said in its advance estimate of GDP. Economists polled by Reuters had forecast GDP rebounding at a 0.5% rate.
Domestic fundamentals offer little support for the Turkish lira according to analysts at MUFG Bank. They forecast USD/TRY at 18.500 by the end of the third quarter and at 20.000 by the first quarter of next year.
Key Quotes:
“The lira has resumed its slide against the US dollar over the past month resulting in USD/TRY rising to within touching distance of the record high from the end of last year at 18.363. The lira rebound at the end of June proved to be short-lived. The brief rebound was triggered by the announcement from Turkey’s banking regulator that it will restrict commercial lira loans to corporate borrowers if they hold more than TRY15 million in foreign currencies and if the amount exceeds 10% of total assets or annual sales.”
“The underlying bearish trend for the lira has quickly resumed reflecting the lack of foreign investor confidence in domestic policy settings. The CBRT remains reluctant to tighten policy in response to elevated inflation that hit a fresh high of 78.6% in June. It leaves the real policy rate adjusted for inflation in deeply negative territory.”
“In the interim period the balance of risks remains heavily titled to the downside for the lira. Turkey has found it more challenging to finance their current account deficit. The higher energy import bill has resulted in Turkey’s current account deficit widening to USD28 billion in the first five months of this year.”
- AUD/USD reclaims the 0.7000 figure, a level last seen in June 13.
- Sentiment is mixed, but the AUD/USD got bolstered by a soft US dollar and the RBA’s decision.
- US ISM Manufacturing data stays in expansionary territory, though prices and new orders dropped.
The AUD/USD rises above the 0.7000 figure on a mixed sentiment session, spurred by reports that US House Speaker Pelosi could visit Taiwan. China’s reacted, warning that it would hold military exercises in the South China Sea from August 2 to 8, while some Chinese maritime administrations issued warnings prohibiting the entrance to the abovementioned sea.
The AUD/USD is trading at 0.7031 after reaching a daily low above the 50-day EMA at 0.6966, though bids around the low bolstered the Aussie to its daily high at 0.7047.
AUD/USD edges high, awaiting the RBA’s decision
European and US equities are fluctuating. Data from the US reinforced that a recession might be knocking on the door. However, the ISM Manufacturing PMI for July is still in expansionary territory, at 52.8, exceeding expectations, but trailed June’s 53. Timothy Fiore, chair of ISM, commented, “Panelists are now expressing concern about a softening in the economy,” which was reflected in New Orders, shrinking for the second month.
In the Asian session, Australia’s Manufacturing PMI hit 55.7 as estimated, but below June’s 56.2. In the meantime, Australia’s TD-MI Inflation Gauge rose by 1.2%, further reinforcing the need for higher rates.
Analysts at TD Securities said that most analysts expect the Reserve Bank of Australia (RBA) to hike the cash rate by 50 bps. “We anticipate the RBA’s end ’22 headline CPI forecast to be around 7.5% y/y, exceeding the RBA Governor’s 7% target with trimmed clocking in around 5.75-6%. This should support a 50bps Sept hike” They added that “a 50bps hike and similar RBA forecasts to ours would likely see the market view the meeting as dovish.”
Therefore, the AUD/USD might be under pressure, though broad US dollar weakness will keep the Australian dollar afloat. Nevertheless, China’s Caixin PMI rose by 50.4, lower than estimated, and it could put a lid on AUD/USD upward prices.
Over the weekend, the Minnesota Fed President, Neil Kashkari, said that he was surprised by the markets’ reaction that the Fed would soon begin to slow down the pace of rates while adding that higher core inflation readings would push him to back up another 75 bps hike.
Elsewhere, the US Dollar continues its slide, losing 0.47%, at 105.335, undermined by dropping US Treasury yields. The US 10-year benchmark note rate is at 2.616%, down three basis points. The aforementioned reasons bolstered the AUD/USD to fresh two-month highs.
What to watch
The Australian economic docket will feature the RBA Interest Rate Decision at 04:30 GMT. The US calendar will unveil the JOLTs Job Openings, and Fed speaking with Chicago Fed President Charles Evans will cross the wires.
AUD/USD Key Technical Levels
The USD/BRL is trading at 5.15 at the beginning of the month. Analysts at Rabobank see the pair trading at 5.25 by the end of the year. They see the Brasil Central Bank (BCB) raising rates by 50 basis points at the August meeting.
Key Quotes:
“Externally, despite FOMC’s 75-bp hike, Powell says next move is data dependent and the market interpreted the Fed’s move as relatively dovish, especially after the US 22Q2 GDP advance release, marking a technical recession. In the meantime, lockdown risks due to Covid in China remain relatively high, China seeks to prop up the real estate sector amid growing US-China tensions over Taiwan, whereas the outlook for the conflicts in Ukraine remains negative. Domestically, the misery index improves (both IPCA15 CPI inflation and unemployment rates improve) but Lula still leads most polls. Although the DXY dollar index depreciated 0.6% in the week, USDBRL appreciated 6.3% due to the risk-on sentiment. The Ibovespa rose 4.3%, while the local inverted yield curve bull flattened.”
“We still see the BCB hiking 50 bps at its August meeting, then likely staying put until yearend. Although we expect a longer Selic hiking cycle than we did at the beginning of 2022, we believe the Fed will remain hawkish, the USD will recover its safe haven status by yearend, and the traditional electoral cycle will weigh on the BRL and other local assets going forward. By yearend, we expect the BRL to trade at 5.25.”
The Korean won will likely find some support from returning capital inflows and also on the economic outlook, explained analysts at MUFG Bank. They forecast USD/KRW at 1270.0 by the end of the third quarter and at 1250.0 by year end.
Key Quotes:
“BOK raised its seven-day repurchase rate by 50bps to 2.25% as expected on July 13, the biggest increase since interest rates became its primary policy tool in 1999. BOK Governor Rhee Chang-yong indicated that larger hikes were not becoming a new norm.”
“Compared with June’s 5.1% depreciation, USD/KRW’s muted net performance in July reflected the support that KRW received on domestic factors. The benchmark KOSPI Index climbed up by 3% (vs June’s -13%) and foreign investors bought a net USD0.8 bn worth of Korea’s local equities (vs a net selling of roughly USD4.8 bn in June).”
“Looking ahead, given the South Korean government keeps Covid regulations relaxed, we expect a continued recovery in consumption, offsetting part of the potential weakness in external demand due to slowing growths in the US and EU. Recovering dometic demand will likely encourage foreign capital to continue returning to Korean markets. In addition, this better-than-expected Q2 GDP print could allow the BOK more room in hiking rates for the purpose of taming inflation, which could help with Korea’s government bond yield spreads with the US.”
Data released on Monday showed the ISM Manufacturing PMI index dropped less than expected in July. According to analysts at Wells Fargo, the headline reading of 52.8 is still consistent with expansion, but the slowest pace of expansion since June 2020 when the economy was still emerging from the COVID lockdowns.
Key Quotes:
“New orders contracted for the second straight month in a sign that the economy is cooling. The employment component was in contraction territory as well. An inventory build helped keep the headline ISM in expansion territory.”
“Manufacturers have been adding to payrolls every month so far this year, including 29K new factory jobs in June. For the better part of the past year difficulty finding labor was often the reason behind any slowing in hiring. These days that is less obviously the main obstacle; manufacturing production posted back-to-back declines in May and June, and while core capital goods orders are still positive, bookings have slowed in recent months.”
“Factory output fell 0.5% in June and revisions bit hard into past data on manufacturing reducing the level of manufacturing output to 2018 levels. Against that deteriorating backdrop, the fact that the ISM production component slipped to 53.5 and the new orders component slipped further into contraction territory at 48.0 does not bode well for this bellwether. The strengthening U.S. dollar presents a headwind as the greenback is inversely related to manufacturing and broader industrial production.”
In a recently published report, Moody’s Investors Service said that it expects the US Federal Reserve to take the policy rate to the range of 3.5-3.75% by the end of the year and above 4% by March 2023, as reported by Reuters.
Additional takeaways
"US and euro-area data confirm slowing economic momentum."
"US, euro-area interest-sensitive consumer, residential, business investment activity to continue to moderate over coming quarters."
"US real GDP growth of 2.1% expected this year and 1.3% in 2023."
"FOMC expected to continue with front-loaded rate increases in upcoming meetings."
"Periodic disruptions of gas supply from Russia will cause growth in the euro area to decelerate sharply."
"In the baseline scenario, euro area real GDP expected to grow 2.2% in 2022 and by 0.9% in 2023."
"Expecting ECB to embark on a hawkish monetary policy path over the course of its upcoming meetings in the euro area."
Market reaction
The EUR/USD pair showed no immediate reaction to this report and was last seen rising 0.55% on the day at 1.0274.
Analysts at MUFG Bank remain bearish on the Indian rupee. They forecast USD/INR at 80.500 by the end of the third quarter, and at 81.000 by the end of the year.
Key Quotes:
“During July the Indian rupee plunged against the US dollar in terms of London closing rates from 78.970 to 79.253. The Reserve Bank of India (RBI) is expected to raise the benchmark repo rate by 50bps to 5.40% at the upcoming MPC meeting on 5th August, which would mark the third rate hike this year following a cumulative 90bps of rate hikes since May.”
“The Indian rupee hit a new record low of 80.180 against the US dollar in July, mainly driven by ongoing US dollar strength on expectations of aggressive Fed policy tightening and global growth fears. This prompted the RBI to impose a slew of measures to shore up the INR such as raising the gold import duty and easing rules for NRI deposits. In addition, RBI Governor Das strongly expressed that the central bank has “zero tolerance” for rupee volatility – an indication that the RBI likely intervened in the FX market to soothe rupee volatility.”
“We remain bearish on the rupee in 2H22 as recent measures introduced to shore up the currency are not sufficient to offset downward pressures stemming from extended US dollar strength, risks of further portfolio outflows, and larger trade and current account deficits.”
- Loonie weakens as crude oil tumbles.
- US dollar remains under pressure as the US yields print fresh lows.
- USD/CAD rises back above 1.2820.
The USD/CAD rose more than 60 pips and printed a fresh daily high at 1.2830. Earlier on Monday bottomed at 1.2766, the lowest intraday level since June 10.
The move higher took place amid a weaker Canadian dollar across the board, as crude oil prices tumble. The WTI is falling by more than 5.50%, the barrel is hovering around $93.00.
The rebound in USD/CAD is being limited by a lower US dollar. The greenback remains under pressure, as market continues to rally and as Treasuries rise further. The Dow Jones is up by 0.20%, at the highest level since early June. The US 10-year yield broke below 2.60%, the lowest since April 7.
Economic data from the US came in mixed. The ISM Manufacturing PMI dropped to the lowest since 2020 at 52.8, better than the market consensus (52). Construction spending dropped unexpectedly in June 1.1%. Regarding data, the critical day of the week will be Friday with the official employment reports due in Canada and the US.
Bearish, but the rebounds offer hope to bulls
The short-term trend in USD/CAD point to the downside. Although the pair rebounded from an important support at 1.2775 (100-day Simple Moving Average), alleviating the negative momentum.
If the rebound continues, the dollar will face resistance between 1.2830 and 1.2850. Attention then would turn to 1.2900. The next key level is the 20-day Simple Moving Average at 1.2930. A daily close above should change the bias to bullish.
A decline back under 1.2800 would reinforce the bearish outlook. Support levels below are seen at 1.2766 (Aug 1 low) and 1.2730.
Technical levels
- EUR/USD rises on risk-on mood, despite increasing tensions between the US and China.
- The US ISM Manufacturing PMI stays in expansionary territory, though New Orders dropped.
- Euro area PMIs remain in the contractionary region, while German Retail Sales plunge.
The EUR/USD advances for the fourth consecutive day, amidst an upbeat mood, as investors shrugged off tensions arising as US House Speaker Pelosi visits Asia. According to Chinese authorities, a visit to Taiwan would deteriorate US-China relations. That, a US PMI Manufacturing showing slowing signs, although the ISM beat expectations, keeps the EUR/USD on the front foot, as the greenback weakens.
The EUR/USD is trading at 1.0272 after hitting a daily low at 1.0205, though it climbed sharply towards its daily high at 1.0274 but settled around current levels, as buyers are eyeing a challenge of 1.0300.
EUR/USD positive on sentiment, and expectations of “less aggressive” Fed
During the New York session, the US ISM Manufacturing PMI rose by 52.8, higher than the 52.0 estimations, though it trailed the previous reading at 53. What’s worth noting is that New Orders continue to shrink, from 49.2 in the last month to July 48.0. According to Timothy Fiore, chair of ISM’s Manufacturing Business Survey Committee, “Panelists are now expressing concern about a softening in the economy, as new order rates contracted for the second month amid developing anxiety about excess inventory in the supply chain.”
In the meantime, during the European session, German Retail Sales plunged the most since 1994, to 8.8% YoY. Additionally, S&P Global Manufacturing PMIs for the bloc, Germany and France, remain in contractionary territory, fueling speculations of an impending recession in the Eurozone. Nevertheless, the Unemployment rate kept steady, illustrating a tight labor market.
Some Fed officials crossed wires during the weekend, led by Minnesota Fed President Neil Kashkari. He said he was surprised by the markets’ reaction that the Fed would soon begin to slow down the pace of rates, while adding that higher core inflation readings would push him to back up another 75 bps hike.
Elsewhere, the US Dollar continues its downward path, losing 0.48%, at 105.325, undermined by falling US Treasury yields. The US 10-year benchmark note rate is at 2.595%, down six basis points. Those factors bolstered the EUR/USD, trading at fresh two-week highs.
What to watch
The Eurozone economic calendar will feature Consumer Confidence in Spain. On the US front, the docket will feature the JOLTs Job Openings, and Fed speaking with Chicago Fed President Charles Evans will cross the wires.
EUR/USD Key Technical Levels
- US ISM Manufacturing PMI edged slightly lower in July.
- US Dollar Index stays under bearish pressure below 105.50.
The business activity in the US manufacturing sector expanded at a slightly softer pace in July than in June with the ISM Manufacturing PMI declining to 52.8 from 53 in June. This was the lowest reading since June 2020 but it was better than the market expectation of 52.
Key takeaways
"The New Orders Index registered 48%, 1.2 percentage points lower than the 49.2% recorded in June."
"The Production Index reading of 53.5% is a 1.4-percentage point decrease compared to June's figure of 54.9%."
"The Prices Index registered 60%, down 18.5 percentage points compared to the June figure of 78.5%; this is the index's lowest reading since August 2020 (59.5%)."
"The Employment Index contracted for a third straight month at 49.9%, 2.6 percentage points higher than the 47.3% recorded in June."
Market reaction
The US Dollar Index stays on the back foot after this report and was last seen losing 0.38% on the day at 105.42.
Analysts at Rabobank offered a brief preview of the USD/JPY pair and expect spot prices to oscillate in a broader trading range between the 130-135 psychological marks.
Key Quotes:
“The BoJ is clearly the outliner amongst its G10 peers. While all the others are gripped by a determination to dampen the inflation rate, the BoJ is attempting to nurture it. Having struggled with disinflationary and deflationary pressures for decades, Governor Kuroda sees an opportunity to finally create a virtuous cycle between wage inflation, demand and corporate profitability. Speculators have been disappointed that the BoJ has stuck to its hugely accommodative policy during the past few months. “
“However, green shoots are appearing in relation to wage inflation that suggest that the BoJ could alter its YCC policy in the foreseeable future on its own terms. The move lower in US bond yields from their June highs and the resultant fall in the spread vs. JGB yields has reduced pressure on the JPY and, for now, vindicated the decision of Kuroda not to pander to speculators. USD/JPY is likely to remain sensitive to moves in US yields. For now it seems that USD/JPY may favour a 130 to 135 trading range.”
- US S&P Manufacturing PMI declined to 52.2 in July.
- US Dollar Index stays deep in negative territory near 105.50.
The business activity in the US manufacturing sector expanded at a softer pace in July than in June with the S&P Manufacturing PMI falling to 52.2 from 52.7. This print came in below the flash estimate and the market expectation of 52.3.
Commenting on the data, "with the exception of pandemic lockdown periods, July saw US manufacturers report the toughest business conditions since 2009," said Chris Williamson, Chief Business Economist at S&P Global Market Intelligence. "A growth spurt in the spring has quickly gone into reverse, with new orders for factory goods down for a second straight month in July, leading to the first drop in production for two years and sharply reduced employment growth."
Market reaction
The dollar struggles to find demand after this data and the US Dollar Index was last seen losing 0.35% on the day at 105.48.
- Silver is seen digesting its recent strong move up to a one-month high, set earlier this Monday.
- Oscillators on the daily chart favour bullish traders and support prospects for additional gains.
- A slightly overbought RSI on the 4-hour chart warrants consolidation before the next leg up.
Silver struggles to capitalize on last week's strong move up and seesaws between tepid gains/minor losses on the first day of a new week. The white metal extends the sideways consolidative price move through the early North American session and remains confined in a range below mid-$20.00s, or a one-month high set earlier this Monday.
From a technical perspective, the XAG/USD, so far, has struggled to find acceptance above the 50% Fibonacci retracement level of the $22.52-$18.15 slide. Furthermore, the strong positive momentum stalls near the 50-day SMA. The latter should now act as a key pivotal point and help traders determine the next leg of a directional move.
Oscillators on the daily chart, meanwhile, have just started gaining positive traction and support prospects for a further near-term appreciating move. That said, RSI (14) on the daily chart is already flashing overbought conditions. This makes it prudent to wait for some near-term consolidation before the next leg up for the XAG/USD.
Spot prices might then aim to surpass the 61.8% Fibo. level, around the $20.85 region, and reclaim the $21.00 round figure. The momentum could further get extended and lift the XAG/USD towards the next relevant hurdle near the $21.40-$21.50 area en-route the $22.00 mark and the 100-day SMA, currently around the $22.15 zone.
On the flip side, any meaningful slide now seems to find decent support near the $20.00 psychological mark. This is followed by the 38.2% Fibo. level, around the $19.80 region. A convincing break below the latter would suggest that the recovery from the YTD low has run out of steam and shift the bias in favour of bearish traders.
Silver daily chart
-637949581507847525.png)
Key levels to watch
- USD/TRY gathers further traction and approaches 18.00.
- Türkiye Manufacturing PMI came in at 46.90 in July.
- Next of note in the calendar will be the inflation figures.
The Turkish lira starts the week on the back foot and motivates USD/TRY to resume the upside and trades at shouting distance from the key 18.00 mark on Monday.
USD/TRY now looks to data
USD/TRY rapidly leaves behind Friday’s doji-like session and resumes the uptrends on Monday, always with the key 18.00 mark as the immediate target for bulls.
The lira remains on the defensive despite the better mood in the risk-associated universe, although market participants appear wary ahead of the publication of inflation figures tracked by the CPI in Türkiye later in the week.
In addition, the radio silence around the Turkish central bank and the lack of details regarding the progress of the protected time deposits scheme contributes further to the prevailing uncertainty and weigh on TRY.
Earlier in the domestic calendar, the Manufacturing PMI receded to 46.90 in July (from 48.10).
What to look for around TRY
The upside bias in USD/TRY remains unchanged and stays on course to revisit the key 18.00 zone.
In the meantime, the lira’s price action is expected to keep gyrating around the performance of energy prices, which appear directly correlated to developments from the war in Ukraine, the broad risk appetite trends and the Fed’s rate path in the next months.
Extra risks facing the Turkish currency also come from the domestic backyard, as inflation gives no signs of abating, real interest rates remain entrenched in negative figures and the political pressure to keep the CBRT biased towards low interest rates remain omnipresent. In addition, there seems to be no Plan B to attract foreign currency in a context where the country’s FX reserves dwindle by the day.
Key events in Türkiye this week: Manufacturing PMI (Monday) – Inflation Rate, Producer Prices (Wednesday).
Eminent issues on the back boiler: FX intervention by the CBRT. Progress (or lack of it) of the government’s new scheme oriented to support the lira via protected time deposits. Constant government pressure on the CBRT vs. bank’s credibility/independence. Bouts of geopolitical concerns. Structural reforms. Presidential/Parliamentary elections in June 23.
USD/TRY key levels
So far, the pair is gaining 0.33% at 17.9427 and faces the immediate target at 17.9519 (2022 high July 29) seconded by 18.2582 (all-time high December 20) and then 19.00 (round level). On the other hand, a breach of 17.1903 (weekly low July 15) would pave the way for 16.9748 (55-day SMA) and finally 16.0365 (monthly low June 27).
Despite the recent downfall, Win Thin, Global Head of Currency Strategy at BBH, sticks to his medium-term bullish outlook for the US dollar and explains that the Fed remains committed to lowering inflation.
Key Quotes:
“DXY is down for the fourth straight day and trading at new lows for this move near 105.43, the lowest since July 5. We maintain our strong dollar call and believe that markets are misreading the Fed’s commitment to lowering inflation. However, the greenback is unlikely to get much traction in the absence of any strong economic data. This week’s U.S. data will be key for the medium-term dollar outlook.”
“WIRP suggests a 50 bp hike September 21 is fully priced in, with 30% odds of a larger 75 bp move. The swaps market is now pricing in 100 bp of tightening over the next 6 months that would see the Fed Funds rate peak near 3.50%, followed by 50 bp of easing over the subsequent 6 months. We cannot believe that the Fed would make such a quick pivot with inflation still well above target and the labor market at full employment. “
“With the media blackout over, prepare for more Fed comments that tilt decidedly hawkish. Evans, Mester, and Bullard speak Tuesday. Mester speaks again Thursday. Over the weekend, uber-dove Kashkari reiterated that the Fed is focused on lower inflation, noting that “We are committed to bringing inflation down and we’re going to do what we need to do. We are a long way away from achieving an economy that is back at 2% inflation, and that’s where we need to get to.” We concur.”
US ISM Manufacturing PMI overview
The Institute of Supply Management (ISM) will release its latest manufacturing business survey result, also known as the ISM Manufacturing PMI at 14:00 GMT this Monday. The index is anticipated to have edged down to 52 in July from 53 in the previous month. The gauge will provide a fresh update on the manufacturing sector activity and the health of the economy amid growing worries about a possible recession.
According to Yohay Elam, Senior Analyst FXStreet: “The Prices Paid component in the ISM Manufacturing PMI is even more important and remains sky high. Despite dropping to 78.5 points in June, the indicator is at extremely high levels -- and projected to climb back to 81.”
How could it affect EUR/USD?
Ahead of the key release, the US dollar dropped to its lowest level since July 5 amid diminishing odds for more aggressive rate hikes by the Fed. A weaker data would be enough to reinforce expectations and exert additional downward pressure on the greenback. Conversely, the reaction to better-than-expected data is more likely to be short-lived and might do little to impress the USD bulls. That said, the EUR/USD pair, so far, has been struggling to make it through the 1.0275-1.0285 supply zone, making it prudent to wait for strong follow-through buying before placing fresh bullish bets.
Eren Sengezer, Editor at FXStreet, outlined important technical levels to trade the major and also offered a brief technical outlook: “EUR/USD was last seen trading slightly above 1.0230, where the Fibonacci 38.2% retracement level of the latest downtrend forms the upper limit of the two-week-old trading range. In case the pair manages to stabilize above that level, it could target 1.0300 (psychological level, Fibonacci 50% retracement, 200-period SMA on the four-hour chart) and 1.0370 (Fibonacci 61.8% retracement). In the meantime, the Relative Strength Index (RSI) indicator on the four-hour chart holds above 50, suggesting that sellers remain on the sidelines for the time being.”
“On the downside, supports are located at 1.0200 (psychological level, 50-period SMA, 20-period SMA), 1.0150 (Fibonacci 23.6% retracement, 100-period SMA) and 1.0100 (psychological level, static level),” Eren added further.
Key Notes
• ISM Manufacturing PMI: Dollar to dominate in duel between inflation and employment components
• EUR/USD Forecast: Euro needs to start using 1.0230 as support to extend rebound
• EUR/USD Price Analysis: Further upside needs to clear 1.0280
About the US ISM manufacturing PMI
The Institute for Supply Management (ISM) Manufacturing Index shows business conditions in the US manufacturing sector. It is a significant indicator of the overall economic condition in the US. A result above 50 is seen as positive (or bullish) for the USD, whereas a result below 50 is seen as negative (or bearish).
Senior Economist at UOB Group Alvin Liew reviews the latest advanced Q2 GDP figures in the US economy.
Key Takeaways
“The advance estimate of US 2Q GDP surprised on the downside with a 0.9% q/q SAAR contraction (from -1.6% in 1Q), first back-to-back sequential decline of GDP since 1H 2020 during the onset of the COVID-19 pandemic, and thus, met the standard criteria of technical recession. But this remains far from the consideration of a full recession as there are parts of the economy still expanding.”
“The fall in 2Q GDP was attributed to decreases in private inventories, residential fixed investment, federal government spending, state and local government spending, and non-residential fixed investment (business spending). This was partly offset by the smaller increase in private consumption expenditure and a rebound in net exports. A particular concern was the fall in US personal saving rate to 5.2% in 2Q (from 5.6% in 1Q), the lowest rate recorded since 2008. Coupled with the lower-than-expected PCE increases in 1H 2022, the lower savings rates was seen as a sign of how the accelerating inflation is eating into spending, and this is something that will need to be monitored as accelerating inflation could further impair spending.”
“Taking into account the disappointing 2Q decline, we now expect full year GDP growth to be lower by another 0.2 ppt to 1.8% in 2022 (from previous forecast of 2.0%) and easing further to 1.5% in 2023 (unchanged from previous) which is below trend growth that we estimate at 1.8%. The growth outlook is a reflection of worsening assessment of the negative impact on growth due to the elevated inflation situation and the aggressive Fed rate hikes That said, the risk of a 2023 recession has risen in tandem with the aggressive Fed tightening cycle.”
“FOMC Outlook: The 1H GDP contraction does not change our Sep FOMC outlook for a 50bps rate hike. If anything, the sub-par growth outcome will diminish the risk of continued ‘larger than usual’ hikes but the need to tame elevated inflation means that the Fed will still continue with raising interest rates for the remainder of this year, just not in the clips of 75bps or more.”
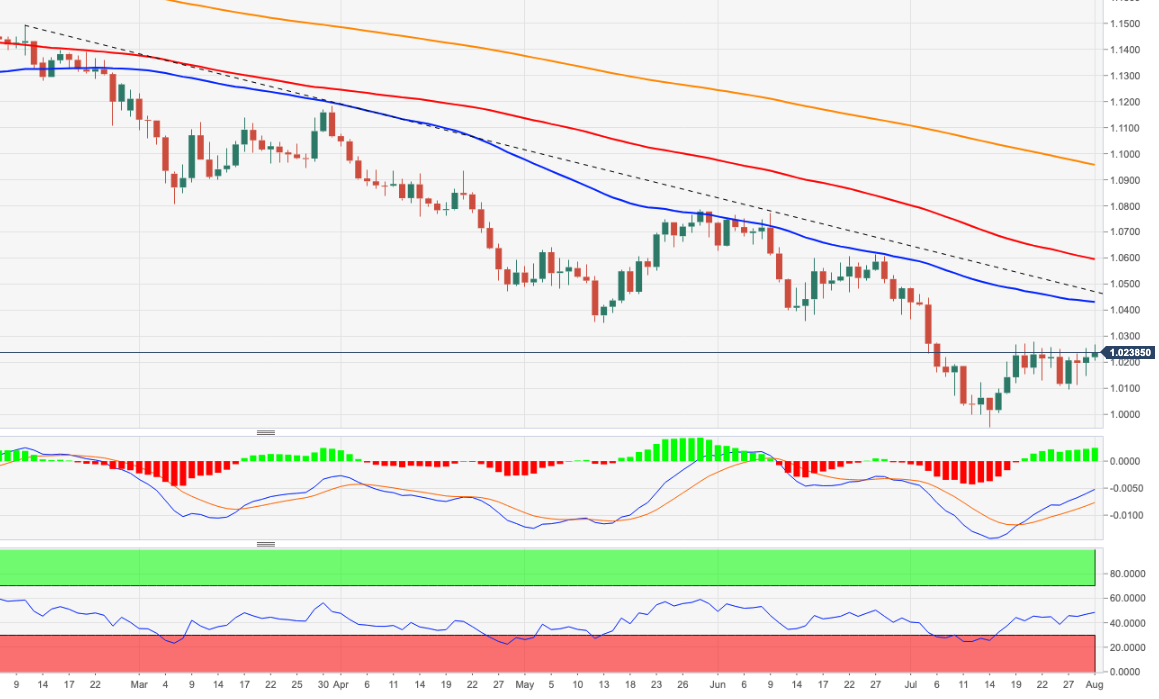
- EUR/USD extends the optimism to the 1.0270 region on Monday.
- Extra gains look likely on a breakout of the 1.0280 zone.
EUR/USD’s upside momentum has faltered once again around the 1.0270 region at the beginning of the week.
Ideally, the pair should clear the area of recent peaks around 1.0280 to allow for the continuation of the rebound in the near term. Against that, the next hurdle now appears at the temporary 55-day SMA, today at 1.0428.
In the meantime, the pair is expected to remain under downside pressure while below the 6-month support line around 1.0450.
In the longer run, the pair’s bearish view is expected to prevail as long as it trades below the 200-day SMA at 1.0955.
EUR/USD daily chart
- USD/CAD drops to its lowest level since June 10 amid the prevalent USD selling bias.
- Diminishing odds for more aggressive Fed rate hikes continue to weigh on the buck.
- Weaker oil prices could undermine the loonie and help limit deeper losses for the pair.
The USD/CAD pair reverses a modest intraday uptick to the 1.2820 region and turns lower for the fourth successive day on Monday. This also marks the fifth day of a negative move in the previous six and drags spot prices to the lowest level since June 10, around the 1.2765 region during the mid-European session.
The US dollar is prolonging its post-FOMC downfall and the selling remains unabated on the first day of a new week, which, in turn, is exerting downward pressure on the USD/CAD pair. It is worth recalling that the Fed last week hinted that it could slow the pace of the rate hike campaign at some point. Furthermore, the disappointing release of the Advance US GDP report last Thursday fueled speculations that the Fed would not hike interest rates as aggressively as previously estimated. This is seen as a key factor that continues to weigh on the greenback.
That said, a combination of factors, for now, seems to have eased the bearish pressure surrounding the USD/CAD pair and helped bulls to defend the 100-day SMA. An intraday bounce in the US Treasury bond yields, along with recession fears, offers some support to the safe-haven buck. Worries about an economic downturn, meanwhile, weigh on crude oil prices. This is undermining the commodity-linked loonie and holding back bears from placing fresh bets.
Traders also seem reluctant and might prefer to move on the sidelines ahead of this week's key macro data scheduled at the beginning of a new week. A packed US economic docket kicks off with the release of the ISM Manufacturing PMI on Monday. This, along with the US bond yields and the broader market risk sentiment, would drive the USD demand. Apart from this, oil price dynamics should allow traders to grab short-term opportunities around the USD/CAD pair.
The focus, however, would remain on the closely-watched US monthly jobs report - popularly known as NFP on Friday. Traders will further take cues from the simultaneous release of Canadian employment figures. This would play a key role in determining the next leg of a directional move for the USD/CAD pair.
Technical levels to watch
Further weakness could force USD/IDR to revisit the 14,812 area and probably below in the near term, suggested Quek Ser Leang at UOB Group’s Global Economics & Markets Research.
Key Quotes
“USD/IDR dropped sharply to a low of 14,825 last Friday (29 Jul). While the rapid drop appears to be overdone, there is scope for USD/IDR to dip below the major support at 14,812 (55-day exponential moving average).”
“For this week, a sustained decline below this level is unlikely (the next support is at 14,780). Resistance is at 15,000.”
- DXY accelerates the corrective decline to the 105.30 zone.
- Immediate to the downside appears the 55-day SMA at 104.75.
DXY navigates the fourth consecutive session with losses and revisits the 105.30 region at the beginning of the week.
The index broke below the multi-session pre-FOMC consolidative theme and in doing so it has paved the way for extra decline in the short-term horizon. That said, the immediate support now turns up at the interim 55-day SMA at 104.75 ahead of the 5-month support line around 103.85.
The near-term outlook for DXY remains constructive while above this 5-month support line near 104.00.
In addition, the broader bullish view remains in place while above the 200-day SMA at 99.49.
DXY daily chart
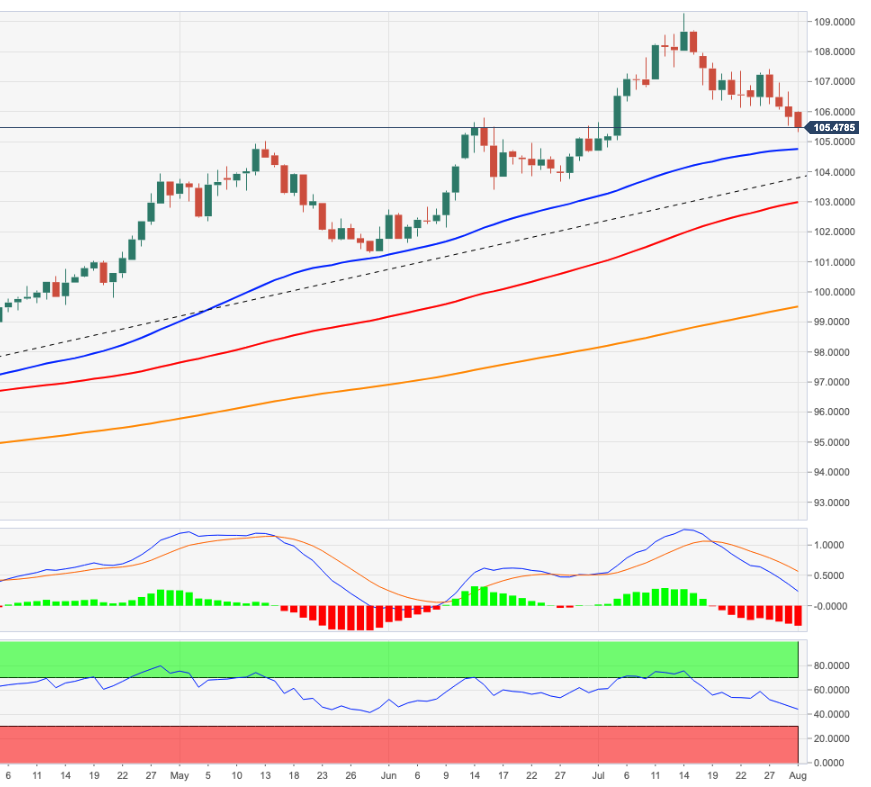
Economist at UOB Group Lee Sue Ann expects the RBA to hike the OCR by 50 bps at its meeting on August 2.
Key Quotes
“In light of the RBA’s persistent reference to ensure that inflation in Australia returns to target over time; we now think the RBA is open to a third 50bps rise in Aug. We then look for a further 25bps increase in Nov to take the OCR to 2.10% by year-end.”
“In 2023, we are looking for a 25bps increase in Feb and a 15bps increase in May. This should take the OCR to 2.50%, with a pause thereafter, and our end-2023 forecast unchanged at 2.50%.”
- EUR/JPY drops for the third session in a row on Monday.
- There are minor support levels at 134.98 and 133.92.
EUR/JPY starts the week well on the defensive and approaches the key 135.00 zone, or 3-month lows.
The cross entered the third consecutive week with losses and remains vulnerable to further decline in the near term. A deeper pullback should test the minor support levels at 134.98 (low May 25) prior to 133.92 (low May 19). If breached, a visit to the this critical 200-day SMA, today at 133.68, should start emerging on the horizon.
It is worth noting that while above the latter, the cross is expected to keep its constructive stance.
EUR/JPY daily chart
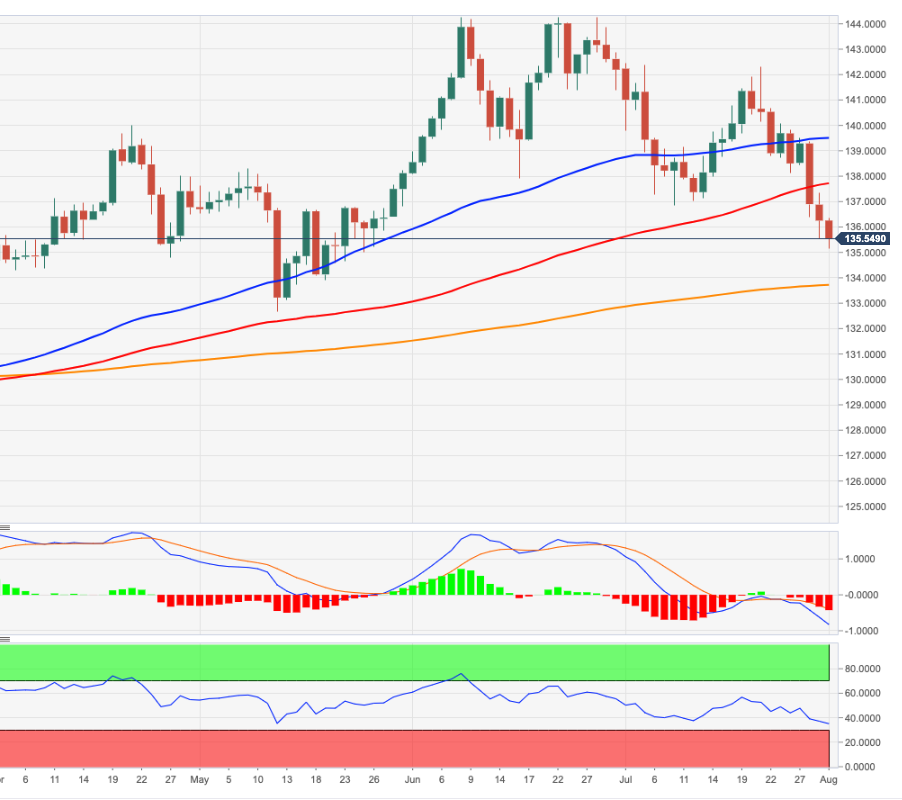
USD/MYR could grind lower in the near term, although it is unlikely to challenge the 4.4300 region, according to Quek Ser Leang at UOB Group’s Global Economics & Markets Research.
Key Quotes
“USD/MYR traded within a relatively quiet manner between 4.4450 and 4.4590 last week. Despite the quiet price actions, the underlying tone has softened somewhat.”
“For this week, USD/MYR could drift lower but is unlikely to threaten the rising trend-line support at 4.4300. On the upside, the high of 4.4590 is a strong resistance now.”
- USD/JPY witnesses heavy selling for the fourth straight day and drops to a one-and-half-month low.
- The USD selling bias, the narrowing of the US-Japan yield differential continue to exert pressure.
- Ascending trend-line breakdown now supports prospects for a further near-term depreciating move.
The USD/JPY pair witnessed some selling pressure for the fourth successive day on Monday and remains depressed through the first half of the European session. The pair drops to its lowest level since June 16 in the last hour, with bears now looking to extend the downfall further below the 132.00 mark.
The post-FOMC US dollar selling bias remains unabated on the first day of a new week, which turns out to be a key factor exerting downward pressure on the USD/JPY pair. Apart from this, the recent narrowing of the US-Japan yield differential, along with recession fears, is benefitting the safe-haven Japanese yen and contributing to the decline.
From a technical perspective, Monday's bearish slide confirms a near-term bearish breakdown below an ascending trend-line extending from the April monthly swing low. Any subsequent slide, however, could stall near the 131.30 area, or the 61.8% Fibonacci retracement level of the 127.15-139.39 strong rally. The latter should now act as a key pivotal point.
Given that oscillators on the daily chart are on the verge of breaking into the oversold territory, bears might wait for sustained weakness below the said support before placing fresh bets. The USD/JPY pair might then turn vulnerable to weakening below the 131.00 mark and test the 130.65 intermediate support before dropping to the 130.00 psychological mark.
On the flip side, any meaningful recovery attempt might confront stiff resistance near the ascending trend-line support breakpoint, around the 132.85 region. The said barrier coincides with the 50% Fibo. level and is followed by the 133.00 mark. Some follow-through buying would suggest that the USD/JPY pair has formed a bottom and trigger a short-covering rally.
USD/JPY daily chart
-637949464520612105.png)
Key levels to watch
- Gold turns positive for the fourth straight day and climbs to a fresh multi-week high.
- The prevalent USD selling bias continues to benefit the dollar-denominated commodity.
- Recession fears weigh on investors’ sentiment and also underpin the safe-haven metal.
Gold reverses its early lost ground and turned positive for the fourth successive day on Monday. The momentum pushed the XAU/USD to a fresh three-and-half-week high, around the $1,772-$1,773 region during the first half of the European session on Monday. The post-FOMC US dollar selling bias remains unabated on the first day of a new week, which is turning out to be a key factor benefitting the dollar-denominated commodity.
The Federal Reserve last week sounded less hawkish and hinted that it could slow the pace of the policy tightening campaign at some point amid signs of a slowdown. Adding to this, the disappointing release of the Advance US Q2 GDP report confirmed a technical recession and fueled speculations that the Fed would not hike interest rates as aggressively as previous estimates. This, in turn, exerts some follow-through downward pressure on the USD for the fourth successive day.
Apart from sustained USD selling, the prevalent cautious mood around the equity markets further offers some support to the safe-haven gold. The recent optimistic move in the markets runs out of steam amid growing worries about a global economic downturn. The concerns resurfaced following the disappointing release of the official Chinese Manufacturing PMI for July, which dropped back into contraction territory. This, in turn, tempers investors' appetite for perceived riskier assets.
It, however, remains to be seen if bulls are able to capitalize on the move or opt to take some profits off the table. A goodish rebound in the US Treasury bond yields could limit the USD losses and cap gains for the non-yielding gold. Investors might also refrain from placing aggressive bets ahead of this week's key central bank event risks. The Reserve Bank of Australia (RBA) will announce its policy decision on Tuesday and the Bank of England meeting is scheduled on Thursday.
Apart from this, important US macro data scheduled at the beginning of a new month would further play a key role in determining the next leg of a directional move for gold. A rather busy US economic docket this week kicks off with the release of the ISM Manufacturing PMI on Monday. This, along with the US bond yields, will influence the USD and provide some impetus to spot prices. The focus, meanwhile, would remain on the US monthly jobs report (NFP) on Friday.
Technical levels to watch
Quek Ser Leang at UOB Group’s Global Economics & Markets Research noted USD/THB risks further decline in the near term.
Key Quotes
“The sharp drop in USD/THB late last week is gathering momentum. The decline in USD/THB could dip below the rising trend-line support. At the time of writing, the trend-line support is at 35.92.”
“For this week, the next major support at 33.58 (55-day exponential moving average) is not expected to come into the picture. On the upside, a break of 36.70 (minor resistance is at 36.50) would indicate that USD/THB is unlikely to weaken further.”
- EUR/USD extends the recovery to the 1. 0260 region.
- German final Manufacturing PMI came at 49.3 in July.
- Markets’ attention will be on the US ISM Manufacturing due later.
The buying interest around the European currency remains well and sound and motivates EUR/USD to attempt another test of the 1.0260/70 band on Monday.
EUR/USD up on risk appetite, USD-selling
EUR/USD trades with gains for the fourth consecutive session at the beginning of the week, although it faces a major resistance around the 1.0260/70 band so far.
Another weak performance in the greenback lends further wings to the ongoing recovery in the pair after bottoming out in the 1.0100 neighbourhood during last week.
The bid tone in spot comes pari passu with the continuation of the upbeat mood in the broader risk-linked galaxy, while gains in yields on both sides of the ocean also underpin the upside momentum so far.
In Germany, Retail Sales contracted 8.8% YoY in June, while final figures saw the Manufacturing PMI at 49.3 in July. In the euro area, the Manufacturing PMI also remained in the contraction territory at 49.8, while the Unemployment Rate stayed put at 6.6% in June.
In the NA session, the manufacturing sector will also take centre stage with the releases of the final S&P Global Manufacturing PMI and the more relevant ISM Manufacturing, all followed by Construction Spending results during June.
What to look for around EUR
EUR/USD maintains its consolidative phase with gains clearly limited around 1.0260 so far.
Price action around the European currency, in the meantime, is expected to closely follow dollar dynamics, geopolitical concerns, fragmentation worries and the Fed-ECB divergence.
On the negatives for the single currency emerges the so far increasing speculation of a potential recession in the region, which looks propped up by dwindling sentiment readings among investors and the renewed downtrend in some fundamentals
Key events in the euro area this week: Germany Retail Sales, Final Manufacturing PMI, EMU Final Manufacturing PMI, Unemployment Rate (Monday) – Germany Balance of Trade, Final Services PMI (Wednesday) – Germany Construction PMI (Thursday).
Eminent issues on the back boiler: Continuation of the ECB hiking cycle. Italian elections in late September. Fragmentation risks amidst the ECB’s normalization of monetary conditions. Impact of the war in Ukraine on the region’s growth prospects and inflation.
EUR/USD levels to watch
So far, spot is gaining 0.34% at 1.0260 and a breakout of 1.0278 (weekly high July 21) would target 1.0429 (55-day SMA) en route to 1.0615 (weekly high June 27). On the other hand, initial contention emerges at 1.0107 (weekly low July 26) seconded by 1.0000 (psychological level) and finally 0.9952 (2022 low July 14).
The Kremlin is out with a statement on Monday, saying that Russia has little ability to change the situation with Nord Stream 1 equipment.
Last week, Russia cut Nord Stream 1 gas supply to 20% of its capacity amid escalating energy tensions over the Ukraine war. The European Union (EU) accused Russia of resorting to energy blackmail but the Kremlin defended that the Gazprom disruption has been caused by maintenance issues.
On Tuesday, a gas turbine for Nord Stream 1, Russia's biggest gas pipeline to Europe, had not yet arrived after maintenance in Canada and a second turbine was showing defects, according to the company’s spokesperson.
Market reaction
The shared currency pays little heed to the Kremlin’s remarks, with EUR/USD extending the advance above 1.0250.
The main currency pair is up 0.44% on the day at 1.0260, at the press time.
- AUD/USD jumps to a one-and-half-month high on Monday amid sustained USD selling bias.
- Diminishing odds for more aggressive Fed rate hikes continue to undermine the greenback.
- Recession fears weighed on investors’ sentiment and could help limit any further USD losses.
- Investors now eye RBA on Tuesday and key US macro releases this week for a fresh impetus.
The AUD/USD pair prolongs its intraday ascent through the first half of the European session on Monday and jumps to a one-and-half-month low, around the 0.7035 region in the last hour.
The US dollar adds to its post-FOMC losses and edges lower for the fourth successive day, which turns out to be a key factor pushing the AUD/USD pair higher. In fact, the USD Index drops to its lowest level since July 5 amid diminishing odds for more aggressive policy tightening by the Federal Reserve. Against the backdrop of a less hawkish FOMC decision last week, the Advance US Q2 GDP report released on Thursday confirmed a technical recession. This, in turn, fueled speculations that the Fed would adopt a more gradual approach towards raising interest rates, which continues to undermine the USD.
The risk of a global economic downturn, meanwhile, resurfaces following the disappointing release of the official Chinese Manufacturing PMI over the weekend. This now seems to have tempered investors' appetite for perceived riskier assets, which is evident from a weaker tone around the equity markets. The anti-risk flow, along with a goodish rebound in the US Treasury bond yields, could limit losses for the safe-haven buck and cap the risk-sensitive aussie. Investors might also refrain from placing aggressive bets ahead of this week's key central bank event risk and important US macro data.
A rather busy week kicks off with the release of the US ISM Manufacturing PMI, later during the early North American session. The data might provide some impetus to the AUD/USD pair ahead of the Reserve Bank of Australia policy decision, scheduled to be announced during the Asian session on Tuesday. The focus, meanwhile, would remain on the closely-watched US monthly jobs report, popularly known as NFP on Friday. This would play a key role in influencing the USD price dynamics and help determine the next leg of a directional move for the AUD/USD pair.
Technical levels to watch
Analysts at TD Securities (TDS) said, in their latest, report, that they believe the Reserve Bank of Australia (RBA) has the room to surprise markets to the upside on Tuesday.
Key quotes
“All analysts (including us) expect the RBA to hike the target cash rate by 50bps tomorrow bar one (75bps). The RBA surprised the market in May and June, so the possibility of a 65bps hike cannot be ruled out.”
“We anticipate the RBA's end '22 headline CPI forecast to be around 7.5% y/y, exceeding the RBA Governor's 7% target with trimmed clocking in around 5.75-6%. This should support a 50bps Sept hike.”
“Our other economic forecasts are as follows vs the RBA's May SoMP f/c's in brackets. Headline CPI Dec'23: 2.75% (3.25%). GDP 2022: 3.9% (4.5%), 2023: 1% (2.75%). U/e rate Dec'22: 4% (3.75%), Dec'23 4.5% (3.5%).“
“A 50bps hike and similar RBA forecasts to ours would likely see the market view the meeting as dovish.”
The European Central Bank (ECB) said in a statement on Monday, a sustained rise in oil prices will reduce the eurozone's potential output by less than 1% over four years, Reuters reports.
The reduction in the bloc’s output will account for a small hit that could be further reduced by the green transition, the ECB said.
Key takeaways
“Using its own forecasting model, the ECB found that an increase of 1% in oil prices would reduce the euro area's growth potential by around -0.02% in the medium term.”
“Assuming a 40% rise in oil prices in the next four years compared to 2017-20, the ECB concluded that potential output in the euro area would be cut by just 0.8% over that period.”
"In particular, for transportation and household energy consumption, viable green alternatives exist that are far less dependent on oil.”
Market reaction
EUR/USD was last seen trading up 0.40% at 1.0258, unperturbed by the above report.
- GBP/USD regains positive traction on Monday amid the prevalent USD selling bias.
- Diminishing odds for more aggressive Fed rate hikes continue to weigh on the USD.
- A softer risk tone, rebounding US bond yields to limit the USD losses and cap the pair.
The GBP/USD pair attracts fresh buying on the first day of a new week and jumps back above the 1.2200 mark during the early part of the European session. Spot prices, however, remain well below a one-month high, around the 1.2245 touched on Friday.
The US dollar languished near its lowest level since July 5, which is turning out to be a key factor lending support to the GBP/USD pair. Market participants continue to scale back their expectations for more aggressive rate hikes by the Federal Reserve amid worries about an economic downturn. This, to a larger extent, overshadows Friday's stronger US Personal Consumption Expenditures (PCE) and continues to weigh on the greenback.
The British pound is further underpinned by rising bets for a 50 bps rate hike by the Bank of England, though a combination of factors could cap gains for the GBP/USD pair. The recent optimistic move in the equity markets ran out of steam amid growing recession fears. This, along with a modest bounce in the US Treasury bond yields, should help limit the downside for the USD and act as a headwind for the major, at least for now.
Investors might also refrain from placing aggressive bets and prefer to wait on the sidelines ahead of the Bank of England policy meeting on Thursday. Apart from this, important US macro data scheduled at the beginning of a new month would determine the next leg of a directional move for the GBP/USD pair. A rather busy week kicks off with the release of the ISM Manufacturing PMI, which could provide some trading impetus to the major.
Technical levels to watch
- USD/CHF slides to a one-month low on Monday amid the prevalent USD selling bias.
- Diminishing odds for more aggressive Fed rate hikes continue to weigh on the buck.
- A softer risk tone benefits the safe-haven CHF and contributes to the modest downtick.
The USD/CHF pair prolongs its recent downtrend witnessed since mid-June and witnesses selling for the fifth successive day on Monday. This also marks the seventh day of a negative move in the previous eight and drags spot prices to over a one-month low, with bears now awaiting a sustained break below the 0.9500 psychological mark.
The US dollar remains depressed near its lowest level since July 5, which is turning out to be a key factor exerting some downward pressure on the USD/CHF pair. Despite the persistent rise in inflationary pressures, growing recession fears forced investors to scale back expectations for a more aggressive policy tightening by the Fed. This, in turn, has led to a sharp downfall in the US Treasury bond yields and continues to weigh on the greenback.
The USD/CHF pair is further pressured by a generally weaker risk tone, which tends to benefit the safe-haven Swiss franc. The sentiment remains fragile amid worries about an economic downturn. This is evident from a modest weakness in the equity markets. That said, a goodish bounce in the US Treasury bond yields holds back traders from placing aggressive bearish bets around the USD and limits deeper losses for the major, at least for the time being.
Moving forward, market participants now look forward to this week's key US macro releases scheduled at the beginning of a new month for a fresh directional impetus. A rather busy US economic docket kicks off with the release of the ISM Manufacturing PMI later during the early North American session. The market focus, however, would remain on the closely-watched US monthly jobs report - popularly known as NFP on Friday.
Technical levels to watch
Analysts at JP Morgan said in their latest client note that the European Central Bank (ECB) is likely to deliver another 50 bps rate hike before taking a pause.
Key quotes
"There is no doubt in our mind that the ECB at its next meeting on 8 September will revise its inflation projections considerably higher whereas it is less likely that there will be sufficient information - short of a gas rationing shock - to change significantly the growth forecast.”
“In our view, this further upward inflation revision will not fail to make an impression on the Governing Council, even though uncertainty about growth prospects is likely to be high. Against this backdrop – and keeping in mind our modal view of a mild recession around the turn of the year.”
“We now expect the ECB to hike 50bp in September, rather than proceed in two 25bp steps in September and October. After having taken the policy rate to 50bp in September, we then expect the ECB to be somewhat more sensitive to that activity data and to pause its rate hikes in October - by that time it may be clearer that the Euro area economy heading in to outright contraction."
USD/CNH is still seen within the 6.7280-6.7800 range for the time being, commented FX Strategists at UOB Group Lee Sue Ann and Quek Ser Leang.
Key Quotes
24-hour view: “We highlighted last Friday that ‘the outlook remains mixed’ and we expected USD to ‘trade between 6.7350 and 6.7650’. USD subsequently dropped sharply but briefly to 6.7267 before rebounding to a high of 6.7585. The outlook remains mixed and USD is likely to trade sideways for today, expected to be between 6.7350 and 6.7650.”
Next 1-3 weeks: “Last Thursday (28 Jul, spot at 6.7525), we highlighted that USD is likely to consolidate and trade between 6.7280 and 6.7800. USD dropped briefly below the bottom of our expected range on Friday (low of 6.7267) before rebounding strongly. Shorter-term outlook is mixed and we continue to expect USD to consolidate and trade between 6.7280 and 6.7800 for now.”
- The index extends the bearishness to the 105.60 region.
- The better tone in the risk complex put the dollar under pressure.
- Final Manufacturing PMI, ISM Manufacturing PMI next on tap.
The greenback, in terms of the US Dollar Index (DXY), remains on the defensive and revisits recent lows in the 105.60 region on Monday.
US Dollar Index offered on risk-on trade, looks to data
The index loses ground for the fourth consecutive session so far on Monday against the backdrop of further improvement in the risk complex and a tepid bounce in US yields in the belly and the long end of the curve.
Indeed, the downbeat mood prevails around the greenback and keeps DXY under further pressure after investors continue to assess last week’s poor GDP prints (-0.9%), which showed the US economy entered a technical recession in Q2.
Later in the NA session, the final S&P Global Manufacturing PMI is due ahead of the key ISM Manufacturing PMI, both gauges for the month of July. Finally, June’s Construction PMI will also be in the calendar.
What to look for around USD
The index remains under pressure below the 106.00 mark and navigate fresh 3-week lows at the beginning of the week, mainly following recession chatter and the persistent decline in US yields across the curve.
The very-near-term outlook for the dollar has deteriorated somewhat in recent sessions, particularly following the latest US GDP figures and the prospects for further tightening by the Fed in the next months, which carry the potential to drag further the economy into the contraction territory.
Among the positives for the buck still emerge the Fed’s divergence vs. most of its G10 peers (especially the ECB) in combination with bouts of geopolitical effervescence and occasional re-emergence of risk aversion.
Key events in the US this week: Final Manufacturing PMI, ISM Manufacturing PMI (Monday) – MBA Mortgage Applications, Factory Orders, ISM Non-Manufacturing (Wednesday) – Balance of Trade, Initial Claims (Thursday) – Non-Farm Payrolls, Unemployment Rate, Consumer Credit Change (Friday).
Eminent issues on the back boiler: Hard/soft/softish? landing of the US economy. Escalating geopolitical effervescence vs. Russia and China. Fed’s more aggressive rate path this year and 2023. US-China trade conflict. Future of Biden’s Build Back Better plan.
US Dollar Index relevant levels
Now, the index is down 0.16% at 105.65 and faces initial support at 104.75 (55-day SMA) followed by 103.67 (weekly low June 27) and finally 103.41 (weekly low June 16). On the other hand, a break above 107.42 (weekly high post-FOMC July 27) would expose 109.29 (2022 high July 15) and then 109.77 (monthly high September 2002).
- USD/JPY drops to a one-and-half-month low and is pressured by a combination of factors.
- The USD languishes near a multi-week low amid bets for a gradual Fed tightening path.
- The narrowing US-Japan rate differential, a softer risk tone benefits the safe-haven JPY.
The USD/JPY pair finds some support and recovers a few pips from the 132.00 neighbourhood, or a one-and-half-month low touched earlier this Monday. The pair remains depressed for the fourth successive day and is seen trading just below the mid-132.00s during the early European session.
The US dollar languished near its lowest level since July 5 and turns out to be a key factor exerting some downward pressure on the USD/JPY pair. Friday's stronger US Personal Consumption Expenditures (PCE) price index data was overshadowed by fears about an economic downturn. This continues to fuel speculations that the Fed would not raise rates as aggressively as previously estimated and is acting as a headwind for the greenback.
On the other hand, a combination of factors is seen to boost demand for the Japanese yen and also contribute to the USD/JPY pair's downfall. The prospects for a less aggressive policy tightening by the Fed have led to the recent decline in the US Treasury bond yields, resulting in the narrowing of the US-Japan rate differential. This, along with a softer risk tone, has been driving flows towards the traditional safe-haven JPY.
That said, a big divergence in the monetary policy stance adopted by the Bank of Japan (dovish) and other major central banks should keep a lid on any meaningful gains for the JPY. This, in turn, could lend some support to the USD/JPY pair. Investors might also refrain from placing aggressive bets and prefer to wait on the sidelines ahead of this week's important US macro releases, scheduled at the beginning of a new month.
A packed US economic docket this week kicks off with the release of the ISM Manufacturing PMI, due later during the early North American session. The data, along with the US bond yields, might influence the USD price dynamics. Traders will further take cues from the broader market risk sentiment. The focus, meanwhile, would remain glued to the closely-watched US monthly jobs report, popularly known as NFP on Friday.
Technical levels to watch
Here is what you need to know on Monday, August 1:
Despite the hot US inflation data, the greenback struggled to find demand on Friday and the US Dollar Index (DXY) ended up closing the second straight week in negative territory. The index stays relatively quiet below 106.00 on Monday as investors wait for the ISM to release the Manufacturing and Services PMI reports for July. The European economic docket will feature the Unemployment Rate for June. In the early trading hours of the Asian session on Tuesday, the Reserve Bank of Australia will announce its interest rate decision. Meanwhile, US stock index futures are down between 0.4% and 0.5%, pointing to a cautious market mood at the start of the week.
Earlier in the day, NBS Manufacturing PMI in China came in at 49, suggesting that the business activity in China's manufacturing sector contracted in July. The Non-Manufacturing PMI declined to 53.8 from 54.7 in June.
The data from the US showed that the Personal Consumption Expenditures (PCE) Price Index climbed to 6.8% on a yearly basis in June from 6.3% in May. The Core PCE Price Index, the Fed's preferred gauge of inflation, edged higher to 4.8% from 4.7% in the same period. The benchmark 10-year US Treasury bond yield, which lost nearly 4% last week, clings to modest daily gains early Monday, helping the dollar stay resilient against its rivals.
Despite the dollar's poor performance, EUR/USD struggled to gather bullish momentum and closed the previous week virtually unchanged a little above 1.0200. The pair continues to fluctuate above that level in the early European session. The data from Germany showed on Monday that Retail Sales contracted by 1.6% on a monthly basis in June, missing the market expectation for an increase of 0.2% by a wide margin.
GBP/USD rose more than 150 pips last week and managed to build on last week's gains at the beginning of the week. The pair was last seen trading in positive territory near 1.2200.
USD/JPY trades at its lowest level since mid-June and continues to push lower toward 132.00.
Following the previous week's impressive performance, gold seems to have gone into a consolidation phase. XAU/USD was last seen moving sideways above $1,760.
Bitcoin trades in negative territory near $23,200 after having registered modest losses over the weekend. Ethereum gained 5% last week and continues to stretch higher toward $1,700 in the European morning.
- USD/TRY grinds higher around yearly top despite the previous day’s bearish candlestick, overbought RSI.
- Monthly resistance line also challenges buyers targeting 2021 peak.
- 10-DMA restricts immediate downside ahead of the resistance-turned-support from June.
USD/TRY regains upside momentum, after Friday’s failed attempt, as buyers poke 17.95 mark during early Monday morning in Europe.
In doing so, the Turkish lira (TRY) pair ignores the previous day’s Doji, bearish candlestick, as well as the overbought RSI conditions.
However, an upward sloping resistance line from early July, around 18.10 by the press time, appears to challenge the USD/TRY bulls.
Even if the quote rises past 18.10, the previous yearly peak surrounding 18.35-40 will act as an additional upside filter before directing buyers towards refreshing the all-time high, preferably around the 20.00 psychological magnet.
Meanwhile, pullback moves may initially aim for the 10-DMA level surrounding 17.80 ahead of highlighting June’s peak near 17.50.
During the quote’s weakness past 17.50, the two-month-old previous resistance line, around 17.10 by the press time, will be important to watch as a downside break of 17.10 could convince sellers to retake controls.
Overall, USD/TRY bulls are likely to find multiple hurdles during their further dominance.
USD/TRY: Daily chart
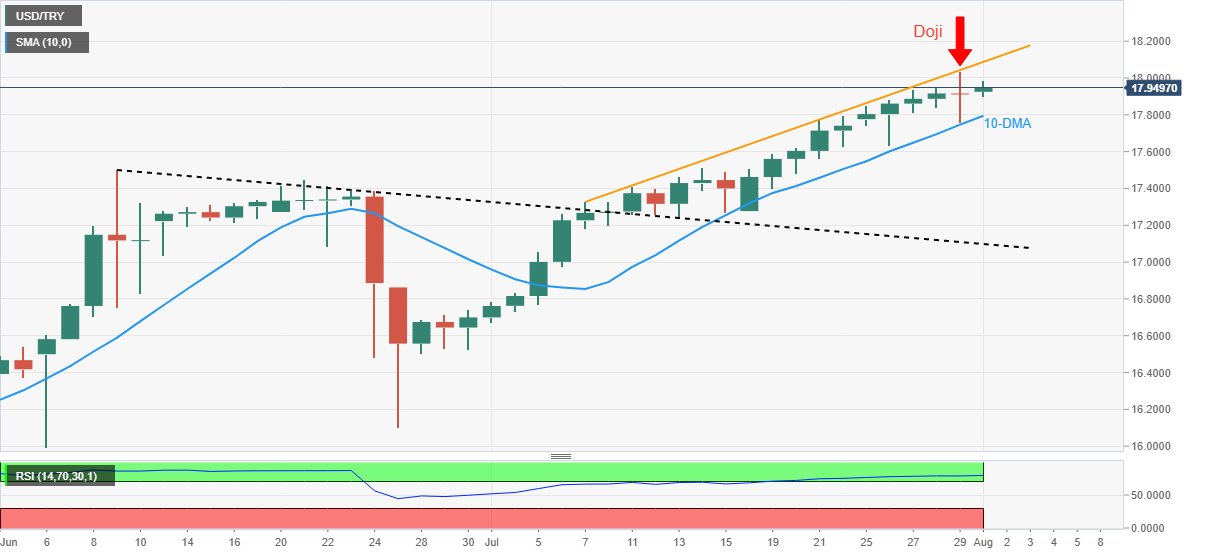
Trend: Limited upside expected
Extra losses could drag USD/JPY to the 132.00 region and below in the next few weeks, suggested FX Strategists at UOB Group Lee Sue Ann and Quek Ser Leang.
Key Quotes
24-hour view: “While we expected ‘the oversold weakness in USD to extend’ last Friday, we were of the view that ‘a break of the major support at 133.80 is unlikely’. The subsequent sharp sell-off that sent USD plunging to 132.49 came as a surprise. While deeply oversold, the weakness in USD has not stabilized. From here, barring a break above 134.00 (minor resistance is at 133.50), USD could weaken to 132.00 (minor support is at 132.50) before stabilization is likely. For today, the major support at 131.70 is unlikely to come under threat.”
Next 1-3 weeks: “We turned negative USD last Thursday (28 Jul, spot 135.90). As USD dropped, we highlighted on Friday (29 Jul, spot at 134.50) that downward momentum remains strong and USD is likely to weaken further to 133.80. The anticipated USD weakness exceeded our expectations as USD easily cracked 133.80 and plunged to a low of 132.49. Not surprisingly, downward momentum remains strong and USD is likely to continue to weaken. The support levels are at 132.00 and 131.70. The downside risk is intact as long as USD does not move above 134.55 (‘strong resistance’ level was at 135.85 last Friday).
The latest survey conducted by the US Citibank and pollsters YouGov showed that the British public's expectations for inflation continued its fall in July.
Key details
“The expectations for inflation in five to 10 years' time dropped to 3.8% in July from 4.0% in June.”
“Inflation expectations for 12 months' time edged down to 6.0% from 6.1%.”
“The Bank of England watches closely for signs that price pressures might be becoming embedded.”
Separately, UK leadership candidate Rishi Sunak said that he “would fund proposed income tax cut by growing the economy and being disciplined with public spending.”
It is “not wise to embark on an excessive borrowing spree when inflation is on the rise,” Sunak added.
Market reaction
The pound is unfazed by the above survey findings, as GBP/USD keeps its range around 1.2185 so far this Monday. The spot is up 0.18% on the day.
- EUR/GBP remains pressured around intraday low while portraying bearish chart formation.
- Germany’s Retail Sales for June slumped 8.8% versus -8.0% forecast.
- 50-HMA increases the strength of the support, 100-HMA adds to the upside filters.
- One-week-old previous resistance line adds to the downside filters.
EUR/GBP justifies downbeat German Retail Sales for June as the cross-currency pair holds lower ground near 0.8390 amid the initial European session on Monday.
In doing so, the quote remains near the support line of a short-term bearish flag chart pattern amid a steady RSI (14).
That said, Germany’s Retail Sales dropped 8.8% YoY in June versus -8.0% market consensus and -3.6% prior.
It’s worth noting that the EUR/GBP bears need validation from the 0.8380 support confluence, including the 50-HMA and lower line of the flag, before cheering the further downside.
Also acting as the key support is the previous resistance line from July 21, near 0.8350.
Meanwhile, recovery moves may initially aim for the 100-HMA level surrounding 0.8400 before challenging the stated flag’s upper line, at 0.8425 by the press time.
In a case where EUR/GBP bulls keep reins past 0.8425, the odds of witnessing an extended run-up towards July 25 swing high near 0.8525 can’t be ruled out.
Overall, EUR/GBP is likely to remain pressured but the bears have a bumpy road ahead.
EUR/GBP: Hourly chart
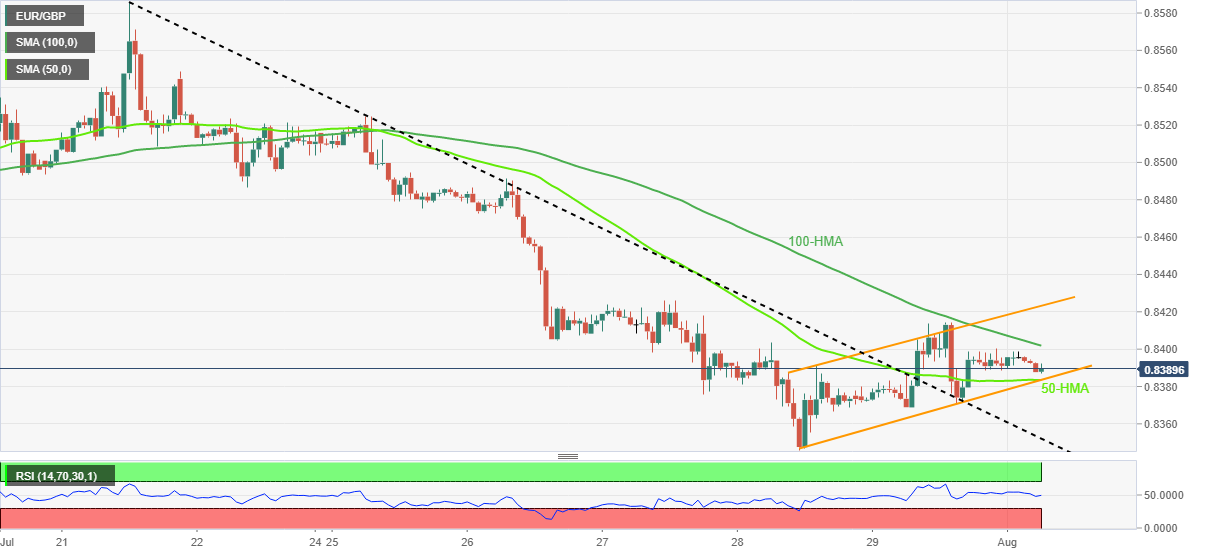
Trend: Further downside expected
FX option expiries for August 1 NY cut at 10:00 Eastern Time, via DTCC, can be found below.
- EUR/USD: EUR amounts
- 1.0100 647m
- 1.0125 496m
- 1.0200 698m
- 1.0250 650m
- 1.0275 411m
- 1.0300 958m
- GBP/USD: GBP amounts
- 1.2000 250m
- 1.2125 617m
- USD/JPY: USD amounts
- 132.75 350m
- 133.00 300m
- 134.00 393m
- EUR/GBP: EUR amounts
- 0.8325 482m
- 0.8535 352m
Advanced prints from CME Group for natural gas futures markets saw open interest resume the uptrend and rise by around 4.5k contracts on Friday. Volume, instead, dropped for the third session in a row, this time by around 18.4K contracts.
Natural Gas: The 55-day SMA holds the downside
Friday’s decent gains in prices of natural gas was against the backdrop of rising open interest, which is indicative that extra rebound could be on the cards in the very near term. Further downside, in the meantime, is expected to meet contention around the 55-day SMA, today at $7.63 per MMBtu.
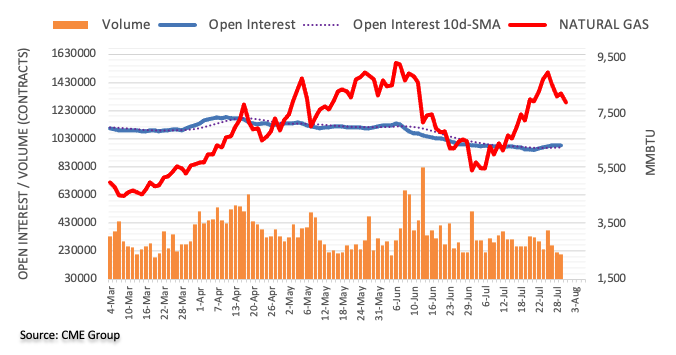
- EUR/USD pares daily gains after softer-than-expected German Retail Sales for June.
- Firmer Eurozone GDP, strong inflation data couldn’t please bulls amid hawkish Fedspeak, upbeat US Core PCE deflator figures.
- Risks of Eurozone recession, Sino-American tussles paused US dollar bears amid sluggish session.
- Eurozone PMI and Unemployment Rate will precede US ISM Manufacturing PMI to entertain intraday traders.
EUR/USD drops to 1.0215 as it reverses intraday gains after downbeat German Retail Sales data during early Monday morning in Europe. Also contributing to the major currency pair’s fresh declines is the sluggish session and cautious mood ahead of this week’s key US employment data and a mild risk-aversion wave.
Germany’s Retail Sales dropped 8.8% YoY in June versus -8.0% market consensus and -3.6% prior.
Recent data from the bloc’s powerhouse pours cold water on the face of recovery hopes after Eurozone Gross Domestic Product (GDP) offered a surprise positive on Friday, with +0.7% QoQ figure compared to 0.2% expected and 0.6% previous.
Also weighing on the EUR/USD prices could be Russia’s halt in gas supplies to Latvia. Additionally, the latest hawkish comments from Minneapolis Fed President Neil Kashkari and a firmer print of the Fed’s preferred inflation gauge are also likely to have extended downside pressure on the pair.
It’s worth noting that the market’s pause in the risk-on mood is also likely to have underpinned the US dollar’s safe-haven demand and tease the pair sellers. The sour sentiment could be linked to the PMIs from China and Beijing’s warning to the US, concerning US House Speaker Nancy Pelosi’s Asia visit.
While portraying the mood, the S&P 500 Futures retreat from the monthly peak, down 0.45% intraday, whereas the US 10-year Treasury yields rise three basis points (bps) to 2.67% by the press time.
Moving on, the final reading of the Eurozone S&P Global PMI for July and Unemployment Rate for June may entertain EUR/USD traders ahead of the US ISM Manufacturing PMI for July, expected at 52 versus 53 prior.
Technical analysis
EUR/USD remains inside the one-month-old ascending triangle amid a firmer RSI. However, sellers can aim for the 1.0200 threshold as intraday support before challenging a convergence of the 100-SMA and an upward sloping support line from July 14, around 1.0145, challenging the quote’s further downside. Meanwhile, recovery moves remain elusive below the aforementioned triangle’s upper line, close to 1.0275-80.
In the opinion of FX Strategists at UOB Group Lee Sue Ann and Quek Ser Leang, AUD/USD is now expected to navigate between 0.6900 and 0.7040 for the time being.
Key Quotes
24-hour view: “We highlighted last Friday that AUD ‘could edge higher to 0.7020’. We added, ‘the major resistance at 0.7040 is unlikely to come under threat’. AUD subsequently rose to 0.7032, plummeted to 0.6912 before snapping back up to close largely unchanged (0.6991, -0.02%). Further choppy price actions are not ruled out, albeit likely within a narrower range of 0.6935/0.7020.”
Next 1-3 weeks: “We have held a positive view in AUD for about 2 weeks now. In our latest narrative from last Thursday (28 Jul, spot at 0.6990), we highlighted that while upward momentum has not improved by much, there is scope for AUD to advance further to 0.7040. AUD rose to 0.7032 on Friday before dropping sharply and took out our ‘strong support’ level at 0.6935 (low of 0.6912). The break of the ‘strong support’ level indicates that AUD strength has ended. The current movement appears to be part of a consolidation and AUD is likely to trade between 0.6900 and 0.7040 for now. Looking ahead, AUD has to close above 0.7040 before further sustained advance is likely.”
- German Retail Sales arrived at -8.8% YoY in June vs. -8.0% expected.
- Retail Sales in Germany stood at -1.6% MoM in June vs. 0.2% expected.
Germany's Retail Sales dropped by -1.6% MoM in June versus 0.2% expected and 0.6% last, the official figures released by Destatis showed on Monday.
On an annualized basis, the bloc’s Retail Sales came in at -8.8% in June versus -8.0% expected and -3.6% booked in May.
FX implications
The euro is little changed on the mixed German data. At the time of writing, the major trades at 1.0217, almost unchanged on the day.
About German Retail Sales
The Retail Sales released by the Statistisches Bundesamt Deutschland is a measure of changes in sales of the German retail sector. It shows the performance of the retail sector in the short term. Percent changes reflect the rate of changes of such sales. The changes are widely followed as an indicator of consumer spending. Positive economic growth is usually anticipated as "bullish" for the EUR, while a low reading is seen as negative, or bearish, for the EUR.
- Gold price is likely to remain upbeat on lower consensus for US NFP.
- A higher estimate for US ISM New Orders Index indicates higher forward demand by households.
- The precious metal has established above 38.2% Fibo retracement comfortably.
Gold price (XAU/USD) is continuously facing barricades while attempting to recapture the critical resistance of $1,770.00. The precious metal has dragged to near $1,760.00 but is likely to pick bids and initiate a fresh bullish impulse wave ahead.
The gold prices are likely to remain upbeat on expectations of downbeat US Nonfarm Payrolls (NFP) this week. As per the market consensus, the US economy has added 250K jobs in the labor market against the prior release of 372k. A downbeat performance is expected from the economic data as various US tech companies have halted their recruitment process as revealed in their second-quarter earnings commentary. Also, the Unemployment Rate is seen as stable at 3.6%.
Meanwhile, the US dollar index (DXY) is facing barricades around 105.80 ahead of US ISM data. The Manufacturing PMI is seen lower at 52 vs. 53 in the prior release. While, the New Orders index, which indicates forward demand by the households is expected to jump to 52 from the prior release of 49.2.
Gold technical analysis
On a four-hour scale, gold prices are establishing above the 38.2% Fibonacci retracement (which is placed from June 12 high at $1,879.26 to July 21 low at $1,680.91) at $1,756.21. An establishment above 38.6% Fibo retracement bolsters the upside potential.
The precious metal is facing hurdles in overstepping the 200-period Exponential Moving Average (EMA) at $1,763.19. Also, the 50-EMA at $1,738.51 is advancing higher, which adds to the upside filters.
The Relative Strength Index (RSI) (14) has shifted into the bullish range of 60.00-80.00, which indicates a continuation of bullish momentum ahead.
Gold four-hour chart
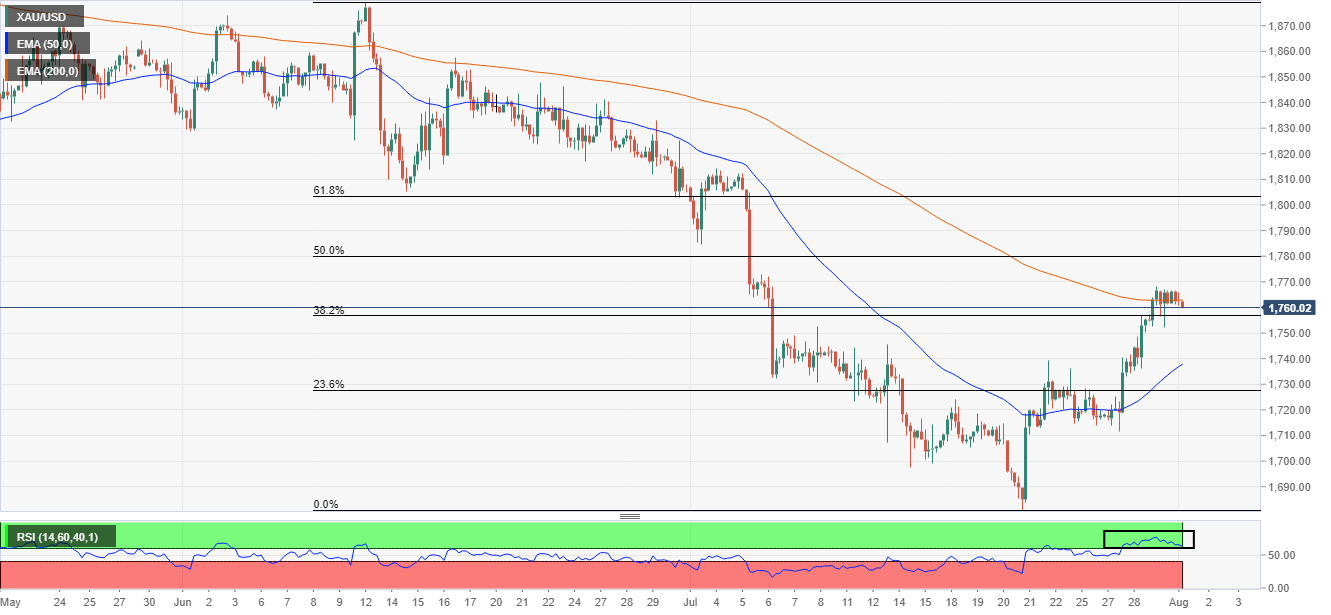
CME Group’s flash data for crude oil futures markets noted traders added around 6.5K contracts to their open interest positions on Friday, adding to the previous build. In the same line, volume resumed the upside and rose markedly by around 148.2K contracts.
WTI looks supported by the 200-day SMA
Prices of the WTI closed Friday’s session with modest gains after reaching multi-day peaks close to the $102.00 mark per barrel. The daily uptick was on the back of increasing open interest and volume, which leaves the prospects for further consolidation unchanged while supported by the key 200-day SMA, today at $95.10.
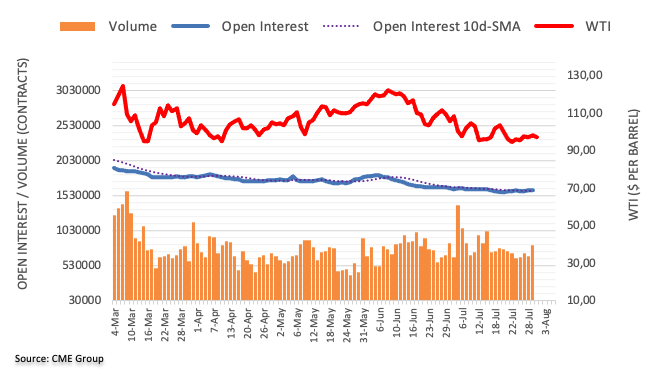
- USD/CAD struggles to defend the first daily gains in four around six-week low.
- Extended weekend in Canada restricts immediate moves even as US dollar, WTI pause recent declines.
- Mixed sentiment, cautious mood ahead of key jobs report, PMIs also portray inaction.
USD/CAD retreats to 1.2805 heading into Monday’s European session. Even so, the Loonie pair snaps a three-day downtrend while defending buyers around the lowest levels in six weeks.
That said, the quote’s recent pause in the further downside could be linked to the US dollar’s rebound from the intraday low. Also challenging the pair sellers is the recently weak prices of Canada’s main export item WTI crude oil, as well as the cautious mood ahead of this week’s key data from the US and Canada. It’s worth noting, however, that an August Civic Holiday in Canada appears to have restricted the quote’s latest moves.
That said, the US Dollar Index (DXY) picks up bids to 105.80 while paring intraday losses around the one-month low. On the other hand, WTI crude oil prices remain pressured near $95.70, down 0.85% on a day amid fears of more output increases from the Organization of the Petroleum Exporting Countries (OPEC) and allies including Russia, a group known as OPEC+. Fears of economic recession also weigh on the prices of WTI crude oil and underpin the USD/CAD rebound.
It’s worth noting that be the latest hawkish comments from Minneapolis Fed President Neil Kashkari and a firmer print of the Fed’s preferred inflation gauge also likely to have probed the USD/CAD bears.
However, downbeat PMIs from China and Beijing’s warning to the US, concerning US House Speaker Nancy Pelosi’s Asia visit, are also likely to have weighed on the market sentiment and favored the USD/CAD prices.
Looking forward, the US ISM Manufacturing PMI for July, expected at 52 versus 53 prior, could entertain intraday traders of the USD/CAD pair. However, major attention will be given to Friday’s monthly jobs report for the US and Canada.
Technical analysis
USD/CAD stays inside a two-week-old descending triangle bullish formation while recently fading the bounce off the 61.8% Fibonacci retracement (Fibo.) of June-July upside.
Further upside in GBP/USD remains on the cards with a strong resistance at 1.2245, noted FX Strategists at UOB Group Lee Sue Ann and Quek Ser Leang.
Key Quotes
24-hour view: “We highlighted last Friday that GBP ‘could edge above 1.2200’. We added, ‘the major resistance at 1.2240 is still unlikely to come into the picture’. However, GBP subsequently popped to 1.2245 and plunged sharply 1.2065 before snapping back up to end the day unchanged at 1.2184. The sharp but short-lived swings have resulted in a mixed outlook and further choppy price actions are not ruled out. Expected range for today, 1.2110/1.2230.”
Next 1-3 weeks: “In our latest narrative from last Thursday (28 Jul, spot at 1.2165), we held the view that GBP is likely to trade with an upward bias towards 1.2240. GBP rose to a high of 1.2245 on Friday, dropped sharply to a low of 1.2065 before rebounding to close unchanged at 1.2184. While upward momentum has waned, as long as 1.2065 (no change in our ‘strong support’ level from last Friday) is not clearly breached, the bias for GBP is still on the upside. That said, 1.2245 is a solid resistance level and may not be easy to break. Looking ahead, the next resistance level above 1.2245 is at 1.2300.”
Open interest in gold futures markets shrank by around 18.8K contracts on Friday according to preliminary readings from CME Group. Volume followed suit and dropped for the second session in a row, this time by around 98.2K contracts.
Gold appears capped around $1,770
Gold prices advanced for the third consecutive session at the end of last week. The positive price action, however, came in line with shrinking open interest and volume, suggesting that further gains look not favoured in the very near term at least. So far, the recent rebound met resistance in the $1,770 per ounce troy.
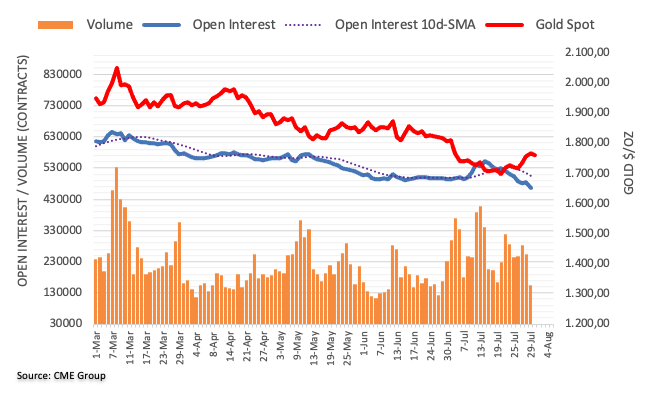
- Silver price snaps four-day uptrend around one-month high, depressed around intraday low of late.
- RSI pullback, failure to cross 50-day EMA challenge buyers on the way to 100-day EMA.
- 20-day EMA, previous resistance line from April 18 restrict short-term downside.
Silver price (XAG/USD) portrays a U-turn from the 50-day EMA as the metal prints the first daily loss in five around $20.00 during early Monday morning in Europe.
In addition to the 50-day EMA, the RSI retreat also challenges the XAG/USD buyers.
However, the metal’s successful trading above the 20-day EMA and the previous resistance line from April, respectively around $19.45 and $19.20, signal further upside of the XAG/USD.
In a case where the silver price remains weak past $19.20, the $19.00 and the recent multi-month low surrounding $18.15 could challenge the bears.
Alternatively, the 50-day EMA and the support-turned-resistance line from May 13, close to $20.35 and $20.75 in that order, restrict short-term XAG/USD upside.
Also acting as an upside filter is the 100-day EMA hurdle surrounding $21.45, a break of which could direct silver buyers towards June’s monthly peak near $22.50.
To sum up, silver prices are likely to witness barricades during the further upside. Even so, the sellers are far from retaking controls.
Silver: Daily chart
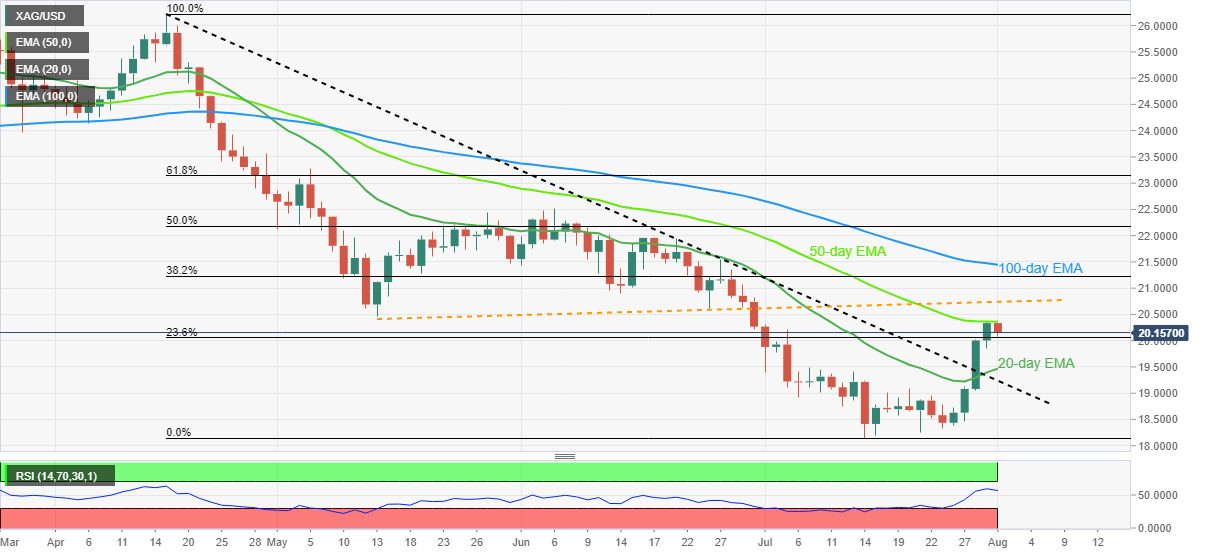
Trend: Limited downside expected
- Asian indices are performing better as subdued DXY and oil soar market mood.
- Chinese equities are positive despite the downbeat Caixin Manufacturing PMI data.
- Oil prices are continuously dropping after the EIA reported higher oil stockpiles last week.
Markets in the Asian domain are performing better on positive cues from the global indices. The Asian indices have followed the optimism displayed by Wall Street on Friday and are scaling higher. A risk-on impulse in the global market has improved the risk appetite of safe-haven-assets.
At the press time, Japan’s Nikkei225 added 0.60%, China A50 gained 0.50%, Nifty50 jumped 0.61%, and Hang Seng remained flat.
Chinese equities are performing better despite the release of the downbeat Caixin Manufacturing data. The economic data has landed at 50.4, lower than the estimates of 51.5 and the prior release of 51.7. The Chinese economy was operating with restricted economic activities in July due to the resurgence of Covid-19.
Meanwhile, the US dollar index (DXY) is displaying a subdued performance as investors see downbeat US ISM Manufacturing PMI data. The economic data is seen at 52, lower than the prior release of 53. However, the US ISM New Orders Index data is expected to report a stellar performance.
The US ISM New Orders Index is seen at 52, significantly higher than the prior release of 49.2. The corresponding data reflects the forward demand by the households and eventually, a higher New Orders Index indicates higher demand ahead.
On the oil front, declining oil prices have also supported the Asian indices. Oil prices have turned sideways but remain below $97.00 and are expected to remain vulnerable. The black gold is scaling lower from the past week after the Energy Information Administration (EIA) reported oil stockpiles last week. The EIA reported a fall in oil inventories by 4.5 million barrels last week.
FX Strategists at UOB Group Lee Sue Ann and Quek Ser Leang noted EUR/USD is now likely to trade within the 1.0100 and 1.0285 range in the next weeks.
Key Quotes
24-hour view: “We highlighted last Friday that ‘the choppy price actions appear to be part of a consolidation phase’ and we expected EUR to ‘trade between 1.0135 and 1.0235’. EUR subsequently rose briefly to 1.0254, plummeted to 1.0144 before rebounding to close at 1.0218 (+0.22%). We continue to view the price actions as part of a consolidation and expect EUR to trade between 1.0160 and 1.0260 for today.”
Next 1-3 weeks: “Our latest narrative was from last Thursday (28 Jul, spot at 1.0205) where the current movement in EUR appears to be part of a consolidation phase and it is likely to trade between 1.0100 and 1.0285. EUR traded in a relatively choppy manner the past couple of days but it has stayed within the expected range. In other words, there is no change in our view for now.”
- Steel price prints mild gains as US dollar moves jostles with downbeat China PMIs.
- Beijing’s preparations to mandate further production cuts in H2 2022 favor buyers.
- Hopes of China stimulus and challenges for hawkish Fed add strength to the bullish bias.
Steel price remains firmer during the sluggish Asian session on Monday, despite recently sidelined moves amid the US dollar’s rebound and fears surrounding China. The reason for the metal’s latest inaction could also be linked to mixed catalysts from Beijing and the market’s fears ahead of the key US jobs report for July.
That said, Construction Steel Rebar on the Shanghai Futures Exchange prints nearly 2.0% gains around 4,100 yuan per metric tonne whereas stainless steel rises close to 3.0% daily by the press time.
Recently, China’s Caixin Manufacturing PMI for July eased to 50.4 versus 51.5 expected and 51.7 prior. In doing so, the private activity gauge from China tracked the official PMIs, published during the weekend. It’s worth noting that China’s NBS Manufacturing PMI dropped back into contraction after the previous monthly improvement, down to 49.0 versus 50.4 expected and 50.2 prior. Further, the Non-Manufacturing PMI rose past 52.3 market forecast to 53.8, against 54.7 in previous readouts.
However, comments by global rating agency Fitch suggesting more stimulus from China appeared to have favored steel price. “China to roll out financial tools to boost infrastructure investment,” said Fitch.
On the same line could be theee updates from Reuters saying, “Chinese government and steel industry’s reportedly agreeing to mandate further steel production cuts in the second half of 2022.”
Alternatively, the US dollar’s pause from the further downside around the one-month low joins fears of the economic slowdown weighing on the steel price. That said, the US Dollar Index (DXY) grinds lower near 105.80, down 0.05% intraday, as buyers struggle to retake control after witnessing hawkish comments from Minneapolis Fed President Neil Kashkari and firmer prints of the Fed’s preferred inflation gauge.
Looking forward, steel price may grind higher amid the US dollar’s likely weakness, as well as the anticipated stimulus from China. However, Friday’s US employment report for July will be crucial for the metal amid mixed concerns at the Fed and economic slowdown woes.
- AUD/USD reverses intraday losses while taking rounds to six-week high.
- Bullish MACD signals, firmer RSI favor upside momentum but descending trend line from April tests buyers.
- Sellers need to four-month-old previous resistance line to retake control.
AUD/USD remains firmer around 0.6980-90 even as bulls struggle to refresh their monthly high during early Monday morning in Europe. In doing so, the Aussie pair seesaws between the 50-DMA and a downward sloping resistance line from April 21.
Given the bullish MACD signals and the firmer RSI (14), not overbought, coupled with the pair’s successful trading above a descending resistance line from early April, now support around 0.6920, the AUD/USD pair is likely to advance further.
However, a daily closing beyond the aforementioned resistance line, near 0.7015 by the press time, appears necessary for the bulls to keep reins.
Following that, the pair’s run-up towards the mid-June swing high of 0.7070 and then to June’s monthly peak surrounding 0.7285 can be expected.
On the flip side, the 50-DMA and the resistance-turned-support line, respectively near 0.6970 and 0.6920, restrict short-term AUD/USD downside.
In a case where the pair remains weak past 0.6920, lows marked during June and May, close to 0.6850 and 0.6830 in that order, will be important to watch for the pair sellers.
AUD/USD: Daily chart
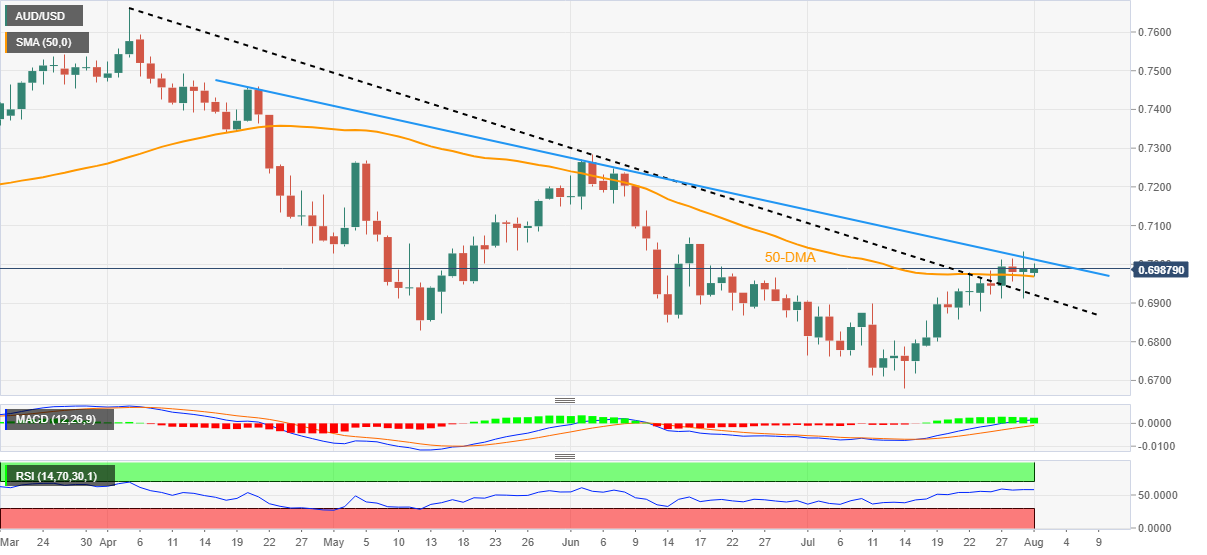
Trend: Further upside expected
- GBP/USD is likely to find support around 1.2180 as DXY is expected to drop further.
- The BOE is expected to increase interest rates by 5 basis points (bps) this week.
- An underperformance is expected from the US NFP as US techs have halted their recruitment process.
The GBP/USD pair has witnessed a minor pullback after hitting a high of 1.2198 in the Asian session. The asset is likely to find a cushion of around 1.2180 as investors are expecting one more rate hike by the Bank of England (BOE) this week.
The BOE is likely to elevate its interest rates by 25 basis points (bps) as the downbeat UK economic situation is not supporting the BOE to go all in and elevate interest rates with a higher rate extent unhesitatingly. The major catalysts which are restricting the BOE to elevate interest rates is the lower Average Hourly Earnings data.
Price pressures are soaring in the UK economy. The inflation rate has reached to 9.4% and has not displayed any exhaustion signals yet. Therefore, the market participants are expecting that the inflation rate could punch the two-digit figure. In times when inflation is soaring, earnings by the households have tumbled and more rate hikes could trim job opportunities significantly.
Meanwhile, the US dollar index (DXY) is likely to extend losses if the asset drops below Monday’s low at 105.63. This week, the release of the US Nonfarm Payrolls (NFP) holds significant importance. As per the market consensus, the US economy has added 250K jobs in the labor market against the prior release of 372k. A downbeat performance is expected from the economic data as various US tech companies have halted their recruitment process. Also, the Unemployment Rate is seen stable at 3.6%.
- USD/IDR rebounds from five-week low, snaps three-day downtrend.
- Indonesia Inflation rose the most since late 2015 in July, Core Inflation also increased in the said month.
- US dollar pares recent losses amid sluggish markets, cautious sentiment ahead of key data/events.
USD/IDR marches towards $14,900 amid the initial hours of Monday’s Asian session. In doing so, the Indonesia rupiah (IDR) pair marks the first daily gains in four while bouncing off a five-week low printed the previous day.
In doing so, the USD/IDR pair pays little heed to Indonesia’s headlines Inflation data for July. As per the latest data, Indonesia Consumer Price Index (CPI) for July, the headline inflation gauge rallied 4.94% YoY versus 4.82% expected. Further details suggest that the Core CPI rose 2.86% versus 2.85% market consensus.
It’s worth noting that Indonesia’s Inflation data marked the biggest jump in price pressure in seven years.
The same should have ideally weighed on the USD/IDR prices amid hopes of further rate hikes from the Indonesia central bank, namely the Bank Indonesia (BI). However, the US dollar’s rebound and a light calendar appeared to have favored the pair’s recovery of late.
That said, Indonesia’s 10-year bond yields dropped to the lowest levels since June 08, around 7.11% by the press time, which in turn favored USD/IDR prices of late.
Moving on, ISM Manufacturing PMI for July, expected at 52 versus 53 prior, could direct immediate USD/IDR moves ahead of Friday’s US jobs report.
Technical analysis
USD/IDR recovers from the 50-DMA support surrounding $14,800 but the recovery moves need validation from mid-July’s swing low surrounding $14,940.
- USD/JPY consolidates recent losses around the lowest levels since mid-June, prints four-day downtrend.
- Oversold RSI, key Fibonacci retracement levels challenge bears.
- Bulls need to cross 200-SMA to retake control.
USD/JPY pares intraday losses during the four-day downtrend around 132.55-60. Even so, the yen pair holds onto the bearish breakdown amid Monday’s mid-Asian session.
Given the oversold RSI conditions, the quote’s corrective pullback towards the 38.2% Fibonacci retracement (Fibo.) of May 24 to July 14 upside, around 134.40, appears likely.
However, the previous support line from June 06 and the 200-SMA, respectively near 135.45 and 136.20, could challenge the USD/JPY buyers afterward.
It’s worth noting that a three-week-old horizontal resistance area near 137.45-50 appears the last defense for USD/JPY bears.
Meanwhile, the pair’s further downside could aim for the 50% and the 61.8% Fibonacci retracement support levels, around 132.85 and 131.30 in that order.
If at all the USD/JPY prices fail to rebound from 131.30, the 130.00 threshold could act as the additional filter to the south before directing the pair towards May’s low around 126.35.
Overall, USD/JPY remains bearish but a short-term corrective pullback can’t be ruled out.
USD/JPY: Four-hour chart
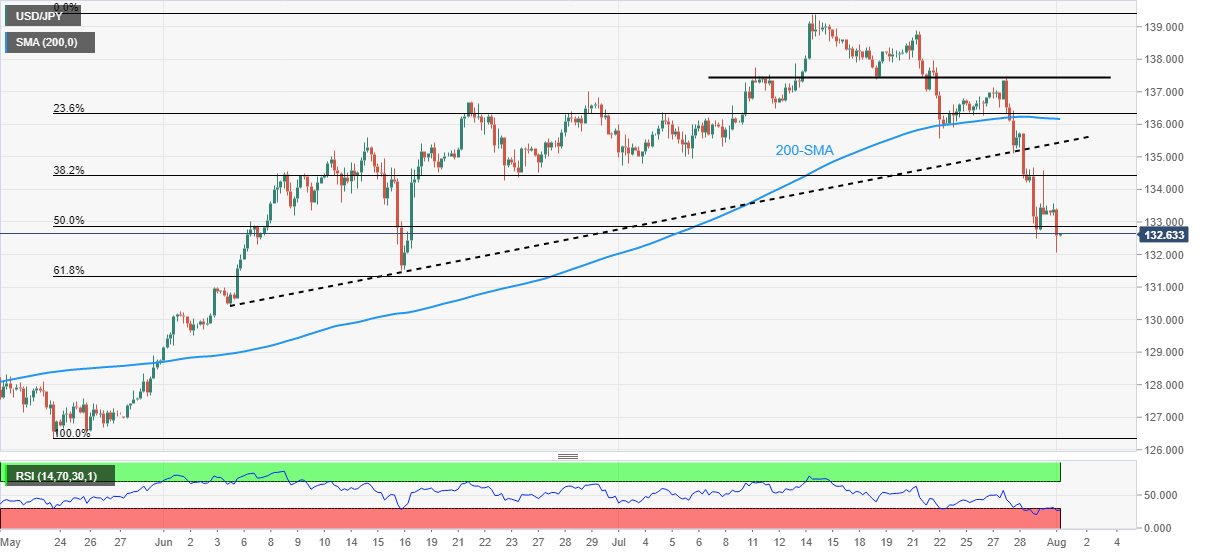
Trend: Bearish
- USD/INR is diving sharply towards 79.00 ahead of the RBI MPC meeting this week.
- A mixed performance is expected from the US ISM PMI data.
- Oil prices are declining towards $95.00 on deepening recession fears.
The USD/INR pair is declining sharply at open as investors are gearing up for a two-day monetary policy committee (MPC) by the Reserve Bank of India (RBI) this week. The asset is scaling lower towards the round-level of support of 79.00 and may remain volatile as the RBI is intended to elevate the repo rate to contain the inflation mess.
The inflation rate has reached 7% in India and households are facing severe heat. It is expected that the RBI will elevate the repo rate by 25-50 basis points (bps). RBI Governor Shaktikanta Das is committed to cooling off the inflation heat and a rate hike by 50 bps will drive the repo rate to 5.40%.
On the dollar front, the US dollar index (DXY) has rebounded after diving to near weekly lows at 105.54. The DXY is expected to face an immediate hurdle of around 105.80 and may remain sideways as investors are awaiting the release of the US Institute of Supply Management (ISM) data. An underperformance is expected from the Manufacturing PMI as the economic data is seen at 52, lower than the prior release of 53.
However, the release of the downbeat US ISM Services New Orders Index data may delight DXY investors. The US ISM New Orders Index is seen at 52, significantly higher than the prior release of 49.2. The corresponding data reflects the forward demand by the households and eventually, a higher New Orders Index indicates higher demand ahead.
On the oil front, the oil prices are declining towards 95.00 as recession risk is getting deeper and the global growth forecast is getting thinner. The black gold is expected to remain subdued on downbeat Caixin Manufacturing PMI data. The economic data has landed at 50.4, lower than the estimates of 51.5 and the prior release of 51.7.
Analysts at National Australia Bank (NAB) offer a sneak peek at what to expect from Tuesday’s Reserve Bank of Australia’s (RBA) monetary policy decision.
Key quotes
“The RBA meets on Tuesday and is expected to deliver another 50bp hike, taking the cash rate to 1.85% and its highest since April 2016.”
“A 50bp hike is an overwhelming consensus (22 of 23 analysts surveyed) and 47bp is currently priced by markets.”
“The possibility of a larger hike of >50bps though cannot be entirely ruled out.”
On RBA's Statement on Monetary Policy due Friday, “a full forecast update comes Friday in the August SoMP. The RBA will have to lift its inflation profile and lower its near-term unemployment projection with the focus on whether the forecasts show a credible path back to at target inflation.”
The Japanese media outlet, Jiji press, reported that the country’s Labor ministry will resume talks on the stalled minimum wage talks on Monday. The minimum wage is being considered to rise from JPY 28 to JPY 30.
Key details
“A subcommittee of the Central Minimum Wages Council, which advises the labor minister, will meet to discuss minimum wages for fiscal 2022, which started in April.”
“The focus is on whether management and labor representatives can bridge gaps between them regarding the sizes of pay increases and the basis for calculations.”
“Both sides agree on the necessity of raising minimum wages amid inflation. Many small businesses, however, are financially weak due to higher materials costs.”
Market reaction
At the time of writing, USD/JPY is consolidating the latest decline to 132.09. The pair is trading at 132.58, still down 0.45% on the day.
- Gold prints the first daily loss in four as it print mild losses around one-month high.
- USD bear’s pause, hawkish Fedspeak and cautious mood ahead of key data/events probe metal buyers.
- Sellers need validation from US ISM Manufacturing PMI but NFP is the key.
Gold price (XAU/USD) prints mild losses around a one-month high as bulls take a breather after posting the biggest weekly jump in nearly five months. That said, the yellow metal drops 0.25% intraday while snapping a three-day uptrend around $1,760 during early Monday morning in Europe.
The metal’s latest losses could be linked to the US dollar’s pause around the one-month low, during the four-day downtrend. That said, the US Dollar Index (DXY) bounces off its intraday low to 105.80 by press time.
The greenback’s rebound could be linked to the market’s sour sentiment amid the fresh US-China tussles over Taiwan. Also likely to have stopped the US dollar bears could be the latest hawkish comments from Minneapolis Fed President Neil Kashkari and a firmer print of the Fed’s preferred inflation gauge. Additionally, the cautious mood ahead of Friday’s key US Nonfarm Payrolls (NFP) and downbeat prints of China’s PMIs for July are also likely to have weighed on the gold prices.
On the other hand, the US “technical recession” and previous comments from Fed Chair Jerome Powell suggest that the US central bank runs out of steam for aggressive rate hikes. Additionally, the month-end consolidation of the US dollar could also be held responsible for the gold price recovery.
Amid these plays, the US Treasury yields recovered to 2.67%, up three basis points (bps) but S&P 500 Futures print mild losses around 4,110 at the latest.
Given the market’s mixed concerns and the XAU/USD pullback, risk catalysts could entertain traders ahead of the US ISM Manufacturing PMI for July, expected at 52 versus 53 prior. That said, the metal traders are likely to remain cautious ahead of Friday’s US Nonfarm Payrolls (NFP) for July considering the calls for neutral rates and US recession chatters.
Technical analysis
Gold price stays above the previous resistance line from June 13 despite the recent pullback, which in turn joins bullish MACD signals and a firmer RSI line to keep buyers hopeful unless the quote drops below the resistance-turned-support line near $1,740.
Even if the XAU/USD sellers break the $1,740 support, a one-week-old ascending trend line near $1,732, could challenge the metal’s further downside before directing it to the yearly low near $1,680.
During the fall, Wednesday’s swing low around $1,711 and the $1,700 threshold could entertain the gold bears.
Alternatively, the gold price remains on the way to a downward sloping resistance line from April 18, close to $1,780 by the press time. However, the 50-DMA level surrounding $1,795 could challenge the metal buyers afterward.
Gold: Daily chart
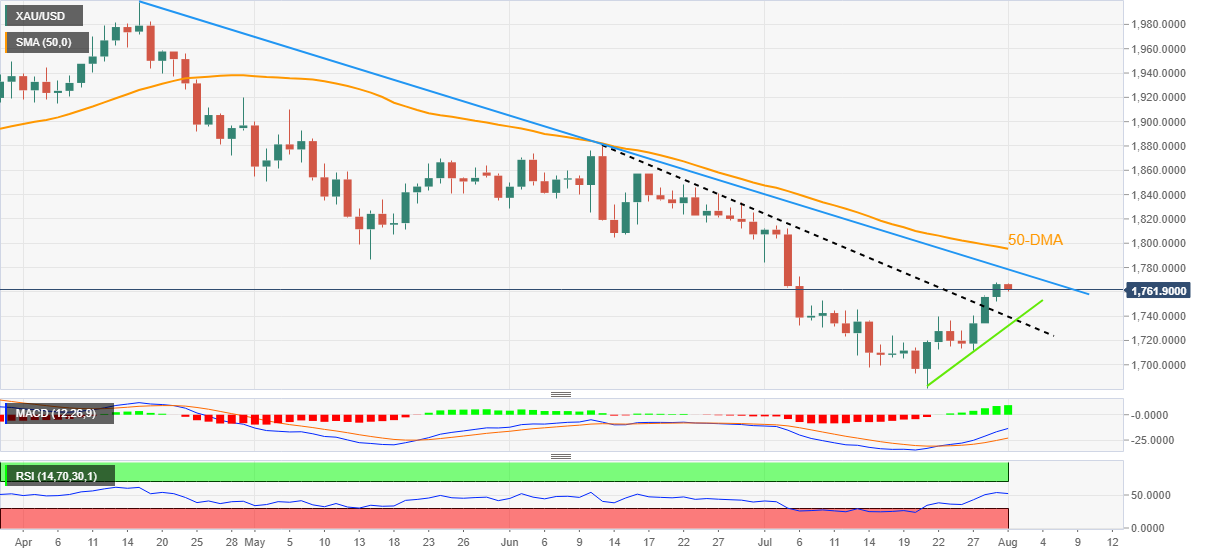
Trend: Further upside expected
- EUR/USD has found an immediate hurdle around 1.0250 as DXY displays signs of recovery.
- The US ISM Manufacturing PMI is expected to remain subdued while New Orders Index may outperform.
- A downbeat Eurozone Retail Sales may impact the shared currency bulls.
The EUR/USD pair has sensed offers while attempting to kiss the immediate hurdle of 1.0250 in the Asian session. The asset has remained sideways in a wide range of 1.0100-1.0260 over the past two weeks and is likely to confuse the market participants further.
In today’s session, the entire focus of investors will remain on the US Institute of Supply Management (ISM) data. The ISM Manufacturing PMI is likely to shift lower to 52 from the prior release of 53. A drop in Manufacturing PMI indicates that vigorous interest rates elevation by the Fed has started displaying its consequences, however, inflation has not got caught now, which is a big reason to worry.
While the US ISM New Orders Index is warranting a decent improvement as the economic data is seen higher at 52 vs. the prior release of 49.2. This displays that the guidance for consumer spending is gaining sharply higher despite the runaway inflation.
Meanwhile, the US dollar index (DXY) has attempted a rebound near the prior week's low of 105.54. The DXY is expected to remain subdued as recession signals in the US are accelerating.
On the eurozone front, investors are awaiting the release of the Retail Sales this week. As per the market consensus, the eurozone Retail Sales is seen at -1.6%, significantly lower than the prior release of 0.2% on an annual basis. Investors are aware of the fact that the inflation rate is accelerating and on that front, the Retail Sales data should be upbeat as the households are paying more consumption keeping the quantity constant.
- A vertical downside move is expected to be followed by a pullback move.
- Declining 20-and 50-EMAs signal more weakness ahead.
- The RSI (14) has shifted into a bearish range of 20.00-40.00, which adds to the downside filters.
The AUD/JPY pair has attempted a rebound after printing a low of 92.29 in the Asian session. Earlier, the asset delivered a downside break of the inventory distribution formed in a range of 92.86-93.37 on Friday. This resulted in a steep fall for the asset. On a broader note, a successful re-test of the July 20 high at 95.67 on Tuesday resulted in a nosedive move in the asset.
Usually, a steep fall in an asset is followed by a pullback move as investors liquidate their shorts due to profit booking and some investors prefer to enter again at a pullback and capitalize on the move as a bargain sell. On the hourly scale, the potential horizontal support is plotted from July 12 low at 91.96.
The 20-and 50-period Exponential Moving Averages (EMAS) at 93.06 and 93.56 respectively are scaling downside vigorously, which adds to the downside filters.
Also, the Relative Strength Index (RSI) (14) has shifted into the bearish range of 20.00-40.00, which indicates more pain ahead.
A pullback move towards the 20-EMA at 93.06 will be a bargain sell for the market participants, which will drag the asset towards Monday’s low and the potential support at 92.29 and 91.96 respectively.
Alternatively, the aussie bulls would regain some strength if the asset oversteps the 50-EMA confidently at 93.56. This will send the asset towards July 25 low at 93.90, followed by July 26 low at 94.57.
AUD/JPY hourly chart
-637949192624800019.png)
“We are preparing to issue a notice of intent to determine whether to activate the domestic gas security mechanism,” said Australian Resource Minister Madeleine King.
In this regard, Reuters mentioned that Australia's competition watchdog urged the federal government on Monday to consider curbing gas exports, warning its east coast could face a major shortfall next year which would pose a substantial risk to the country's energy security.
On the same line, Goldman Sachs expects a 25% chance of a recession in Australia over the next 12 months.
The news should exert downside pressure on AUD/USD prices. However, softer US dollar and the market’s cautious mood ahead of Tuesday’s RBA, as well as Friday’s US NFP also seem to favor AUD/USD prices.
Also read: AUD/USD retreats towards 0.6950 on softer China Caixin Manufacturing PMI, US data, RBA eyed
| Raw materials | Closed | Change, % |
|---|---|---|
| Silver | 20.356 | 1.93 |
| Gold | 1765.94 | 0.61 |
| Palladium | 2114.87 | 1.78 |
- NZD/USD bulls take a breather on China’s downbeat private PMI data for July.
- Risk-aversion, USD bear’s pause also challenge the Kiwi bulls.
- US ISM Manufacturing PMI will decorate daily calendar but employment numbers from New Zealand, US eyed for clear directions.
NZD/USD struggles to extend the day-start run-up after China flashed softer private activity numbers for July during Monday’s Asian session. Also weighing on the Kiwi pair is the market’s sour sentiment and cautious mood ahead of the key data from New Zealand and the US. Even so, the quote remains firmer around 0.6295 while being the biggest gainer among the G10 currency pairs by the press time.
That said, China’s Caixin Manufacturing PMI for July eased to 50.4 versus 51.5 expected and 51.7 prior. In doing so, the private activity gauge from China tracked the official PMIs, published during the weekend. It’s worth noting that China’s NBS Manufacturing PMI dropped back into contraction after the previous monthly improvement, down to 49.0 versus 50.4 expected and 50.2 prior. Further, the Non-Manufacturing PMI rose past 52.3 market forecast to 53.8, against 54.7 in previous readouts.
Earlier in the day, New Zealand’s seasonally adjusted Building Permits dropped 2.3% for June versus -0.3% market forecast and -0.5% prior readings.
It should be observed that hawkish concerns surrounding the Reserve Bank of New Zealand’s (RBNZ) rate hike trajectory and the US dollar’s latest weakness, amid “technical recession” and downbeat comments from Fed Chair Jerome Powell, seem to have favored NZD/USD bulls. On the same line could be the comments from global rating agency Fitch suggesting more stimulus from China. “China to roll out financial tools to boost infrastructure investment,” said Fitch.
On a different page, China’s warning to the US administration over House Speaker Nancy Pelosi’s visit to Taiwan, as well as fears that Beijing’s stimulus won’t be enough to renew economic recovery, appeared to have weighed on the AUD/USD prices. Further, comments from Minneapolis Fed President Niel Kashkari and the Fed’s preferred inflation gauge appeared to have probed the greenback bears of late. “The fed is still a long way away from backing off rate hikes,” said Fed’s Kashkari to the New York Times (NYT). The policymaker added, “Hiking rates by half a point at coming Fed meetings seems reasonable to me.” Furthermore, the US Core Personal Consumption Expenditures (PCE) Price Index, the Fed's preferred gauge of inflation, rose to 4.8% YoY for June versus 4.7% prior.
Against this backdrop, the S&P 500 Futures print mild losses but the US Treasury yields consolidate a recent fall around 2.66%, up two basis points (bps), to portray the sour sentiment and underpin the US dollar’s rebound.
Having witnessed a minor reaction to China’s PMIs and risk-aversion wave, NZD/USD traders will keep their eyes on the US ISM Manufacturing PMI for July, expected at 52 versus 53 prior, for intraday directions. However, major attention will be given to Wednesday’s New Zealand jobs report and Friday’s US Nonfarm Payrolls (NFP).
Technical analysis
Although a clear upside break of the downward sloping resistance line from late April, now support around 0.6260, and keeps buyers hopeful, the 50-DMA level of 0.6305 tests the upside momentum of late.
- AUD/NZD was pressured following a poor outcome in China data.
- Caixin China Manufacturing PMI has missed the mark.
AUD/NZD is under some pressure as the Tokyo day moves along and following a miss in the Caixin China Manufacturing PMI has been released as follows:
- July: 50.4 (exp 51.5; prev 51.7).
AUD/NZD is trading in the red and has made a low of 1.1090 so far from 1.1113 the high. The Aussie is taking the brunt of the data that is showing that "the recovery in supply and demand failed to spill over into the labour market for manufacturing, which continued to shrink," said Wang Zhe, senior economist at Caixin Insight Group.
"Companies, strongly inclined to lower costs in the face of sluggish market demand, were cautious about expanding their staff," Wang added.
AUD/NZD weekly chart
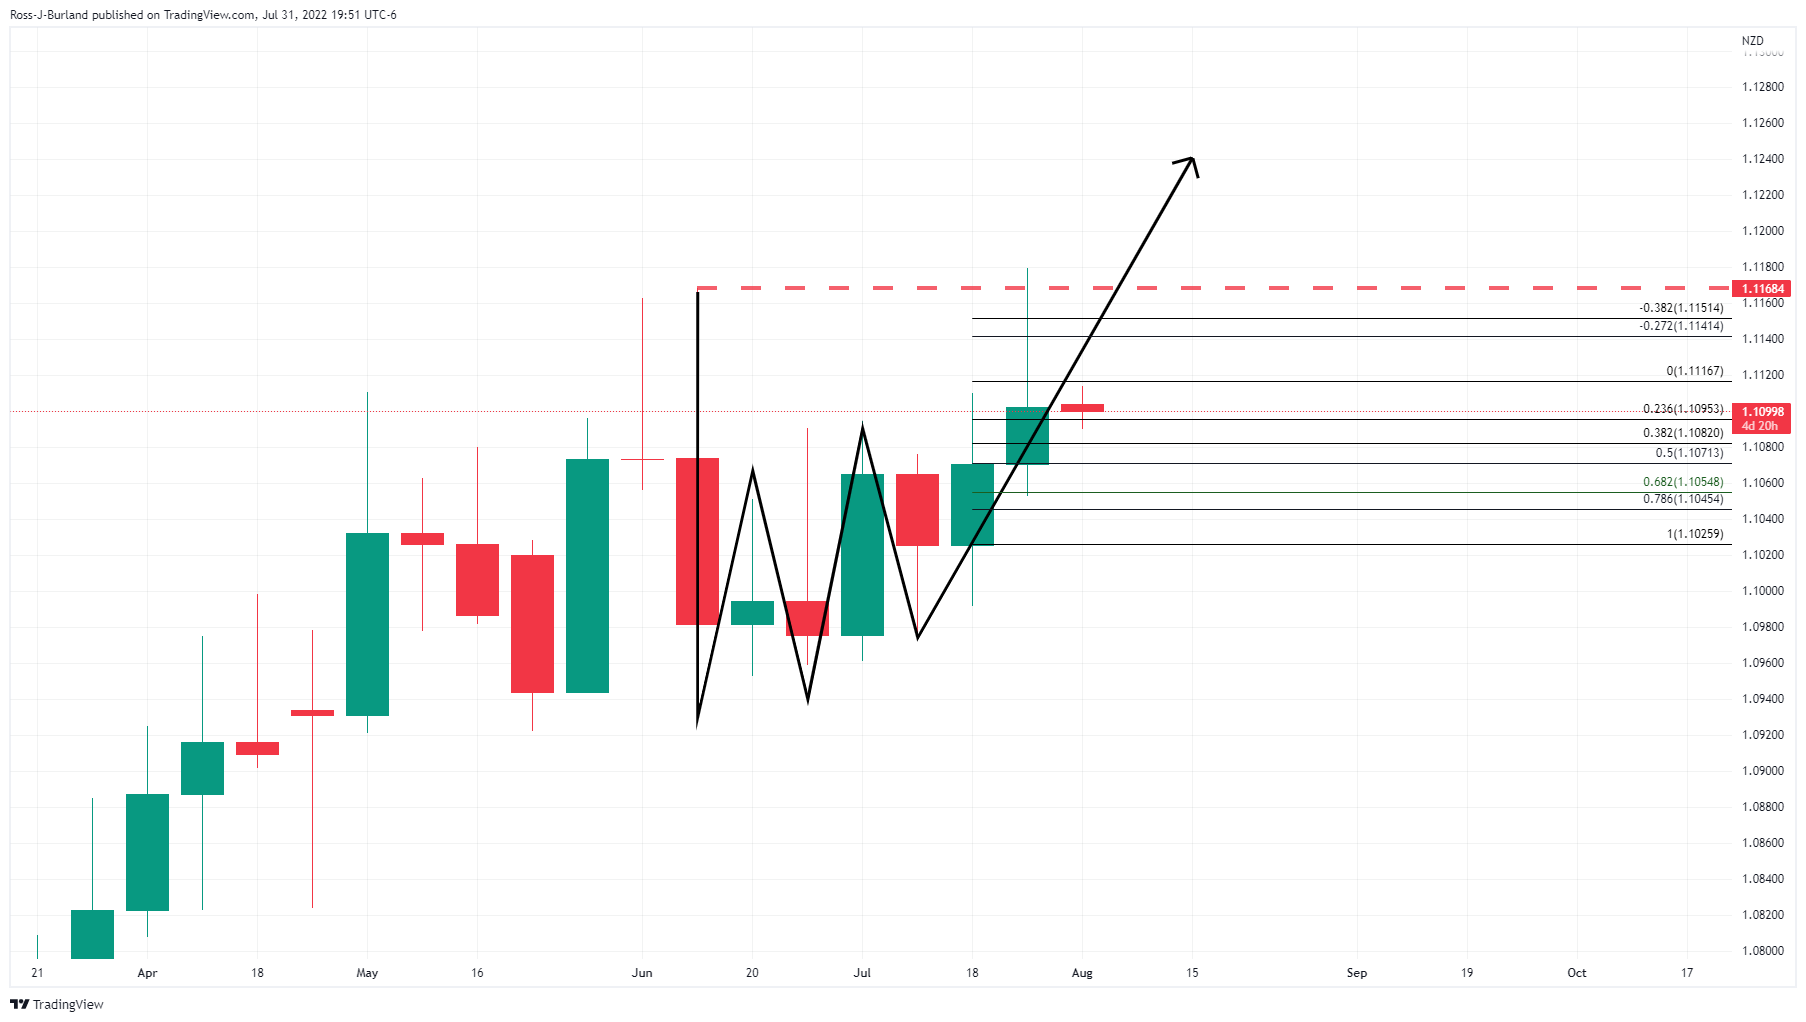
From a weekly perspective, the price has started to recover from the restest of the W-formation's neckline and bulls eye a move towards 1.1168 prior highs. However, the daily chart is not showing any signs of a bullish correction as of yet, although the 61.8% Fibo may prove to be a support in the coming sessions:
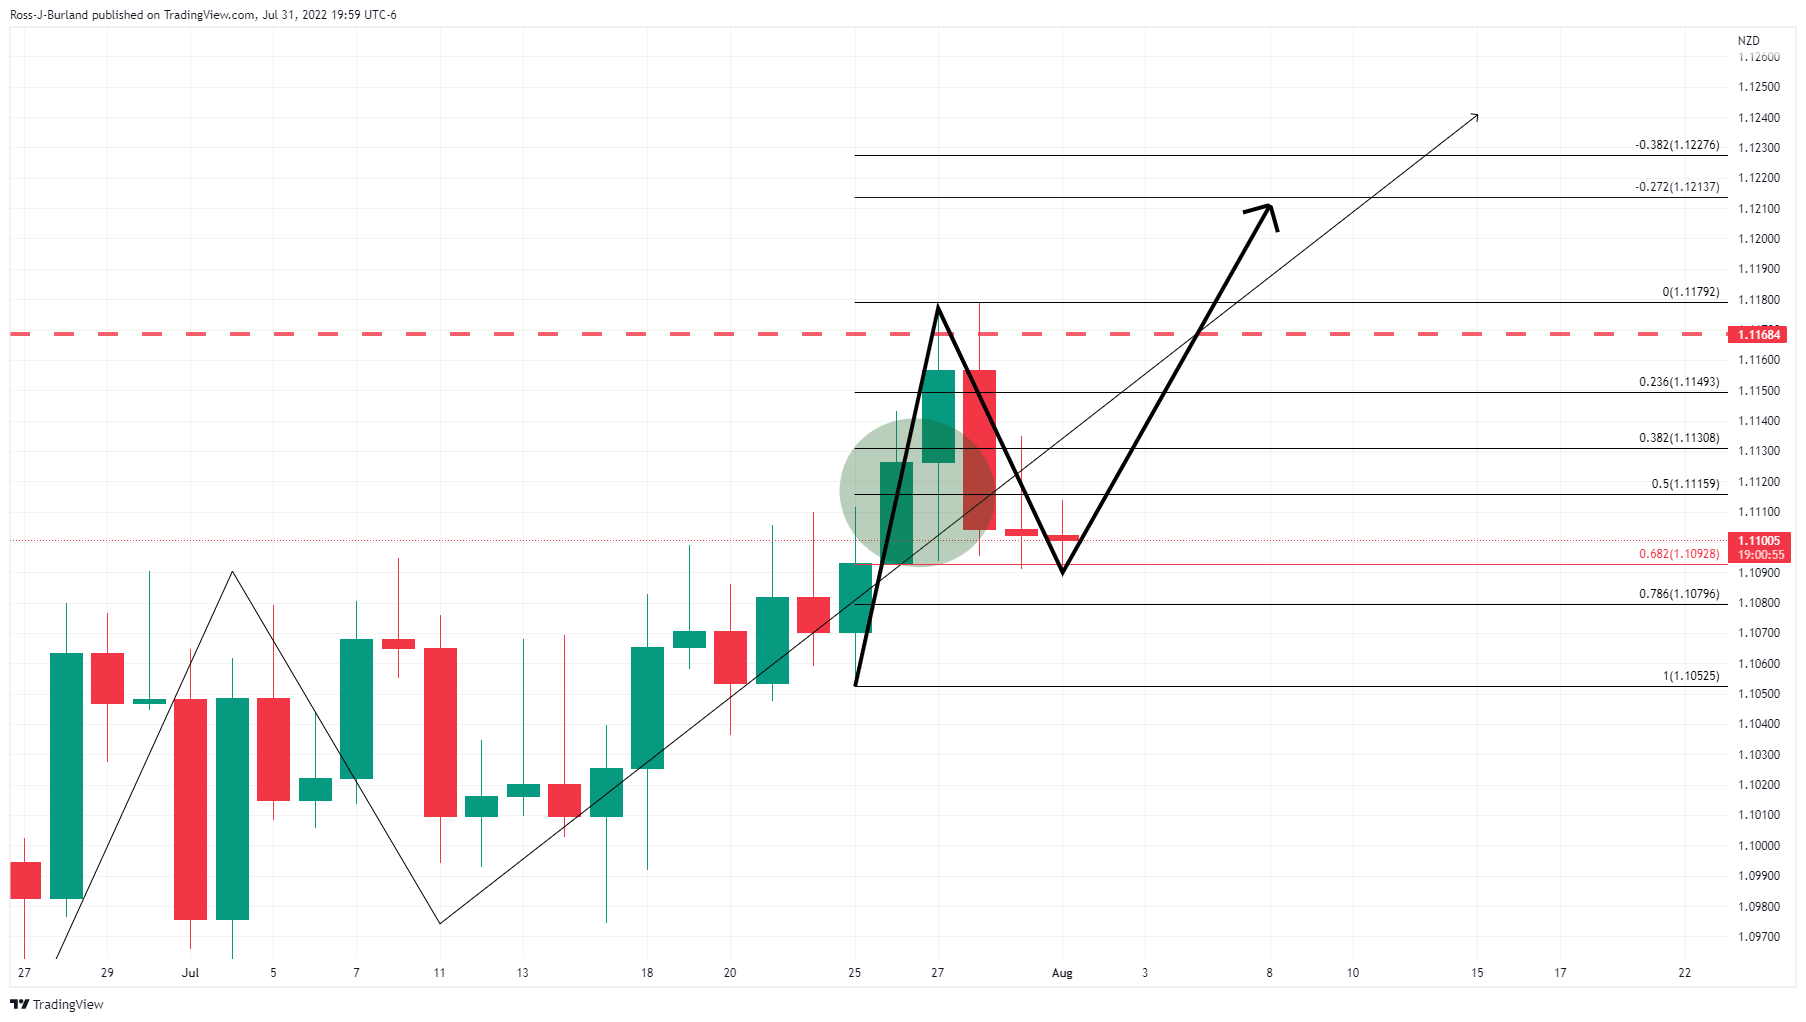
- AUD/USD pares daily gains amid softer China data.
- China’s Caixin Manufacturing PMI tracked official NBS Manufacturing in July.
- Concerns over Australia’s gas supplies, mixed PMIs and the US-China tussles also probe buyers.
- US ISM Manufacturing PMI could entertain traders but RBA, US NFP are the key.
AUD/USD reverses the mid-Asian session’s rebound as it drops to 0.6980 after China’s downbeat Caixin Manufacturing PMI for July. With this, the Aussie pair prints mild losses as it stays near the highest levels since mid-June.
China’s Caixin Manufacturing PMI for July eased to 50.4 versus 51.5 expected and 51.7 prior. During the weekend, China’s NBS Manufacturing PMI dropped back into contraction after the previous monthly improvement, down to 49.0 versus 50.4 expected and 50.2 prior. Further, the Non-Manufacturing PMI rose past 52.3 market forecast to 53.8, against 54.7 in previous readouts.
Earlier in the day, final prints of Australia’s S&P Global Manufacturing PMI confirmed the 55.7 mark but the prior readings were revised upwards to 56.2. That said, the TD Securities Inflation for the Pacific nation also improved during July, up 5.4% YoY versus 4.7% prior.
Furthermore, comments from global rating agency Fitch suggesting more stimulus from China also favored AUD/USD buyers before the data. “China to roll out financial tools to boost infrastructure investment,” said Fitch.
On the contrary, China’s warning to the US administration over House Speaker Nancy Pelosi’s visit to Taiwan, as well as fears that Beijing’s stimulus won’t be enough to renew economic recovery, appeared to have weighed on the AUD/USD prices. Further, comments from Minneapolis Fed President Niel Kashkari and the Fed’s preferred inflation gauge appeared to have probed the greenback bears of late. “The fed is still a long way away from backing off rate hikes,” said Fed’s Kashkari to the New York Times (NYT). The policymaker added, “Hiking rates by half a point at coming Fed meetings seems reasonable to me.” Furthermore, the US Core Personal Consumption Expenditures (PCE) Price Index, the Fed's preferred gauge of inflation, rose to 4.8% YoY for June versus 4.7% prior.
Amid these plays, the S&P 500 Futures print mild losses but the US Treasury yields consolidate a recent fall around 2.66%, up two basis points (bps), to portray the sour sentiment and underpin the US dollar’s rebound.
Looking forward, US ISM Manufacturing PMI for July, expected at 52 versus 53 prior, could direct immediate AUD/USD moves. Also important will be the headlines surrounding China and the market’s mood ahead of Tuesday’s Reserve Bank of Australia’s (RBA) monetary policy meeting.
Technical analysis
Despite the recent pullback, the 50-DMA level surrounding 0.6965 restricts AUD/USD pair’s immediate downside but the bears are likely to wait for a clear downside break of the 0.6905 support confluence, comprising the previous resistance line from April and 38.2% Fibonacci retracement (Fibo.) of June-July downside. That said, buyers may aim for the 61.8% Fibo. level near 0.7050 during the further upside.
The Caixin China Manufacturing PMI has been released as follows:
- July: 50.4 (exp 51.5; prev 51.7).
China's factory activity expanded at a slower pace in July, as growth momentum softened in output, new orders and employment, a private sector poll showed on Monday.
''China's major manufacturing hubs, including the commercial hub Shanghai, saw a solid rebound in June from widespread COVID lockdowns in spring, but the recovery has started to fade amid fresh virus flare-ups and weakening domestic and global demand, as well as a prolonged property market slump.
The findings were slightly better than the government's official PMI on Sunday that showed China's factory activity unexpectedly contracting in July. The Caixin survey is believed to focus more on smaller, export-oriented companies,'' Reuters reported.
The 50-point index mark separates growth from contraction on a monthly basis.
Meanwhile, AUD/USD is a touch softer on the data.
The pair has been pressured at the start of the week from 0.6990 to a low of 0.6986 so far.
About China Caixin PMI
The Caixin China Manufacturing PMI™, released by Markit Economics, is based on data compiled from monthly replies to questionnaires sent to purchasing executives in over 400 private manufacturing sector companies.
- WTI renews intraday low amid sour sentiment, anxiety ahead of Wednesday’s OPEC+ meeting.
- OPEC defends Russia’s membership to the cartel amid criticism over Moscow’s invasion of Ukraine.
- Recession woes join hawkish Fedspeak, mixed US data to roil the mood.
- Risk catalysts, US ISM Manufacturing PMI may entertain traders ahead of OPEC+, US NFP.
WTI crude oil prices refresh their daily low at around $96.50 during Monday’s Asian session. In doing so, the black gold justifies the market’s risk-aversion, as well as cautious sentiment ahead of this week’s meeting of the Organization of the Petroleum Exporting Countries (OPEC)and allies including Russia, a group known as OPEC+.
That said, OPEC’s defense of Russia’s membership in the OPEC+ group appeared to have recently favored the oil bears. During the weekend, OPEC Secretary General Haitham al-Ghais said Russia's membership in OPEC+ is vital for the success of the agreement.
Elsewhere, downbeat prints of China’s official NBS Manufacturing PMIs for July, to 49.0 versus 50.4 expected and 50.2 prior, join the fresh Sino-American tussles over Taiwan to roil the sentiment and exert downside pressure on oil prices. US House Speaker Nancy Pelosi begins her Asia visit but the schedule doesn’t mention her Taiwan visit The reason could be attributed to Beijing’s warnings. “Six people familiar with the Chinese warnings said they were significantly stronger than the threats that Beijing has made in the past when it was unhappy with US actions or policy on Taiwan,” said the Financial Times (FT).
Additionally, comments from Minneapolis Fed President Niel Kashkari and the Fed’s preferred inflation gauge appeared to have probed the greenback bears and challenged the oil’s rebound of late. “The fed is still a long way away from backing off rate hikes,” said Fed’s Kashkari to the New York Times (NYT). The policymaker added, “Hiking rates by half a point at coming Fed meetings seems reasonable to me.” Furthermore, the US Core Personal Consumption Expenditures (PCE) Price Index, the Fed's preferred gauge of inflation, rose to 4.8% YoY for June versus 4.7% prior.
On the same line, the “technical recession” in the US, as the Annualized readings of the US Q2 Gross Domestic Product (GDP) dropped for the second straight quarter, appeared to have also weighed on the energy benchmark.
While portraying the mood, the S&P 500 Futures print mild losses but the US Treasury yields consolidate a recent fall around 2.66%, up two basis points (bps).
Moving on, Wednesday’s OPEC+ verdict will be important for the WTI crude oil traders ahead of Friday’s US employment report for July. “Two of eight OPEC+ sources in a Reuters survey said a modest increase for September will be discussed at the Aug. 3 meeting, while the rest said output would likely be held steady,” said Reuters.
Technical analysis
WTI sellers approach a two-week-old ascending triangle formation’s support, near $95.25 by the press time. However, July 25 swing low around $92.40 will be a confirmation point for the “double top” bearish pattern.
Alternatively, recovery remains elusive until the quote crosses the aforementioned triangle’s upper line, also the “double top”, near $100.80-$101.00.
In recent trade today, the People’s Bank of China (PBOC) set the yuan (CNY) at 6.7467 vs. the previous fix of 6.7437 and the prior close of 6.7433.
About the fix
China maintains strict control of the yuan’s rate on the mainland.
The onshore yuan (CNY) differs from the offshore one (CNH) in trading restrictions, this last one is not as tightly controlled.
Each morning, the People’s Bank of China (PBOC) sets a so-called daily midpoint fix, based on the yuan’s previous day's closing level and quotations taken from the inter-bank dealer.
- USD/CAD pares the first daily gains in four inside a bullish chart formation.
- Steady RSI favors recent pullback but the key Fibonacci retracement level, triangle’s support could test bears.
- 200-SMA, 1.2775 act as additional trading filters as bulls retreat.
USD/CAD drops back to 1.2805 as it consolidates the first daily gains in four around the lowest levels in seven weeks, marked the previous day. In doing so, the Loonie pair stays inside a two-week-old descending triangle bullish chart pattern while recently fading the bounce off the 61.8% Fibonacci retracement (Fibo.) of June-July upside during Monday’s Asian session.
It’s worth noting that the steady RSI and the quote’s inability to keep the bounce off the key Fibo. level directs the intraday sellers towards retesting the 61.8% Fibonacci retracement support level surrounding 1.2785.
However, the pair’s downside past 1.2785 will be challenged by the stated triangle’s lower line, near 1.2775 by the press time.
In a case where the USD/CAD prices drop below 1.2775, the odds of witnessing a south-run towards breaking the 1.2700 threshold can’t be ruled out.
Alternatively, recovery moves need to cross the aforementioned triangle’s resistance line, at 1.2835 now.
Following that, the USD/CAD run-up could aim for the 200-SMA level surrounding 1.2935. However, the 1.3000 psychological magnet and a six-week-old horizontal resistance area near 1.3080-90 could challenge the pair’s upside past 1.2835.
USD/CAD: Four-hour chart
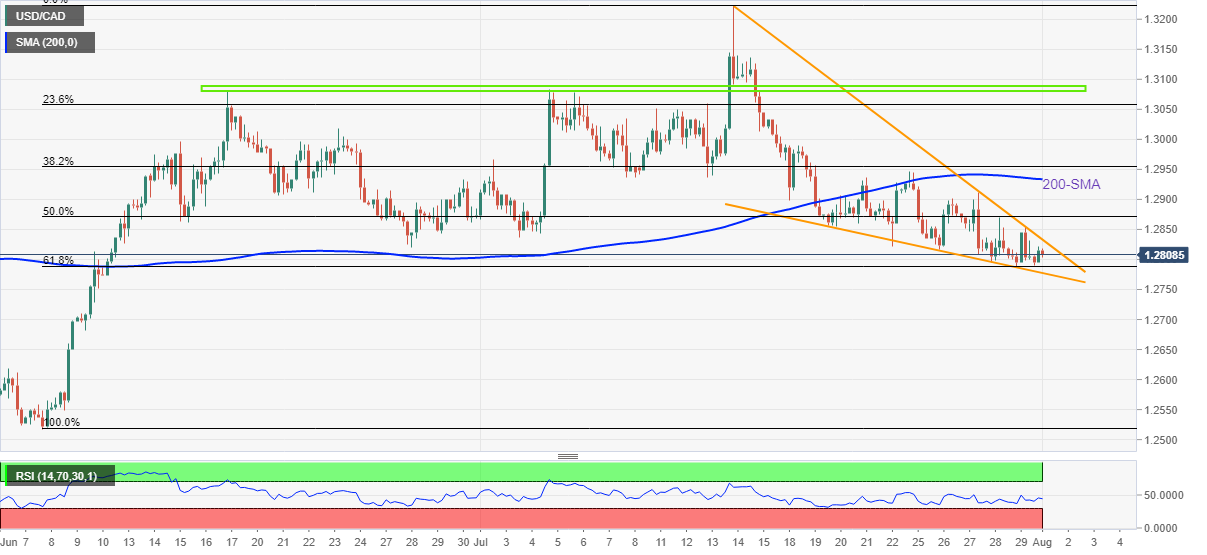
Trend: Limited downside expected
- AUD/NZD has rebounded firmly around the critical support of 1.0900.
- The RBA will elevate its interest rates by 50 bps to 1.85%.
- The NZ economy is likely to report upbeat employment data.
The AUD/NZD pair has rebounded sharply after slipping to near the critical support of 1.0900 in the Asian session. The asset has picked significant bids and a responsive buying action is in the making. Usually, a responsive buying action indicates heavy longs creation by the market participants when they found the asset a value bet.
The cross is fading the downside momentum as investors are expecting hawkish commentary from the Reserve Bank of Australia (RBA). RBA Governor Philip Lowe is expected to elevate its Official Cash Rate (OCR) consecutively for a third time by 50 basis points (bps). Price pressures are scaling higher in the Australian economy as the inflation rate has reached to 6.1% second quarter of CY2022. The inflation rate sees no exhaustion in its upside momentum yet as oil and food products prices are still volatile and are showing promising upside going ahead.
In today’s session, the release of the Caixin Manufacturing PMI data holds significant importance. The economic data is seen slightly lower at 51.5 from the prior release of 51.7. It is worth noting that Australia is a leading trading partner of China and a slump in Chinese manufacturing activities will affect the antipodean.
On the NZ front, kiwi bulls are awaiting the release of the employment data, which is due on Tuesday. The Unemployment Rate is likely to drop to 3.1% from the prior release of 3.2%. Apart from that the Employment Change may increase to 0.4% from the prior increase of 0.1%.
GBP/USD picks up bids to pare intraday losses around 1.2180 during the mid-Asian session on Monday. Even so, the cable pair remains sidelined on a day as the bulls take a breather after the two consecutive weekly run-up.
The quote’s recent inaction could be linked to the mixed sentiment in the options market ahead of the key Bank of England (BOE) monetary policy meeting and the US employment data for July.
That said, the one-month risk reversal (RR) for the GBP/USD, a difference between the call options and the put options, dropped for the second day by the end of Friday, to -0.030 at the latest. However, the weekly figures turned out to be impressive while posting the four-week uptrend, at 0.070 by the press time.
It should be noted that the recently mixed data from the US and chatters surrounding “technical recession”, as the Sino-American tussles over Taiwan, appears to test the GBP/USD prices as traders brace for another rate hike from the BOE.
Also read: GBP/USD oscillates near one-month high below 1.2200, BOE, US NFP in focus
- USD/JPY is under pressure in the Tokyo open.
- Bears breaking down the 133 doors to start the week in control.
USD/JPY has been as low as 132.81, falling from a high of 133.55 as bears seek to take the pair below the 133 figure at the start of the week while the Nikkei is trapped in a narrow opening range so far. The US dollar, meanwhile, is trading between a low of 105.78 and 106.025 as per the DXY, also pressured vs. a basket of currencies and weighing on USD/JPY.
The US dollar has been pushed and pulled into and post the Federal Reserve following when the central bank hiked rates by 75bp at its July meeting, taking the policy target range to 2.25%-2.50%. While Fed Chair Powell indicated that there remains significant additional tightening in the pipeline as the Fed remains focused on bringing down inflation, there was a dovish tilt to the meeting that pressured the US dollar and yields:
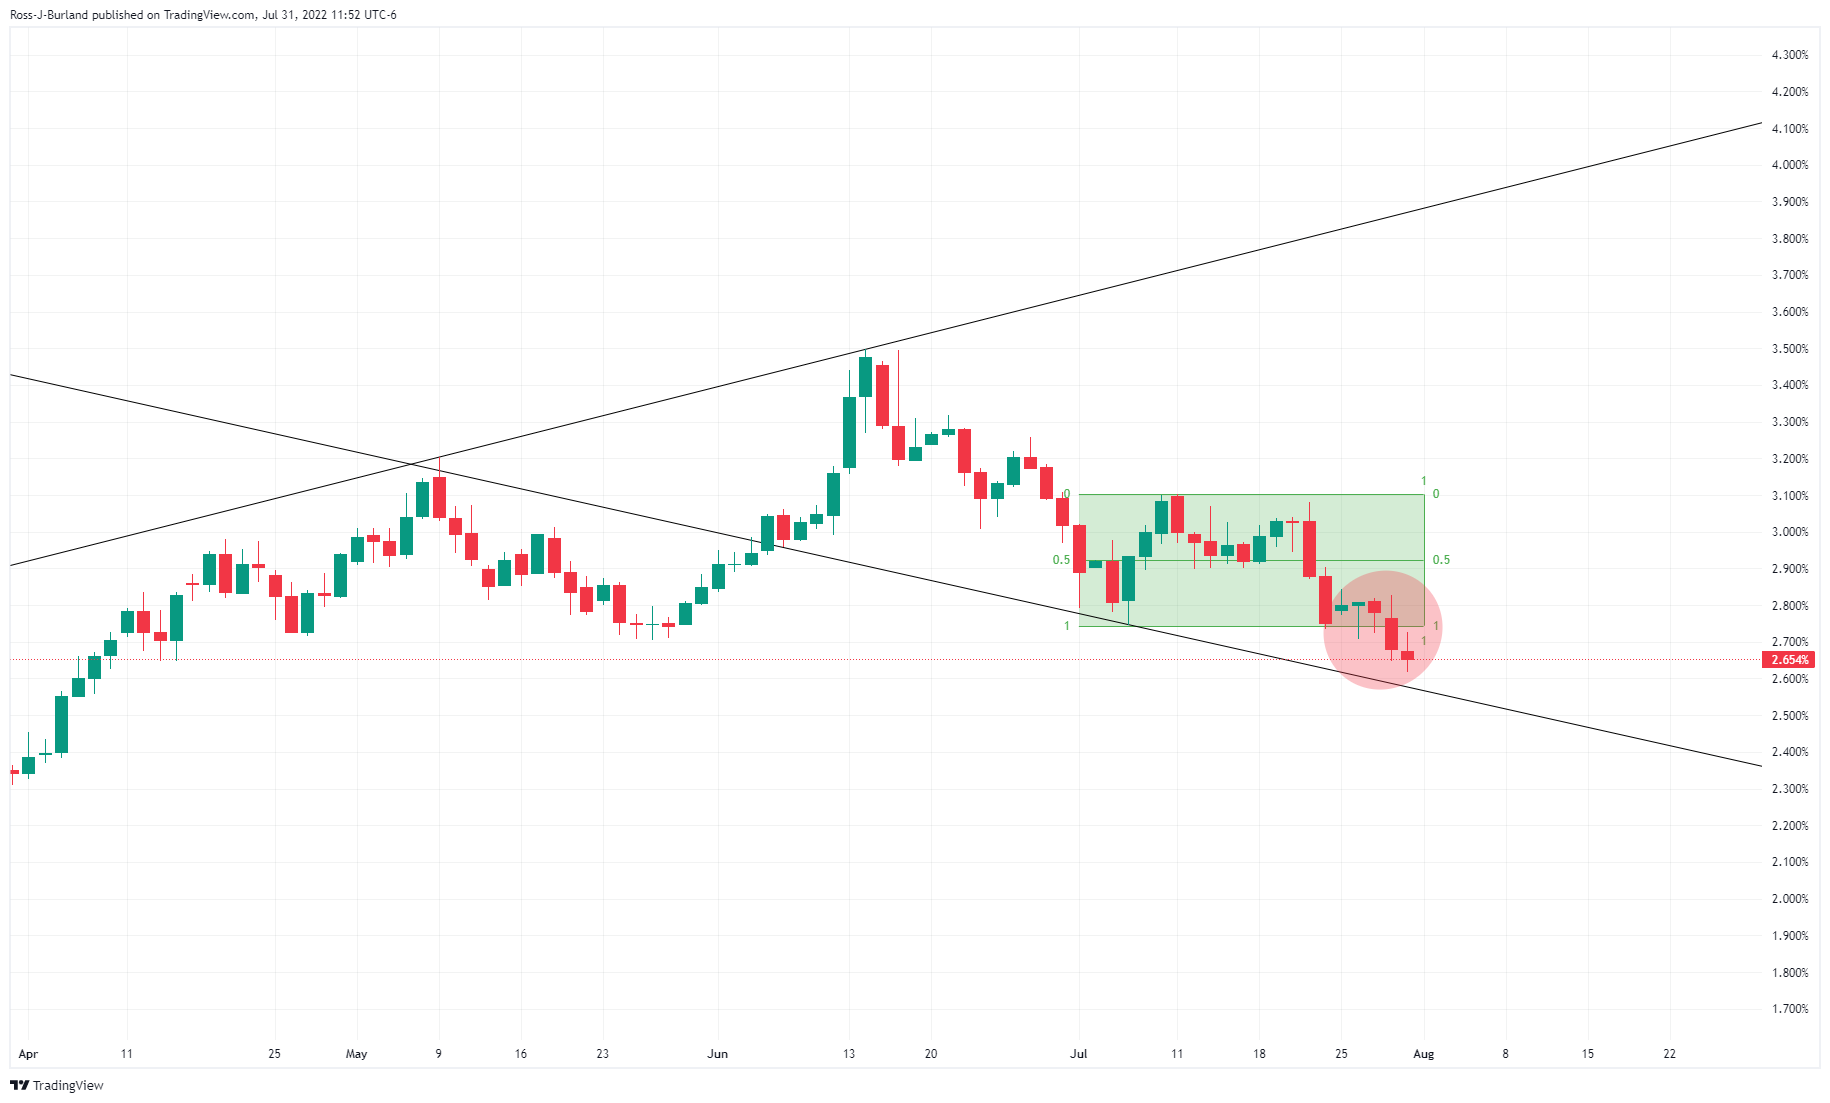
(10-year yields moving lower on the daily chart)
NFP in focus
This leaves the focus on US data. Since the meeting, growth numbers showed that the US economy contracted in Q2 for the second straight quarter, which is a textbook definition of a recession. Core PCE data for June and ECI data for Q2 showed price and wage inflation remain elevated and are a reminder that the Fed still has much to do.
For the week ahead, the main focus now will be this week's critical Nonfarm Payrolls jobs data. US employment likely continued to advance firmly in July, analysts at TD Securities said, but at a more moderate pace after four consecutive job gains at just below 400k in March-June. ''High-frequency data, including Homebase, still point to above-trend job creation. We also look for the UE rate to stay at 3.6% for a fifth straight month, and for wage growth to remain steady at 0.3% MoM (4.9% YoY).''
- AUD/USD fades bounce off intraday low, stays inside bullish chart pattern.
- 50-HMA, descending resistance line from Friday restrict immediate upside.
- 200-HMA adds strength to the bullish chart formation’s support.
AUD/USD remains mildly offered around 0.6980 as it consolidates recent gains near the monthly high. In doing so, the Aussie pair seesaws inside a one-week-old ascending trend channel during Monday’s Asian session.
Given the bearish MACD signals and the steady RSI (14), as well as a convergence of the 50-HMA and descending resistance line from Friday, AUD/USD prices may witness further downside.
However, a convergence of the 200-HMA and the aforementioned bullish channel, around 0.6940, appears a tough nut to crack for the AUD/USD bears.
Following that, the 50% Fibonacci retracement of July 14-29 upside, near 0.6855, could lure the pair sellers.
Alternatively, a clear upside break of the 0.6990 immediate resistance confluence will need validation from the 0.7000 threshold to recall the AUD/USD buyers.
Even so, the upper line of the stated channel, near 0.7040 by the press time, could challenge the pair’s further advances.
It should be noted that the AUD/USD pair’s upside past 0.7040 will push the buyers towards the mid-June swing high close to 0.7070.
AUD/USD: Hourly chart
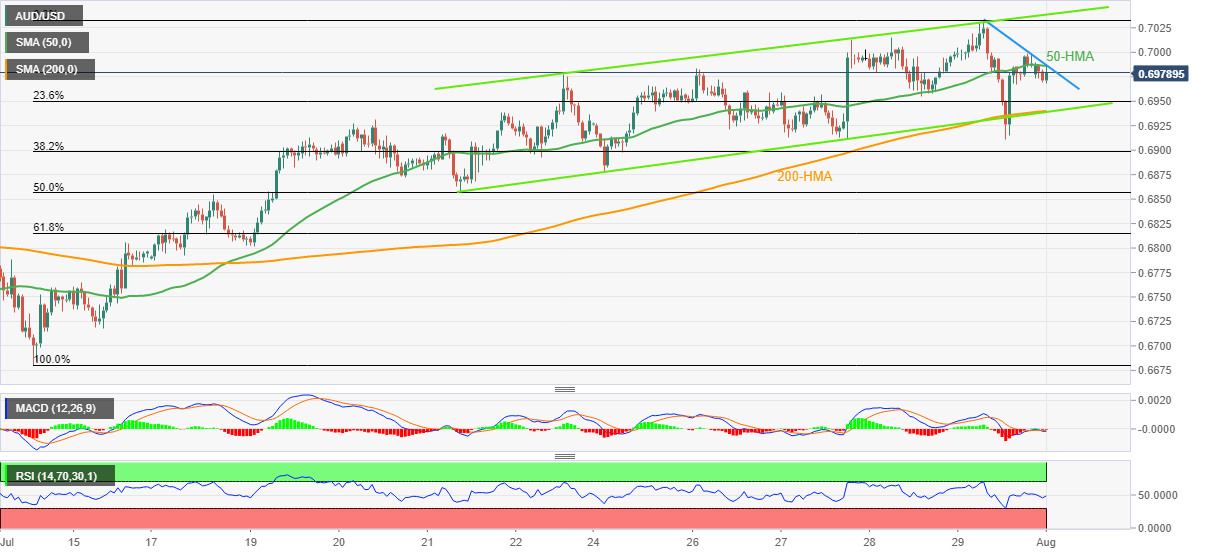
Trend: Limited weakness expected
- An establishment below 61.8% Fibo retracement adds to the downside filters.
- A Falling Channel formation has been favoring the yen bulls.
- Declining 20-and 50-EMAs signal more weakness ahead.
The EUR/JPY pair has attracted offers while attempting to contain the immediate hurdle of 136.33 in the early Tokyo session. The asset has displayed a bearish open rejection-reverse move as the asset has violated the opening price on the lower side after a mild upside move in the opening ticks. The cross is likely to violate the fresh two-month low at 135.55 and may renew a two-month low ahead. At the press time, the asset has surrendered the crucial support of 136.00 decisively.
On a four-hour scale, the asset has established below the 61.8% Fibonacci retracement (which is placed from May 12 low at 132.66 to June 8 high at 144.25) at 137.06. Usually, an establishment below 61.8% Fibo retracement indicates completion of the whole swing ahead.
Also, the asset is auctioning in a Falling Channel whose upper portion is placed from 142.32 while the lower portion is plotted from July 20 low at 140.43.
The 20-and 50-period Exponential Moving Averages (EMAS) at 137.00 and 138.22 respectively are scaling downside vigorously, which adds to the downside filters.
Also, the Relative Strength Index (RSI) (14) has shifted into the bearish range of 20.00-40.00, which indicates more pain ahead.
A decisive move below the two-month low at 135.55 will drag the cross towards May 25 low at 135.00, followed by May 20 low at 134.58.
On the flip side, the shared currency bulls could defend the downside momentum if the asset oversteps 61.8% Fibo retracement at 137.06. An occurrence of the same will drive the asset towards May 31 low at 136.80 and July 6 low at 137.27.
EUR/JPY four-hour chart
-637949111332558032.png)
| Index | Change, points | Closed | Change, % |
|---|---|---|---|
| NIKKEI 225 | -13.84 | 27801.64 | -0.05 |
| Hang Seng | -466.17 | 20156.51 | -2.26 |
| KOSPI | 16.23 | 2451.5 | 0.67 |
| ASX 200 | 55.5 | 6945.2 | 0.81 |
| FTSE 100 | 78.1 | 7423.4 | 1.06 |
| DAX | 201.94 | 13484.05 | 1.52 |
| CAC 40 | 109.29 | 6448.5 | 1.72 |
| Dow Jones | 315.5 | 32845.13 | 0.97 |
| S&P 500 | 57.86 | 4130.29 | 1.42 |
| NASDAQ Composite | 228.1 | 12390.69 | 1.88 |
- Gold price snaps three-day uptrend as it seesaws around monthly high, recently off intraday low.
- Risk appetite dwindles amid headlines surrounding China, pre-NFP anxiety.
- Recession fears, Fedspeak also contribute to the market’s indecision.
- US ISM Manufacturing PMI could decorate calendar ahead of the key Services PMI, jobs report for July.
Gold price (XAU/USD) remains pressured despite bouncing off the intraday low, down for the first time in four days, as buyers take a breather around the one-month peak. That said, the yellow metal recently rises to $1,763, after refreshing the intraday low to $1,760 during Monday’s Asian session.
The quote’s recent weakness could be attributed to the market’s cautious sentiment ahead of the key US employment report for July, as well as due to the fresh Sino-American tussles. Additionally, Friday’s upbeat prints of the Fed’s preferred inflation gauge and hawkish Fedspeak also weigh on the XAU/USD prices.
US House Speaker Nancy Pelosi begins her Asia visit but the schedule doesn’t mention her Taiwan visit The reason could be attributed to Beijing’s warnings. “Six people familiar with the Chinese warnings said they were significantly stronger than the threats that Beijing has made in the past when it was unhappy with US actions or policy on Taiwan,” said the Financial Times (FT).
That said, the US Core Personal Consumption Expenditures (PCE) Price Index, the Fed's preferred gauge of inflation, rose to 4.8% YoY for June versus 4.7% prior. Following that, Minneapolis Fed President Niel Kashkari mentioned to the New York Times (NYT) that the Fed is still a long way away from backing off rate hikes. The policymaker added, “Hiking rates by half a point at coming Fed meetings seems reasonable to me.”
It should be noted, however, that the recent fall in the US Treasury yields and firmer equities appear to have weighed on the US dollar, which in turn favors the gold price. Also, US Federal Reserve (Fed) Chairman Jerome Powell’s comments highlighting data-dependency and neutral rates joined the “technical recession” of the US to underpin the gold’s recovery in the last two weeks.
Amid these plays, the S&P 500 Futures print mild losses but the US Treasury yields consolidate a recent fall around 2.66%, up two basis points (bps).
Moving on, US ISM Manufacturing PMI for July, expected at 52 versus 53 prior, could direct immediate XAU/USD moves ahead of the US ISM Services PMI for the said month. Also important will be the Fedspeak and the headlines surrounding China. However, major attention will be given to Friday’s US Nonfarm Payrolls (NFP) amid calls for neutral rates and economic slowdown.
Technical analysis
The overbought RSI (14) appeared to have triggered the Gold price pullback after the previous week’s multiple failures to cross the 200-SMA.
However, a successful break of the downward sloping trend line from June 12, around $1,746 by the press time, keeps XAU/USD buyers hopeful.
Even if the metal prices drop below $1,746, a convergence of the 50-SMA and one-week-old support line, near $1,727, will be a tough nut to crack for short-term bears.
Alternatively, gold price run-up beyond the 200-SMA level surrounding $1,770 needs validation from July 01 low near $1,785 to convince buyers.
Following that, the 61.8% Fibonacci retracement of the June-July downturn, near $1,805, could challenge the XAU/USD bulls.
Overall, gold is likely to witness a pullback but the bears need to remain cautious until witnessing a sustained break of the $1,727 support.
Gold: Four-hour chart
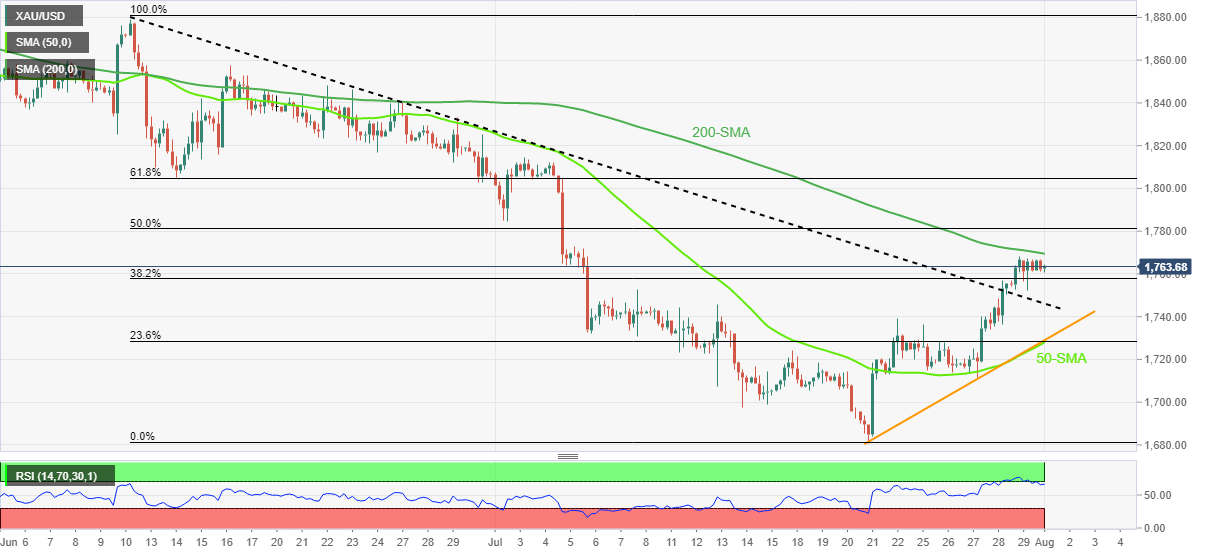
Trend: Pullback expected
| Pare | Closed | Change, % |
|---|---|---|
| AUDUSD | 0.69936 | 0.07 |
| EURJPY | 136.251 | -0.52 |
| EURUSD | 1.02265 | 0.33 |
| GBPJPY | 162.312 | -0.77 |
| GBPUSD | 1.2183 | 0.08 |
| NZDUSD | 0.62907 | 0.04 |
| USDCAD | 1.27982 | -0.09 |
| USDCHF | 0.95135 | -0.36 |
| USDJPY | 133.228 | -0.85 |
- GBP/JPY is likely to face barricades around 162.50 as the BOE sees an interest rate hike by 25 bps.
- UK’s Inflation rate has climbed to 9.4% and further elevation is on the cards.
- The BOJ is highly focused to elevate wage rate hikes to keep the inflation rate above 2%.
The GBP/JPY pair has witnessed a mild upside momentum and is marching towards 162.50 gradually. On a broader note, the asset has turned sideways after a downside move in a range of 161.88-162.68. An inventory distribution after a downside move empowers a fresh bearish impulsive wave. The cross will remain on edge as investors have shifted their focus toward the interest rate decision by the Bank of England (BOE).
The BOE will announce its interest rate decision on Wednesday and a rate hike by 25 basis points (bps) is expected by the market participants. A quarter-to-a-percent rate hike decision by BOE Governor Andrew Bailey will lift the interest rates to 1.5%.
It is worth noting the price pressures are highest in the pound area and the BOE has turned slow in announcing interest rate hikes. Also, the BOE is the first central bank that increased its rates for the first time after the pandemic.
The inflation rate in the sterling zone has climbed to 9.4% and further acceleration to a two-digit figure is imminent as price pressures have not displayed any signs of exhaustion yet.
On the yen front, On the Tokyo front, the announcement of helicopter money by the Japanese Ministry of Finance to combat rising oil and food products prices has surprisingly strengthened the yen bulls. The agency has announced a budget reserve of 257 billion Japanese yen. The Bank of Japan (BOJ) is committed to keeping the inflation rate above 2% and is focusing on elevating wage rate hikes to keep the former above-desired levels.
- DXY pares losses after two-week downtrend, remains pressured around one-month low.
- Cautious mood ahead of the key data, recent risk negatives underpin the corrective pullback.
- US ISM PMIs, headlines surrounding China may entertain intraday traders.
US Dollar Index (DXY) pauses the three-day downtrend around the monthly low, holding lower grounds near 105.80 during Monday’s Asian session. In doing so, the greenback gauge pares recent losses amid the market’s mildly downbeat mood, as well as cautious sentiment ahead of the key US employment report and ISM PMIs for July.
Firmer prints of the US Federal Reserve’s (Fed) preferred inflation gauge joined hawkish Fedspeak and recent fears from China to underpin the US dollar’s safe-haven demand.
Even if US House Speaker Nancy Pelosi begins her Asia visit, the schedule doesn’t mention Taiwan. The reason could be attributed to Beijing’s warnings. “Six people familiar with the Chinese warnings said they were significantly stronger than the threats that Beijing has made in the past when it was unhappy with US actions or policy on Taiwan,” said the Financial Times (FT).
That said, the US Core Personal Consumption Expenditures (PCE) Price Index, the Fed's preferred gauge of inflation, rose to 4.8% YoY for June versus 4.7% prior. Following that, Minneapolis Fed President Niel Kashkari mentioned to the New York Times (NYT) that the Fed is still a long way away from backing off rate hikes. The policymaker added, “Hiking rates by half a point at coming Fed meetings seems reasonable to me.”
It should be observed that US Federal Reserve (Fed) Chairman Jerome Powell’s comments highlighting data-dependency and neutral rates joined the “technical recession” of the US to weigh on the DXY in the last week.
While portraying the mood, the Wall Street benchmarks cheered the receding hawkish bias from the Fed but the US Treasury yields remained pressured as traders rush for risk safety amid recession fears. However, the S&P 500 Futures print mild losses at around 4,120 by the press time and portrays the sour sentiment, which in turn favors the US dollar of late.
Looking forward, US ISM Manufacturing PMI for July, expected at 52 versus 53 prior, could direct immediate DXY moves ahead of the US ISM Services PMI for the said month. Also important will be the Fedspeak and the headlines surrounding China. However, major attention will be given to Friday’s US Nonfarm Payrolls (NFP) amid calls for neutral rates and economic slowdown.
Technical analysis
A clear downside break of a two-month-old ascending trend line, now resistance around 106.85, directs the US Dollar Index bears toward an upward sloping support line from early February, close to 104.75 by the press time.


© 2000-2026. All rights reserved.
This site is managed by Teletrade D.J. LLC 2351 LLC 2022 (Euro House, Richmond Hill Road, Kingstown, VC0100, St. Vincent and the Grenadines).
The information on this website is for informational purposes only and does not constitute any investment advice.
The company does not serve or provide services to customers who are residents of the US, Canada, Iran, The Democratic People's Republic of Korea, Yemen and FATF blacklisted countries.
Making transactions on financial markets with marginal financial instruments opens up wide possibilities and allows investors who are willing to take risks to earn high profits, carrying a potentially high risk of losses at the same time. Therefore you should responsibly approach the issue of choosing the appropriate investment strategy, taking the available resources into account, before starting trading.
Use of the information: full or partial use of materials from this website must always be referenced to TeleTrade as the source of information. Use of the materials on the Internet must be accompanied by a hyperlink to teletrade.org. Automatic import of materials and information from this website is prohibited.
Please contact our PR department if you have any questions or need assistance at pr@teletrade.global.
transfers