- Analytics
- News and Tools
- Market News
CFD Markets News and Forecasts — 29-07-2022
- The three major US equity indices advanced between 0.97% and 1.88%.
- A risk-on impulse since last Wednesday underpinned US equities, lifted by US corporate earnings of Amazon and Apple.
- The US Dollar Index fell below 106.000, while the US 10-year T-note yield finished around 2.654%.
US equities finished the week on a higher note, as Amazon and Apple soared as earnings from both companies exceeded analysts’ estimates after the US Federal Reserve hiked rates 75 bps in the week, spurring a rally that carried on until the end of the week/month.
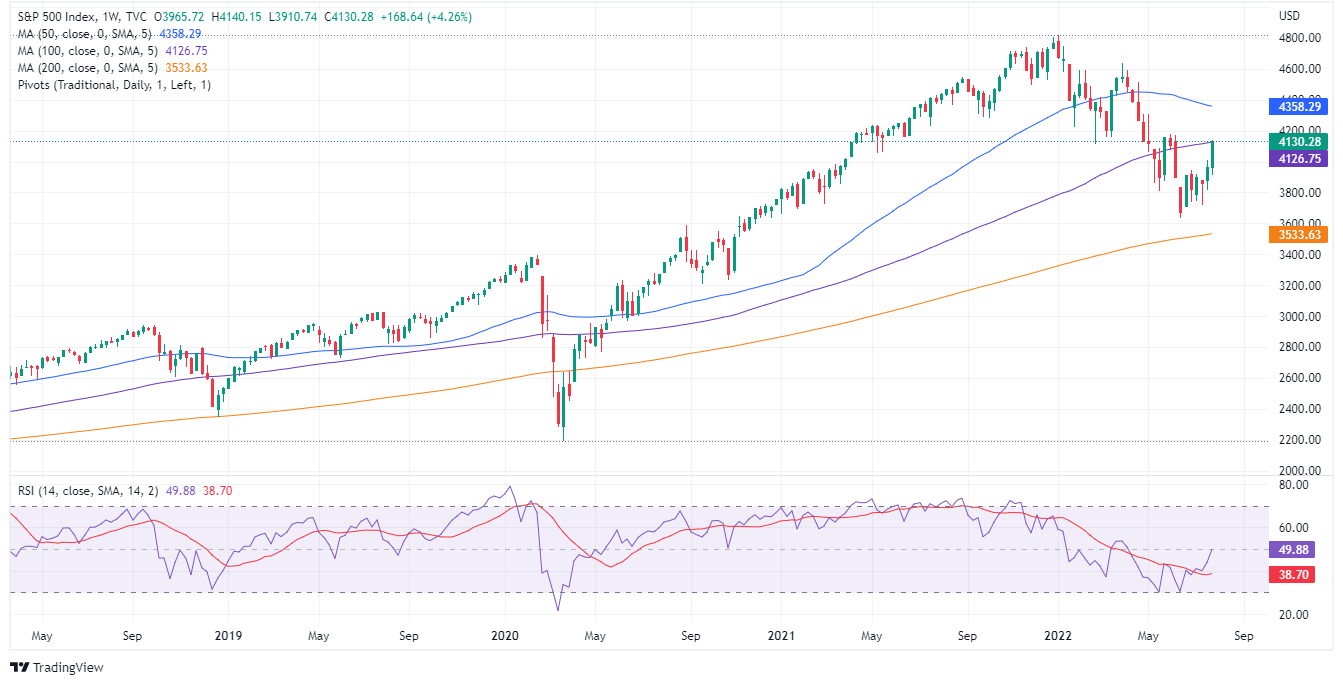
The S&P 500 closed the week gaining 1.42%, at 4,130.28, while the tech-heavy Nasdaq rose 1.88%, up to 12,390.69. Additionally, the Dow Jones Industrial followed suit and climbed 0.97%, finishing at 32,845.13.
Sector-wise, the leading sectors are Energy, up by 4.51 %, followed by Consumer Discretionary and Industrials, each recording gains of 4.27% and 2%, respectively. The biggest losers were Consumer Staples and Health, diving 0.72% and 0.35% each.
Shares fell due to Walmart cutting its earnings forecast, complaining about double-digit food prices and elevated energy prices. Additionally, the US Federal Reserve monetary policy decision is looming, and Europe’s escalating energy crisis re-ignited recession fears amongst traders, which turned to safe-haven assets, namely the greenback.
Global equities remain to trade positively, reflecting an upbeat sentiment. Data-wise, the US Department of Commerce revealed that June’s Personal Consumption Expenditure rose 1% MoM, higher than 0.9% estimations. Annually based, edged higher by 6.8%, vs. 6.7% foreseen by analysts.
Late, the University of Michigan reported that Consumer Sentiment on its final reading for July beat expectations and rose 51.5. In the same survey, inflation expectations for a 5-year horizon, from 2.8% (preliminary) to 2.9%, though less than June’s readings.
In the meantime, Fed speakers began to cross wires. The first one was Atlanta’s Fed President Raphael Bostic, who said that the Fed is “going to have to do more in terms of interest-rate moves” and added that he does not think the country is in a recession. In the meantime, Christopher Waller said that “a soft landing is a plausible outcome for the labor market going forward.”
Elsewhere, the US Dollar Index (DXY), a measurement of the greenback’s value against some currencies, fell 0.67% to 105.828, while the 10-year US Treasury yield dropped two bps, yielding 2.654%.
In the commodities complex, WTI gained 1.95%, exchanging hands at $98.30 BPD. Meanwhile, precious metals like gold (XAU/USD) increased by 0.78%, trading at $1764.00 a troy ounce.
SP 500 Chart
Key Technical Levels
- GBP/USD extends its gains to two straight weeks, gains some 1.49%.
- From a daily chart perspective, the GBP/USD is still downward biased, facing solid resistance around 1.2200.
- GBP/USD Price Analysis: Unless buyers reclaim 1.2245, the pair remains tilted downwards.
The British pound finished the week on the right foot and recorded its second consecutive week in the green; it printed solid gains of 1.49%, amidst an upbeat market mood, portrayed by US equities closing higher on Friday. In the FX space, the GBP/USD is trading at 1.2170, 0.05% down, during the North American session.
GBP/USD Price Analysis: Technical outlook
The GBP/USD is still neutral-to-downward biased, trapped within the 50 and 20-day EMAs, as depicted by the daily chart. Worth noting that earlier in the European session, GBP/USD buyers broke above the 50-day EMA but could not hold the fort, and the pound tumbled towards and hit its daily low at 1.2062 before rebounding towards current price levels.
If GBP/USD buyers want to regain control, they must reclaim 1.2300; otherwise, sellers remain in charge.
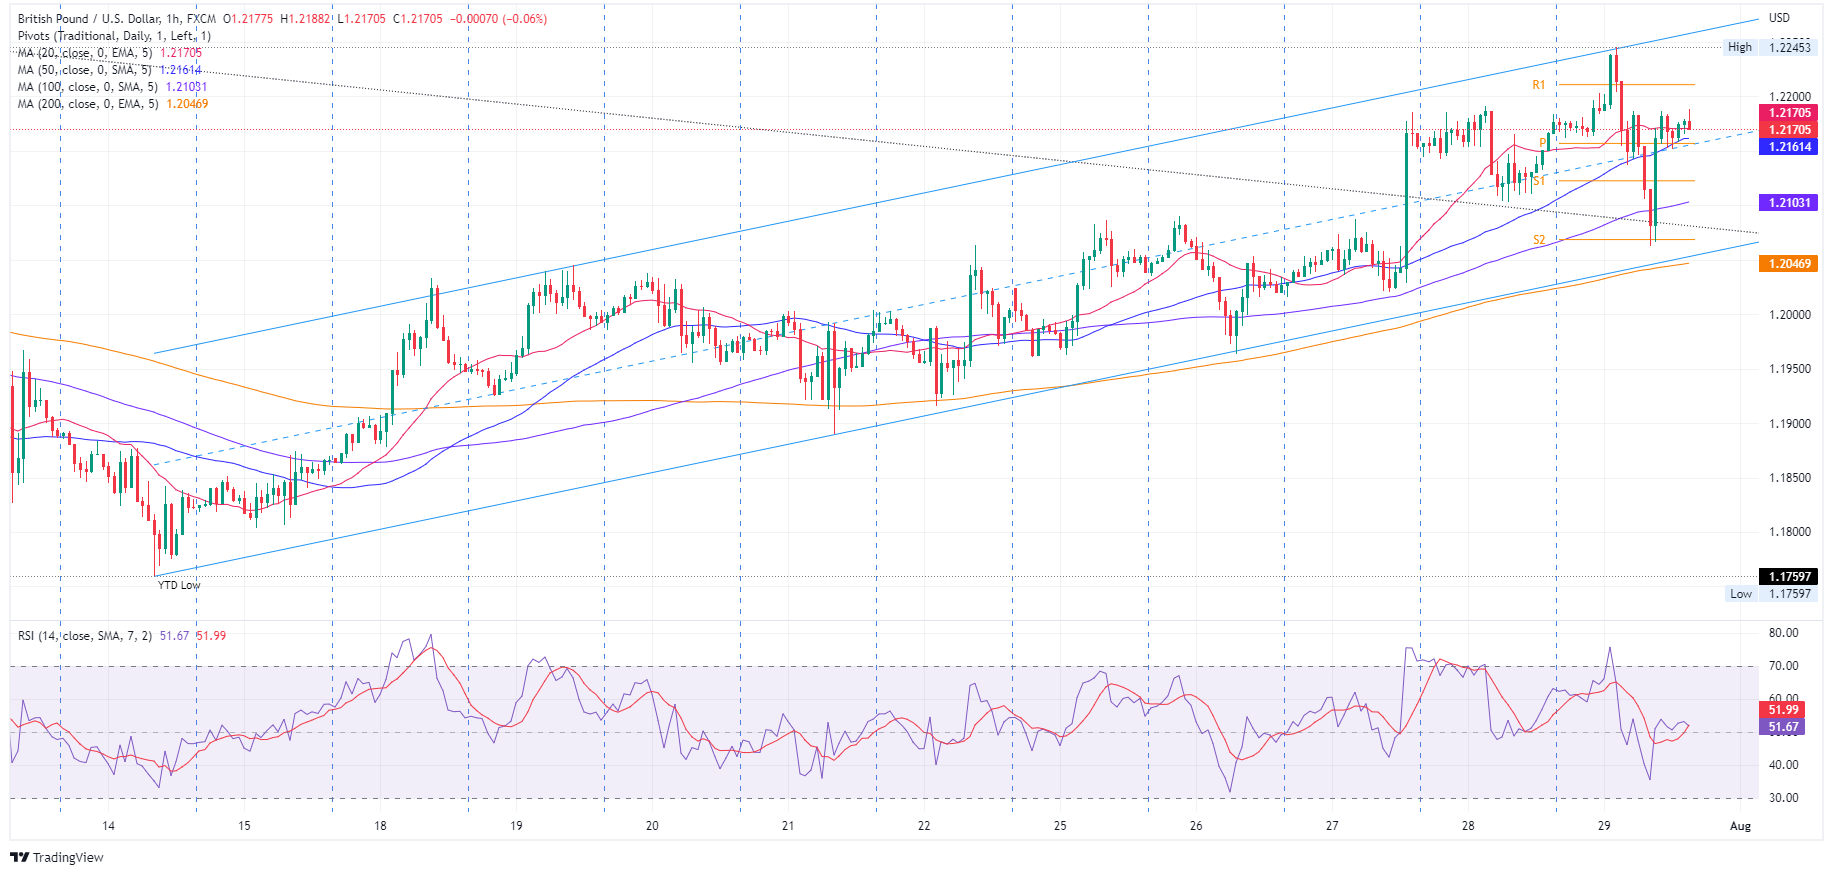
GBP/USD 1-hour chart
In the near term, the GBP/USD is neutral-upwards biased. Since July 14, after reaching a daily low at 1.1759, the major began trending higher, within a 200-pip width ascending channel, which put a lid on Friday’s rally around 1.2245, right at the top of the channel. Even though the GBP/USD plunged towards 1.2065, the S1 pivot point cable recovered some ground and is trading above the confluence of all the hourly EMAs and the daily pivot.
Therefore, the GBP/USD first resistance would be the R1 daily pivot at 1.2210. Break above will expose the top-trendline of the ascending channel around 1.2245, followed by the 1.2300 figure. On the flip side, if the GBP/USD falls below the ascending channel mid-line around 1.2150, it will send the pair sliding towards the bottom-trendline of the channel at around 1.2050-60.
GBP/USD Key Technical Levels
- The EUR/USD is set to finish the week almost flat, gaining 0.05%.
- The shared currency daily chart is neutral-to-downwards, but the hourly is neutral-to-upwards.
- EUR/USD Price Analysis: A daily close above 1.0200 could pave the way towards 1.0300; otherwise, it might drop towards 1.0096.
The EUR/USD is trading at 1.0220, after hitting a daily high at 1.0254, but later tumbled towards the daily low at 1.0145 on elevated US inflation data. In June, the Personal Consumption Expenditures (PCE) rose by 6.8% YoY, fueling expectations of additional Federal Reserve rate hikes, despite the market's pricing in only 80 bps of tightening.
EUR/USD Price Analysis: Technical outlook
From a daily chart perspective, the EUR/USD remains neutral-to-downward biased, helped by the 20-day EMA lying below the exchange rate at 1.0167. Nevertheless, the EUR/USD, unable to capitalize on an upbeat market mood, and broad US dollar weakness, keeps the shared currency exposed to further selling pressure. If EUR/USD buyers want to shift the bias to neutral, they must reclaim the May 13 low-turned-resistance at 1.0348. Once cleared, a challenge of the 50-day EMA at 1.0423 is on the cards. On the other hand, if EUR/USD sellers achieve a daily close below 1.0200, that would pave the road towards 1.0096.
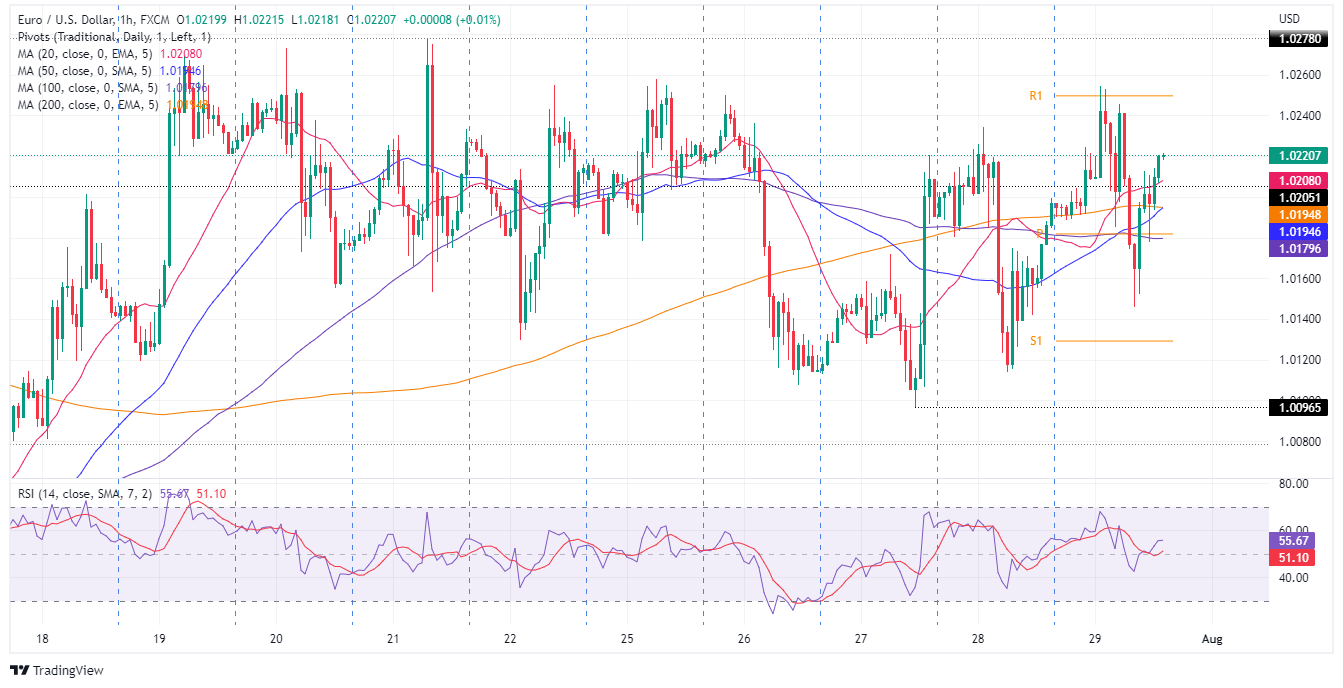
EUR/USD 1-hour chart
In the near term, the EUR/USD hourly chart depicts a sideways picture in the major. Since July 19, the EUR/USD has been trading in the 1.0096-1.0278 range, unable to break either side of the trading range, but EUR/USD traders should notice that the hourly EMAs sit below the spot price, signaling that buying pressure might be building.
Therefore, the EUR/USD first resistance would be the R1 daily pivot at 1.0250. Once cleared, the next resistance would be 1.0278, followed by 1.0300. On the flip side, the EUR/USD first support would be the 20-hour EMA at 1.0206. Break below will expose the confluence of the 200 and 50-hours EMAs at around 1.0192-94, followed by the 100-hour EMA at 1.0179.
EUR/USD Key Technical Levels
- Silver price posts its first weekly gain in the last nine weeks, up by 9%.
- Falling US Treasury yields undermine the greenback and bolstered precious metals prices.
- Fed officials are confident of achieving a soft landing while acknowledging that further rate hikes are needed.
Silver Price rises for four consecutive days, breaking above the $20.00 figure for the first time since July 5, preparing to finish the week with gains of almost 9%., despite higher than expected US inflation data, namely the PCE, the Fed preferred inflation gauge, exceeding estimations. XAGUSD traders ignored the news and held the white metal price at around $20.25, up 0.11% at the time of writing.
Silver rallies amidst an upbeat sentiment
Global equities remain to trade positively, reflecting an upbeat sentiment. Meanwhile, the US Department of Commerce revealed that June’s Personal Consumption Expenditure rose 1% MoM, higher than 0.9% estimations. Annually based, edged higher by 6.8%, vs. 6.7% foreseen by analysts.
Late during the day, the University of Michigan reported the Consumer Sentiment on its final reading for July, which rose 51.5, above estimations. In the same survey, American inflation expectations for a horizon of 5 years uptick from 2.8% (preliminary) to 2.9%, though less than June’s readings.
Fed’s Bostic and Waller crossed wires
During the New York session, Atlanta’s Fed President Raphael Bostic said that the Fed is “going to have to do more in terms of interest-rate moves.” Bostic said he does not think the country is in a recession after Thursday’s weaker than estimated Advanced GDP for the second quarter at -0.9%. In the meantime, Christopher Waller said that “a soft landing is a plausible outcome for the labor market going forward,”
In the meantime, US bond yields have fallen significantly since Wednesday, after the US Federal Reserve hiked rates by 75 bps. The US 10-year Treasury yield fell from weekly highs around 2.845% to 2.636%, down 20 bps, a tailwind for precious metal prices.
Worth noting that the US 2s-10s yield curve inversion, bull flattened during the week, but at the time of writing, is further deepening at -0.255%, further fueling expectations of an upcoming recession in the US.
Therefore, undermined by falling US Treasury yields, the greenback has weakened, as shown by the US Dollar Index (DXY). The DXY is losing 0.54% in the week, sitting at 106.000.
What to watch
Next week, the US economic docket will feature S&P Global and ISM Manufacturing, Services, and Composite PMIs. Alongside that, the US Nonfarm Payrolls report, alongside Fed speaking, would dominate news headlines.
Silver (XAGUSD) Key Technical Levels
- NZD/USD is set to finish the week with minimal gains of 0.36%.
- Sentiment in the FX markets deteriorated on news that US PCE is closing to the 7% threshold.
- NZD/USD Price Analysis: Neutral-to-downward biased and might aim towards 0.6100 in the near term.
The NZD/USD retraces from four-week highs hit around 0.6328, towards the 0.6270s area, amidst an upbeat market mood with global equities rallying, despite the Fed’s favorite inflation gauge, approaching the 7% threshold, signaling that further rate hikes are yet to come. Nevertheless, in the FX space, a risk-off tilted mood keeps safe-haven afloat, to the detriment of risk-sensitive currencies like the NZD, so the NZD/USD is trading at 0.6270 at the time of writing.
Negative sentiment in the FX space weighed on the NZD/USD
The NZD/USD felt the pressure after the US Commerce Department revealed that the Personal Consumption Expenditure (PCE), the Fed’s favorite gauge for inflation, increased by 1% MoM and rose 6.8% YoY vs. expectations of a 6.7% rise. The so-called core PCE, which extracts volatile items, increased from 4.7% foreseen to 4.8% YoY. The major reacted downwards, tumbling 100 pips to its daily low at 0.6218, but found bids and trimmed some of those losses.
Before Wall Street opened, Atlanta’s Fed President Raphael Bostic said that the Fed is “going to have to do more in terms of interest-rate moves.” Bostic said he does not think the country is in a recession after Thursday’s weaker than estimated Advanced GDP for the second quarter at -0.9%.
On the New Zealand dollar side, an absent economic calendar during the week left the kiwi adrift to market sentiment and US dollar dynamics.
What to watch
The New Zealand economic docket would feature the Global Dairy Trade Price Index, alongside Employment data and Business Inflation Expectations. On the US front, the calendar will be packed. On Monday, the S&P Global and ISM Manufacturing PMIs will shed some light on the ongoing slowdown in the US economy.
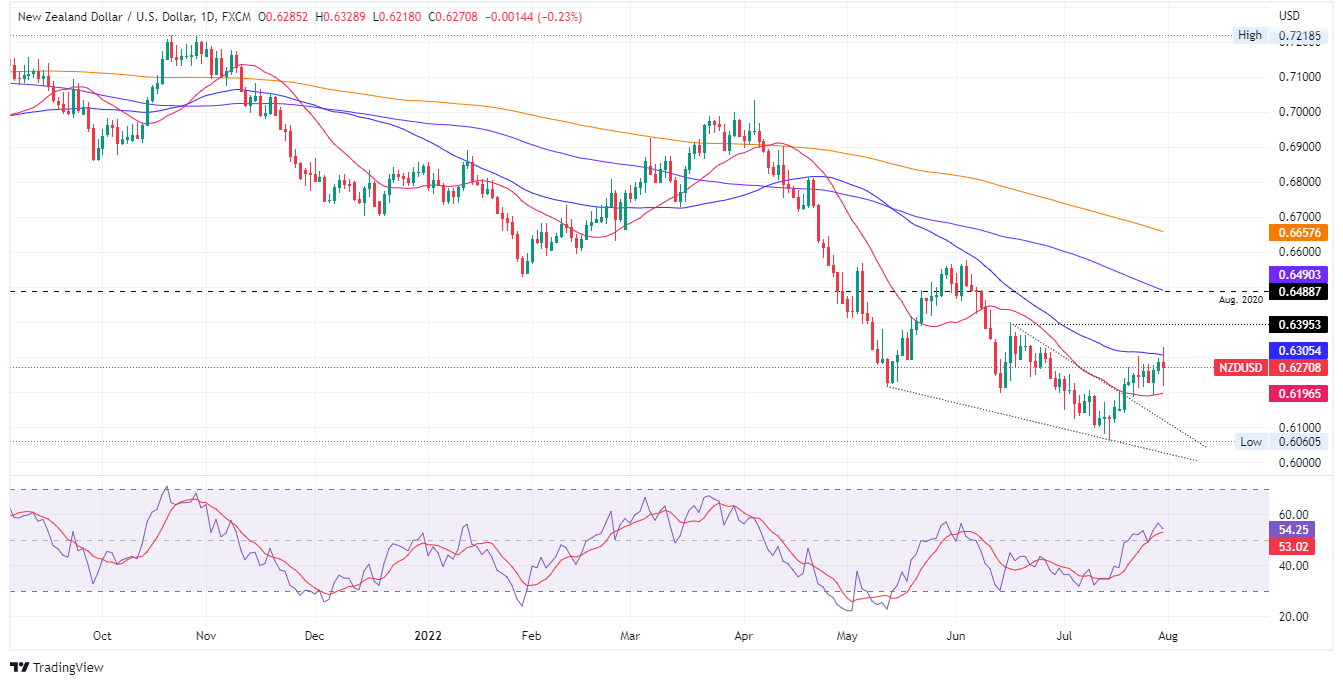
NZD/USD Price Analysis: Technical outlook
The NZD/USD rallied sharply above the 50-day EMA at 0.6305, but buyers could not hold the level, giving way to sellers. Albeit tumbling 100-pips to the daily low, the NZD/USD recovered just above the 20-day EMA at 0.6196, keeping the major trapped between both moving averages. So, from the daily chart perspective, the NZD/USD is still neutral-to-downward biased. Confirmation of the previously mentioned is that the Relative Strength Index (RSI), which, although it’s still in bullish territory, its slope is turning downwards, accelerating for a break below its 7-day RSI SMA.
Some of the shine has been taken of the strong US dollar but case for more sustained and deeper sell off is not yet compelling, explained analysts at MUFG Bank. They consider that global growth fears are supportive for the greenback. They added the Federal Reserve policy pivot is not yet sufficiently dovish.
Key Quotes:
“The USD has clearly lost some of its shine in recent weeks. The pullback for US yields and tentative improvement in global investor risk sentiment have both weighed on the US dollar alongside intensified US recession risks. It leaves the USD vulnerable to further near-term weakness. However, we are still not convinced that the broad-based USD sell-off will be sustained beyond the near-term. The Fed’s policy shift is not sufficiently dovish enough which when combined with global slowdown/recession fears that are set to intensify further, we believe the recent correction lower the USD is likely to prove temporary. One exception is USD/JPY where we are more confident that the USD could have already peaked against the JPY.”
“Recession fears and the accompanying drop in US yields has triggered an abrupt correction lower for USD/JPY over the last couple of days with the pair falling by around 5 big figures as it moves further below last month’s year to date high of 139.39. Recent developments have made us more confident that USD/JPY could have already peaked alongside long-term US rates. Market expectations for policy divergence between the Fed and BoJ are now starting to narrow as the US rate market looks ahead and prices in more rate cuts into next year.”
- US Dollar loses momentum late on Friday amid lower US yields.
- EUR/USD practically flat for the week, remains sideways.
- Price keeps moving below 1.0260 and supported by 1.0100.
The EUR/USD printed a fresh daily low during the American session at 1.0145 and then rebounded back above 1.0200, amid lower US yields and higher equity prices in Wall Street.
Lower US yields keeps USD limited
Data released on Friday in the US showed a larger than expected increase in consumer spending and also in personal income. At the same time, the Core PCE showed inflation not pulling back. US yields initially rose but then declined. Near the end of the week, the US 10-year yield is at 2.63%, the lowest since April.
The yield slide weighed on the greenback that lost momentum and pulled back, sending EUR/USD back above 1.0200. In Wall Street, equities were in positive ground, about to end the best month since 2020.
After a busy week in terms of economic data, the key event for next week is the US official employment report on Friday with market consensus expecting an increase in payrolls by 250K. “Employment likely continued to advance firmly in July but at a more moderate pace after four consecutive job gains at just below 400k in March-June. High-frequency data, including Homebase, still point to above-trend job creation”, mentioned analysts at TD Securities.
Still sideways
Despite all the data and the FOMC meeting, EUR/USD continues to trade sideways (as it has been since July 18), holding above 1.0100 and unable to make a clear break above 1.0260.
“A break below 1.0105 will open doors for a retest of parity, while below the latter, fresh multi-decade lows could be expected, with the main bearish target at 0.9880. The pair needs to accelerate through 1.0280 to shrug off the negative stance and extend its recovery towards 1.0360 and en route to 1.0440”, explains Valeria Bednarik, Chief Analyst at FXStreet.
Technical levels
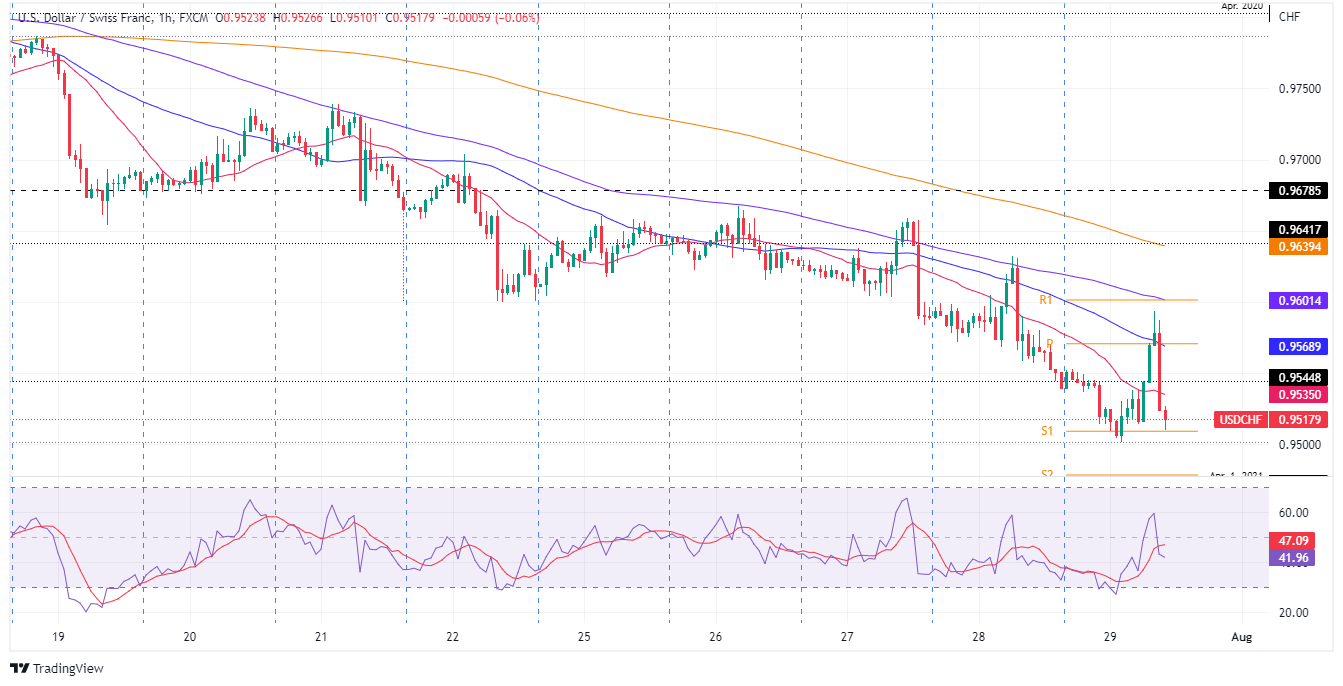
- USD/CHF prepares to finish the week with solid losses of 1.01%.
- From a daily chart perspective, the USD/CHF shifted to a neutral-downward bias.
- The USD/CHF hourly chart reinforces the daily bias, as sellers eye a break below 0.9495 on their way to the 200-DMA.
The USD/CHF slides for the fourth straight day out of five in the week, approaching the June 29 cycle low at 0.9495, which, if decisively broke, would pave the way for a USD/CHF fall towards the 200-day EMA at 0.9409. At the time of writing, the USD/CHF is trading at around 0.9517.
USD/CHF Price Analysis: Technical outlook
The USD/CHF daily chart illustrates that the pair has shifted to neutral-to-downward biased. Readings at oscillators, particularly the Relative Strength Index (RSI), is in bearish territory and nowhere near reaching oversold conditions, opening the door for further USD/CHF downward action. Hence, as mentioned above, once the major clear 0.9495, that will open the door for further losses.
USD/CHF 1-hour chart
In the near term, the USD/CHF hourly chart illustrates that the pair has been seesawing between the daily high and low at 0.9593 and 0.9501, respectively. But once the dust has settled, the exchange rate is at current levels, just above the S1 daily pivot. USD/CHF traders should be aware that in the last couple of hours, the RSI slid below its 7-period SMA, suggesting that downside pressure lies ahead.
Therefore, the USD/CHF bias is downwards, and its first support would be 0.9495. Once cleared, the next support would be the confluence of April 2020 low and the S2 pivot point around 0.9472-80, followed by the S3 daily pivot point at 0.9417.
USD/CHF Key Technical Levels
The monthly GDP reading on Friday showed growth was unchanged in May against the market consensus of a 0.2% contraction. The advance estimate for June suggests a 0.1% increase. Analysts at CIBC, point out that the May GDP print wasn't particularly good, but it was better than had been expected. They argue that the economy definitely cooled towards the end of Q2, although mucho appears to reflect supply constraints rather than domestic demand. They expected the Bank of Canada to continue raising rates.
Key Quotes:
“Growth within the Canadian economy definitely cooled towards the end of Q2, although much of that appears to reflect ongoing supply constraints rather than cratering domestic demand. With overall growth still tracking in line with the Bank of Canada's July MPR forecasts, policymakers remain on track to deliver a further, non-standard size, rate hike at the next meeting.”
“For June, GDP is estimated to have grown 0.1%, with rebounds in manufacturing and construction offset by declines in oil & gas and finance. For Q2 as a whole, growth is running at roughly a 4.5% annualized pace, which is slightly above the Bank of Canada's 4% MPR forecast.”
“While growth in the Canadian economy slowed towards the end of the second quarter, it appears that supply issues, specifically in the manufacturing and construction sector, were a bigger factor than a slowing in domestic demand. Weaker demand was still largely concentrated within the real estate sector, which was running at levels of activity well above pre-pandemic norms before interest rates started to rise.”
“The Bank of Canada is still expected to deliver a further, non-standard, rate hike at its next meeting. However, we expect that the impact on disposable incomes of high inflation and rising interest rates will start to show up more widely in economic data for the second half of the year, allowing the Bank of Canada to pause with rates just above 3%.”
According to the Federal Reserve Bank of Atlanta's GDPNow model, the US economy is expected to grow at an annualized rate of 2.1% in the third quarter.
"The initial estimate of second-quarter real GDP growth released by the US Bureau of Economic Analysis on July 28 was -0.9%, 0.3 percentage points above the final GDPNow model nowcast released on July 27," Atlanta Fed further noted in its publication.
Market reaction
The US Dollar Index showed no immediate reaction to this report and was last seen posting small daily losses at 106.05.
- AUD/USD fell from multi-week highs around 0.7031 and tumbled on risk-off impulse in the FX markets.
- Fed’s Bostic said that the Fed needs to do more in terms of interest rates while saying the US is not in a recession.
- The Fed’s favorite inflation gauge gives the green light for another rate hike.
The Australian dollar slides vs. the greenback, after hitting a daily high at 0.7031 but higher than estimated US inflation figures, triggered a U-turn in the FX space, with safe-haven peers leading the pack. At the time of writing, the AUD/USD is trading at 0.6976.
AUD/USD falls on risk-off impulse in the FX markets after a high PCE reading
The AUD/USD is trading below its opening price as investors reassess the Fed decision. On Wednesday, bulls were everywhere, with global equities rallying as if the Federal Reserve paused or cut rates. The Fed indeed acknowledged that production and spending “softened” but did not signal that they would pause.
In fact, on Friday, the Atlanta Fed President Raphael Bostic said that he is convinced that the Fed is “going to have to do more in terms of interest-rate moves.” Bostic said he does not think the country is in a recession after Thursday’s weaker than estimated Advanced GDP for the second quarter at -0.9%.
In the meantime, US inflation figures reported earlier reinforced what Bostic said. The Personal Consumption Expenditure (PCE), the Fed’s favorite gauge for inflation, rose 1% MoM and is up 6.8% YoY vs. estimations of 6.7%. The so-called core PCE, which extracts volatile items, increased from 4.7% foreseen to 4.8% YoY.
Therefore, the AUD/USD reaction to the headline pushed the pair downwards towards its daily low at 0.6911, 100 pips from its highs, though it has bounced back and is approaching its opening price. In the meantime, the US Dollar Index remains negative in the day, down 0.13%, sitting at 106.074.
Elsewhere, US President Joe Biden and his counterpart, Chinese President Xi Jinping, had a face-to-face meeting and directed teams to follow up. The lifting of tariffs on China’s products was not discussed, as they focused on Taiwan.
Another reason that would cap the AUD/USD gains is that China’s foreign trade is facing higher risks, according to China’s Commerce Minister. He added that the second-half trade growth is not optimistic.
Earlier in the Asian session, the Australian docket featured the Producer Price Index for the Q2 on its annual reading, increasing by 5.6%, more than the 4.9% estimated, giving enough ammunition to the Reserve Bank of Australia to continue hiking rates.
What to watch
Next week, the US economic docket will feature S&P Global and ISM Manufacturing PMIs for July on its final reading. The Australian calendar will unveil the Reserve Bank of Australia (RBA), Interest Rate Decision, where the bank is expected to hike 50 bps from 1.35% to 1.85%.
AUD/USD Key Technical Levels
- XAUUSD rebounds after hitting a fresh low at $1751.
- US yields erase earlier gains, back near recent lows.
- US dollar weakens during the American session.
Gold continues to shine as it shows the latest rebound. XAUUSD printed a fresh daily low during the American session at $1751, but only to rebound more than $10 in a few minutes, rising back above $1760. The outlook remains positive for the metal that is trading near the $1770 resistance area.
Technicals and yields
Gold is about to post the second weekly gain in a row, with the best performance in months. What it started as a correction, after falling to test the critical support around 1675$, it has become a strong rally that could add to gains if the price holds above $1750.
The decline in US yields after the FOMC meeting triggered more gains in XAUUSD. Even after US economic data released on Friday showed a still strong consumer and high inflation, the demand for Treasuries held firm. The US 10-year yield stands at 2.65%, and the 30-year is back under 3.00%.
The greenback is still on positive ground on Friday but off highs and about to end the week on a weak note. The DXY is flat for the day around 106.10, consolidating weekly losses. The long-term perspective is still bullish for DXY but the momentum in the short-term has faded.
Technical levels
Data released on Friday showed consumer spending rose above expectations in June. The 0.1% increase in real personal spending in June shows that even after adjusting for the highest inflation in more than 40 years, consumers are still increasing spending, if only incrementally, said analysts at Wells Fargo. They warn the increase in spending took the saving rate to levels not seen since 2009.
Key Quotes:
“Like a dazed boxer still on his feet, the U.S. consumer is still in the fight with a consensus-beating increase in both income, which was up 0.6%, and spending, up 1.1%. After adjusting for inflation, real personal spending notched an incremental gain of 0.1%, and last month's real decrease of -0.4% got a slight bump up to -0.3%. To some extent, these details were heralded by yesterday's Q2 GDP report, in which consumer spending was one of the few things still in expansion territory.”
“The consumer is reaching deep to find the means to go on spending in the face of the highest inflation in 40+ years. On trend, income is not keeping up with inflation, so in order to keep on spending, households are putting off saving. In fact, the saving rate at 5.1% is lower than it was during the financial crisis in 2009.”
“While we do not believe the economy is yet in recession, we do expect it will slip into one by the beginning of next year. The exact timing of recession depends on a number of variables, but how the demand environment evolves is certainly an important component. We are concerned that the uncanny staying power of the consumer will soon run out.”
“In our latest forecast, we have real PCE growth contracting in the fourth quarter of this year. If consumers pull back on spending sooner, that could pull forward the weakness, though if they remain resilient to higher prices and continue to spend, the downturn could very well be delayed.”
According to analysts at TD Securities the USD/JPY will likely move to the upside in the short term. They have a trading idea of a long position in the pair with a target at 138.00 and stop-loss at 132.45
Key Quotes:
“While we think the USD is on course for a tactical pause that should benefit CHF and JPY, the capitulation in USDJPY looks overdone especially given our expectations for upcoming event risks. A stronger than expected ECI print suggests that the market may be premature in expecting the Fed to pivot on policy. We think the market is still underpricing the Fed's terminal rate.”
“The broad USD is also strongly correlated US data surprises and the July payrolls report is likely to fairly constructive. We are also concerned that the upcoming parade of Fed speak will lean hawkish and pushback against a premature pivot. Broadly speaking, we see 135 as an anchor for the pair relative rate spreads.”
- USD/TRY trades at shouting distance from the 18.00 mark.
- The lira depreciates to levels last seen in December 2021.
- Türkiye trade deficit shrank to TL8.17B in June.
Extra selling pressure around the Turkish lira encourages USD/TRY to advance closer to the 18.00 mark on Friday, recording at the same time fresh cycle highs.
USD/TRY now focuses on inflation data
Sellers seem to be quite comfortable around the Turkish lira, as USD/TRY remains on track to close the third consecutive week with gains amidst the broader 7-month positive streak. So far, the lira shed more than 35%.
In the meantime, the prospects for further tightening by the Federal Reserve is expected to keep the EM FX well under pressure for the remainder of the year, while the war in Ukraine also poses increasing risks for both the economic outlook for Türkiye and the currency.
In the domestic calendar, the trade deficit narrowed to TL8.17B in June, while Foreign Arrivals rose by 145% in the year to June. Earlier in the week, the Economic Confidence Index eased a tad to 93.40 in July (from 93.60).
Moving forward, the lira and investors are predicted to trade on a cautious mood ahead of the critical inflation figures due next week, all after the CPI rose nearly 80% YoY in June.
What to look for around TRY
The upside bias in USD/TRY remains unchanged and stays on course to revisit the key 18.00 zone.
In the meantime, the lira’s price action is expected to keep gyrating around the performance of energy prices, which appear directly correlated to developments from the war in Ukraine, the broad risk appetite trends and the Fed’s rate path in the next months.
Extra risks facing the Turkish currency also come from the domestic backyard, as inflation gives no signs of abating, real interest rates remain entrenched in negative figures and the political pressure to keep the CBRT biased towards low interest rates remain omnipresent. In addition, there seems to be no Plan B to attract foreign currency in a context where the country’s FX reserves dwindle by the day.
Key events in Türkiye this week: Trade Balance (Friday).
Eminent issues on the back boiler: FX intervention by the CBRT. Progress (or lack of it) of the government’s new scheme oriented to support the lira via protected time deposits. Constant government pressure on the CBRT vs. bank’s credibility/independence. Bouts of geopolitical concerns. Structural reforms. Presidential/Parliamentary elections in June 23.
USD/TRY key levels
So far, the pair is gaining 0.14% at 17.9125 and faces the immediate target at 17.9519 (2022 high July 29) seconded by 18.2582 (all-time high December 20) and then 19.00 (round level). On the other hand, a breach of 17.1903 (weekly low July 15) would pave the way for 16.9316 (55-day SMA) and finally 16.0365 (monthly low June 27).
- USD/JPY recovers over 200 pips from a multi-week low and climbs back closer to the daily high.
- A solid intraday USD bounce turns out to be a key factor behind the strong intraday move up.
- The lack of follow-through buying beyond the 50-day SMA warrants caution for bullish traders.
The USD/JPY pair is prolonging its solid intraday recovery from the 132.50 area and continues scaling higher through the early North American session. Spot prices recover over 200 pips from a six-week low touched earlier this Friday and move back to mid-134.00s, closer to the daily high in the last hour.
From a technical perspective, the post-FOMC steep decline stalls near support marked by an ascending trend-line extending from the April monthly swing low. Bulls, however, struggle to capitalize on the move beyond the 50-day SMA support breakpoint, warranting caution before positioning for any further gains.
Furthermore, oscillators on the daily chart, meanwhile, have just started drifting into negative territory. This further makes it prudent to wait for some follow-through buying before confirming that the USD/JPY pair has formed a bottom and the corrective fall from a 24-year peak has run its course.
In the meantime, any subsequent move up is likely to confront stiff resistance and remain capped near the 135.00 psychological mark. Sustained strength beyond could trigger a fresh bout of a short-covering move and lift the USD/JPY pair towards the next relevant resistance, just ahead of the 136.00 mark.
On the flip side, weakness back below the 134.00 round figure now seems to find decent support near the mid-133.00s. Failure to defend the said area would make the USD/JPY pair vulnerable to weaken back below the 133.00 mark and aim back to challenging the daily swing low, around mid-132.00s.
Some follow-through selling would mark a fresh bearish breakdown through the aforementioned ascending trend-line support and pave the way for a further near-term depreciating move for the USD/JPY pair.
USD/JPY daily chart
-637946995671079666.png)
Key levels to watch
- USD/CAD rebounds from a six-week low set on Friday amid the emergence of fresh USD buying.
- The upbeat US PCE report revives Fed rate hike bets and remains supportive of the USD bounce.
- An uptick in oil prices, a slightly better Canadian GDP could underpin the loonie and cap the upside.
The USD/CAD pair shows some resilience below the 1.2800 mark and stages a goodish bounce from a six-week low touched earlier this Friday. The intraday buying remains unabated following the release of US/Canadian macro data and pushes spot prices to a fresh daily high, around mid-1.2800s during the early North American session.
As investors digest the less hawkish FOMC decision and Thursday's disappointing US GDP print, the US dollar witnesses a turnaround on the last day of the week and offers some support to the USD/CAD pair. The USD recovery from its lowest level since July 5 picks up pace following the release of stronger-than-expected US Personal Consumption Expenditures (PCE report).
The US Bureau of Economic Analysis reported that the headline index accelerated to 6.8% YoY in June from 6.3% previous. The Core PCE Price Index - the Fed's preferred gauge of inflation - edged higher to the 4.8% YoY rate as against the 4.7% in May and expected. Further details revealed that Personal Spending and Personal Income rose by 1.1% and 0.6%, respectively.
The upbeat data might revive bets for a 50 bps Fed rate hike move at each meeting in the remainder of this year. This, along with indications of a cautious opening in the US equity markets, seems to benefit the safe-haven greenback and push the USD/CAD pair higher. That said, an uptick in crude oil prices could underpin the commodity-linked loonie and cap the upside.
The Canadian dollar, meanwhile, reacts little to the domestic data, which showed that the economic growth remained flat in May. The backwards-looking release passes unnoticed, suggesting that the USD price dynamics might continue to play a key role in influencing the USD/CAD pair.
Technical levels to watch
- US Employment Cost Index rose 1.3% in the second quarter.
- US Dollar Index stays in positive territory above 106.00.
The US Bureau of Labor Statistics (BLS) reported on Friday that the Employment Cost Index was up 1.3% in the second quarter, down from 1.4% in the first quarter but slightly higher than the market expectation of 1.2%.
"Wages and salaries increased 5.3% for the 12-month period ending in June 2022 and increased 3.2% for the 12-month period ending in June 2021," the BLS' publication further read.
Market reaction
The dollar stays resilient against its rivals after this data with the US Dollar Index clinging to modest daily gains at 106.30.
- EUR/USD fades the earlier bull run to the 1.0250 area.
- Bears face decent support in the 1.0100 neighbourhood.
EUR/USD falters once again in the 1.0250/60 band, sparking a knee-jerk to the sub-1.0200 area soon afterwards.
The inability of the pair to leave behind this area of resistance could spark a more sustainable downside, which is expected to meet quite a strong support in the 1.0100 region, or weekly lows.
The loss of this area could accelerate losses to the key parity level prior to the 2022 low at 0.9952 (July 14).
In the meantime, the pair is expected to remain under downside pressure while below the 5-month support line around 1.0460.
In the longer run, the pair’s bearish view is expected to prevail as long as it trades below the 200-day SMA at 1.0962.
EUR/USD daily chart
- Real GDP in Canada stayed unchanged in May.
- USD/CAD trades in the positive territory near 1.2850.
The real Gross Domestic Product (GDP) of Canada was essentially unchanged on a monthly basis in May, following a 0.3% expansion in April, Statistics Canada reported on Friday. This reading came in better than the market expectation for a contraction of 0.2%.
"Growth in services-producing industries (+0.4%) was offset by a decline in goods-producing industries (-1.0%), as 14 of 20 industrial sectors increased in May," the publication read.
Market reaction
The USD/CAD pair was last seen rising 0.3% on the day at 1.2840 with the dollar gathering strength on stronger-than-expected PCE inflation data.
- GBP/USD retreats sharply from a one-month high amid the emergence of some USD buying.
- The upbeat US PCE report might have revived Fed rate hike bets and favours the USD bulls.
- Bears might still wait for a sustained break below the 1.2100 mark before placing fresh bets.
The GBP/USD pair witnessed a dramatic turnaround from the vicinity of mid-1.2200s, or a one-month high touched earlier this Friday. The retracement slide remains uninterrupted through the early North American session and dragged spot prices to a fresh daily low, around the 1.2100 mark in the last hour.
The US dollar stages a solid intraday recovery from its lowest level since July 5 and turns out to be a key factor exerting heavy downward pressure on the GBP/USD pair. A modest recovery in the US Treasury bond yields extends some support to the greenback, which gets an additional lift from stronger US Personal Consumption Expenditures (PCE report).
The US Bureau of Economic Analysis reported that the headline index accelerated to 6.8% YoY in June from 6.3% previous. The Core PCE Price Index - the Fed's preferred gauge of inflation - edged higher to the 4.8% YoY rate as against the 4.7% in May and expected. Further details revealed that Personal Spending and Personal Income rose by 1.1% and 0.6%, respectively.
The upbeat data might have revived speculations for a 50 bps Fed rate hike move at each meeting in the remainder of this year. This, along with a modest pullback in the US equity futures, remains supportive of the intraday USD bounce. That said, it would be prudent to wait for some follow-through selling below the 1.2100 mark before placing bearish bets around the GBP/USD pair.
Technical levels to watch
Inflation in the US, as measured by the Personal Consumption Expenditures (PCE) Price Index, climbed to 6.8% on a yearly basis in June from 6.3% in May, the US Bureau of Economic Analysis reported on Friday. This reading came in higher than the market expectation of 6.7%.
The Core PCE Price Index, the Fed's preferred gauge of inflation, rose to 4.8% from 4.7% in the same period.
Further details of the publication revealed that Personal Spending and Personal Income rose by 1.1% and 0.6%, respectively, on a monthly basis in June. Both of those prints surpassed analysts' forecasts.
Market reaction
The US Dollar Index rose sharply with the initial reaction to this report and was last seen rising 0.18% on the day at 106.40.
UOB Group’s Senior Economist Alvin Liew and Rates Strategist Victor Yong comment on the latest FOMC event (July 27).
Key Takeaways
“The US Federal Reserve (Fed) unanimously agreed to accelerate its rate hike cycle in the 26/27 Jul 2022 FOMC by lifting the policy Fed Funds Target rate (FFTR) by another 75bps to 2.25-2.50%, and it anticipates that ongoing rate hikes will be appropriate with its continued focus on reining in inflation.”
“During his post-decision press conference, while FOMC Chair Powell said another “unusually large” increase could be appropriate at next [Sep] meeting, he added that it will be appropriate to slow pace of increases as rates get more restrictive. Importantly, Powell declined to give explicit forward guidance for Sep FOMC and said it will be based on incoming data and it is “time to go to meeting by meeting basis.” Powell did not think the US economy is in recession as too many areas of the economy are performing well and job growth, wage measures are strong which are not consistent with a recession. That said, he noted it is very hard to say with any confidence what the economy will be like in 6-12 months.”
“FOMC Outlook – Expecting 50bps Rate Hikes In Sep And Nov, 25bps In Dec FOMC: Expectations remain firm for the Fed to continue with its rate hikes in 2022 but the path has become more uncertain, given the shift to ‘meeting by meeting’ basis. We now expect another two more 50 bps rate hikes in Sep and Nov FOMC before ending the year with a 25bps hike in Dec. Including the rate hikes of 25bps in Mar, 50bps in May and the latest 75bps in Jun and Jul, this implies a cumulative 350bps of increases in 2022, bringing the FFTR higher to the range of 3.50-3.75% by end of 2022, a range largely viewed as well above the neutral stance (which is seen as 2.25-2.50%, the Fed’s long run projection of FFTR). We maintain our forecast for one further 25bps in 1Q 2023 (from previous forecast of two more 25bps rate hikes), bringing our terminal FFTR to 3.75-4.00% by end 1Q-2023, and a pause to the current rate hike cycle.”
“Rates Outlook: Guided by our relatively hawkish policy rates outlook, our forecasts for short term interest rates are similarly poised to head higher into the first half of 2023. We see the 3-month compounded SOFR and SORA at 3.30% and 2.60% respectively by end 2022.”
“In our view, the gathering of dark clouds is likely to persist going forward. As such, longer maturity yields will continue to handicap the possibility of recession. For developed markets, this will translate to a more modest potential for yield upside than otherwise. We see 10-year UST and SGS yields at 3.60% and 3.20% respectively, by end 2022.”
- AUD/USD witnesses a turnaround from a multi-week high touched earlier this Friday.
- Rebounding US bond yields revives the USD demand and attracts selling around the pair.
- The risk-on mood could cap the USD as traders await the US PCE report for a fresh impetus.
The AUD/USD pair retreats sharply from its highest level since June 17 and weakens further below the 0.7000 psychological mark heading into the North American session. The sharp intraday descent drags spot prices to a fresh daily low, closer to mid-0.6900s in the last hour.
A modest bounce in the US Treasury bond yields assists the US dollar to trim a part of its early losses to a three-and-half-week low touched earlier this Friday. This, in turn, attracts some selling around the AUD/USD pair, though the prevalent risk-on mood could act as a headwind for the safe-haven buck and limit the downside for the risk-sensitive aussie.
Investors turn optimistic amid expectations that a global economic downturn would force major central banks to ease off their aggressive policy tightening cycle. This was evident from a generally positive tone around the equity markets, which, along with the less hawkish FOMC decision and contracting the US economy, might cap the USD and offer support to the AUD/USD pair.
It is worth recalling that Fed Chair Jerome Powell hinted on Wednesday that the US central bank could slow the pace of the current rate hiking campaign at some point. Furthermore, Thursday's disappointing US Q2 GDP print confirmed a technical recession and further fueled speculations that the Fed would not raise interest rates as aggressively as previously estimated.
Next on tap is the release of the US Personal Consumption Expenditures (PCE report) - the Fed preferred inflation gauge - due in a short while from now. The data, along with the US bond yields, would influence the USD price dynamics. Traders would further take cues from the broader risk sentiment to grab short-term opportunities around the AUD/USD pair.
Technical levels to watch
- DXY’s downside momentum gathers extra steam on Friday.
- Further losses could see the 55-day SMA ay 104.73 revisited.
DXY sheds ground for the third consecutive session at the end of the week and retests the sub-106.00 region for the first time since early July.
The index broke below the multi-session pre-FOMC consolidative theme and in doing so it has paved the way for extra decline in the very near term. That said, the immediate support now turns up at the interim 55-day SMA at 104.73 prior to the 5-month support line around 103.85.
The near-term outlook for DXY remains constructive while above this 5-month support line.
In addition, the broader bullish view remains in place while above the 200-day SMA at 99.44.
DXY daily chart
US Core PCE Price Index Overview
Friday's US economic docket highlights the release of the Core Personal Consumption Expenditure (core PCE) Price Index for June, scheduled later during the early North American session at 12:30 GMT. The Fed's preferred inflation gauge is expected to rise by 0.5% MoM during the reported month as compared to the 0.3% in May. The yearly rate, however, is anticipated to hold steady at 4.7% in June.
How Could it Affect EUR/USD?
The Federal Reserve hinted earlier this week that it could slow the pace of the hiking campaign at some point amid signs of a slowdown, reaffirmed by Thursday's disappointing US Q2 GDP print. A weaker PCE report could further fuel expectations that the US central bank would not raise interest rates as aggressively as previously expected. This could aggravate the bearish pressure surrounding the US dollar and offer some support to the EUR/USD pair.
The immediate market reaction, however, is more likely to be short-lived amid renewed worries about an energy crisis in Europe and Italian political uncertainty. Furthermore, stronger inflation data could revive bets for a 50 bps Fed rate hike move at each meeting in the remainder of this year. This would be enough to prompt some USD short-covering, suggesting that the path of least resistance for the EUR/USD pair is to the downside.
Eren Sengezer, Editor at FXStreet, outlined important technical levels to trade the major: “EUR/USD was last seen trading above 1.0230, where the Fibonacci 38.2% retracement level of the latest downtrend forms the upper limit of the 10-day-old trading range. In case this level is confirmed as support, the next bullish targets could be seen at 1.0300 (psychological level, Fibonacci 50% retracement, 200-period SMA on the four-hour chart) and 1.0370 (Fibonacci 61.8% retracement).”
“On the downside, additional losses toward 1.0200 (psychological level, 50-period SMA) and 1.0150 (Fibonacci 23.6% retracement, 100-period SMA) could be witnessed if 1.0230 support fails,” Eren added further.
Key Notes
• EUR/USD Forecast: Next bullish target aligns at 1.0300
• US Dollar Index: Sellers push harder and break below 106.00 ahead of PCE
• EUR/USD sticks to the consolidative phase so far – UOB
About the US PCE Price Index
The Personal Spending released by the Bureau of Economic Analysis, Department of Commerce is an indicator that measures the total expenditure by individuals. The level of spending can be used as an indicator of consumer optimism. It is also considered as a measure of economic growth: While Personal spending stimulates inflationary pressures, it could lead to raise interest rates. A high reading is positive (or Bullish) for the USD.
Economist at UOB Group Lee Sue Ann comments on the recently released inflation readings in the Australian economy.
Key Takeaways
“Headline CPI growth came in at 1.8% q/q for 2Q22, lower than the estimate of 1.9% q/q, and easing from the 2.1% q/q reading in 1Q22. This marks the second highest reading since the introduction of the Goods and Services Tax (GST). Compared to the same period a year ago, CPI advanced 6.1% y/y, lower than the 6.3% y/y estimate, but higher than the 5.1% y/y print in the previous quarter. The annual rise in the CPI is the largest since the introduction of the GST.”
“Our current full-year inflation forecast of 5.0% remains, underscoring the RBA’s rapid tightening cycle since May that lifted the cash rate to 1.35% from 0.10% as it tries to ensure inflation expectations remain anchored around its 2-3% target. We are anticipating another 50bps hike in the OCR at the upcoming 2 Aug meeting. We then see the RBA slowing to 25bps increments. Our forecast is for the OCR to reach 2.10% by year-end, and for it to reach 2.50% by mid-2023.”
“Last week (20 Jul), the Terms of Reference for the RBA Review was finalised, the three-member review panel appointed, and Mar 2023 set as a deadline for a final report containing recommendations to the government. A primary focus of this review will be ‘the continued appropriateness of the inflation targeting framework’ meaning the numerical choice of the 2-3% inflation target and inflation targeting itself are in scope.”
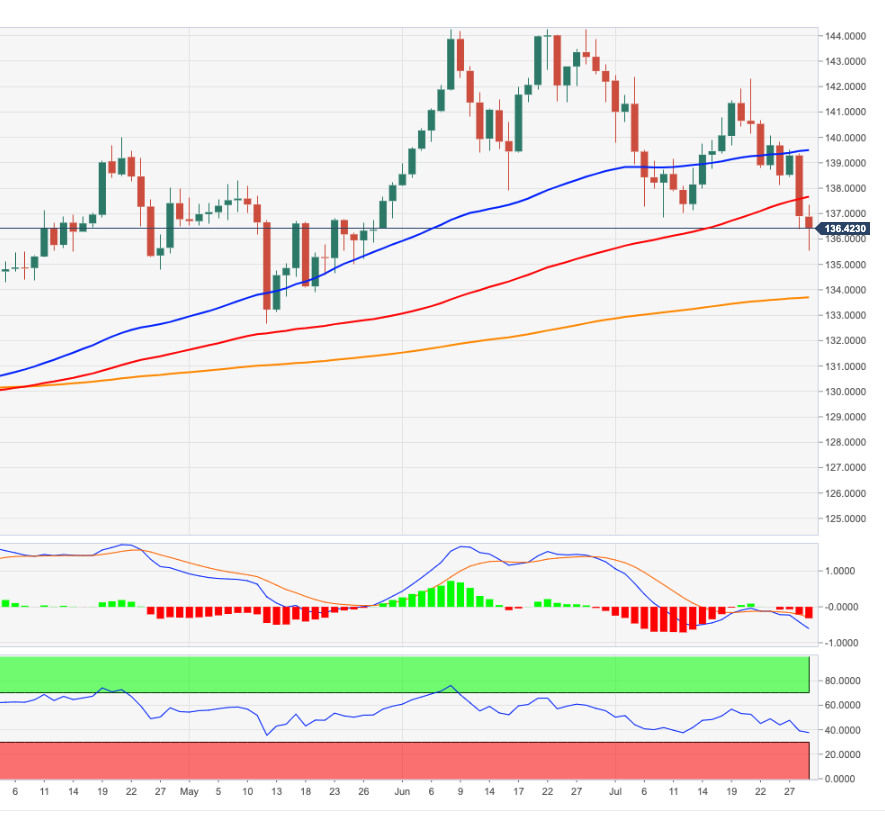
- EUR/JPY extends the retracement for the second session in a row.
- Next on the downside now emerges the 200-day SMA at 133.66.
EUR/JPY accelerates the weekly pullback and already tested fresh 2-month lows in the mid-135.00s, where some initial contention seems to have turned up.
The cross remains under pressure and is vulnerable to further decline while below the weekly high at 142.32 (July 21). The persistent descent this week now exposes a probable deeper drop to the critical 200-day SMA, today at 133.67.
It is worth noting that while above the latter, the cross is expected to keep its constructive stance.
EUR/JPY daily chart
"The Federal Reserve is going to have to do more with interest rates but details depend on the flow of data in coming months," Atlanta Fed President Raphael Bostic said on Friday, as reported by Reuters.
Additional takeaways
"The country is not in recession, but the real question is whether current conditions are creating hardship, inflation needs to be addressed."
There is still more work to be done on bringing demand and supply into balance."
"Rate hikes could hurt job growth, but so far seems there is momentum for continued hiring."
"Possible to control inflation while limiting the number of families who have really bad outcomes."
"The US is a ways from a recession, though concerned that recession fears could become self-fulfilling."
Market reaction
These comments don't seem to be having a significant impact on the greenback's performance against its rivals. As of writing, the US Dollar Index was down 0.25% on the day at 105.92.
Alvin Liew, Senior Economist at UOB Group, reviews the latest Industrial Production figures in Singapore.
Key Takeaways
“Singapore’s industrial production (IP) came in below expectations in Jun as it declined by 8.5% m/m SA, which translated to a weaker growth of 2.2% y/y, the lowest since Jan 2022 (from the revised May readings of 9.2% m/m, 10.4% y/y and fell short of Bloomberg survey estimates.”
“The main sources of IP growth were unchanged from May, but transport engineering took the lead in driving IP growth while electronics output growth eased markedly following a surprise 2.6% y/y fall in semiconductor. The other growth segments were general manufacturing and precision engineering, more than offsetting the continued weakness in biomedical (of which pharmaceuticals production plunged -24.9% y/y) and chemicals (of which petrochemicals remained the main drag).”
“Based on advance estimates released by Ministry of Trade and Industry on 14 Jul, Singapore’s economy grew by 4.8% y/y in 2Q with contribution for all the three major sectors including manufacturing which expanded by 8% y/y. However, based on the Jun IP report, the manufacturing sector is likely to have grown by less, at 5.7% y/y in 2Q. Assuming no major changes to the other sectors, we now expect 2Q’s GDP growth to be revised lower by 0.3ppt to 4.5% y/y, taking into account the lowered manufacturing expansion.”
“Singapore’s IP expanded 5.6% in the first half of 2022. We continue to be cautiously positive on the outlook for electronics, transport engineering, general manufacturing, and precision engineering, to drive overall IP growth but we are also cognizant there is an easing trend in sales since the peak in Jun 2021about the attendant external risks including (1) Russia-Ukraine conflict driving commodity prices higher, (2) global supply disruptions due to China’s zero-COVID policy, (3) monetary policy tightening stance in the advanced economies slowing growth and (4) resurgence of COVID-19 infections and/or new variants. In addition, another dampener to headline growth is the relatively higher base levels for the rest of 2022. We maintain our IP growth forecast at 4.5% in 2022 (from 13.2% in 2021) while our full year 2022 GDP growth forecast is also unchanged at 3.5%.”
- USD/JPY stages a goodish bounce from a multi-week low touched earlier this Friday.
- Recovering US bond yields help revive the USD demand and offers support to the pair.
- Investors now look forward to the US PCE report for some meaningful trading impetus.
The USD/JPY pair stalls its intraday decline near mid-132.00s and quickly recovers over 90 pips from a six-week low touched earlier this Friday. The pair is now trading around the 133.35-133.40 region, still down nearly 0.70% for the day.
As investors digest the less hawkish FOMC decision and Thursday's disappointing US GDP print, the US dollar reverses a major part of its early lost ground to the lowest level since July 5. A goodish pickup in the US Treasury bond yields is offering some support to the USD. Given the post-FOMC slump of nearly 500 pips from the vicinity of mid-137.00s, the said factors prompt some intraday short-covering around the USD/JPY pair on the last day of the week.
On the other hand, a further recovery in the global risk sentiment - as depicted by some follow-through positive moves in the equity markets - undermines the safe-haven Japanese yen. This is seen as another factor lending support to the USD/JPY pair. Apart from this, a big divergence in the monetary policy stance adopted by the Federal Reserve and the Bank of Japan suggests that the USD/JPY pair might have formed a temporary bottom near the 132.50 area.
That said, it would still be prudent to wait for strong follow-through buying before positioning for any meaningful positive move. Traders now look forward to the release of the US Personal Consumption Expenditures (PCE report) - the Fed preferred inflation gauge. This, along with the US bond yields, would influence the USD demand. Apart from this, the broader market risk sentiment could produce short-term trading opportunities around the USD/JPY Pair.
Technical levels to watch
Japanese Finance Minister Shunichi Suzuki said on Friday that they are closely watching fx moves with a sense of urgency while working with the Bank of Japan (BOJ).
He declined to comment on day-to-day FX moves.
Market reaction
USD/JPY has paid little heed to the above comments, as it trades at 133.30, down 0.73% on the day. The pair is consolidating the recovery from multi-week troughs of 132.51.
- EUR/GBP gains some traction on Friday and snaps a five-day losing streak to a multi-month low.
- Mostly upbeat Eurozone Q2 GDP growth figures offer some support to the euro and the cross.
- The European gas crisis and Italian political uncertainty should keep a lid on any further gains.
The EUR/GBP cross gains some positive traction on Friday and moves further away from over a three-month low, around the 0.8345 region touched the previous day. The intraday buying picks up pace during the early part of the European session and pushes spot prices to the 0.8400 mark, or a fresh daily high in the last hour.
Barring a disappointment from the German growth figures, the mostly upbeat preliminary second-quarter GDP prints from the Eurozone, to some extent, eases recession fears. Apart from this, hotter-than-expected flash Eurozone consumer inflation figures turn out to be a key factor behind the shared currency's relative outperformance.
Apart from this, the prevalent US dollar selling bias offers additional support to the euro, which, in turn, is providing a modest lift to the EUR/GBP cross. That said, leading indicators have shown that economic activity in the Eurozone worsened significantly in July. This, along with the looming energy crisis, could cap the common currency.
It is worth recalling that the Russian state-controlled energy giant Gazprom said on Wednesday that gas deliveries to Germany via the Nord Stream 1 pipeline have been cut to 20% of capacity. Apart from this, political instability in Italy - ahead of elections in September - adds to concerns about the regions economic outlook and warrants caution for bulls.
On the other hand, the British pound remains supported by rising bets for a 50 bps rate hike by the Bank of England at its upcoming meeting in August. This could also contribute to keeping a lid on the EUR/GBP cross. Nevertheless, spot prices, for now, have snapped a five-day losing streak, though seem to struggle to find acceptance above the 0.8400 mark.
Technical levels to watch
The Eurozone economy expanded by 0.7% on the quarter in the three months to June of 2022, beating 0.2% expected and 0.6% previous, the preliminary release showed on Friday.
On an annualized basis, the bloc’s GDP rate rose by 4.0% in Q2 vs. 5.4% booked in the first quarter of 2021 while surpassing 3.4% expectations.
Also read: Eurozone Preliminary Inflation surges 8.9% YoY in July vs. 8.6% expected
Market reaction
EUR/USD was last seen trading at 1.0216, up 0.20% on the day. The euro failed to capitalize on the upbeat Eurozone GDP and inflation data, as the focus shifts to the US PCE inflation and Employment Cost Index.
About Eurozone Preliminary GDP
The Gross Domestic Product released by Eurostat is a measure of the total value of all goods and services produced by the Eurozone. The GDP is considered as a broad measure of the Eurozone's economic activity and health. Usually, a rising trend has a positive effect on the EUR, while a falling trend is seen as negative (or bearish).
The annualized Eurozone Harmonised Index of Consumer Prices (HICP) accelerated by 8.9% in July vs. June’s 8.6%, the latest data published by Eurostat showed on Friday. The market consensus was for an 8.6% figure.
The core figures rose to 4.0% YoY in July when compared to 3.8% expectations and 3.7% booked in June.
The Euro area figures are reported a day after Germany’s annual inflation for July, which unexpectedly rose to 8.5% while missing expectations of 8.1% following an 8.2% increase reported in June.
The bloc’s HICP figures hold significance, as it helps investors assess the European Central Bank’s (ECB) monetary policy tightening path. The ECB inflation target is 2%.
Key details (via Eurostat)
“Looking at the main components of euro area inflation, energy is expected to have the highest annual rate in July (39.7%, compared with 42.0% in June), followed by food, alcohol & tobacco (9.8%, compared with 8.9% in June), non-energy industrial goods (4.5%, compared with 4.3% in June) and services (3.7%, compared with 3.4% in June).”
EUR/USD reaction
The shared currency is little changed on the upbeat data, with EUR/USD trading at 1.0225, up 0.28% on the day.
Analysts at TD Securities (TDS) offered a brief preview of the upcoming Bank of England monetary policy meeting, scheduled on August 4. The UK central bank is expected to hike interest rates by 50 bps, though the British pound might continue to be influenced by the USD price dynamics.
Key Quotes:
“We expect the MPC to hike Bank Rate by 50bps, with likely 3-4 members preferring a 25bps hike, and a message that cautions against extrapolating 50bps hikes into the future. Early details of active Gilt sales should be announced, but no decision yet made.”
“External factors more likely to be relevant for GBP given caution on extrapolating more aggressive tightening. Cable more of a function of broad USD dynamics and US data surprises going forward. We see GBP outperformance persisting vs EUR given structural challenges facing the bloc.”
“Details on QT are likely to remain a key driver for rates. The "announcement effect" argues for cheapening of the 10y ASW from their current rich levels, at least as we head into the meeting. We still favour being long in GBP 1y1y vs. EUR 1y1y on back of ongoing underperformance of GBP on xmkts basis.”
- AUD/USD climbs to a fresh six-week high on Friday amid sustained USD selling bias.
- Expectations for gradual Fed hike rates, sliding US bond yields weighs on the USD.
- The risk-on impulse further underpins the safe-haven buck and benefits the aussie.
The AUD/USD pair attracts fresh buying on the last day of the week and is building on its steady intraday ascent through the early European session. The momentum lifts spot prices to a fresh six-week high, around the 0.7030 region in the last hour.
The less hawkish FOMC decision on Wednesday, along with the disappointing US Q2 GDP print, fueled speculations that the Fed would not raise interest rates as aggressively as previously estimated. Apart from this, a further decline in the US Treasury bond yields continues to weigh on the US dollar, which, in turn, is offering support to the AUD/USD pair.
Apart from this, a generally positive tone around the equity markets is exerting additional downward pressure on the safe-haven greenback and benefitting the risk-sensitive aussie. Investors turn optimistic amid expectations that a global economic downturn would force major central banks to ease off their aggressive policy tightening cycle.
Friday's positive move, meanwhile, validates this week's breakout through a descending trend-line resistance extending from the YTD high touched in April. Furthermore, acceptance above the 0.7000 psychological mark could now be seen as a fresh trigger for bullish traders and has set the stage for a further near-term appreciating move for the AUD/USD pair.
Market participants now look forward to the release of the US Personal Consumption Expenditures (PCE report) - the Fed preferred inflation gauge - later during the early North American session. This, along with the US bond yields and the broader risk sentiment, would influence the USD demand and produce short-term trading opportunities around the AUD/USD pair.
Technical levels to watch
- EUR/USD extends the rebound to the 1.0250/60 band on Friday.
- EMU Flash GDP, CPI next of relevance in the region.
- US PCE, Consumer Sentiment will be in the limelight in the NA session.
The single currency remains well bid and motivates EUR/USD to revisit the key resistance area around 1.0250/60 at the end of the week.
EUR/USD now looks to EMU, German data
EUR/USD is up for the third session in a row and it has been gathering traction since the FOMC event on Wednesday, particularly after investors perceived as dovish some comments from Chief Powell, who poured cold water over the probability of further large rate hikes in the next months.
In addition, the greenback sees its downside accelerated on Friday in response to poor flash GDP figures, which suggest that the US economy has entered a technical recession in the second quarter.
In the German cash markets, the 10y Bund yields manage to regain the smile somewhat following multi-week lows recorded in the previous session.
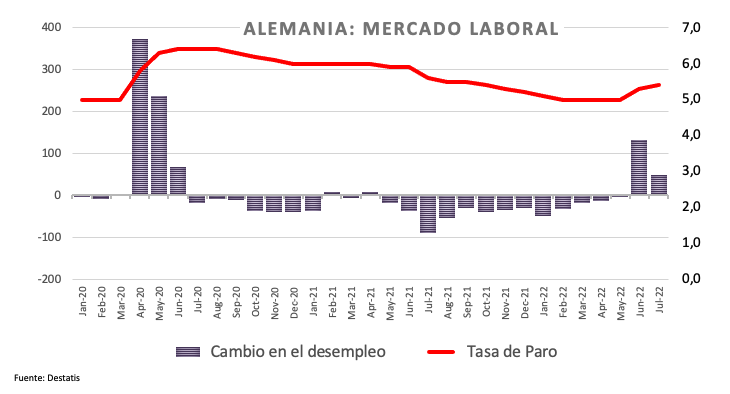
Data wise in Germany, the Unemployment Rate edged higher to 5.4% in July and the Unemployment Change rose by 48K persons in the same period. In addition, flash GDP figures now see the economy expanding 1.4% YoY and came in flat vs. the earlier quarter.
Later in the session, the pair is expected to face some volatility in light of the release of the advanced inflation figures and Q2 GDP results in the broader Euroland.
Across the pond, the focus should be on the inflation figures measured by the PCE and the final U-Mich Index.
What to look for around EUR
Euro bulls regain the upper hand and encourage EUR/USD to challenge the upper end of the range around 1.0250 at the end of the week.
Price action around the European currency, in the meantime, is expected to closely follow dollar dynamics, geopolitical concerns, fragmentation worries and the Fed-ECB divergence.
On the negatives for the single currency emerges the so far increasing speculation of a potential recession in the rMedium (h3)egion, which looks somewhat propped up by weaker sentiment readings and the renewed downtrend in some fundamentals.
Key events in the euro area this week: Germany Unemployment Change, Unemployment Rate, Flash Q2 GDP, EMU Flash Inflation Rate, Advanced Q2 GDP (Friday).
Eminent issues on the back boiler: Continuation of the ECB hiking cycle. Italian elections in late September. Fragmentation risks amidst the ECB’s normalization of monetary conditions. Performance of the economic recovery post-pandemic in the region. Impact of the war in Ukraine on the region’s growth prospects and inflation.
EUR/USD levels to watch
So far, spot is gaining 0.35% at 1.0232 and a breakout of 1.0278 (weekly high July 21) would target 1.0432 (55-day SMA) en route to 1.0615 (weekly high June 27). On the other hand, initial contention emerges at 1.0107 (weekly low July 26) seconded by 1.0000 (psychological level) and finally 0.9952 (2022 low July 14).
- German economy grew at a softer pace than expected in Q2.
- EUR/USD continues to trade in positive territory above 1.0200.
The data published by Germany's Destatis showed on Friday that the German economy grew at an annualized pace of 1.4% in the second quarter following the 3.8% expansion recorded in the first quarter. This reading missed the market expectation of 1.8%.
On a quarterly basis, the German economy stalled with GDP growth coming in at 0%.
Market reaction
These figures don't seem to be having a significant impact on the shared currency's performance against its major rivals. As of writing, the EUR/USD pair was up 0.35% on the day at 1.0232.
FX Strategists at UOB Group Lee Sue Ann and Quek Ser Leang still see USD/CNH extending the consolidative mood between 6.7280 and 6.7800 in the next weeks.
Key Quotes
24-hour view: “We indicated yesterday that the ‘outlook for USD is mixed’ and we expected USD to ‘trade within a range of 6.7380/6.7680’. USD subsequently traded between 6.7348 and 6.7555 before closing largely unchanged (6.7425, -0.03%). The outlook remains mixed and we expect USD to trade between 6.7350 and 6.7650 for today.”
Next 1-3 weeks: “There is not much to add to our update from yesterday (28 Jul, spot at 6.7525). As highlighted, USD is likely to consolidate and trade between 6.7280 and 6.7800.”
- GBP/USD climbs to a one-month high on Friday amid the prevalent USD selling bias.
- Expectations for gradual Fed hike rates, sliding US bond yields undermines the USD.
- The risk-on impulse is exerting additional downward pressure on the safe-haven buck.
The GBP/USD pair gains traction for the third successive day on Friday and jumps to a one-month high during the early European session. Spot prices, however, retreat a few pips from the daily peak, though have managed to hold comfortably above the 1.2200 round-figure mark.
The US dollar selling bias remains unabated on the last day of the week amid speculations that the Fed would not raise interest rates as aggressively as previously estimated. Broad-based USD weakness turns out to be a key factor that continued pushing the GBP/USD pair higher.
In fact, the Fed on Wednesday acknowledged that economic indicators have softened and noted signs of a slowdown. Furthermore, Fed Chair Jerome Powell said that the pace of its hiking campaign could slow at some point and that the move would be dependent on the incoming macro data.
Thursday's disappointing US GDP report reinforced expectations that the Fed would not raise interest rates as aggressively as previously estimated. The market reprising led to a further decline in the US Treasury bond yields, which is exerting additional downward pressure on the buck.
The incoming macro data, meanwhile, have raised concerns about an economic downturn and could force major central banks to ease off their aggressive policy tightening cycle. This, in turn, is booting the global risk sentiment and further undermining the safe-haven greenback.
The British pound is further drawing support from rising bets for a 50 bps rate hike by the Bank of England at its upcoming meeting in August. Apart from this, sustained strength and acceptance above the 1.2200 mark support prospects for a further appreciating move for the GBP/USD pair.
Market participants now look forward to the release of the US Personal Consumption Expenditures (PCE report) - the Fed preferred inflation gauge - later during the early North American session. The data might influence the USD demand and provide a fresh impetus to the GBP/USD pair.
Technical levels to watch
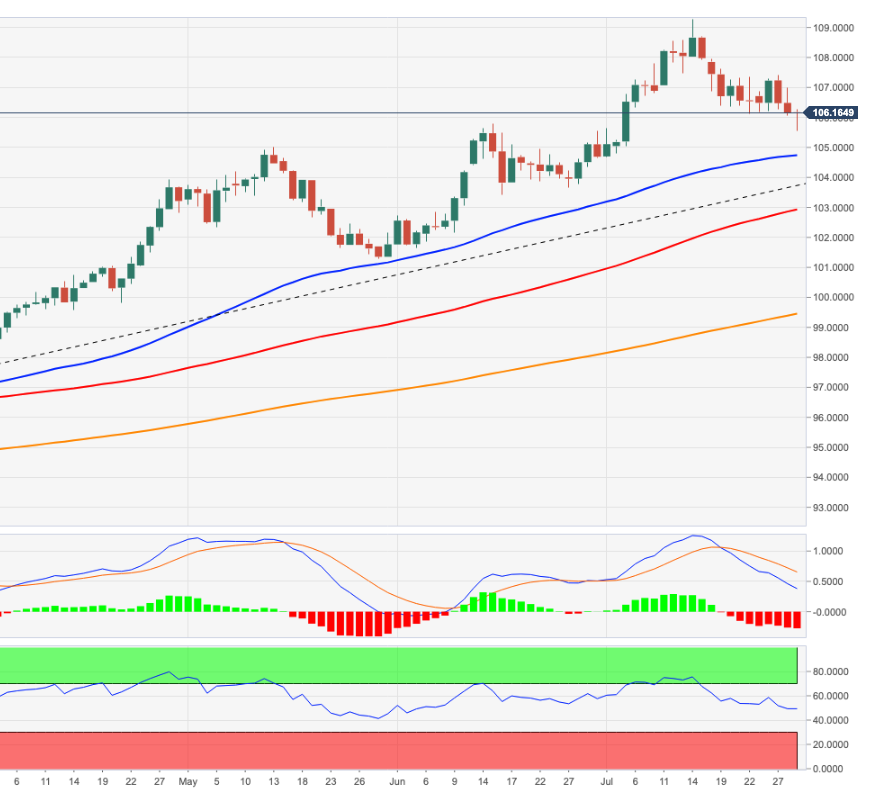
- The index loses the grip further and breaches 106.00.
- Concerns around the US technical recession weigh on the dollar.
- The PCE and the final U-Mich Index will take centre stage later.
The US Dollar Index (DXY), which tracks the greenback vs. a bundle of its main rivals, extends the bearish note to the area below the 106.00 support on Friday.
US Dollar Index focuses on data, recession jitters
The index loses ground for the second session in a row and drops to new 3-week lows in the sub-106.00 region at the end of the week.
The better tone in the risk complex coupled with diminishing US yields continue to weigh on the buck, while investors continue to assess the recently published advanced Q2 GDP figures, which showed the US economy entering a technical recession.
In the US data sphere, the focus of attention is expected to be on the release of the inflation figures tracked by the PCE for the month of June along with the final Consumer Sentiment gauged by the U-Mich Index, Personal Income and Personal Spending.
What to look for around USD
The index accelerates the decline and breaches the 106.00 support to trade in fresh multi-week lows on Friday.
The very-near-term outlook for the dollar now looks deteriorated, particularly following the latest US GDP figures and the prospects for further tightening by the Fed in the next months.
In the meantime, the constructive view in the dollar still appears bolstered by the Fed’s divergence vs. most of its G10 peers (especially the ECB) in combination with bouts of geopolitical effervescence and occasional re-emergence of risk aversion.
Key events in the US this week: PCE Price Index, Personal Income, Personal Spending, Final Michigan Consumer Sentiment (Friday).
Eminent issues on the back boiler: Hard/soft/softish? landing of the US economy. Escalating geopolitical effervescence vs. Russia and China. Fed’s more aggressive rate path this year and 2023. US-China trade conflict. Future of Biden’s Build Back Better plan.
US Dollar Index relevant levels
Now, the index is down 0.52% at 105.64 and faces initial support at 104.72 (55-day SMA) followed by 103.67 (weekly low June 27) and finally 103.41 (weekly low June 16). On the other hand, a break above 107.42 (weekly high post-FOMC July 27) would expose 109.29 (2022 high July 15) and then 109.77 (monthly high September 2002).
- Gold scales higher for the third straight day and climbs to a multi-week high on Friday.
- The post-FOMC USD selling, tumbling US bond yields continued to benefit the metal.
- The risk-on impulse might be the only factor capping gains ahead of the US PCE report.
Gold is building on the previous day's breakout momentum beyond the $1,745-$1,750 resistance zone and gains traction for the third successive day on Friday. The momentum pushes the XAU/USD to over a three-week high, around the $1,767-$1,768 region during the early European session and was sponsored by the prevalent US dollar selling bias.
The Federal Reserve on Wednesday acknowledged that economic indicators have softened and noted signs of a slowdown. Furthermore, Fed Chair Jerome Powell hinted that the US central bank could slow the pace of its hiking campaign at some point and that the move would be dependent on the incoming data. Apart from this, the disappointing release of the Advance US GDP report on Thursday further fueled speculations that the Fed would not raise interest rates as aggressively as previously estimated. This turns out to be a key factor that continued weighing on the greenback and offering support to the dollar-denominated gold.
The markets are now pricing in just 92 bps of cumulative tightening by the end of 2022, down from 108 bps before the Fed decision on Wednesday. This led to a further decline in the US Treasury bond yields, which is exerting additional downward pressure on the buck. In fact, the yield on the 10-year US government bond has now dropped to its lowest level since April and contributing to driving flows towards the non-yielding yellow metal. Friday's follow-through move up could further be attributed to technical buying above the $1,745-$1,750 horizontal barrier, though the risk-on impulse might cap gains for gold.
The incoming macro data have raised concerns about an economic downturn and could force major central banks to ease off their aggressive policy tightening cycle. This, in turn, is booting investors' confidence and is evident from a generally positive tone around the equity markets, which could act as a headwind for the safe-haven XAU/USD. Nevertheless, gold remains on track to register strong gains for the second successive week. Market participants now look forward to the US Personal Consumption Expenditures (PCE report) - the Fed preferred inflation gauge - for fresh impetus later during the early North American session.
Technical levels to watch
Extra weakness could drag USD/JPY to revisit the 133.80 region in the near term, note FX Strategists at UOB Group Lee Sue Ann and Quek Ser Leang.
Key Quotes
24-hour view: “While we expected USD to weaken yesterday, we were of the view ‘135.00 is likely out of reach for now’. The anticipated weakness exceeded our expectations by a wide margin as USD plunged to a low of 134.18. While deeply oversold, the weakness in USD could extend but a break of the next major support at 133.80 appears unlikely. On the upside, a breach of 135.25 (minor resistance is at 134.90) would indicate that the weakness in USD has stabilized.”
Next 1-3 weeks: “We highlighted yesterday that the rapidly improving shorter-term downward momentum suggests the risk for USD is on the downside towards 135.00. Our view for a weaker USD was not wrong but we did not anticipate the outsized sell-off as USD plunged by 1.66% (NY close of 134.28), its largest 1-day drop since Nov last year. Not surprisingly, downward momentum remains strong and USD is likely to weaken further. The next level to monitor is at 133.80. The downside risk is intact as long as USD does not move above 135.85 (‘strong resistance’ level was at 137.00 yesterday).”
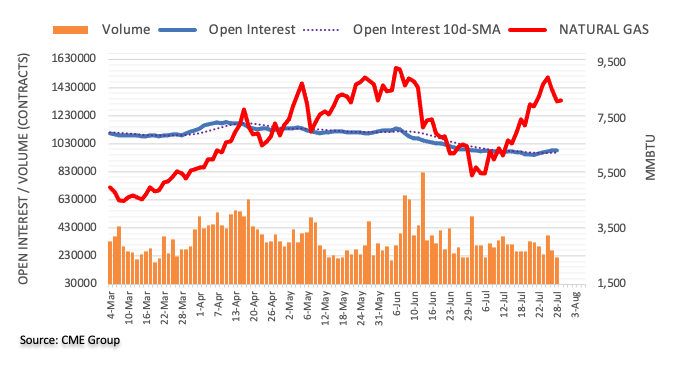
Considering advanced prints from CME Group for natural gas futures markets, open interest shrank by around 1.2K contracts on Thursday following four consecutive daily builds. Volume followed suit and went down by around 50.9K contracts, adding to Thursday’s daily drop.
Natural Gas appears supported near $8.00
Prices of natural gas extended the weekly leg lower on Thursday amidst shrinking open interest and volume. Against that, further downside appears not favoured in the very near term and the commodity could resume the uptrend with the next target at the key $10.00 mark per MMBtu.
FX option expiries for July 29 NY cut at 10:00 Eastern Time, via DTCC, can be found below.
- EUR/USD: EUR amounts
- 1.0050 1.1b
- 1.0125 440m
- 1.0200 1.5b
- 1.0250 2.8b
- 1.0300 645m
- 1.0350 495m
- GBP/USD: GBP amounts
- 1.1700 485m
- 1.2100 985m
- USD/JPY: USD amounts
- 134.15 300m
- 135.00 532m
- 135.90 991m
- 136.50 350m
- 137.00 404m
- 140.00 1.3b
- USD/CHF: USD amounts
- 0.9600 250m
- 0.9740 370m
- AUD/USD: AUD amounts
- 0.6750 401m
- 0.7000 301m
- USD/CAD: USD amounts
- 1.2695 435m
- 1.2830 576m
- 1.2920 960m
- 1.3060 260m
- 1.3195 671m
- EUR/GBP: EUR amounts
- 0.8800 421m
Reuters quoted Eurozone monetary market data to signal the receding hawkish bets on the European Central Bank’s (ECB) 50 basis points (bps) rate hike in September.
“Eurozone money markets now price in roughly 44% chance of 50 bps ECB September rate hike versus 50% earlier in the week,” said the update.
The reduction in the bullish bias over the ECB’s next move could be linked to the broad fears of recession and the downbeat Treasury yields, not to forget the Eurozone crisis.
EUR/USD bulls take a breather
Following the news, EUR/USD prices retreat from the intraday high, also near the weekly top, as traders await the key inflation data from Eurozone and the US. That said, the major currency pair earlier poked the weekly high before easing from 1.0254 at the latest.
In the opinion of FX Strategists at UOB Group Lee Sue Ann and Quek Ser Leang, further gains in AUD/USD could reach the 0.7040 region in the next few weeks.
Key Quotes
24-hour view: “We highlighted yesterday that AUD ‘is unlikely to strengthen much further’ and we expected it to ‘trade between 0.6965 and 0.7020’. AUD subsequently traded within a lower range than expected (0.6955/0.7014) before closing largely unchanged at 0.6993 (-0.02%). The underlying tone has firmed somewhat and AUD could edge higher to 0.7020. The major resistance at 0.7040 is unlikely to come under threat. Support is at 0.6975 followed by 0.6955.”
Next 1-3 weeks: “There is no change in our view from yesterday (28 Jul, spot at 0.6990). As highlighted, while upward momentum has not improved by much, there is scope for AUD to advance further to 0.7040. At this stage, the odds for AUD to rise to the next resistance at 0.7070 are not high. On the downside, a breach of 0.6935 (no change in ‘strong support’ level from yesterday) would indicate that the current upward pressure has eased.”
- USD/TRY pares early gains as DXY renews three-week low.
- CBRT raised annual inflation forecasts to 60.4% versus 42.8% expected in April.
- “Technical recession” drowns US Treasury yields, greenback ahead of Fed’s preferred inflation gauge.
USD/TRY extends pullback from intraday high to pare daily gains around 17.93 during early Friday morning in Europe. In doing so, the Turkish lira (TRY) pair justifies the broad US dollar weakness while trying to overcome the bearish bias triggered by the Central Bank of the Republic of Türkiye’s (CBRT) Quarterly Inflation Report.
That said, the US Dollar Index (DXY) drops to the lowest level since July 05 as the Treasury yields remain pressured around a three-month low amid recession fears. The US 10-year Treasury yields fade early Asian session rebound while declining to the fresh low since April, near 2.66% at the latest.
On Thursday, the initial readings of the second quarter (Q2) 2022 US Gross Domestic Product (GDP) marked “technical recession” as the annualized figures dropped for the second consecutive time. Given the fears of the economic slowdown, the Fed hawks may have to rethink faster/heavier rate hikes, which in turn weigh on the US dollar. Earlier in the week, Fed Chair Jerome Powell teased “neutral rates” and drowned the greenback.
Elsewhere, Reuters quotes the CBRT’s quarterly inflation report while saying, “Turkey's central bank raised its annual inflation forecast to 60.4% for the year-end from 42.8% three months ago, continuing a trend of playing catch up with extreme price rises, according to a presentation by Governor Sahap Kavcioglu on Thursday.”
The economic fears and the shift in the Fed’s hawkish bias appeared to have weighed on the US dollar. Even so, fears of more inflation and the CBRT’s inability to raise rates appear to propel the pair’s prices.
Moving on, the Fed’s preferred inflation gauge, namely the Core Personal Consumption Expenditure (PCE) Price Index, expected 0.5% MoM for July versus 0.3% prior, will be important for near-term USD/TRY direction.
Technical analysis
Unless breaking the monthly support line, around 17.80 by the press time, USD/TRY buyers remain hopeful of crossing the late 2021 peak surrounding 18.37.
CME Group’s flash data for crude oil futures markets noted traders added more than 11K contracts to their open interest positions on Thursday following two daily pullbacks in a row. On the other hand, volume dropped by around 35.5K contracts after two consecutive daily builds.
WTI could retest the 200-day SMA around $95.00
WTI prices retreated from the boundaries of the $100.00 mark per barrel on Thursday amidst rising open interest. Against that, WTI could extend the decline in the very near term and challenge the key 200-day SMA, today at $95.00.
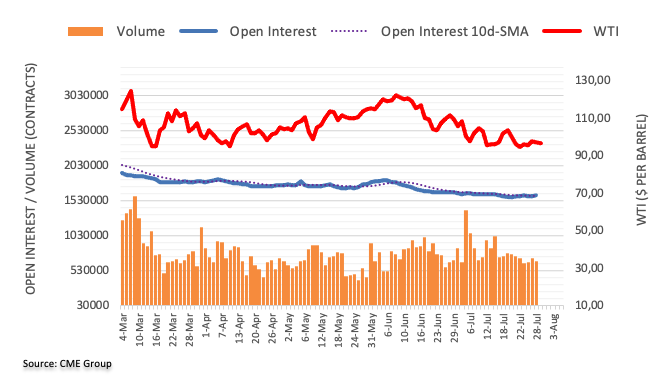
Here is what you need to know on Friday, July 29:
The dollar selloff continues early Friday with the US Dollar Index falling to its weakest level since early July below 106.00. The positive shift witnessed in market mood despite the disappointing macroeconomic data releases from the US caused the greenback to continue to lose interest. The European economic docket will feature second-quarter Gross Domestic Product for the euro area alongside the preliminary Harmonised Index of Consumer Prices (HICP) data for July. Ahead of the weekend, the US Bureau of Economic Analysis (BEA) will release the Personal Consumption Expenditures (PCE) Price Index data, the Federal Reserve's preferred gauge of inflation.
On Thursday, the advance estimate of the BEA revealed that the US economy contracted at an annualized rate of 0.9% in the second quarter. According to the CME Group FedWatch Tool, the probability of a 75 basis points rate hike in September fell toward 20% after this data, putting additional weight on the dollar's shoulders. Meanwhile, the sharp upsurge witnessed in Wall Street's main indexes on the back of upbeat earnings figures allowed risk flows to continue to dominate the financial markets. Early Friday, US stock index futures are up between 0.3% and 1.4%.
After having dropped toward 1.0100 during the European trading hours on Thursday, EUR/USD managed to stage a rebound and closed the day little changed near 1.0200. In the early European morning, the pair posts small daily gains above 1.0200. Commenting on the policy outlook, European Central Bank (ECB) Governing Council member Ignazio Visco said on Thursday that they don't have to worry about the exchange rate for the time being, making it difficult for the shared currency to outperform its rivals. The euro area economy is expected to grow by 0.2% on a quarterly basis in the second quarter. The HICP is forecast to remain unchanged at 8.6%.
GBP/USD continues to push higher toward 1.2200 on Friday and trades at its highest level in a month. The Bank of England (BOE) will release the Consumer Credit data for June in the European session.
USD/JPY lost more than 200 pips on Thursday and is already down 100 pips on Friday, trading below 133.00. The sharp decline witnessed in US Treasury bond yields seems to be weighing heavily on the pair. The benchmark 10-year US Treasury bond yield, which fell nearly 4% on Thursday, was down 0.75% at 2.66% at the time of press.
Gold continues to push higher on Friday and trades at its highest level in three weeks above $1,760. Falling yields and the broad-based dollar weakness fuel XAU/USD's rally.
Bitcoin took advantage of the improving market mood and gained nearly 4% on Thursday before going into a consolidation phase near $24,000. Ethereum rose more than 5% on Thursday and trades flat above $1,700 in the European morning.
- USD/CAD is likely to surrender the cushion of 1.2800 as the DXY has extended its losses.
- Lower GDP and a higher inflation rate will create more troubles for the Fed.
- The Canadian economy is expected o contract by 0.2% against the expansion of 0.3%.
The USD/CAD pair is hovering around the psychological support of 1.2800 and is gearing up for a downside move as the US dollar index (DXY) has extended its losses after violating the five-day-old support at 106.00. The asset has remained sideways in the Asian session and is likely to turn imbalance on the downside as lower US Gross Domestic Product (GDP) data has triggered recession fears in the mighty US economy.
On Thursday, the US Bureau of Economic Analysis reported the annual Gross Domestic Product (GDP) at -0.9%, improved from the prior contraction of -1.6% but lower than the expectations of 0.5%. A consecutive contraction in the US economy has resulted in a steep fall in the DXY. The asset has printed a fresh three-week low of 105.85.
Investors should be aware of the fact that the Federal Reserve (Fed) has been announcing policy tightening measures unhesitatingly as solid fundamentals in the US economy were supporting Fed policymakers to sound hawkish with confidence. In today’s session, investors will focus on the release of the US Personal Consumption Expenditure (PCE), which is seen high at 6.7%. Price pressures have yet not displayed exhaustion signals and the lower GDP numbers are not going to delight Fed chair Jerome Powell.
On the loonie front, the Canadian economy will report the GDP numbers. As per the market estimates, the Canadian economy will contract by 0.2% against the expansion of 0.3% recorded earlier. An occurrence of the same will weaken the loonie bulls.
"The depreciation of the euro has been one of the factors behind the high inflation," said European Central Bank (ECB) Vice President Luis de Guindos during an interview with local media Postimees late Thursday.
Additional comments
We at the ECB don't target the exchange rate. But it is a very important macroeconomic indicator that we take into account when making our projections.
The main factor that will guide our decisions will be the evolution of inflation.
The recent projections of the European Commission clearly show a slowdown in growth, while inflation is expected to remain high in the coming months.
We hope countries and governments will apply the correct fiscal and structural policies in line with the EU’s recovery plan.
EUR/USD remains firmer
EUR/USD stays on the front foot as bulls attack 21-day EMA hurdle amid broad US dollar weakness.
Also read: EUR/USD Price Analysis: Bulls poke 1.0230 hurdle ahead of key EU/US inflation data
- Silver price pokes the monthly top marked on July 01.
- Successful break of descending trend line from April 18 joins bullish MACD signals to keep buyers hopeful.
- May’s low, 50-DMA could challenge short-term upside moves.
- Sellers need validation from 20-DMA to retake control.
Silver price (XAG/USD) marches above $20.00 during the four-day uptrend heading into Friday’s European session. In doing so, the bright metal extends the previous day’s upside break of a three-month-old resistance towards refreshing the three-week top.
In addition to the trend line breakout, the bullish MACD signals and successful trading above the 21-DMA also favor XAG/USD buyers.
However, May’s low and the 50-DMA, respectively around $20.45 and $20.55, could challenge the metal’s further upside. Also acting as the upside hurdle is the mid-June swing low near $20.90 and the $21.00 threshold.
Should the quote remain firmer past $21.00, the odds of witnessing a run-up towards June’s high near $22.50 can’t be ruled out.
Meanwhile, pullback moves may aim for the $20.00 round figure before revisiting the previous resistance line, at $19.35 by the press time.
Even so, the silver bears should remain cautious until the quote stays beyond the 21-DMA support level near $19.00.
Following that, a south-run to renew the yearly low of $18.14, marked earlier in July, can be anticipated.
Silver: Daily chart
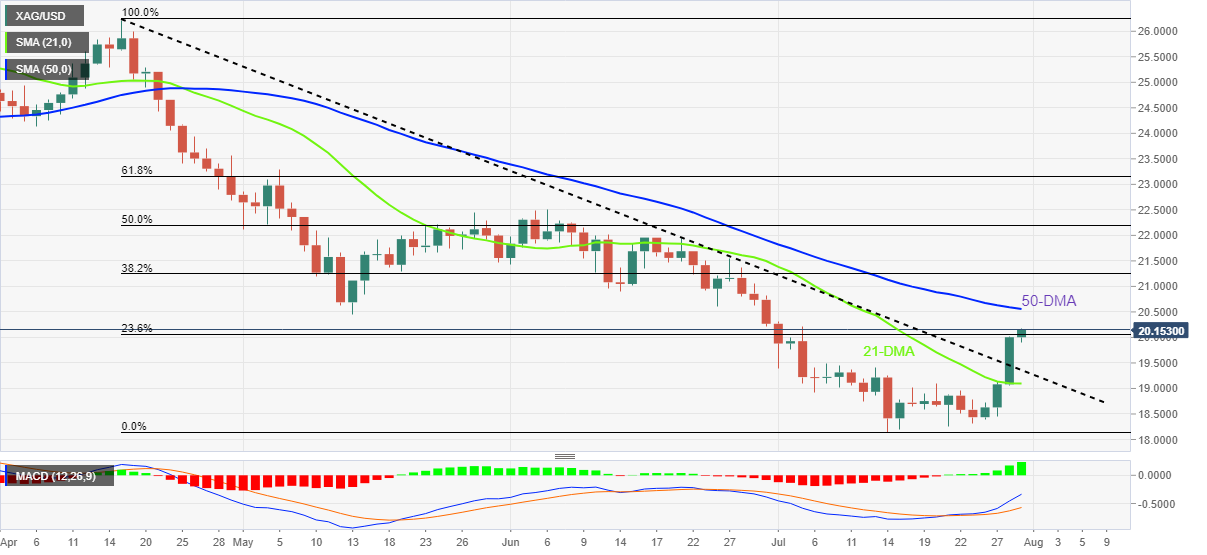
Trend: Further upside expected
Extra gains appear likely in GBP/USD with a potential target at the 1.2240 level in the short term, suggested FX Strategists at UOB Group Lee Sue Ann and Quek Ser Leang.
Key Quotes
24-hour view: “We highlighted yesterday that ‘the rapid rise has room to extend but in view of the overbought conditions, the major resistance at 1.2240 is unlikely to come into the picture’. We added, ‘there is another resistance at 1.2200’. GBP advanced less than expected as it eased off from a high of 1.2192. While upward momentum has not improved by much, GBP could edge above 1.2200. However, the major resistance at 1.2240 is still unlikely to come into the picture. Support is at 1.2145 followed by 1.2115.”
Next 1-3 weeks: “Our update from yesterday (28 Jul, spot at 1.2165) still stands. As highlighted, GBP is likely to trade with an upward bias towards 1.2240. The upside risk is intact as long as GBP does not move below 1.2065 (no change in ‘strong support’ level from yesterday) within these few days.”
- USD/CHF declines for the fourth consecutive day as bears attack June’s low.
- Yields drown the US dollar amid “technical recession”, SNB’s Q2 result also favors bears.
- Swiss KOF Leading Indicator, US PCE Price Index for July could direct immediate moves.
USD/CHF takes offers to refresh the monthly low near 0.9515 heading into Friday’s European session amid broad US dollar weakness.
The Swiss currency (CHF) pair’s latest losses could be linked to the recession fears in the US and extended south-run by the US Treasury yields. Also exerting downside pressure on the USD/CHF prices is the cautious mood ahead of the Fed’s preferred inflation gauge, namely the Core Personal Consumption Expenditure (PCE) Price Index, expected 0.5% MoM for July versus 0.3% prior.
It’s worth noting that the US Dollar Index (DXY) drops to the lowest level since July 05 as the Treasury yields remain pressured around a three-month low amid recession fears. The US 10-year Treasury yields fade early Asian session rebound while declining to the fresh low since April, near 2.66% at the latest.
Following Fed Chair Jerome Powell’s teasing of “neutral rates”, USD/CHF traders should have traced the Flash readings of the US Q2 GDP, which marked the “technical recession” by declining for the second consecutive time, to decline further. That said, the first estimations of the US Q2 GDP printed -0.9% Annualized figure versus 0.5% expected and -1.6% prior. Further, the US Initial Jobless Claims also rose more than expected by 253K, with 256K during the week ended on July 22.
Elsewhere, US policymakers, including Fed’s Powell and Treasury Secretary Janet Yellen, tried to tame the economic recession fears but fail to succeed of late.
Even so, the downbeat yields and challenges for the hawkish Fed moves appear to have favored the US stock futures, as well as the Asia-Pacific shares, as USD/CHF traders await the Swiss KOF Leading Indicator for July, expected 95.2 versus 96.9 prior.
On a different page, the Swiss National Bank (SNB) posts the biggest ever first-half loss per Reuters and should have ideally weighed on the USD/CHF prices but did not. “The Swiss National Bank reported a first-half loss of 95.2 billion Swiss francs ($100.08 billion) on Friday, the biggest six-month loss posted by the central bank since it was set up in 1907,” said Reuters. The news also mentioned that the SNB's results were hit by stock market declines, falling bond prices and the franc's appreciation which severely dented the value of its massive foreign currency holdings.
Technical analysis
A clear downside break of the four-month-old ascending trend line, near 0.9600 by the press time, directs USD/CHF sellers towards the 16-month-long horizontal support zone near 0.9595-72.
Open interest in gold futures markets increased by nearly 4K contracts on Thursday after five consecutive daily pullbacks, according to preliminary readings from CME Group. Volume, instead, reversed two daily builds in a row and shrank by around 29.2K contracts.
Gold: On its way to $1,800?
Gold prices extended the rebound on Thursday on the back of rising open interest, which leaves the door open to the continuation of the uptrend in the very near term. That said, the next target of note emerges at the key $1,800 mark per ounce troy.
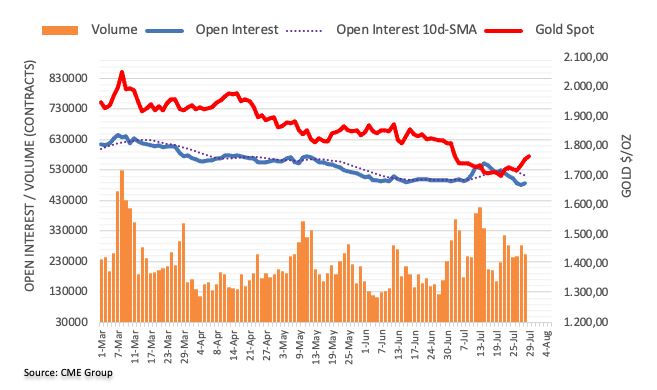
- Asian equities have not followed the footprints of S&P500 and have tumbled broadly.
- Chinese equities are underperforming as investors await Caixin Manufacturing PMI data.
- Asian nations will also face the consequences of contraction in the US economy.
Markets in the Asian domain have not followed the upbeat performance from the S&P500 on Friday. The US markets remained bullish on Thursday on optimism over corporate earnings in the US. However, a follow-up move has not been observed in the Asian indices as investors have turned cautious ahead of US Personal Consumption Expenditure (PCE) inflation data.
At the press time, Japan’s Nikkei225 eased 0.30%, China A50 plunged by 1.50%, Hang Seng dived 2.16% while Nifty50 jumped almost 1%.
Chinese equities are underperforming as investors have shifted their focus toward Caixin Manufacturing PMI data, which is due on Monday. The economic data is expected to remain subdued as manufacturing activities were restricted in China on the resurgence of Covid-19. Also, the arrival of monsoons in various provinces of China has postponed construction, infrastructure, and other economic activities.
Meanwhile, the extreme sell-off in the US dollar index (DXY) has failed to support Asian equities. It is worth noting that the reason behind the downside play in the DXY is the acceleration of recession signals in the US. The economy has reported a contraction consecutively as the Gross Domestic Product (GDP) has landed at -0.9%, significantly lower than the estimates of 0.5%.
Also, the Japanese Ministry of Finance announced a budget reserve of 257 billion Japanese yen to combat rising oil and food product prices. This may support the wage prices to keep the inflation rate above 2% in the Japanese economy.
Early Friday morning in Europe, Reuters quotes a draft proposal for the Financial Year 2023 (FY2023) budget compilation while saying, “Japan to include economic security, steps to respond to fx moves as items for consideration in FY2023 budget compilation.”
The news adds to the Japanese yen (JPY) as it drops nearly 1.0% versus its US counterpart by the press time. That said, the USD/JPY was last seen taking offers at around 133.00.
It should be noted that the yen’s strength contrasts with the US dollar’s broad weakness amid the downbeat Treasury yields and the “technical recession” chatters to exert downside pressure on the USD/JPY prices of late.
That said, US policymakers, including Fed’s Powell and Treasury Secretary Janet Yellen, tried to shrug off the “technical recession” after the US Q2 GDP dropped for the second consecutive time and teased the concept. The same probes the central bankers pushing for more rate hikes to tame inflation and hence drowning the US dollar.
Also read: USD/JPY Price Analysis: Plunges to near 133.00 on breaking 50-EMA, 130.00 eyed
FX Strategists at UOB Group Lee Sue Ann and Quek Ser Leang noted EUR/USD is expected to remain within the 1.0100-1.0285 range in the next few weeks.
Key Quotes
24-hour view: “We highlighted yesterday that ‘there is scope for EUR to advance further but a sustained rise above 1.0250 appears unlikely’. However, EUR did not threaten 1.0250 as it dropped from 1.0234 to 1.0112 before snapping back up to end the day little changed at 1.0196 (0.06%). The choppy price actions appear to be part of a consolidation phase and EUR is likely to trade between 1.0135 and 1.0235 for today.”
Next 1-3 weeks: “There is not much to add to our update from yesterday (28 Jul, spot at 1.0205). As highlighted, the current movement in EUR appears to be part of a consolidation and it is likely to trade between 1.0100 and 1.0285 for now.”
- GBP/JPY stays offered at two-week low, extends the previous day’s losses.
- Clear break of 100-DMA, ascending trend line from May joins downbeat oscillators to favor sellers.
- Bulls need a successful run-up beyond 166.35 to retake control.
GBP/JPY stands on slippery grounds as bears smash the 162.50 support confluence heading into Friday’s European session. With this, the cross-currency pair also renews the two-week low while extending the previous day’s losses.
In addition to the break of the 100-DMA and an 11-week-old ascending trend line, the bearish MACD signals and downbeat RSI (14) also keep GBP/JPY sellers hopeful.
That said, an upward sloping trend line from early March, near 161.20 lures the bears before the 50% Fibonacci retracement of March-June upside, near 159.85.
However, the 200-DMA level of 158.34 could challenge the GBP/JPY sellers afterward.
Alternatively, recovery remains elusive below 162.50, a clear upside break of which could direct the GBP/JPY bulls towards the weekly resistance area near 166.30-35.
It should be noted that the highs marked in June, around 167.85 at the latest, could act as a buffer during the pair’s run-up towards the yearly peak of 168.73.
Overall, GBP/JPY flashed signals of further downside but there prevails a little room to the south.
GBP/JPY: Daily chart
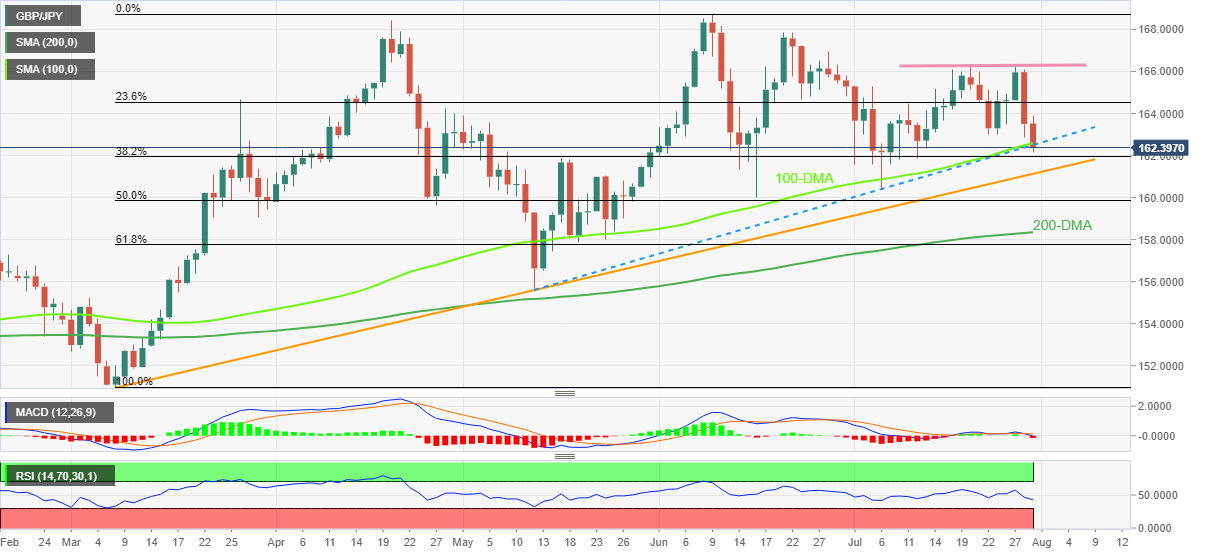
Trend: Further weakness expected
- A short-lived rebound by the EUR/JPY pair has turned into a fresh downside wave.
- Eurozone GDP is likely to land on the downside to 3.4% vs. 5.4% reported earlier.
- Japanese Ministry of Finance has announced a budget reserve of 257 billion yen to combat il and food prices.
The EUR/JPY pair has picked bids around 136.00 and a modest rebound has been displayed. The short-lived reversal is likely to evaporate sooner as investors are awaiting the release of the eurozone Gross Domestic Product (GDP), which is due on Friday.
As per the market expectations, the eurozone GDP is expected to shift lower to 3.4%from the prior release of 5.4%. The European economy is facing the headwinds of an energy crisis as demand for energy is expected to surge due to the upcoming Winter season and Russia has cut off the gas supply from its main pipeline.
It is worth noting that the European Union (EU) was already looking for another potential that could address its bumper demand for oil and gas. However, finding an energy supplier who can offset the energy imports from Russia is not a cakewalk. Europe caters to more than 25% of its oil and gas demand from Russia and it's core member Germany has significant dependence on energy imports from Russia. This has weakened the shared currency bulls dramatically.
On the Tokyo front, the announcement of helicopter money by the Japanese Ministry of Finance to combat rising oil and food product prices has surprisingly strengthened the yen bulls. The agency has announced a budget reserve of 257 billion Japanese yen. The Bank of Japan (BOJ) is committed to keeping the inflation rate above 2%, and soaring oil prices have managed to keep the inflation rate. However, the desired inflation rate with costly fossil fuels is not lucrative for households.
- Copper snaps five-day uptrend while retreating from three-week top.
- US Q2 GDP confirms “technical recession” but policymakers try to defend Fed hawks.
- Hopes for more stimulus from China, softer US dollar tests bears ahead of key US inflation data.
Copper price fail to cheer US dollar weakness as fears of economic slowdown escalate during early Friday in Europe. In doing so, the red metal prints the fourth straight monthly loss during the final days of July. It’s worth noting, however, that the softer US dollar and expectations of China’s stimulus recently challenges the bears.
That said, copper futures on COMEX drop 0.55% intraday to $3.47 by the press time while snapping a five-day uptrend, as well as retreating from the highest levels since July 08.
Elsewhere, the three-month copper on the London Metal Exchange (LME) drops 0.4% to $7,729 a tonne, marking a 6.5% monthly loss to flash the biggest slump since August 2015. Further, the most-traded September copper contract on the Shanghai Futures Exchange (SFE) rose 0.6% to 59,500 yuan ($8,818.34) a tonne.
US Dollar Index (DXY) drops to the fresh low since July 05, around 105.90 by the press time, as the Treasury yields remain pressured around a three-month bottom amid recession fears. The US 10-year Treasury yields fade early Asian session rebound while declining to the fresh low since April, near 2.67% at the latest.
While the yields drop, the US policymakers, including Fed’s Powell and Treasury Secretary Janet Yellen, tried to shrug off the “technical recession” after the US Q2 GDP dropped for the second consecutive time and teased the concept. The same probes the central bankers pushing for more rate hikes to tame inflation and hence drowning the US dollar.
Furthermore, talks between US President Joe Biden and his Chinese Counterpart Xi Jinping also went mostly okay and exerted downside pressure on the greenback’s safe-haven demand. Additionally keeping copper buyers hopeful is China’s readiness for more stimulus as Reuters reported, “China will strengthen efforts to stabilize foreign trade in the second half of the year, the commerce ministry said on Friday.”
Looking forward, the Fed’s preferred inflation gauge, namely the Core Personal Consumption Expenditure (PCE) Price Index, expected 0.5% MoM for July versus 0.3% prior, will be crucial for copper traders to watch for clear directions.
- AUD/USD has overstepped the psychological resistance of 0.7000 amid a weaker DXY.
- The DXY has printed a fresh three-week low of 105.84 as the US economy has contracted consecutively.
- A third consecutive 50 bps rate hike is expected by the RBA next week.
The AUD/USD pair has surpassed the psychological resistance of 0.7000 firmly and has printed an intraday high of 0.7015 in the Tokyo session. The asset has witnessed some significant bids as the US dollar index (DXY) has broken the five-day support of 106.00.
The DXY has printed a fresh three-week low of 105.84 and is likely to display more weakness as a consecutive contraction in the US economy has forced investors to dump the asset.
On Thursday, the US Bureau of Economic Analysis reported the annual Gross Domestic Product (GDP) at -0.9%, improved from the prior contraction of -1.6% but lower than the expectations of 0.5%. This has renewed the recession fears in the US economy.
A contraction in economic activities in times when Federal Reserve (Fed) policymakers are busy fighting the accelerating price pressures is going to dampen street behavior.
In today’s session, investors will keep an eye on US Personal Consumption Expenditure (PCE) data, which is seen at 6.7%, higher than the prior print of 6.3%. This will lead to more policy tightening measures by the Fed.
On the aussie front, investors are awaiting the announcement of the interest rate decision by the Reserve Bank of Australia (RBA), which is due on Tuesday. As per the Reuters poll, RBA Governor Philip Lowe may dictate a third consecutive rate hike by 50 basis points (bps).
- EUR/USD bulls attack 21-day EMA for the eighth time but MACD, RSI hints at gradual firming of upside momentum.
- Seven-week-old descending trend line adds to the upside filters.
- Fortnight-old horizontal support restricts immediate downside.
- Flash readings of Eurozone CPI, US PCE Price Index for July will be crucial to watch.
EUR/USD buyers jostle with the 21-day EMA amid broad US dollar weakness during early Friday morning in Europe. In addition to the key moving average, the cautious sentiment ahead of the Eurozone Consumer Price Index (CPI) and the US Core Personal Consumption Expenditure (PCE) Price Index, also challenge the pair’s upside around 1.0230 resistance.
Also read: EUR/USD retreats from 1.0200, Eurozone GDP, CPI and Fed's preferred inflation in focus
It’s worth noting, however, that the recently firmer RSI (14), not oversold, joins the MACD’s bullish signals to back the price recovery, which in turn keeps bulls hopeful.
That said, the quote’s upside break of 1.0230 could direct the buyers towards a downward sloping resistance line from early June, near 1.0310.
Following that, an area comprising multiple levels marked since May, near 1.0380, will be crucial to watch for the EUR/USD buyers.
On the flip side, a fortnight-long horizontal support zone, near 1.0115-25, limits the pair’s immediate downside ahead of the 61.8% Fibonacci Expansion (FE) of March-March moves close to 0.9950.
It should be observed that the 1.0000 parity level and the December 2002 low near 0.9860 are filters to the south.
EUR/USD: Daily chart
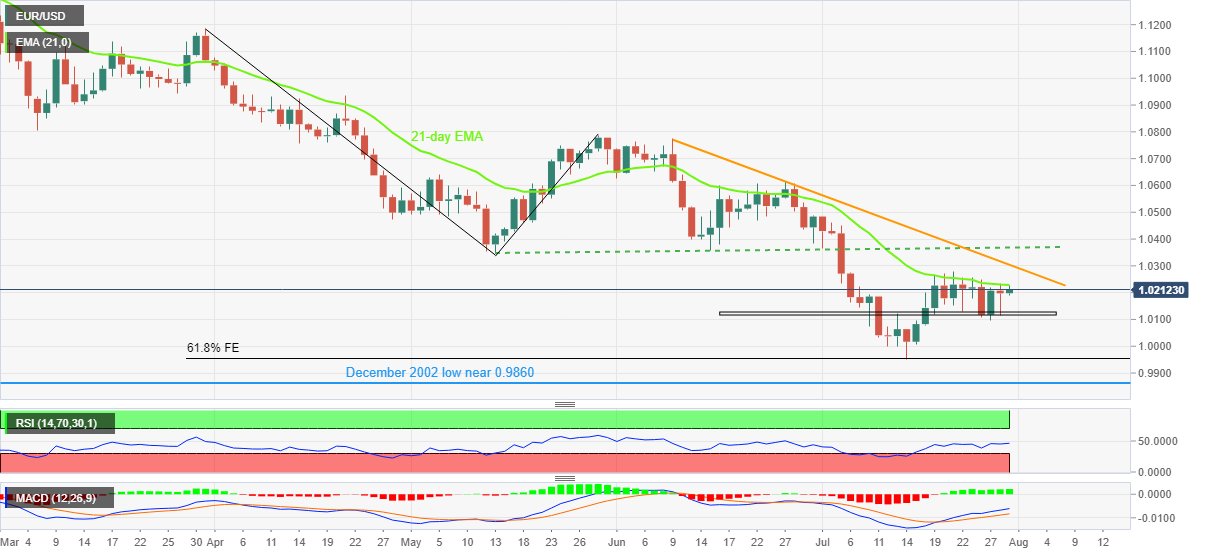
Trend: Further upside expected
- Gold price extends post-Fed upside, as US dollar, yields keep falling.
- US Q2 GDP contraction smashes aggressive Fed rate hike expectations.
- The path of least resistance appears northside for XAU/USD.
Gold price is extending the post-Fed bullish momentum, despite eyeing a fourth straight monthly decline this Friday. The bright metal is set to end with the biggest weekly gain since mid-May, as the US dollar correction strengthens. A less hawkish Fed decision, US Q2 GDP contraction and falling odds of a 75 bps Sept lift-off by the world’s most powerful central bank have weighed heavily on the Treasury yields, as well as, the dollar. Growing recession fears in the US and Europe have underpinned the bullion’s safe-haven appeal. The end-of-the-month flows will likely play a crucial role in impacting gold price along with the US PCE inflation going forward.
Also read: Gold Price Forecast: XAU/USD bulls target $1,773 hurdle after recapturing 21 DMA
Gold Price: Key levels to watch
The Technical Confluence Detector shows that the gold price is looking to extend the uptrend above the pivot point one-day R1 at $1,765.
Acceptance above which will trigger a sharp advance towards the confluence of the SMA200 four-hour and pivot point one-day R2 at $1,773.
Further up, the pivot point one-week R2 at $1,775 will challenge the bearish commitments. Doors will then open up towards the pivot point one-month S1 at $1,781.
On the flip side, the precious day’s high of $1,757 will be the immediate cushion, below which the SMA5 four-hour meet with the pivot point one-month S2 at $1,754
The next stop for sellers is seen at the pivot point one-week R1 at $1,751, followed by the Fibonacci 38.2% one-day $1,748.
Here is how it looks on the tool
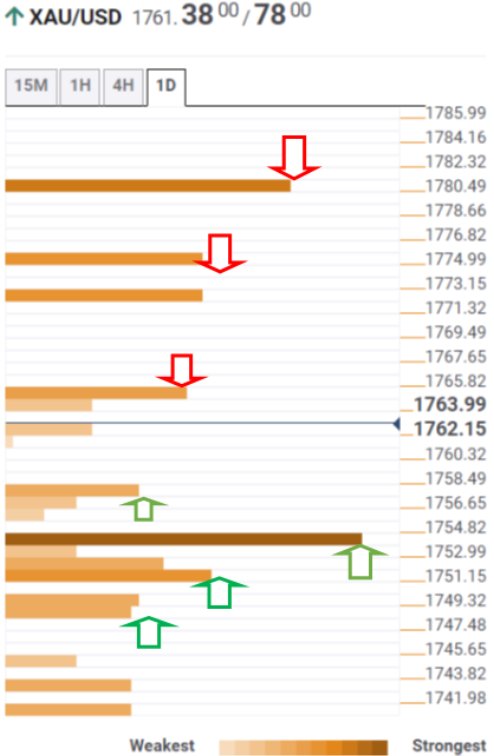
About Technical Confluences Detector
The TCD (Technical Confluences Detector) is a tool to locate and point out those price levels where there is a congestion of indicators, moving averages, Fibonacci levels, Pivot Points, etc. If you are a short-term trader, you will find entry points for counter-trend strategies and hunt a few points at a time. If you are a medium-to-long-term trader, this tool will allow you to know in advance the price levels where a medium-to-long-term trend may stop and rest, where to unwind positions, or where to increase your position size.
- AUD/JPY remains pressured around two-week low, extends the previous day’s losses.
- 50-DMA, six-month-old ascending trend line restricts immediate downside.
- MACD teases bears but 100-DMA acts as an extra filter to the south.
AUD/JPY bears keep reins around the lowest levels in two weeks as they poke 93.45 during early Friday morning in Europe.
In doing so, the cross-currency pair extends the previous day’s losses while pushing bears to attack the crucial support confluence near 93.50, comprising the 50-DMA and an upward sloping trend line from January. It should be noted that the MACD also lures bears and adds strength to the downside bias.
Even so, the 100-DMA support around 92.45 can test the AUD/JPY bears before directing them to the monthly low near 91.40.
It should be noted that the mid-May swing high around 91.20 could challenge sellers past 91.40, a break of which could quickly fetch the quote towards the 90.00 threshold.
Alternatively, recovery remains elusive below March’s high near 94.35.
Following that, a horizontal area comprising multiple levels marked since April 20, close to 95.85 will be a tough nut to crack for the AUD/JPY bulls.
In a case where the pair successfully crosses the 95.85 hurdle, the odds favoring its run-up towards the yearly peak of 96.88 can’t be ruled out.
AUD/JPY: Daily chart
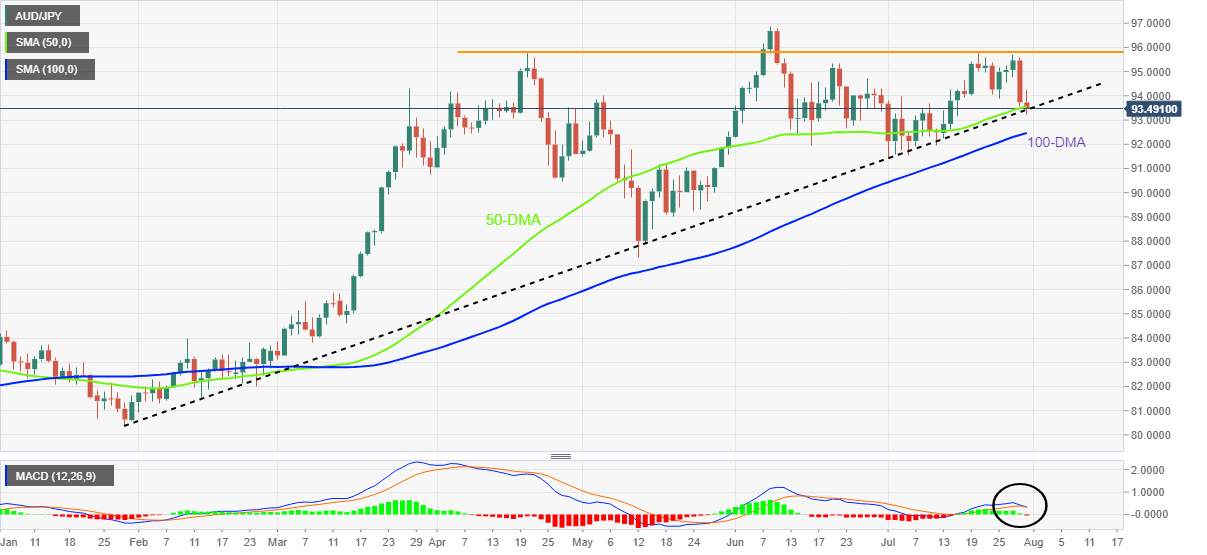
Trend: Further weakness expected
- A swift downside break of 50-EMA has weakened the greenback bulls.
- The RSI (14) has slipped below 40.00 for the first time in the past six months.
- Bears are unleashed now and may drag towards the psychological support of 130.00.
The USD/JPY pair has given a downside break of the consolidation formed in a narrow range of 134.18-134.67 in the Asian session. The downside break is extremely sheer and has dragged the asset below 133.23 in no time. Yen bulls don’t seem losing their stream anytime soon and will drag the asset further ahead.
On the daily scale, a downside imbalance move from the inventory distribution formed in a range of 135.57-137.96 has dragged the asset swiftly. The major has tumbled from the 50-period Exponential Moving Average (EMA) at 132.99, which confirms that the short-term trend has turned bearish.
The 100-period EMA at 130.33 is still advancing and holds the bullish long-term context for now.
Meanwhile, the Relative Strength Index (RSI) (14) has slipped below 40.00 for the first time in the past six months. The momentum oscillator indicates more downside, shows no signs of divergence, and is oversold for now.
A decisive move below Friday’s low at 133.00 will drag the asset towards the demand zone in a 131.28-131.54 range, followed by psychological support at 130.00.
On the flip side, the greenback bulls could defend the odds of a bearish reversal if the asset oversteps July 22 high at 137.96, which will drive the asset towards July 21 high at 138.88. A breach of the latter will send the major towards all-time highs at 139.39.
USD/JPY daily chart
-637946643288987910.png)
- Steel price takes the bids to extend previous day’s gains towards monthly top.
- China’s steel exports dropped in June, signs of further output reduction persist.
- DXY renews multi-day low as “technical recession” chatters push back Fed hawks.
- US PCE inflation data will be crucial for fresh directions.
Steel price remains on the front foot as bulls revisit the early July highs amid softer US dollar and supply crunch fears during Friday’s Asian session. Also keeping the metal buyers hopeful are the headlines suggesting more stimulus from the largest customer China.
While portraying the mood, the most active steel rebar contract on the Shanghai Futures Exchange (SFE) rises to a three-week high of around 4,000 yuan per metric tonne (close to $537). It’s worth noting that the stainless steel contract also recovered from the two-month low, up 1.32% on a day around 15,280 yuan per metric tonne at the latest.
“In the first half of 2022, China exported a total of 33.46 million mt of semi and finished steel, a year-on-year decrease of 10.5%, and imported a total of 5.77 million mt of semi and finished steel, a year-on-year decrease of 21.5%,” said SMM news.
On a different page, US Dollar Index (DXY) drops to the fresh low since July 05 as the Treasury yields remain pressured around a three-month low amid recession fears. The US 10-year Treasury yields fade early Asian session rebound while declining to the fresh low since April, near 2.67% at the latest.
Additionally helping steep price is China’s readiness for more stimulus as Reuters reported, “China will strengthen efforts to stabilize foreign trade in the second half of the year, the commerce ministry said on Friday.”
However, fears of the “technical recession” weigh on the metal prices after the US Q2 Gross Domestic Product (GDP) dropped for the second consecutive time and teased the concept.
To sum up, the supply crunch and softer US dollar appear to please the metal buyers. However, the impending release of the Fed’s preferred inflation gauge, namely the Core Personal Consumption Expenditure (PCE) Price Index, expected 0.5% MoM for July versus 0.3% prior, tests the upside moves.
- USD/INR remains pressured at the lowest levels in three weeks.
- IMF suggests several Asian central banks must raise interest rates rapidly to tame inflation.
- Softer US dollar, oil prices also favor sellers amid sluggish session.
- US Core PCE Price Index will be crucial for fresh impulse amid “technical recession” chatters.
USD/INR drops to the fresh low in three weeks while taking offers at 79.48 during Friday’s Asian session. In doing so, the Indian rupee (INR) pair benefits from the US dollar weakness and hawkish comments from the International Monetary Fund (IMF).
US Dollar Index (DXY) drops to the fresh low since July 05 as the Treasury yields remain pressured around a three-month low amid recession fears. The US 10-year Treasury yields fade early Asian session rebound while declining to the fresh low since April, near 2.67% at the latest.
Elsewhere, a senior International Monetary Fund (IMF) official said, per Reuters, “Several Asian central banks must raise interest rates rapidly, because inflationary pressures are rising due to a global surge in food and fuel costs caused by the war in Ukraine.” The news also mentioned that outflows had been especially large for India, which had seen $23 billion move out since Russia's invasion of Ukraine, he wrote. Outflows had also been seen in such economies as South Korea and Taiwan.
It should be noted that the downbeat prices of WTI crude oil, down 0.65% around $96.00, extends the previous day’s pullback from the weekly top, as slowdown fears weigh on the black gold.
That said, US policymakers, including Fed’s Powell and Treasury Secretary Janet Yellen, tried to shrug off the “technical recession” after the US Q2 GDP dropped for the second consecutive time and teased the concept. The same probes the central bankers pushing for more rate hikes to tame inflation and hence drowning the US dollar. Furthermore, talks between US President Joe Biden and his Chinese Counterpart Xi Jinping also went mostly okay and exerted downside pressure on the greenback’s safe-haven demand.
Additionally helping the INR is China’s readiness for more stimulus as Reuters reported, “China will strengthen efforts to stabilize foreign trade in the second half of the year, the commerce ministry said on Friday.”
Looking forward, the first readings of German and Eurozone GDP for the second quarter (Q2) of 2022 will be important ahead of the Fed’s preferred inflation gauge, namely the Core Personal Consumption Expenditure (PCE) Price Index, expected 0.5% MoM for July versus 0.3% prior.
Technical analysis
A daily closing below the ascending support line from May 05, at 79.58 by the press time, becomes necessary for the USD/INR bears to keep reins. Otherwise, a corrective pullback towards the 80.00 threshold can’t be ruled out.
- GBP/USD is holding its intraday gains around 1.2180 as DXY has surrendered a five-day cushion.
- A higher consensus for US PCE is compelling for more rate hikes further.
- The BOE may announce a 50 bps rate hike in its monetary policy meeting next week.
The GBP/USD pair is displaying back and forth moves in a narrow range of 1.2168-1.2183 in the Asian session. The cable has remained in the grip of bulls for the past two weeks after the US dollar index (DXY) shifted into a negative trajectory on lower long-run inflation expectations. Meanwhile, the DXY has surrendered around 3% and is gearing up for more downside as signs of recession have bolstered in the US.
The DXY has violated the five-day support of 106.06 and a fresh monthly low looks imminent ahead. In today’s session, the release of the US Personal Consumption Expenditure (PCE) Inflation will be the show-stopper event. Federal Reserve (Fed)’s preferred inflation indicator is expected to climb to 6.7% from the prior figure of 6.3%.
No doubt, more policy tightening is on cards as price pressures have not displayed exhaustion signals yet. As per the commentary from Fed chair Jerome Powell, a target for interest rate is 3.5% by the end of 2022. This indicates that the room for more rate hikes in total by 100 basis points (bps) as current rates stand at 2.25-2.50%.
On the UK front, investors‘ focus will shift to interest rate decisions by the Bank of England (BOE). BOE Governor Andrew Bailey is likely to elevate its interest rates further as the inflation rate has climbed to 9.4% and has not shown any sign of hitting a peak yet. The ongoing upside momentum in the price pressures in the UK could escalate to a two-digit figure swiftly.
An official from China’s Commerce Ministry shed light on the country’s foreign trade situation, in his appearance on Friday.
Key quotes
China’s foreign trade faces high risks, difficulties, and uncertainties.
Will step up support for export credit insurance in H2.
Will expand imports actively, ensure domestic commodity supply.
Will study targeted measures for foreign trade.
- EUR/USD has faced selling pressure while attempting a break above 1.0200 ahead of Eurozone GDP.
- A higher preliminary estimate for US PCE compels for more policy tightening by the Fed.
- Price pressures have not displayed exhaustion yet while retail demand has started declining.
The EUR/USD pair is facing barricades around the psychological resistance of 1.0200 in the Asian session. The asset has displayed exhaustion signals while attempting a break above 1.0200 and is likely to remain in a consolidation as investors are awaiting the release of the US Personal Consumption Expenditure (PCE) inflation, which is due on Friday.
As per the market consensus, the US PCE may elevate to 6.7% from the prior release of 6.3%. Federal Reserve (Fed)’s preferred inflation tool is compelling for adaptation of more policy tightening measures as inflation expectations have not displayed a principal exhaustion signal. Usually, price pressures initiate trimming down when households drop their usual demand due to higher prices intentionally and prices start returning to their optimal position.
According to the commentary from Fed chair Jerome Powell, a slump in retail demand is being observed, however, the inflation rate still needs to display a similar exhaustion pattern. The inflation rate is intended to scale lower in July and display the same in August as oil prices have not remained elevated.
On the eurozone front, the market participants await the release of the Gross Domestic Product (GDP) numbers. The economic data is seen lower at 3.4% on an annual basis than 5.4% recorded earlier. An occurrence of the same will weaken the shared currency bulls. The trading bloc is already facing the heat of the energy crisis after Russia cut off the energy supply from its main pipeline and over that pressure from the GDP front will dampen the market sentiment.
- Gold price snaps two-day uptrend amid sluggish session, easing inside rising wedge bearish chart formation.
- Rebound in yields tease USD buyers ahead of Fed’s preferred inflation gauge.
- Headlines surrounding China, “technical recession” also probe buyers after the biggest daily jump in a week.
Gold price (XAU/USD) fails to extend the two-day uptrend as buyers and sellers jostle around a three-week high during Friday’s Asian session. That said, the precious metal recently eased to $1,754 as the US dollar tracks yield to push back the bearish bias ahead of the key inflation data.
US Dollar Index (DXY) defends 106.00 level while staying near the lowest level since July 05. The greenback gauge dropped during the last two consecutive days amid receding fears of the Fed’s aggression.
On the other hand, a corrective pullback in the US Treasury yields, after refreshing the multi-day low, joins the mixed catalysts surrounding growth to weigh on the XAU/USD prices. That said, the US 10-year Treasury yields seesaw around 2.67%, the lowest levels since early April, whereas the 2-year bond coupons remain pressured at the three-week low, down 0.14% intraday around 2.86% at the latest.
Following Fed Chair Jerome Powell’s teasing of “neutral rates”, gold traders should have traced the Flash readings of the US Q2 GDP, which marked the “technical recession” by declining for the second consecutive time, to cheer the USD dollar weakness and rise further. That said, the first estimations of the US Q2 GDP printed -0.9% Annualized figure versus 0.5% expected and -1.6% prior. Further, the US Initial Jobless Claims also rose more than expected by 253K, with 256K during the week ended on July 22.
Even so, US policymakers, including Fed’s Powell and Treasury Secretary Janet Yellen, tried to shrug off the “technical recession” after the US Q2 GDP dropped for the second consecutive time and teased the concept. The same probes the central bankers pushing for more rate hikes to tame inflation. Furthermore, talks between US President Joe Biden and his Chinese Counterpart Xi Jinping also went mostly okay and exerted downside pressure on the greenback’s safe-haven demand.
Recently, China avoided mentioning its Gross Domestic Product (GDP) target after the Politburo meeting and signaled fears for the XAU/USD traders due to the dragon nation’s status among the world’s top bullion consumers.
Amid these plays, S&P 500 Futures rise half a percent to seesaws near the highest levels since early June.
Looking forward, the Fed’s preferred inflation gauge, namely the Core Personal Consumption Expenditure (PCE) Price Index, expected 0.5% MoM for July versus 0.3% prior, will be important to watch for fresh impulse.
Technical analysis
Gold seesaws around the upper line of a fortnight-long rising wedge bearish chart pattern as buyers take a breather.
In addition to the metal’s failure to cross the immediate resistance line, bearish MACD signals and the overbought RSI also hint at the quote’s pullback towards the last Friday’s high near $1,739.
However, the XAU/USD declines past $1,739 will need validation from the stated wedge’s support line and the 200-HMA, respectively near $1,724 and $1,719, to convince bears.
Alternatively, an upside break of the $1,760 hurdle could quickly propel gold price towards May’s low near $1,786 before highlighting the $1,800 threshold.
Overall, gold buyers are likely to witness less acceptance but the sellers also have a long way before taking control.
Gold: Hourly chart
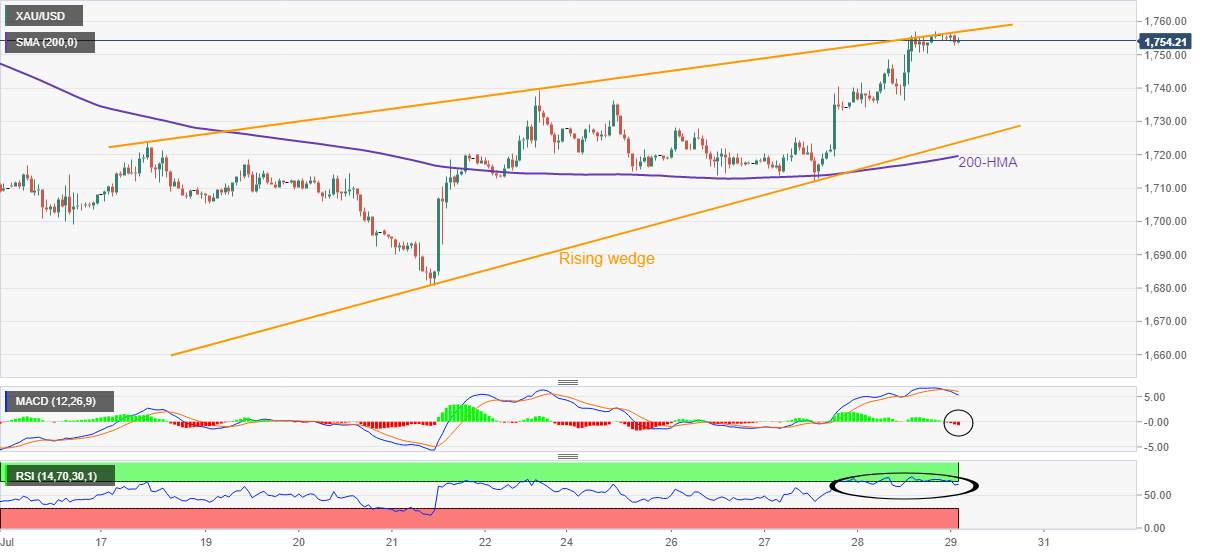
Trend: Pullback expected
| Raw materials | Closed | Change, % |
|---|---|---|
| Silver | 20.021 | 4.83 |
| Gold | 1756.33 | 1.28 |
| Palladium | 2074.2 | 2.46 |
Japanese Ministry of Finance announced on Friday that it has set aside JPY 257 billion in budget reserves to combat rising oil and broader prices.
No further details have been provided on the same.
Meanwhile, the government urged companies to raise wages on par with price hikes of around 2 percent while presenting its Annual Report on the Japanese Economy and Public Finance on Friday.
Market reaction
UJSD/JPY keeps its recovery momentum intact on the above headlines, trading at 134.38, up 0.07% on the day.
-
USD/JPY bounces off six-week low above 134.00 on mixed Japan data, US PCE inflation eyed
- NZD/USD bulls could start to move out at this juncture.
- The bears will be eyeing structure to the downside for the end of the week.
NZD/USD is meeting an area of potential resistance on the daily chart. The price has rallied following the events of the Federal Reserve and has left behind a price imbalance that would be expected to draw in the price in due course.
NZD/USD daily chart
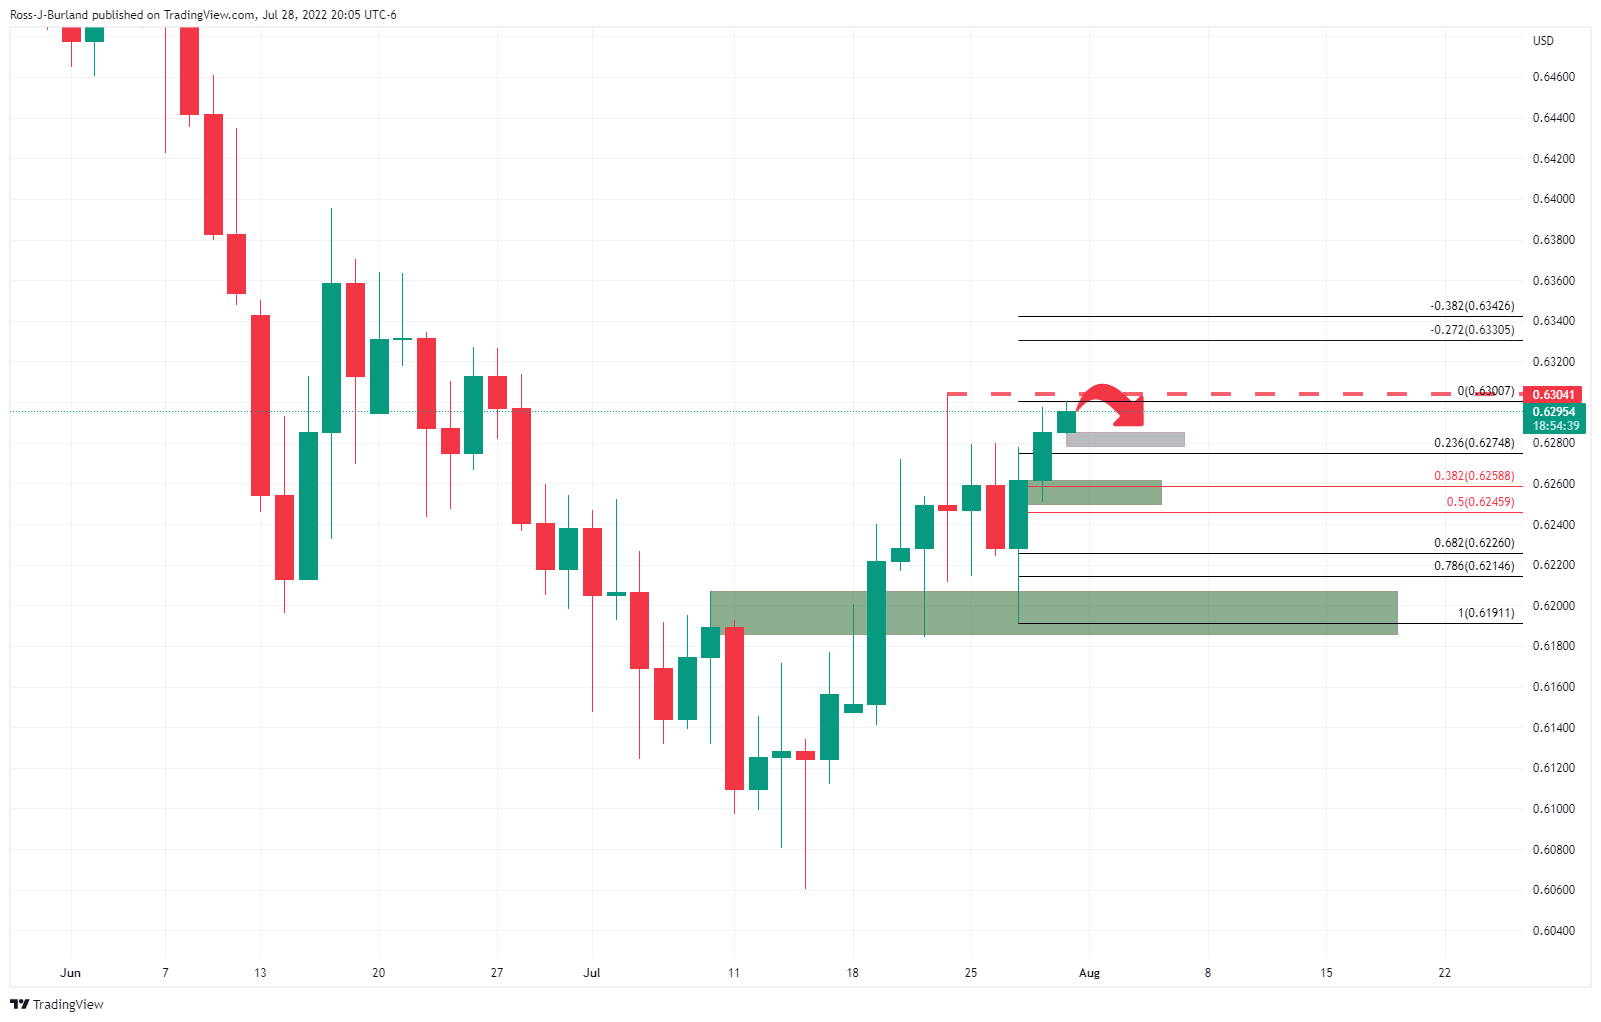
Should the bears make a move, on failures ablve 0.6304, then there are prospects of a significant retracement to the 38.2% Fibonacci and a 50% mean reversion thereafter following the mitigation of the price imbalance, greyed area on the chart above.
China’s Communist Party Politburo issued a statement late Thursday following its quarterly economic meeting, with the key headlines noted below.
All but acknowledged that the country would miss its annual growth target this year.
Signalled that they would stay the course on zero-tolerance covid-prevention measures.
Would take only cautious steps to support the struggling property market.
Would aim to keep the economy running within “a reasonable range” in the second half of the year.
Separately, a Chinese Commerce Ministry official said that the “foundation for consumption recovery is not solid yet,” adding that “more efforts are needed to boost consumption.”
Related reads
- AUD/USD bulls attack 0.7000 despite mixed catalysts ahead of US PCE inflation
- Markets ponder a Fed pivot
- AUD/USD remains firmer around the six-week high, recently grinding higher.
- Australia’s PPI came in mixed, IMF downgrades Aussie GDP forecasts.
- China ignores mentioning GDP target in Politburo communication but fears of recession test buyers.
- US PCE Inflation, updates over “technical recession” and second-tier US data will be important for fresh impulse.
AUD/USD reverses the previous day’s pullback from a 1.5-month top as it picks up bids to 0.7000 during Friday’s Asian session. In doing so, the Aussie pair justifies its risk-barometer status during the sluggish session.
Market sentiment improved recently after China avoided mentioning its Gross Domestic Product (GDP) target after the Politburo meeting. Also favoring the risk appetite and the AUD/USD prices are the recently receding odds favoring the Fed’s aggression.
Talking about the data, Australia’s second quarter (Q2) Producer Price Index (PPI) rose 1.4% on QoQ and 5.6% YoY versus the market forecasts of 0.8% and 3.8% in that order. Further, Australia’s Private Sector Credit improved to 0.9% MoM in June versus the 0.8% previous reading. It should be noted that the International Monetary Fund (IMF) revised Australia’s GDP forecasts and tried to tame the AUD/USD rebound but failed amid the recent cautious optimism.
Following Fed Chair Jerome Powell’s teasing of “neutral rates”, AUD/USD traders should have traced the Flash readings of the US Q2 GDP, which marked the “technical recession” by declining for the second consecutive time, to decline further. That said, the first estimations of the US Q2 GDP printed -0.9% Annualized figure versus 0.5% expected and -1.6% prior. Further, the US Initial Jobless Claims also rose more than expected by 253K, with 256K during the week ended on July 22.
Elsewhere, US policymakers, including Fed’s Powell and Treasury Secretary Janet Yellen, tried to shrug off the “technical recession” after the US Q2 GDP dropped for the second consecutive time and teased the concept. The same probes the central bankers pushing for more rate hikes to tame inflation. Furthermore, talks between US President Joe Biden and his Chinese Counterpart Xi Jinping also went mostly okay and exerted downside pressure on the greenback’s safe-haven demand.
Against this backdrop, S&P 500 Futures rise half a percent to seesaws near the highest levels since early June while the US 10-year Treasury yields seesaw around 2.67%, the lowest levels since early April.
Moving on, the initial readings of German and Eurozone GDP for the second quarter (Q2) of 2022 will be important ahead of the Fed’s preferred inflation gauge, namely the Core Personal Consumption Expenditure (PCE) Price Index, for July.
Technical analysis
Unless declining back below the 50-DMA support around 0.6970, AUD/USD prices are likely to approach the mid-June swing high surrounding 0.7070.
- USD/JPY pares the biggest daily fall in eight months.
- BOJ Summary of Opinions hint at economic risk, Japan Unemployment increased but Retail Sales eased.
- Pause in the US Treasury yields’ south-run, sluggish session favor corrective pullback.
- US policymakers try to ward off “technical recession” ahead of Fed’s preferred inflation gauge.
USD/JPY licks its wounds near 134.50 as it seesaws near the 1.5-month low during Friday’s Asian session. In doing so, the yen pair consolidates the heaviest daily fall since late November 2021.
A corrective pullback in the US Treasury yields, after refreshing the multi-day low, joins the mixed catalysts from Japan to trigger the USD/JPY pair’s rebound of late.
That said, the US 10-year Treasury yields seesaw around 2.67%, the lowest levels since early April, whereas the 2-year bond coupons remain pressured at the three-week low, down 0.14% intraday around 2.86% at the latest.
Elsewhere, Bank of Japan’s (BOJ) Summary of Opinions repeated regular defense for the easy money but cited economic risks and weighed on the Japanese yen (JPY). On the same line could be the mixed data from the Asian major.
Japan’s Tokyo Consumer Price Index (CPI) rose to 2.5% in July while Industrial Production for June also impressed optimists with 8.9% MoM growth. However, downbeat prints of Retail Sales and the Unemployment Rate for June seem to have weighed on the JPY.
Talking about the sentiment, S&P 500 Futures rise half a percent to seesaws near the highest levels since early June, which in turn favor USD/JPY buyers.
It should be observed that the US policymaker’s struggle to ward off the recession fears joins a cautious mood ahead of the US Core Personal Consumption Expenditure (PCE) Price Index for July to test the optimists. Also keeping traders on the edge are the US inflation expectations data, as per the 10-year breakeven inflation rate per the St. Louis Federal Reserve (FRED). The US inflation expectations refreshed the monthly high to 2.48% and renewed fears of higher Fed rates late Thursday.
Technical analysis
Although late June’s low around 134.20 restricts the immediate downside of the USD/JPY prices, recovery remains elusive until the quote stays below the previous support line from March, around 135.75 by the press time.
- USD/CAD remains sidelined near multi-day low amid sluggish markets.
- Indecision over US recession, cautious mood ahead of the key data probe momentum traders.
- WTI remains pressured after reversing from one-week high, DXY struggles for clear directions.
- US data, risk catalysts will be important for fresh impulse.
USD/CAD picks up bids to 1.2810 as it licks the wounds near a six-week low during Friday’s Asian session. In doing so, the Loonie pair takes clues from the softer oil prices, as well as the US dollar’s pause from further downside, amid a sluggish session.
WTI crude oil extends the previous day’s pullback from a one-week high towards $96.00, down 0.26% intraday near $96.30 by the press time. The black gold’s latest weakness could be linked to the update from the Organization of the Petroleum Exporting Countries (OPEC) and allies, collectively known as OPEC+. On Thursday, Reuters cited eight sources familiar with the matter to hint at no major change in the OPEC+ output.
US Dollar Index (DXY) defends 106.00 level while staying near the lowest level since July 05. The greenback gauge dropped during the last two consecutive days amid receding fears of the Fed’s aggression.
Following Fed Chair Jerome Powell’s teasing of “neutral rates”, USD/CAD traders should have traced the Flash readings of the US Q2 GDP, which marked the “technical recession” by declining for the second consecutive time, to decline further. That said, the first estimations of the US Q2 GDP printed -0.9% Annualized figure versus 0.5% expected and -1.6% prior. Further, the US Initial Jobless Claims also rose more than expected by 253K, with 256K during the week ended on July 22.
Elsewhere, US policymakers, including Fed’s Powell and Treasury Secretary Janet Yellen, tried to shrug off the “technical recession” after the US Q2 GDP dropped for the second consecutive time and teased the concept. The same probes the central bankers pushing for more rate hikes to tame inflation. Furthermore, talks between US President Joe Biden and his Chinese Counterpart Xi Jinping also went mostly okay and exerted downside pressure on the greenback’s safe-haven demand.
Amid these plays, S&P 500 Futures rise half a percent to seesaws near the highest levels since early June while the US 10-year Treasury yields flirt with the lowest levels in three months.
Moving on, the Fed’s preferred inflation gauge, namely the Core Personal Consumption Expenditure (PCE) Price Index, expected 0.5% MoM for July versus 0.3% prior, will be important for the USD/CAD traders. Also crucial will be the headlines surrounding oil prices and economic slowdown.
Technical analysis
The USD/CAD pair’s first daily closing below the 100-day EMA since early June joins the downbeat RSI (14), not oversold, as well as bearish MACD signals, to hint at the quote’s further declines. However, a clear downside break of the descending support line from June 14, at 1.2790 by the press time, appears necessary for the bears.
In recent trade today, the People’s Bank of China (PBOC) set the yuan (CNY) at 6.7437 vs. the estimate of 6.7414 vs. the last close of 6.7466.
About the fix
China maintains strict control of the yuan’s rate on the mainland.
The onshore yuan (CNY) differs from the offshore one (CNH) in trading restrictions, this last one is not as tightly controlled.
Each morning, the People’s Bank of China (PBOC) sets a so-called daily midpoint fix, based on the yuan’s previous day's closing level and quotations taken from the inter-bank dealer.
- AUD/NZD has overstepped 1.1120 after a break of morning consolidation.
- A third consecutive 50 bps rate hike is expected from the RBA next week.
- Kiwi bulls have failed to capitalize on higher ANZ- Roy Morgan Consumer Confidence data.
The AUD/NZD pair has turned sideways after a reversal move around the critical support of 1.1100 on Thursday. The cross has given an upside break of the consolidation move formed in a narrow range of 1.1105-1.1119 in the Asian session. The asset is likely to record more gains as investors are expecting a consecutive 50 basis points (bps) interest rate hike by the Reserve Bank of Australia (RBA).
Next week, the RBA will conduct the monthly monetary policy to discuss the Official Cash Rate (OCR). According to a Reuters poll, RBA Governor Philip Lowe will elevate its OCR by 50 bps for the third time consecutively. This will push the OCR to 1.85%. Taking into account the soaring price pressures in the Australian economy, policy tightening measures are needful. The Australian Consumer Price Index (CPI) for the second quarter of CY2022 has climbed to 6.1%.
The inflation rate remained 10 bps lower than the consensus but higher than the prior release of 5.1%. Adding from the Reuters poll, a majority, 19 of 31 economists who had a long-term view on rates, now expect the cash rate to reach 2.35% or higher by end-September. This accelerates the odds of a fourth consecutive 50 bps rate hike as guidance.
On the New Zealand front, kiwi bulls have failed to capitalize on higher ANZ- Roy Morgan Consumer Confidence data. The qualitative data has landed at 81.9, higher than the prior release of 80.5. Next week, the kiwi economy will report the labor market data, which carries significant importance.
- GBP/USD bulls takeing a breather and price is stalling.
- Some price discovery could be taking place and mitigation of the imbalance to the downside could be in order.
As per the prior analysis, GBP/USD Price Analysis: Bulls set medium-term target on the 1.22 area, the bulls have stayed in control and are on the hunt for the 1.22 area.
GBP/USD prior analysis
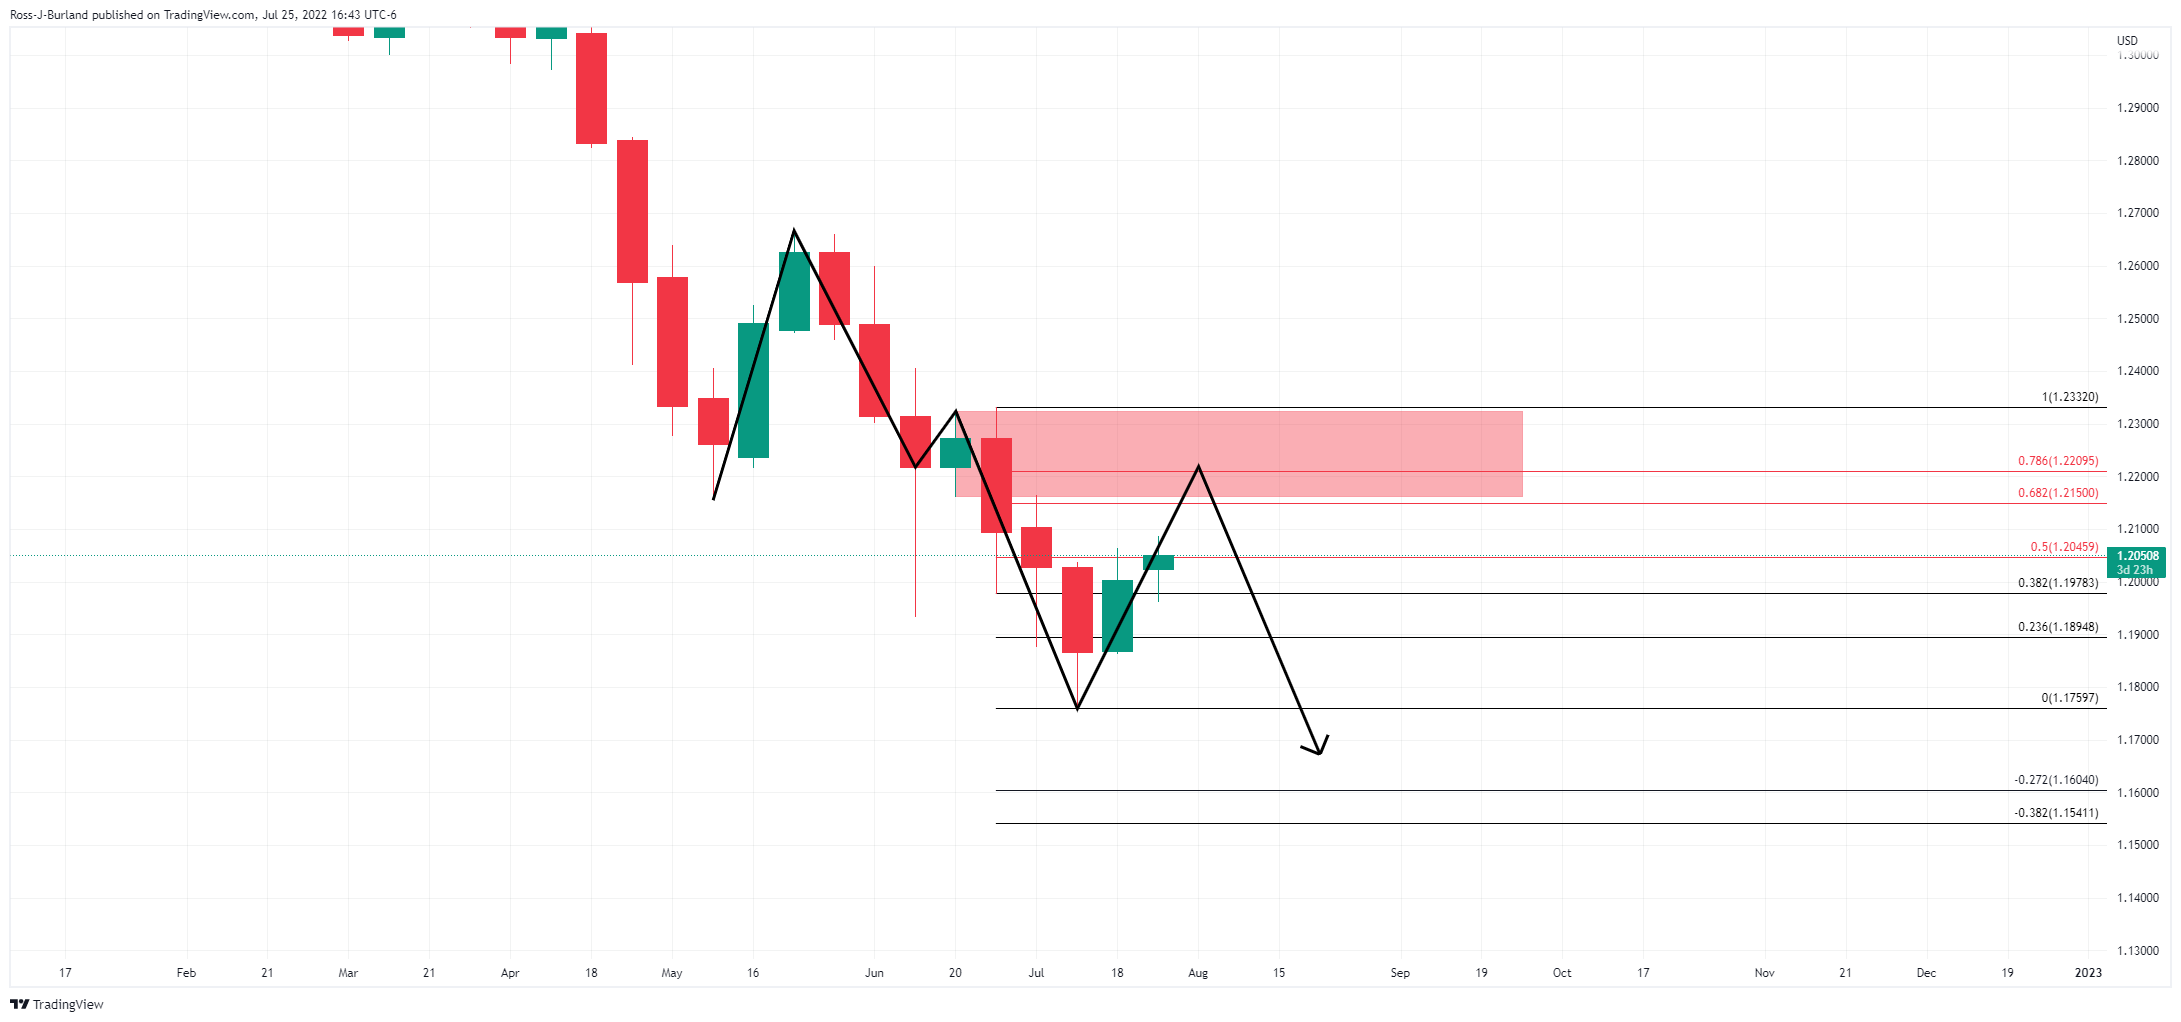
The M-formation on the weekly chart is a reversion pattern and the neckline aligned with the key Fibonacci's we expected to draw in the price.
GBP/USD live market, weekly chart
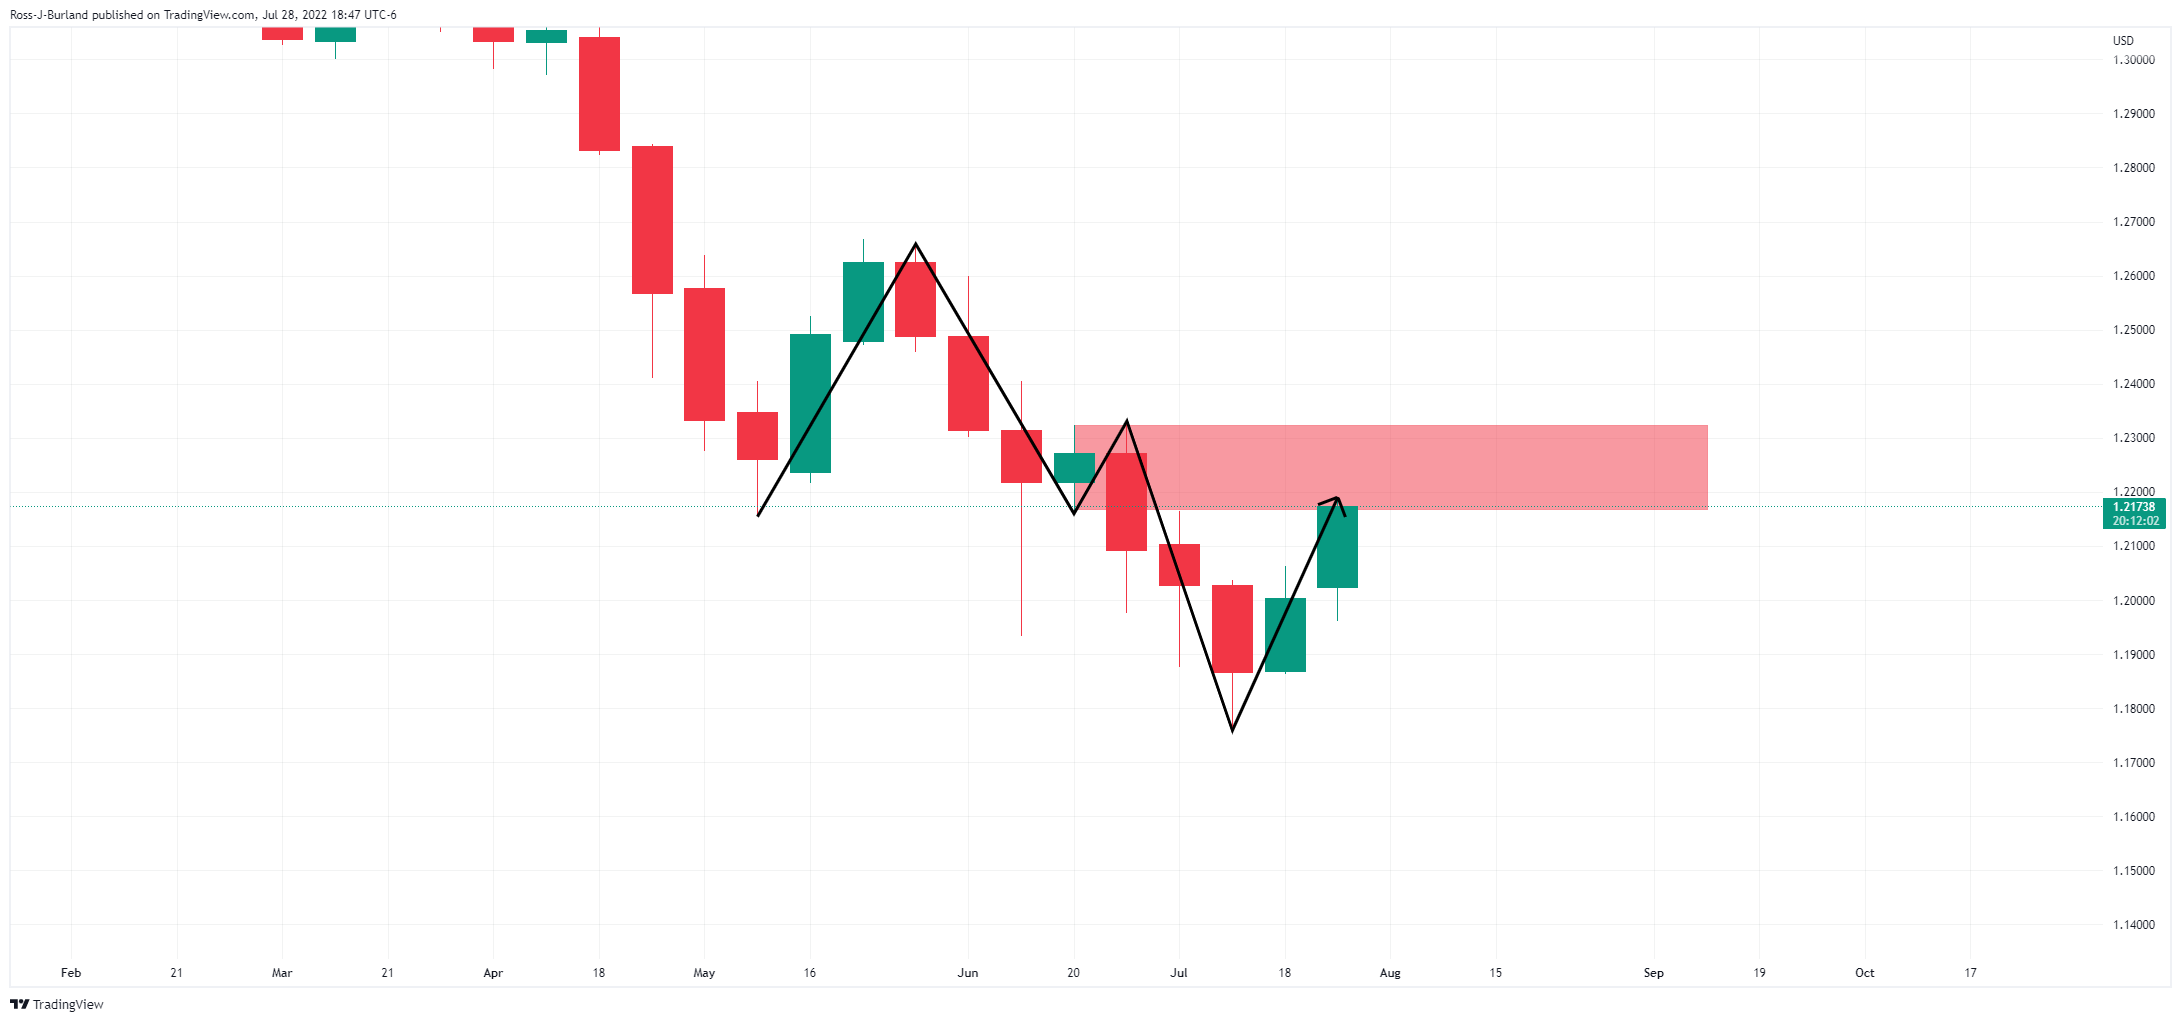
As illustrated, the price has continued higher towards the 1.22 area. From a lower time frame perspective, the price is stalling.
GBP/USD H1 chart
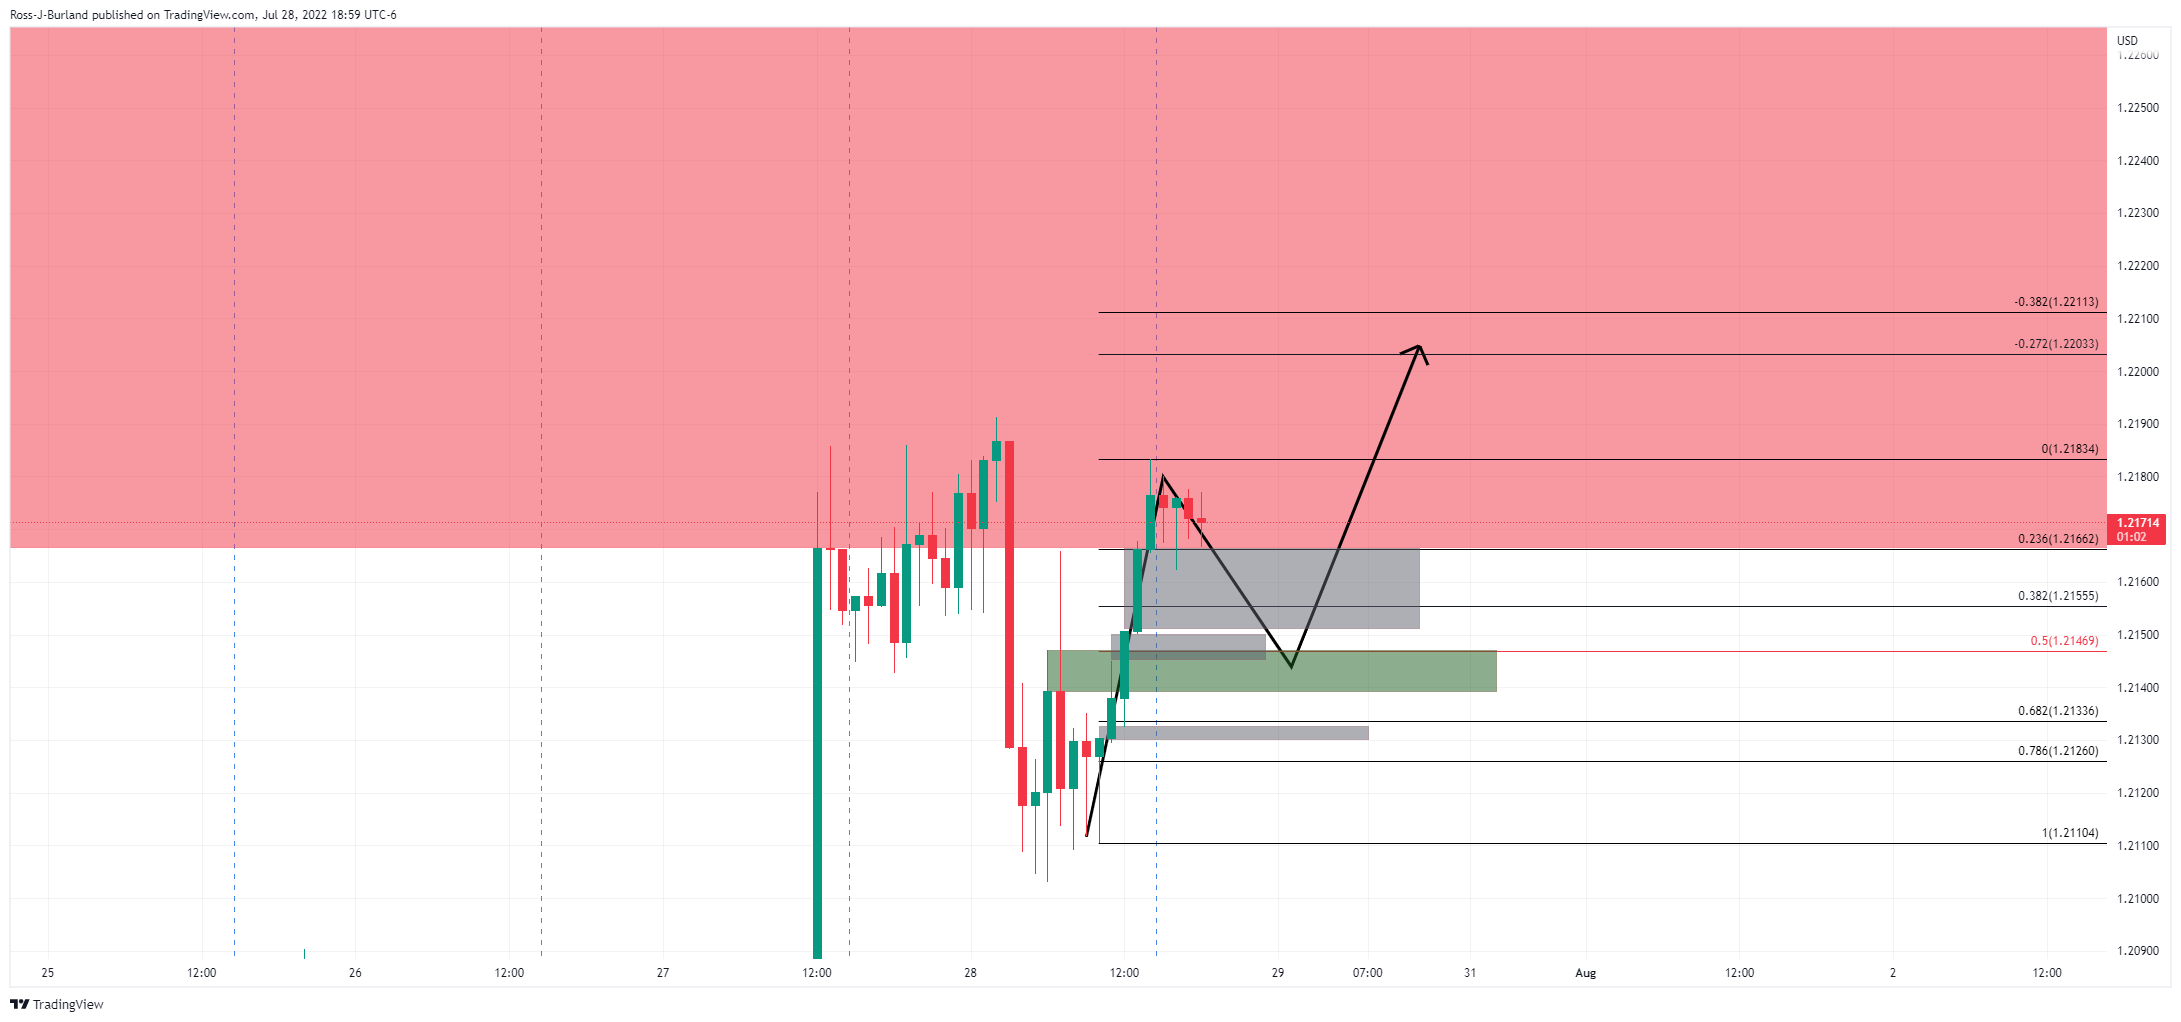
There could be a correction on the cards which would be expected to mitigate the greyed areas of imbalance in price. If the bulls step in, then this could offer support around a 50% mean reversion area.
- Market sentiment remains cautiously optimistic amid light macro, pre-data anxiety.
- S&P 500 Futures stay firmer around seven-week high, yields seesaw near the lowest levels since April.
- “Technical recession” followed Fed’s disappointment to improve risk appetite.
- Inflation expectations hint at further increases in prices teasing Fed hawks.
The risk profile remains mildly positive during early Friday as bulls take a breather after witnessing heavy volatility in the last two days. A lack of major data/events during the Asian session, as well as the anxiety ahead of the Fed’s preferred inflation gauge, seem to restrict the recent performance of markets.
While portraying the mood, the S&P 500 Futures rise half a percent as it seesaws near the highest levels since early June, at 4,095 by the press time. That said, the US 10-year Treasury yields seesaw around 2.67%, the lowest levels since early April, whereas the 2-year bond coupons remain pressured at the three-week low, down 0.14% intraday around 2.86% at the latest.
It’s worth noting that the US policymaker’s struggle to ward off the recession fears joins a cautious mood ahead of the US Core Personal Consumption Expenditure (PCE) Price Index for July to test the optimists. Also keeping traders on the edge are the US inflation expectations data, as per the 10-year breakeven inflation rate per the St. Louis Federal Reserve (FRED). The US inflation expectations refreshed the monthly high to 2.48% and renewed fears of higher Fed rates late Thursday.
Previously, the Flash readings of the US Q2 GDP marked the “technical recession” by declining for the second consecutive time. The same offered additional reason to the Fed hawks to retreat, other than Fed Chairman Jerome Powell’s signal of neutral rates. It should be noted that the first estimations of the US Q2 GDP printed -0.9% Annualized figure versus 0.5% expected and -1.6% prior. Further, the US Initial Jobless Claims also rose more than expected by 253K, with 256K during the week ended on July 22.
On a different page, talks between US President Joe Biden and his Chinese Counterpart Xi Jinping also went mostly okay but the energy crisis in the Eurozone kept flashing economic slowdown woes in the old continent and challenge the sentiment.
Amid these plays, the US Dollar Index (DXY) dropped to the lowest level in six weeks while prices of gold and crude oil remained firmer. Additionally, the Wall Street benchmarks managed to post another day in the green.
Looking forward, investors should pay attention to the risk catalysts ahead of the initial readings of German and Eurozone GDP for the second quarter (Q2) of 2022, as well as the Eurozone Flash Consumer Price Index (CPI) for July, for fresh impulse. Following that, the US Core PCE Price Index for July, expected 0.5% MoM versus 0.3% prior, will be important to track.
- EUR/GBP is juggling in a 14-pips range ahead of Eurozone GDP.
- The Eurozone GDP could trim drastically to 3.4% vs. 5.4% o an annual basis.
- BOE Andrew Bailey may accelerate interest rates further to contain soaring price pressures.
The EUR/GBP pair is displaying back and forth moves in a narrow range of 0.8366-0.8380 in the early Tokyo session. The asset displayed a responsive buying action on Thursday after printing a fresh three-month low at 0.8346. Usually, a responsive buying action indicates that the market participants considered the asset a value bet and poured significant longs. The cross is displaying exhaustion signals on the downside and is likely to rebound to near the round-level resistance of 0.8400 ahead.
In today’s session, investors will keep an eye on Eurozone Gross Domestic Product (GDP) data. As per the market consensus, the economic data may tumble to 3.4% vs. 5.4% on an annual basis. While the quarterly GDP would trim to 0.2% from the prior release of 0.6%. An occurrence of the same may evaporate the recovery sign from the shared currency bulls.
Meanwhile, accelerating expectations of an energy crisis in eurozone are hurting the sentiment of the households. The demand for natural gas is likely to escalate as the Winter season is coming, which is known for higher demand for energy. The eurozone administration is looking for potential candidates, who can cater to their juggernaut energy demand but things will take time.
On the UK front, investors‘ focus will shift to the interest rate decision by the Bank of England (BOE). BOE Governor Andrew Bailey is likely to elevate its interest rates further as the inflation rate has climbed to 9.4% and has not shown any sign of hitting a peak yet. The ongoing upside momentum in the price pressures in the UK could escalate to a two-digit figure swiftly.
| Index | Change, points | Closed | Change, % |
|---|---|---|---|
| NIKKEI 225 | 99.73 | 27815.48 | 0.36 |
| Hang Seng | -47.36 | 20622.68 | -0.23 |
| KOSPI | 19.74 | 2435.27 | 0.82 |
| ASX 200 | 66.5 | 6889.7 | 0.97 |
| FTSE 100 | -2.95 | 7345.25 | -0.04 |
| DAX | 115.73 | 13282.11 | 0.88 |
| CAC 40 | 81.27 | 6339.21 | 1.3 |
| Dow Jones | 332.04 | 32529.63 | 1.03 |
| S&P 500 | 48.82 | 4072.43 | 1.21 |
| NASDAQ Composite | 130.17 | 12162.59 | 1.08 |
- EUR/USD remains sidelined after bouncing off 1.0114, 1.0200 guards immediate upside.
- Three-week-old horizontal hurdle precedes 1.0310 resistance confluence to test bulls.
- Pullback remains elusive beyond 1.0085, bears could wait for parity for further conviction.
EUR/USD retreats from 1.0200 while easing to 1.0190 during Friday’s mid-Asian session. In doing so, the major currency pair remains inside a weekly descending trend channel.
However, the downbeat MACD and RSI (14) signal the quote’s further weakness.
That said, the stated channel’s support line near 1.0085 could restrict short-term EUR/USD weakness before directing the bears towards the parity level of 1.0000.
In a case where the pair remains bearish past 1.000, the recent low near 0.9950 and December 2002 low near 0.9860 will gain the seller’s attention.
Alternatively, the stated channel’s upper line near 1.0225 guards the EUR/USD recovery ahead of a three-week-old horizontal resistance area near 1.0275-80.
Following that, the 200-SMA and a downward sloping trend line from June 09, around 1.0310, will be a tough nut to crack for the pair buyers.
It’s worth noting that the EUR/USD prices rally beyond 1.0310 needs validation from a six-week-old resistance zone near 1.0365-70, a break of which could give control to the bulls.
EUR/USD: Four-hour chart
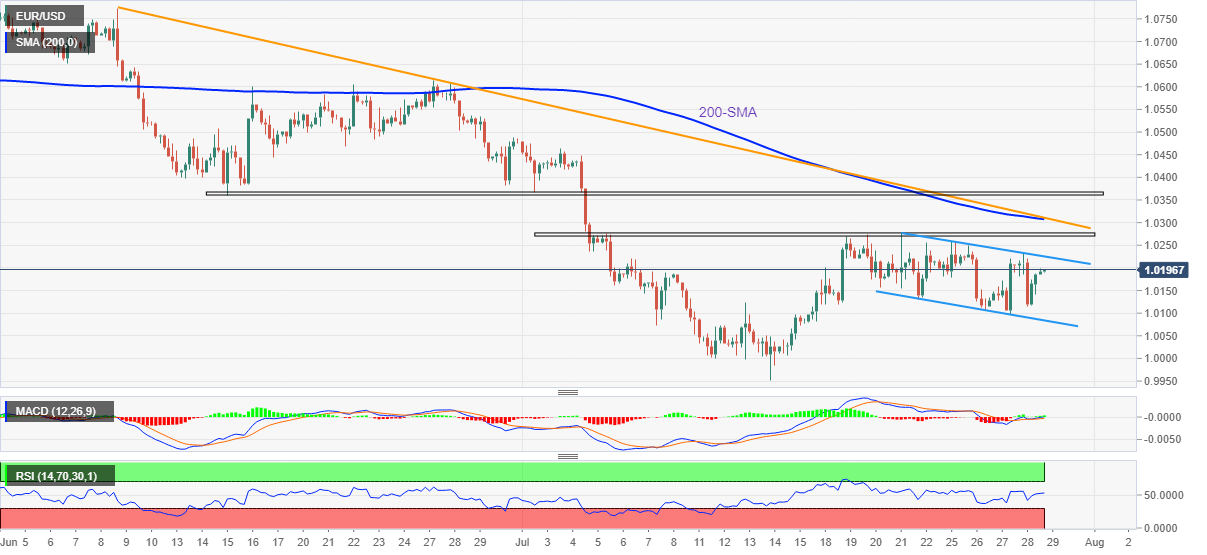
Trend: Pullback expected
Australia's central bank will deliver its third consecutive half-point interest rate hike on Tuesday and another in September, playing catch-up with peers in a campaign to contain surging inflation, a Reuters poll of economists found.
Key findings
One of the last major central banks to join a global monetary policy-tightening cycle, the RBA was forecast to raise the cash rate by 50 basis points to 1.85% at its Aug. 2 meeting, according to 32 of 34 economists surveyed July 22-28.
All four major local banks - ANZ, Westpac, CBA and NAB - were expecting a 50-basis-point hike on Tuesday.
The RBA is then expected to deliver a fourth consecutive 50 basis point hike at the September meeting.
A majority, 19 of 31 economists who had a long-term view on rates, now expect the cash rate to reach 2.35% or higher by end-September, not year-end as forecast in the previous poll.
More than half of respondents - 14 of 25 - who had forecasts until the end of next year saw rates hitting 3.00% or higher. Money market traders are betting on rates going above that by the end of this year.
Also read: AUD/USD Price Analysis: Bulls home in on the 0.7000s
| Pare | Closed | Change, % |
|---|---|---|
| AUDUSD | 0.69906 | -0.05 |
| EURJPY | 136.891 | -1.71 |
| EURUSD | 1.01942 | -0.05 |
| GBPJPY | 163.485 | -1.5 |
| GBPUSD | 1.21727 | 0.14 |
| NZDUSD | 0.62909 | 0.44 |
| USDCAD | 1.28073 | -0.12 |
| USDCHF | 0.95465 | -0.49 |
| USDJPY | 134.309 | -1.64 |
Bank of Japan's July meeting Summary of Opinions has been released.
Key notes
Prolonged chip shortage and monetary tightening by some central banks are weighing on the global economy.
Must be mindful of the risk that monetary tightening by the US, and European central banks could lead to u.s. recession, negative market shock and affect Japan's economy.
Hard to foresee inflation stably hitting BoJ's target when looking at the output gap, and inflation expectations.
Various goods and services prices are likely to gradually rise as commodity costs are expected to stay high for time being.
There is a chance companies' price-setting mindset is changing as various firms are hiking prices.
BoJ must take additional easing steps without hesitation if needed, and maintain forward guidance on interest rates.
Appropriate to decide at sept policy meeting fate of the pandemic-relief programme, given the rapid renewed spike in covid infection cases.
BoJ must look not just at underlying inflation figures, but at inflation expectations and outlook for prices in guiding policy.
Must accurately gauge wage developments in guiding policy.
Japan's financial system stable as a whole but must be vigilant to risk that at some point, side-effects of monetary easing could materialise.
USD/JPY update
Meanwhile, USD/JPY is higher on the day by some 0.26% due to a beaten-down US dollar and lower Us yields following the prior day's Federal Reserve meeting and dovish tilt.
- Gold price is likely to establish above $1,760.00 as DXY sees more downside.
- The optimism in gold price is back by declining Fed’s confidence in US economic data.
- A preliminary estimate for the US PCE is 6.7% vs. 6.3% recorded earlier.
Gold price (XAU/USD) is likely to hit the immediate hurdle of $1,760.00, tracking the current upside momentum. The precious metal extended its gains swiftly on Thursday after violating the critical barricade of $1,740.00. The release of the downbeat US Gross Domestic Product (GDP) underpinned the gold prices and the asset is expected to establish above the immediate hurdle of $1,760.00 sooner.
The Federal Reserve (Fed) has been elevating its interest rates as solid US fundamentals were providing room to Fed policymakers. Fed’s tedious job of declining demand simultaneously with increasing interest rates and increasing supply to derive optimal prices without triggering the chances of a recession was supported by the upbeat US economic data. Now, less confidence in economic data has brought a sense of optimism in the gold price.
In today’s session, the entire focus will remain on US Personal Consumption Expenditure (PCE) inflation data, which is seen higher at 6.7% vs. 6.3% reported earlier. This will keep the need for more policy tightening measures intact.
Gold technical analysis
On a four-hour scale, the gold price has attacked the 38.2% Fibonacci retracement (which is placed from June 12 high at $1,879.26 to July 21 low at $1,680.91) at $1,756.64. Also, the precious metal is attempting to establish above the downward-sloping trendline placed from June 12 high at $1,879.26.
A bull cross, represented by the 20- and 50-period Exponential Moving Averages (EMAs) at $1,720.80 adds to the upside filters.
Also, the Relative Strength Index (RSI) (14) has shifted into the bullish range of 60.00-80.00, which indicates a continuation of an upside momentum ahead.
Gold four-hour chart
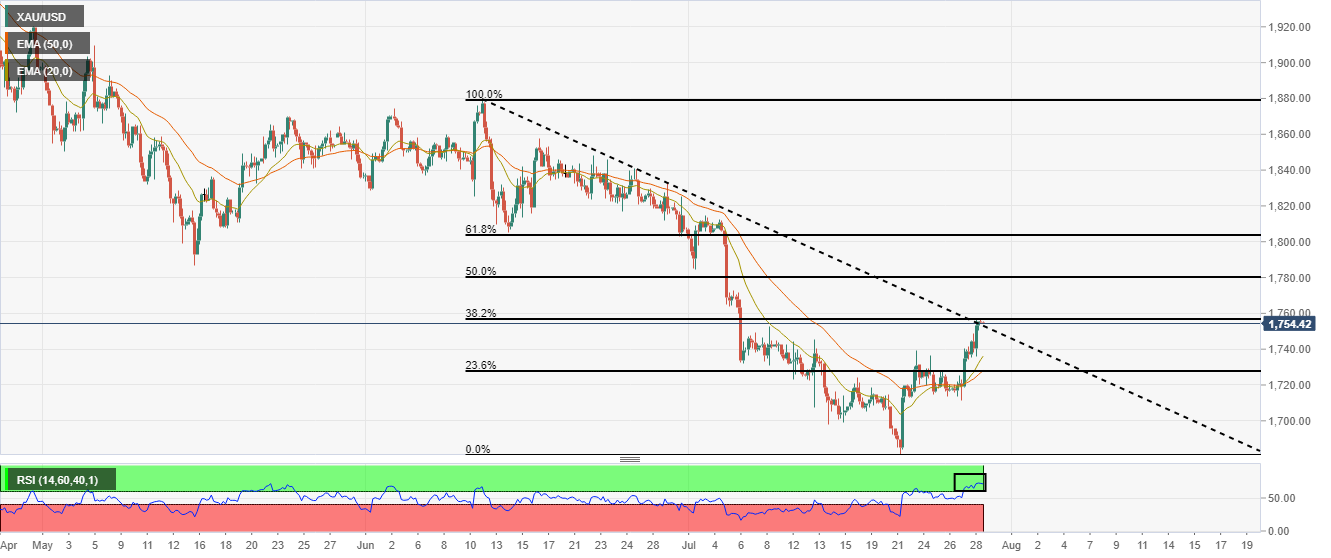


© 2000-2026. All rights reserved.
This site is managed by Teletrade D.J. LLC 2351 LLC 2022 (Euro House, Richmond Hill Road, Kingstown, VC0100, St. Vincent and the Grenadines).
The information on this website is for informational purposes only and does not constitute any investment advice.
The company does not serve or provide services to customers who are residents of the US, Canada, Iran, The Democratic People's Republic of Korea, Yemen and FATF blacklisted countries.
Making transactions on financial markets with marginal financial instruments opens up wide possibilities and allows investors who are willing to take risks to earn high profits, carrying a potentially high risk of losses at the same time. Therefore you should responsibly approach the issue of choosing the appropriate investment strategy, taking the available resources into account, before starting trading.
Use of the information: full or partial use of materials from this website must always be referenced to TeleTrade as the source of information. Use of the materials on the Internet must be accompanied by a hyperlink to teletrade.org. Automatic import of materials and information from this website is prohibited.
Please contact our PR department if you have any questions or need assistance at pr@teletrade.global.
transfers