- Analytics
- News and Tools
- Market News
CFD Markets News and Forecasts — 26-07-2022
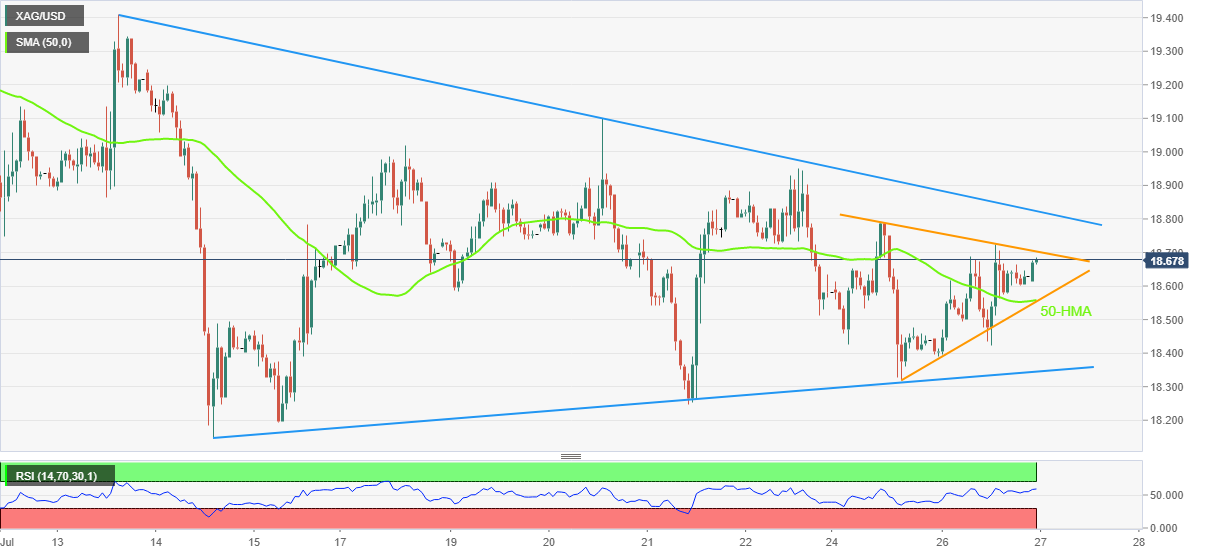
- Silver remains firmer inside a three-day-old symmetrical triangle.
- Firmer RSI, sustained trading above 50-HMA favor buyers.
- A two-week-old triangle formation adds to the trading filters.
Silver (XAG/USD) picks up bids to extend the previous day’s run-up towards the $19.00 during Wednesday’s Asian session, around $18.67 by the press time.
In doing so, the bright metal justifies the upside break of the 50-HMA amid firmer RSI (14), not overbought, inside an immediate triangle formation established since Monday.
That said, the quote’s further upside aim for the stated triangle’s resistance line, at $18.70 at the latest.
Should the XAG/USD cross the $18.70 hurdle, a two-week-old descending trend line near $18.85, will challenge the metal buyers before giving them control. It’s worth noting that the $19.00 may act as an extra challenge for the bulls.
On the contrary, the 50-HMA adds strength to the nearby triangle’s support at $18.55 and restricts the quote’s short-term downside.
Also acting as the key challenge for the XAG/USD bears is an upward sloping trend line from July 13, at $18.34 by the press time.
To sum up, silver consolidates recent losses inside a short-term triangle. However, the metal’s further upside appears limited unless crossing the $18.85 hurdle.
Silver: Hourly chart
Trend: Further upside expected
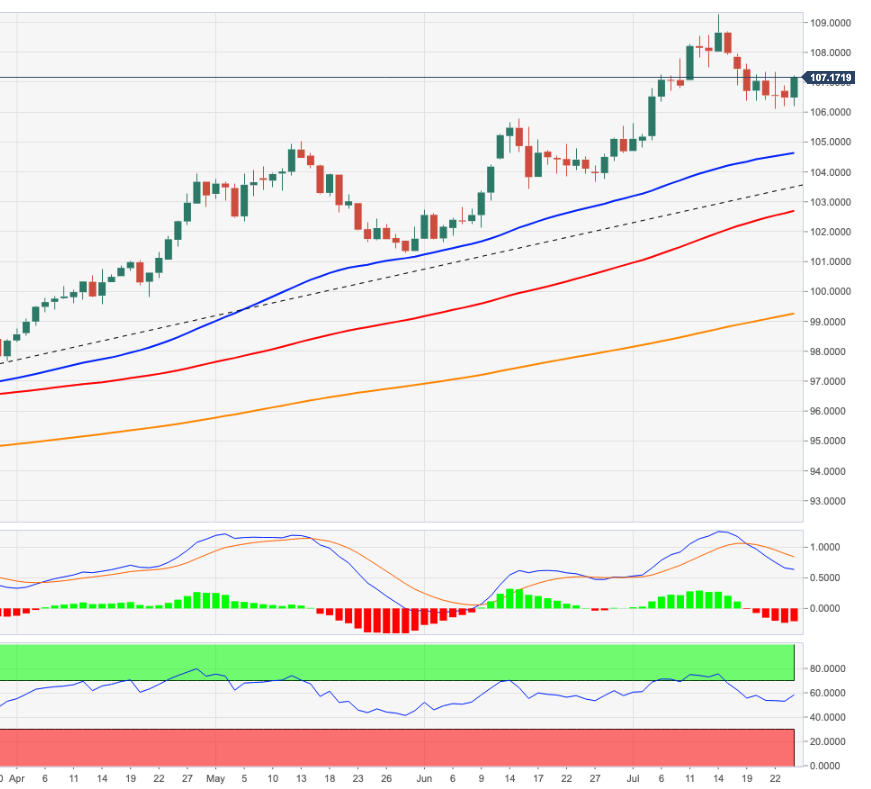
- US Dollar Index grinds higher after rising the most in 12-days the previous day.
- Risk-aversion wave joins hawkish expectations from the Fed to underpin USD dollar demand.
- Equities, yield curve also contribute to the DXY’s strength amid mixed data, Eurozone recession fears.
- US Durable Goods Orders also become important to watch, Fed is the key.
US Dollar Index (DXY) seesaws around 107.25 during Wednesday’s Asian session, after posting the biggest daily jump in a fortnight the previous day. The greenback’s run-up could be linked to the escalated risk-off mood, as well as cautious sentiment ahead of the Federal Open Market Committee (FOMC) meeting. It’s worth noting that the recently mixed US data also contributes to the DXY strength of late.
Fears of recession intensified after the International Monetary Fund (IMF) cut its global growth forecast (once again) this year, to 2.9% from 3.6% forecast in April. The Washington-based organization also raised concerns over more economic hardships amid a full cut-off of Russian gas to Europe and a 30% drop in Russian oil exports, both of which are looming.
It should be noted that the disappointing results from the global retailer Walmart also contributed to the recession fears. Furthermore, the widening difference between the 2-year and the 10-year bond coupons, recently to the most since the year 2000, also portrayed the traders’ rush to the risk-aversion.
Talking about the data, the US CB Consumer Confidence fell for a third consecutive month in July, to 95.7 from 98.4 prior. Further, the US New Home Sales dropped to 0.59M for June versus 0.66M expected and 0.642M previous readout. On the same line, Richmond Fed Manufacturing Index rose to the highest level since April, to 0 from -13 expected and -9 prior (revised up from -11).
Amid these plays, Wall Street closed in the red but the S&P 500 Futures prints mild gains amid the pre-Fed consolidation, not to forget recent hopes of Sino-American peace as US President Joe Biden prepares to talk to China amid deteriorating relations.
That said, the US Dollar Index is likely to witness the pre-Fed inaction while the US Durable Goods Orders for June, -a 0.4% forecast compared to 0.8% prior, could try to entertain traders. It’s worth observing that the US central bank is expected to announce 75 basis points (bps) of a rate hike but some of the traders also highlight the case for the 100 bps move, making the event more interesting amid recession fears.
Also read: Fed Preview: Powell to reignite dollar rally with promise to crush inflation, whatever the cost
Technical analysis
A two-month-old ascending trend line defends DXY bulls unless the quote drops below 106.30. The recovery moves, however, need validation from 107.50. Given the quote's successful trading beyond the short-term key support line, as well as firmer RSI and bullish MACD, the US Dollar is expected to stretch the latest run-up.
- USD/CAD bulls take control into the mid point of the broadening formation on the 4-hour time frame.
- The markets will be looking to the Fed for direction at this juncture.
USD/CAD is flat for the session so far in Asia ahead of the Tokyo open. The price has been moving higher over the course of the past few session mitigating some of the imbalance in price left behind from the prior sell-of. However, the focus is now on the Federal Reserve interest rate decision today.
The two-day Federal Open Market Committee started on Tuesday with the central bank widely expected to hike rates 75 bp to 2.50%. WIRP suggests only around 15% odds of a 100 bp move. ''With the recent weakness in the data, there is simply no need to go bigger this week,'' analysts at Brown Brothers Harriman argued.
''Updated macro forecasts and Dot Plots won’t come until the September meeting. Another 75 bp hike on September 21 is about 50% priced in. A 25 bp hike is fully priced in for November 2 but after that, one last 25 bp hike is only partially priced in. The swaps market paints a similar picture, with 175 of tightening priced in over the next 6 months that would see the policy rate peak near 3.5%. After that, an easing cycle is priced in for the subsequent 6 months.''
Fed Chair Jerome Powell may well also retain optionality by leaving the door open to additional 75bp rate increases and investors will be keeping a close eye on the Fed's forward guidance.
''Yes, the US economic data have been weakening but we do not think a recession is imminent,'' the analysts at BBH said. ''When all is said and done, we believe the US economy remains the most resilient. However, we expect a period of consolidation ahead for the dollar until the US economic outlook becomes clearer.'' Additionally, there is a high bar to compel directional USD moves with at least 75bps priced in already. ''The potential for more hikes is likely to keep an upward bias on front end rates and the curve flatter,'' analysts at TD Securities argued.
USD/CAD technical analysis
In the prior analysis, USD/CAD Price Analysis: Bears are moving in with eyes on a test of 1.2800, the broadening formation was identified as follows:
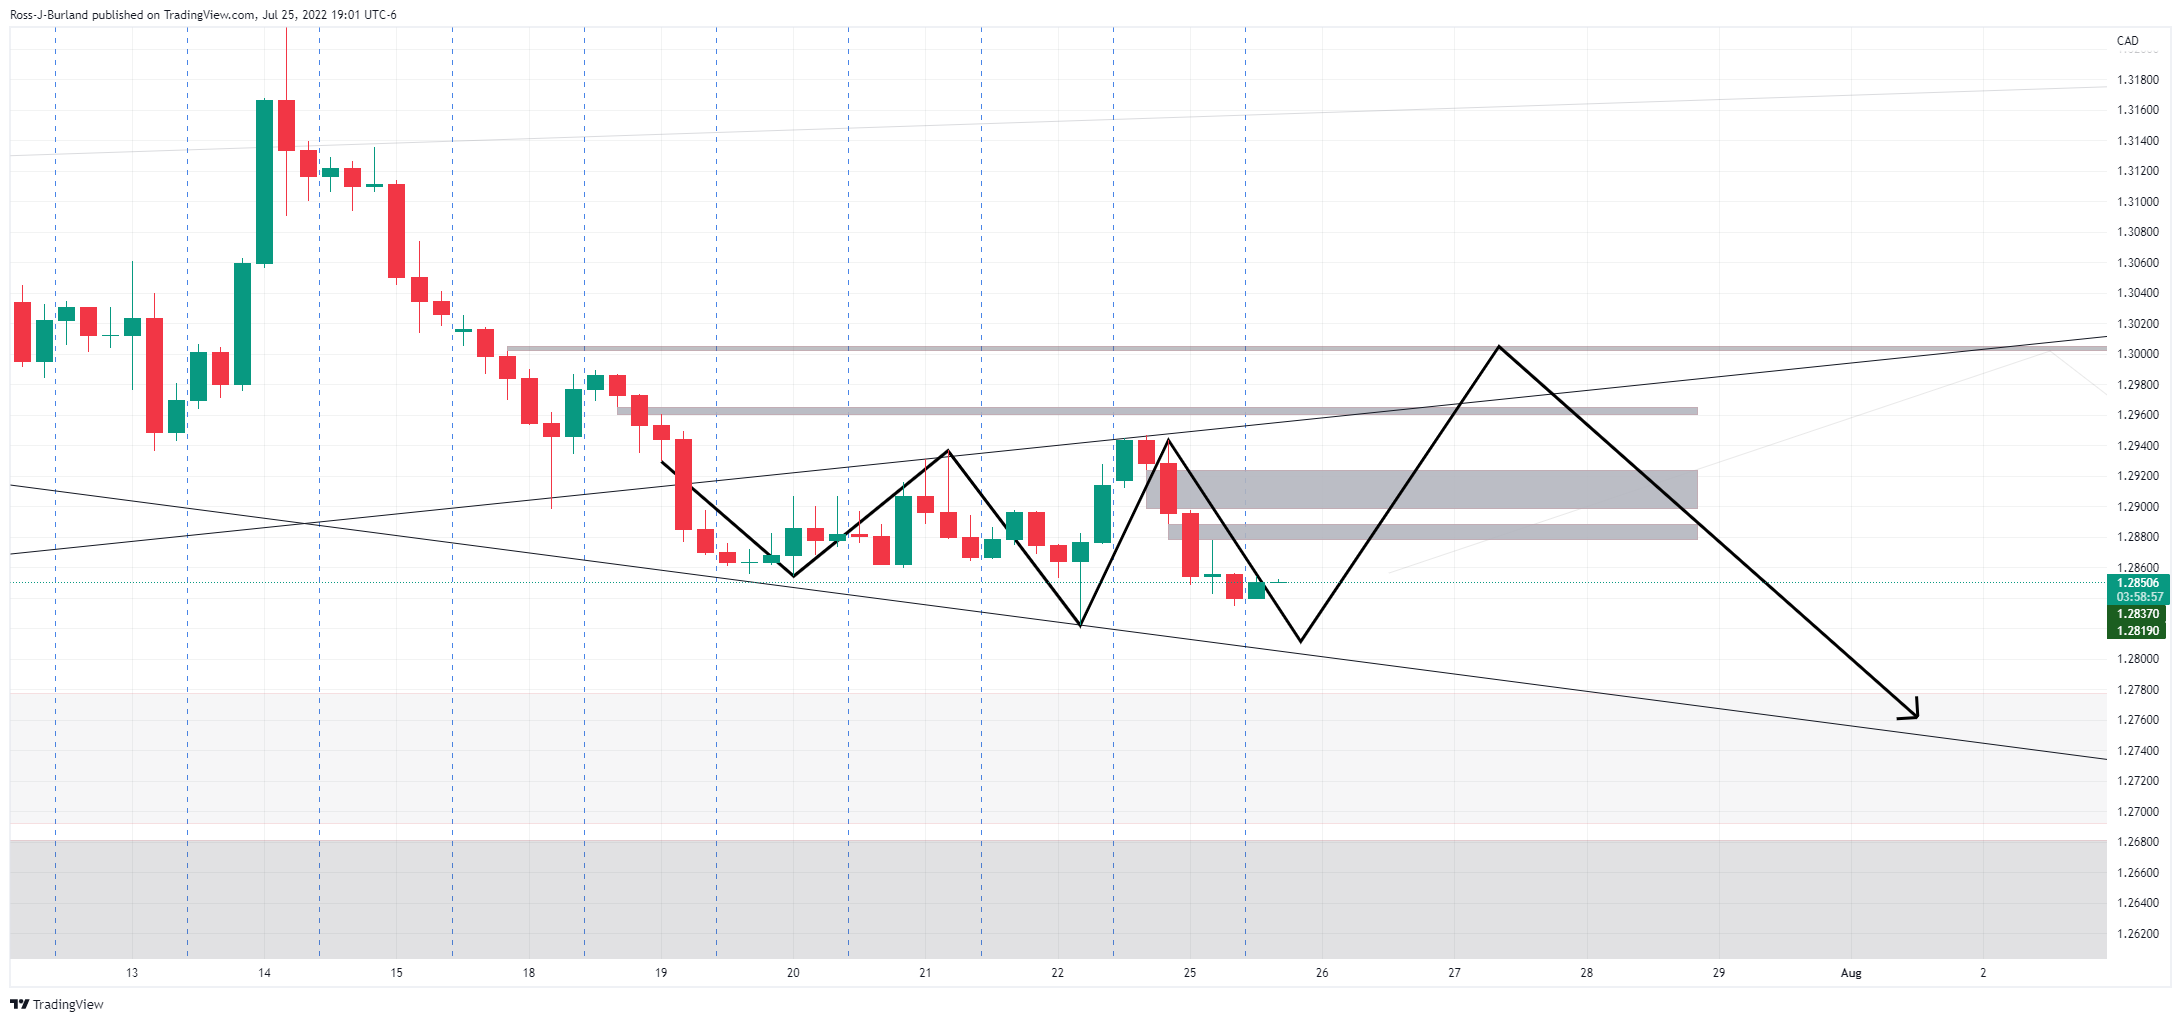
Since the analysis, the price has moved in on the midpoint of the range:

At this juncture, the bulls could move in from a discount if the price continues to correct the latest bullish impulse and in a continuation towards the mitigation of the price imbalance above en route to the upper end of the broadening formaiton.
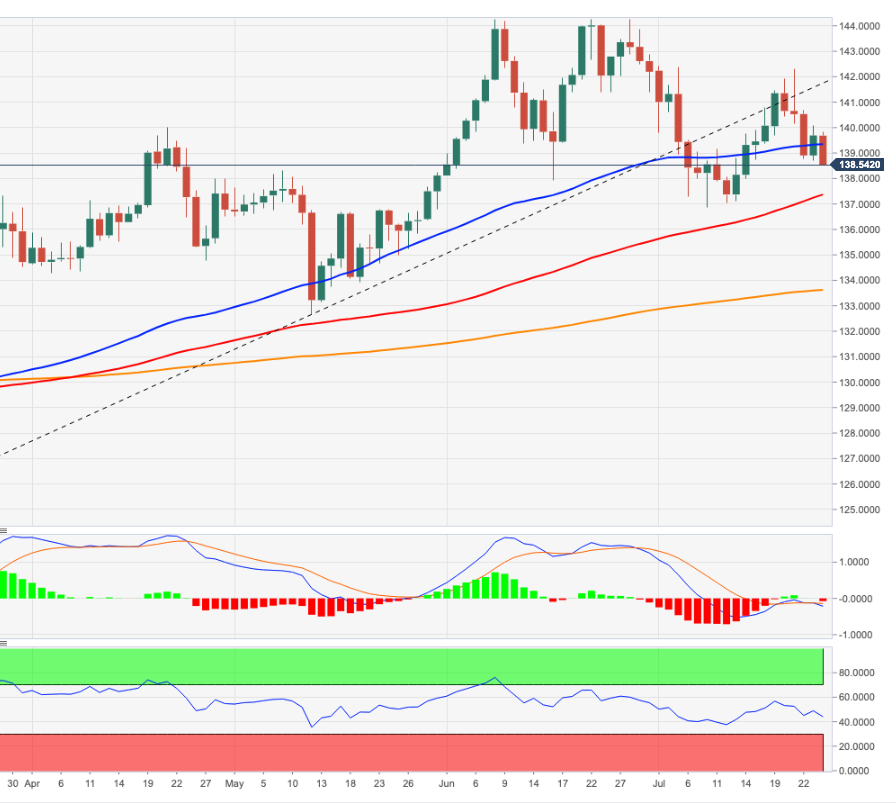
- USD/JPY is likely to deliver more gains after surpassing the critical hurdle of 137.00.
- A rate hike announcement by the Fed will escalate the Fed-BOJ policy divergence.
- A significant drop in Walmart earnings and US Consumer Confidence indicate weaker retail demand.
The USD/JPY pair is displaying a subdued performance in the early Tokyo session after a perpendicular upside move on Tuesday. The asset remained in the grip of bulls as the announcement of interest rate decision by the Federal Reserve (Fed) will escalate the Fed-Bank of Japan (BOJ) policy divergence further. Broadly, the asset is extremely strong and is likely to deliver more gains after overstepping the critical hurdle of 137.00.
As per the market consensus, the Fed will paddle up the cost of capital by 75 basis points (bps). The laborious job of Fed policymakers to trim demand by elevating interest rates and to elevate supply for restoration of modest prices without dragging the economy into recession is getting heated now. Retail demand has taken the bullet as the US Consumer Confidence has dropped to lowest since February 2021 to 95.7 and giant retail-chain operator Walmart has reported weak earnings.
Meanwhile, the US dollar index (DXY) has established above the immediate hurdle of 107.00 and is likely to extend gains on hawkish Fed policy. Apart from the Fed policy, the release of the US Durable Goods Orders will remain in focus. The economic data is seen plunging to -0.2% from the prior release of 0.8%. A slippage in the aforementioned economic data indicates that the overall demand in the US economy is currently dominated by higher energy and food bills.
On the Tokyo front, the continuation of an ultra-loose monetary policy by the BOJ will keep the yen bulls in the negative trajectory. No doubt, the weaken yen has resulted into a significant increase in exports and eventually contributing meaningfully into the corporate earnings. But, for a long-term prospective, weaker yen may not be fruitful for the economy.
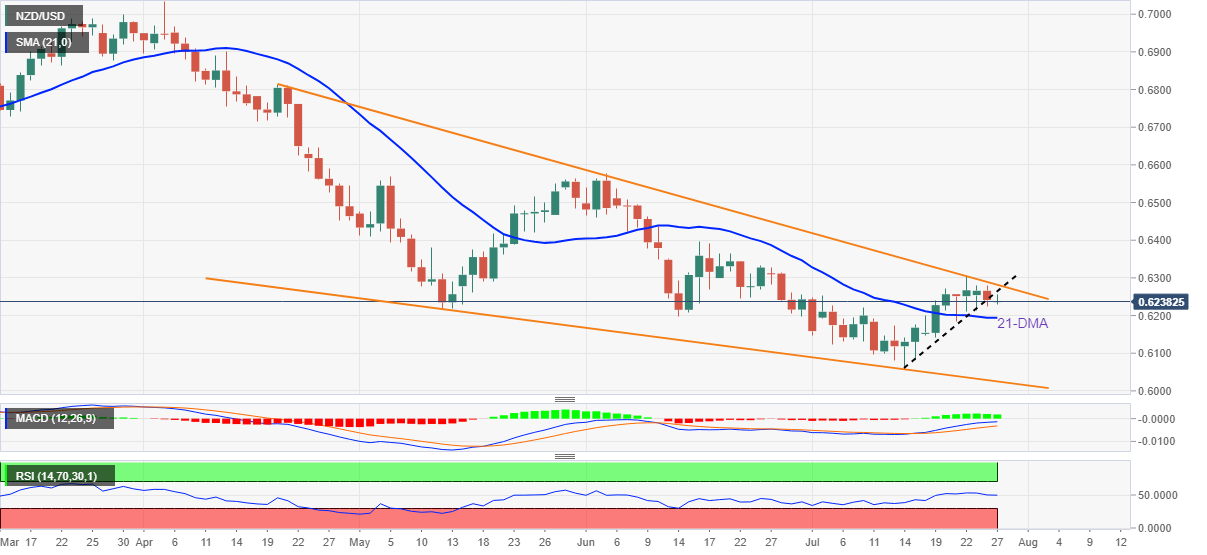
- NZD/USD picks up bids to pare the biggest daily loss in two weeks.
- Downside break of a fortnight-old ascending trend line, RSI retreat joins easing bullish bias of MACD to favor sellers.
- Bulls need to cross 0.6280 to retake control.
NZD/USD consolidates the biggest daily fall in 12 days around 0.6240 during Tuesday’s Asian session. Even so, the kiwi pair stays on the bear’s radar inside a three-month-old falling wedge bullish chart pattern.
That said, the quote’s clear downside break of the two-week-old previous support line joins the RSI (14) retreat and recently easy MACD to keep sellers hopeful.
During the NZD/USD pair’s further weakness, the 21-DMA surrounding 0.6195 could restrict the short-term declines, a break of which could direct the bears towards the recent multi-month low of 0.6060.
However, a downward sloping support line from mid-May, around 0.6025 by the press time, could challenge the pair sellers afterward.
Alternatively, the support-turned-resistance line, around 0.6260, guards the quote’s immediate upside ahead of the stated wedge’s resistance line, at 0.6280 at the latest.
In a case where NZD/USD remains firmer past 0.6280, it confirms the falling wedge bullish chart pattern and renews the upside momentum.
It’s worth noting that the monthly peak surrounding 0.6300 and the mid-June swing high of 0.6395 could act as the checking points for the Kiwi pair buyer’s return.
NZD/USD: Daily chart
Trend: Further weakness expected
- The AUD/JPY trimmed some of its Monday’s gains and formed a doji as indecision keeps traders at bay.
- From a long-term perspective, the AUD/JPY is neutral biased.
- In the near term, the AUD/JPY is neutral-upwards and might aim towards the 95.70s area.
The AUD/JPY remained in a choppy trading session, courtesy of a dampened market mood, which increased appetite for safe-haven peers like the Japanese yen, while the Australian dollar awaits crucial data, with inflation figures about to be released on Wednesday, around 01:30 GMT. Nevertheless, the AUD/JPY still recorded minimal losses of 0.07%, but as the Asian session opens, it is trading at 95.08.
AUD/JPY Price Analysis: Technical Outlook
The AUD/JPY daily chart illustrates that Tuesday’s price action formed a dragonfly-doji, meaning buyers/sellers are unsure about the pair’s direction. Helped by the daily moving averages, the AUD/JPY is upward biased, but the uptrend appears to be losing steam, as buyers have been unable to challenge the YTD highs of around 96.88 since June 9. Contrarily, sellers have stepped in and recorded a correction of 5.63% from YTD highs, but the cross-currency aimed towards the 95.00 area and has been unable to crack below July 1 low at 91.42. Hence, the AUD/JPY is neutral biased.
AUD/JPY 1-hour chart
In the near term, the AUD/JPY is also neutral biased. Nevertheless, due to recent price action, it is slightly tilted to the upside, supported by the hourly EMAs, lying below the exchange rate. Besides, the Relative Strength Index (RSI) is in bullish territory and aiming higher, signaling buyers’ momentum is increasing.
Therefore, the AUD/JPY first resistance would be the confluence of the July 26 high and the R1 daily pivot point around 95.27-35. Once cleared, the AUD/JPY’s next resistance would be the July 21 daily high and the R2 pivot at 95.60, followed by the July 20 high at 95.76.
AUD/JPY Key Technical Levels
- AUD/NZD is aiming to recapture a six-week high at 1.1168 on higher estimates of Australian CPI.
- Australian inflation for Q2CY22 is seen higher at 6.2% vs. 5.1% reported earlier.
- The RBNZ will measure the performance of its monetary policy decisions through economic parameters.
The AUD/NZD pair is advancing sharply to recapture a six-week high at 1.1168 as a higher consensus for Australian Inflation will compel the Reserve Bank of Australia (RBA) to tighten its policy further. On a broader note, the cross has displayed a sheer upside move after a corrective move to Monday’s low at 1.1053.
In the early Tokyo session, investors have turned sidelines as the extent of the jump in the inflation rate will demonstrate a clear picture of the economic situation and the headwinds the households are facing due to price pressures.
As per the market consensus, the Australian Consumer Price Index (CPI) for the second quarter of CY2022 is seen at 6.2%, higher than the prior release of 5.1%. No doubt, the price pressures are hurting the paychecks of households in Australia and the overall demand would be going through a tough phase. To combat the sky-rocketing inflation rate, the RBA has already elevated its Official Cash Rate (OCR) by a consecutive 50 basis points (bps). Officially, the RBA’s OCR has been elevated to 1.35%.
On the kiwi front, Reserve Bank of New Zealand (RBNZ) Governor Adrian Orr said on Tuesday that it is undertaking a review of its recent performance in conducting monetary policy, as per Reuters. The central bank will scrutiny the condition of inflation and employment catalysts, which will help them to identify the performance of the monetary policy decisions.
- USD/CHF remains pressured after recalling the bears the previous day.
- Market sentiment deteriorates amid recession fears, pre-Fed anxiety.
- Fed is expected to announce 75 bps rate hike, Powell’s speech will be important.
- Swiss ZEW Survey data, US Durable Goods Orders are additional catalysts to watch for fresh impulse.
USD/CHF remains on the back foot around 0.9625-20 during Tuesday’s Asian session, following the seller’s re-entry from 0.9667 the previous day. Despite the broad US dollar strength, the pair manages to stay heavy due to the Swiss Franc’s (CHF) safe-haven nature.
The US dollar cheered the risk-off mood on Tuesday, after a dismal start to the week, as the market’s fears of economic slowdown joined the cautious mood ahead of the Federal Open Market Committee (FOMC) meeting.
The fears of economic slowdown intensified after the International Monetary Fund (IMF) cut its global growth forecast (once again) this year, to 2.9% from 3.6% forecasted in April. The Washington-based organization also raised concerns over more economic hardships amid a full cut-off of Russian gas to Europe and a 30% drop in Russian oil exports, both of which are looming. It should be noted that the disappointing results from the global retailer Walmart also contributed to the recession fears.
Elsewhere, the US CB Consumer Confidence fell for a third consecutive month in July, to 95.7 from 98.4 prior. Further, the US New Home Sales dropped to 0.59M for June versus 0.66M expected and 0.642M previous readout. On the same line, Richmond Fed Manufacturing Index rose to the highest level since April, to 0 from -13 expected and -9 prior (revised up from -11).
It should be noted that worsening US-China relation, recently over the South China Sea issue, also pushes US President Joe Biden to arrange a virtual meeting with his Chinese counterpart Xi Jinping, on Thursday. The same adds strength to the risk-off mood.
While portraying the mood, Wall Street closed in the red and the US Treasury yields remain mostly pressured. However, the difference between the 2-year and the 10-year bond coupons widened the most since the year 2000 and highlighted the rush towards risk-safety.
Looking forward, Switzerland’s ZEW Survey – Expectations for July, expected -81.6 versus -72.7 prior, will precede the US Durable Goods Orders for June, -0.4% forecast compared to 0.8% prior, to entertain USD/CHF traders. However, major attention will be given to the Fed’s ability to tame the inflation woes and also avoid the recession.
The US central bank is expected to announce 75 basis points (bps) of a rate hike but some of the traders also highlight the case for the 100 bps move, making the event more interesting.
Also read: Fed Preview: Powell to reignite dollar rally with promise to crush inflation, whatever the cost
Technical analysis
The 100-DMA and an upward sloping trend line from March 31, respectively around 0.9610 and 0.9590, appear tough nuts to crack for the USD/CHF bears. Recovery moves, however, need validation from a convergence of the 21-DMA and the 50-DMA, near 0.9700 by the press time.
That said, USD/CHF bears keep reins amid downbeat MACD signals and mostly steady RSI (14).
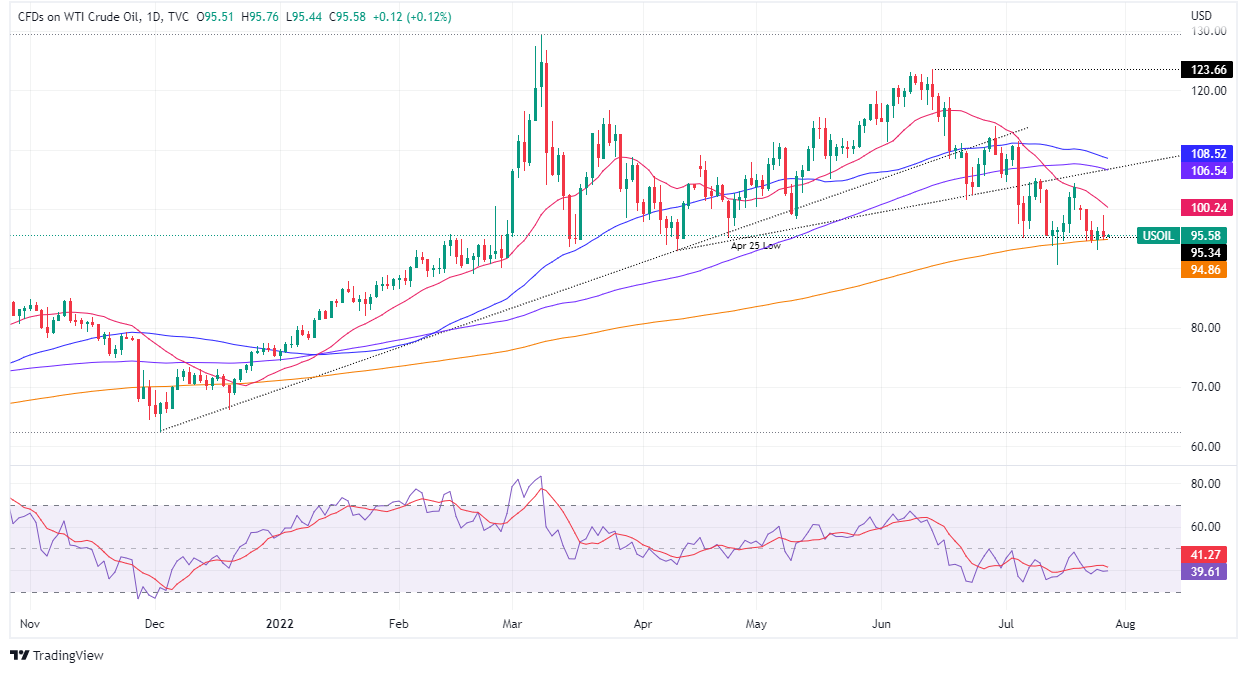
- The US crude oil benchmark lost some 0.83% on Tuesday, weighed by oil’s news aiming to increase supply.
- Sentiment shifted sour, augmenting appetite for safe-haven assets to the detriment of commodity prices.
- According to the Department of Treasure, previous releases from SPR and foreign partners brought gasoline prices down by “40 cents per gallon.”
The US crude oil benchmark, WTI, slides for the first time in the week, down some 0.83%, and is trading at $95.58 BPD at the time of writing. A risk-off mood, dented appetite for the black gold. US companies reporting earnings, and one of the biggest US retailers, blaming high inflation as one of the factors that spurred a slash in profits, kept investors on their toes.
WTI falls on recession fears as the WH taps the SPR reserves
Alongside the abovementioned, on Monday, prices spiked on news that Russia’s Gazprom slashed natural gas flows to Europe from 40 to 20%, as Moscow reported that the missing turbine was on its way to maintenance but had not been installed. WTI reacted upwards to the announcement and closed around $96.26 BPD.
Sources cited by Reuters said, “The announcement revived fears that Russia, despite its cynical denial, will not shy away from using its energy as a weapon in order to gain concessions in its war against Ukraine and ... could probably expect short-term success.”
On Tuesday, earlier in the North American session, EU countries agreed to reduce gas use for the following winter, which was cheered by oil bears, further pushing prices lower. Furthermore, the White House (WH) announced it would sell 20 million barrels from the Strategic Petroleum Reserve. The WH said it would repurchase oil “in future years, likely after 2023.”
Linked to the previously mentioned, the Department of Treasure said that the previous releases from the SPR, alongside releases of crude oil from foreign partners, helped reduce gasoline prices by “about 40 cents per gallon.”
WTI Daily chart
WTI Key Technical Levels
- The upward-sloping trendline from 1.1760 has acted as a major cushion for the asset.
- Pound bulls have comfortable defended the 200-EMA at 1.1990.
- A decisive break of 60.00 by the RSI (14) will trigger the upside momentum.
The GBP/USD pair is auctioning in a tight range of 1.2016-1.2042 from the late New York session as investors’ focus has shifted to the interest rate decision by the Federal Reserve (Fed). The cable has turned sideways after a responsive buying action to near Monday’s low at 1.1960. A responsive buying action indicates upbeat liquidity channelization after the market participants find the asset a value bet.
The cable is firmly marching towards the three-week high at around 1.2100 after sensing an offers absorbing structure around the upward-sloping trendline plotted from July 14 low at 1.1760.
Also, the pound bulls have comfortably defended the 200-period Exponential Moving Average (EMA) at 1.1990, which signals the strength of the asset. Meanwhile, the cable has reclaimed the 50-EMA at 1.2025, which signals that the short-term term is positive now.
The Relative Strength Index (RSI) (14) is oscillating in the 40.00-60.00 range, which seeks a potential trigger. A decisive break of 60.00 will trigger the upside momentum.
An upside break of Tuesday’s average price at 1.2054 will drive the asset to a three-month high at around 1.2100. A breach of the latter will expand the upside potential of the cable to July 4 high at 1.2165.
On the flip side, the greenback bulls may make a comeback if the asset drops below Monday’s low at 1.1960. An occurrence of the same will drag the asset towards Friday’s low at 1.1916 followed by July 13 low at 1.1828.
GBP/USD hourly chart
-637944719190550773.png)
- EUR/USD pares the biggest daily loss in two weeks.
- IMF’s economic forecasts highlight fears of recession in the bloc due to energy crisis.
- US Durable Goods Orders, housing data could entertain traders ahead of FOMC.
- Fed is expected to announce a 0.75 bps rate hike, Powell’s speech will be crucial.
EUR/USD licks its wounds around 1.0125-30 as bears take a breather after the biggest daily slump in 12 days. The quote dropped the most in two weeks amid escalated fears of economic slowdown in the old continent, mainly due to the Russia-linked energy crisis. Also weighing on the pair could be the US dollar’s run-up ahead of today’s US Durable Goods Orders for June and the Federal Open Market Committee (FOMC) meeting.
The European policymakers have a plan to tame the energy consumption during the next six months and avail additional sources to battle reduced gas supplies from Moscow. However, there isn’t any immediate solution to the energy crisis that pushes the old continent towards recession.
It’s worth noting that the International Monetary Fund (IMF) cut the global growth forecast once again this year, from 3.6% in their April review to 2.9%. The Washington-based organization also highlights a scenario of more economic hardships amid a full cut-off of Russian gas to Europe and 30% drop in Russian oil exports. Not only the IMF, but the global rating agency Moody’s also raised concerns over the bloc’s economic health considering the latest problems over the Russian gas supplies to Europe.
On a different page, global retail benchmark Walmart’s disappointing results and downbeat profit forecasts also weigh on the market sentiment.
In the case of data, the US CB Consumer Confidence fell for a third consecutive month in July, to 95.7 from 98.4 prior. Further, the US New Home Sales dropped to 0.59M for June versus 0.66M expected and 0.642M previous readout. On the same line, Richmond Fed Manufacturing Index rose to the highest level since April, to 0 from -13 expected and -9 prior (revised up from -11).
Against this backdrop, equities closed in the red and the US Treasury yields remain mostly pressured. However, the difference between the 2-year and the 10-year bond coupons widened the most since the year 2000 and highlighted the rush towards risk-safety.
Looking forward, EUR/USD may witness a lackluster session ahead of the Fed’s monetary policy meeting announcements, which in turn raise expectations of witnessing a corrective pullback. However, the hope of 0.75% rate hike and likely hawkish comments from Fed Chair Jerome Powell could keep the pair bears hopeful.
Also read: Fed Preview: Powell to reignite dollar rally with promise to crush inflation, whatever the cost
Technical analysis
EUR/USD pair’s U-turn from the 21-DMA, around 1.0200 by the press time, directs the major currency pair towards the 1.0070-65 horizontal support area before challenging the recent multi-month low around 0.9950.
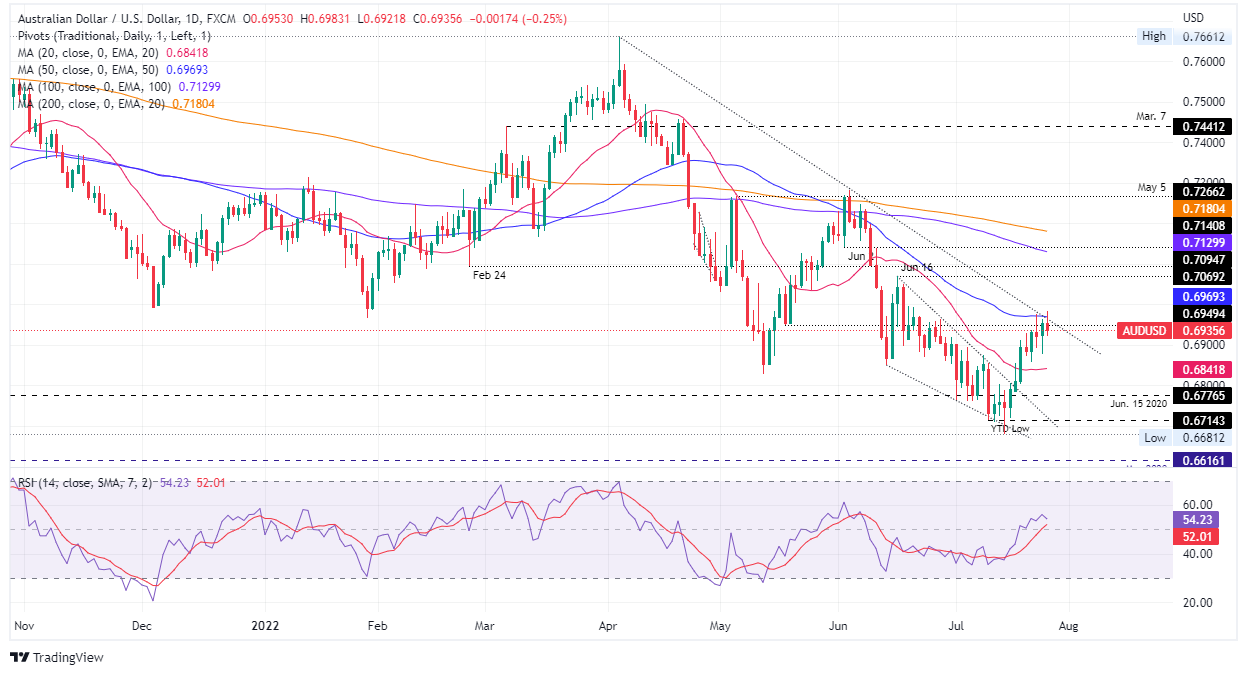
- AUD/USD keeps pullback from five-week high, sidelined of late.
- Fears of economic slowdown, concerns surrounding China weigh on sentiment.
- Equities drop, yield curve inversion widened the most since 2000.
- Australia’s Q2 CPI, FOMC Meeting will be in focus for fresh impulse.
AUD/USD remains sidelined at around 0.6940 during the initial hours of Wednesday’s Asian session, after reversing from the monthly peak the previous day. The Aussie pair’s recent moves could be linked to the market’s risk-off mood amid recession concerns. Also weighing on the quote are the fears surrounding crucial consumer China, as well as the cautious mood ahead of important Q2 Consumer Price Index (CPI) data from Australia and the Federal Open Market Committee (FOMC) meeting.
Market’s fears of economic slowdown magnified after the International Monetary Fund (IMF) cut the global growth forecast once again this year, from 3.6% in their April review to 2.9%. The Washington-based organization also cut China’s 2022 GDP growth forecast to 3.3% from 4.4% in April by citing covid-19 lockdowns and the property sector crisis. It should be noted that the disappointing results from the global retailer Walmart also contributed to the recession fears.
Elsewhere, the US criticized Beijing’s approach to the South China Sea and renewed geopolitical tussles among the world’s top two economies. On the same line were chatters that Russia is up for shutting down gas supplies to Europe.
Talking about the data, the US CB Consumer Confidence fell for a third consecutive month in July, to 95.7 from 98.4 prior. Further, the US New Home Sales dropped to 0.59M for June versus 0.66M expected and 0.642M previous readout. On the same line, Richmond Fed Manufacturing Index rose to the highest level since April, to 0 from -13 expected and -9 prior (revised up from -11).
Amid these plays, equities closed in the red and the US Treasury yields remain mostly pressured. However, the difference between the 2-year and the 10-year bond coupons widened the most since the year 2000 and highlighted the rush towards risk-safety.
Moving on, Australia’s Q2 CPI, expected 1.8% versus 2.1% prior, will be crucial for the AUD/USD traders amid the Reserve Bank of Australia’s (RBA) readiness for heavier rate hikes. Following that, the Fed’s ability to convince markets of its ability to tame inflation and still keep the growth prospects intact will be crucial to watch. That said, the US central bank is expected to announce a 0.75% rate hike.
Also read: Australian CPI Preview: Why inflation is set to exceed estimates, and where AUD/USD could go
Technical analysis
Sustained trading below the 21-DMA level surrounding 0.6850 appears necessary for the AUD/USD bears to retake control. Alternatively, a downward sloping resistance line from mid-April, near 0.6950, precedes the monthly peak of 0.6983 to restrict short-term advances of the pair. That said, MACD and RSI (14) hint at the pair’s further upside.
- Gold price is displaying a lackluster performance as investors await Fed policy for further guidance.
- Lower Consumer Confidence and weak Walmart’s earnings show indicate a slowdown in retail demand.
- The Fed will hopefully elevate its interest rates by 75 bps.
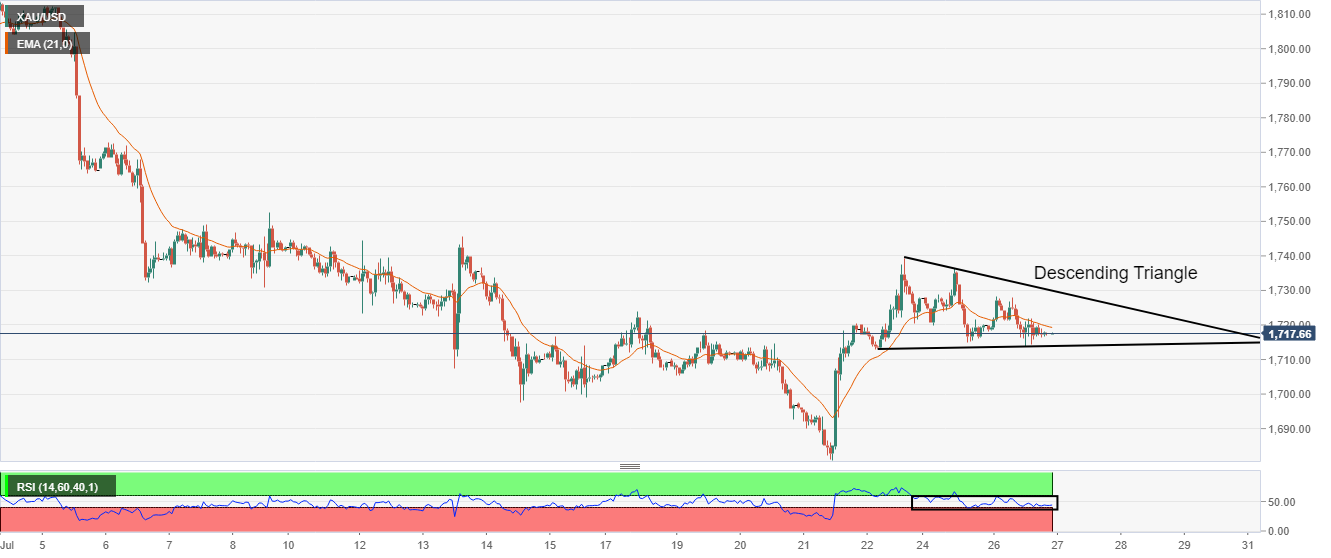
Gold price (XAU/USD) is displaying back and forth moves in a narrow range of $1,713.92-1,721.97 as investors are awaiting the announcement of the fourth consecutive interest rate decision by the Federal Reserve (Fed). The precious metal has displayed a complete volatility contraction, which indicates that now the monetary policy announcement is the only trigger that will fetch auctions in the asset.
The Fed is expected to elevate its interest rates by 75 basis points (bps). This will step up the cost of capital to 2.25-2.50%.
On Tuesday, the release of the US Consumer Confidence failed to bring a significant impact on gold prices. The economic data has decreased consecutively for a third month to 95.7 after the June figure of 98.4. Apart from that, US giant retail chain operator Walmart reported downbeat earnings.
The underperformance of Consumer Confidence and softer earnings by retail giant indicate that retail demand has been hit dramatically by soaring price pressures. No doubt, the US Retail Sales data remained upbeat after landing at 1%, higher than the expectations of 0.6% but they were highly contaminated by runaway inflation.
Gold technical analysis
On an hourly scale, the gold price is auctioning in a descending triangle pattern. The downward-sloping trendline of the volatility contraction pattern is placed from July 22 high at $1,739.37. While the horizontal support is placed from July 22 low at $1,712.94. The above-mentioned chart pattern indicates a volatility squeeze, which will be followed by an expansion in volumes and candlesticks’ range.
The gold prices are overlapping with the 50-period Exponential Moving Average (EMA) at $1,719.42, which signals a consolidation ahead.
Also, the Relative Strength Index (RSI) (14) has shifted into a 40.00-60.00 range, which signals that the asset is awaiting potential a trigger for a decisive move.
Gold hourly chart
- The EUR/JPY erased Monday’s gains and is down 0.30% in the week.
- A risk-off impulse weighed on the shared currency, while safe-haven peers got bid, like the yen.
- EUR/JPY Price Analysis: In the short-term, tilted to the downside, it might break below 138.00.
The EUR/JPY tumbles from around the confluence of the 20 and 50-day EMA around 139.767-72 and breaks below the 139.00 thresholds, refreshing two-week lows around 138.13 in the mid-North American session. At 138.55, the EUR/JPY is set to finish Tuesday’s session with losses of 0.76%.
Investors’ mood shifted sour ahead of the US Federal Reserve monetary policy meeting, courtesy of US companies missing earnings, while others blame inflation and missing earnings due to currency fluctuations, which weighed on the EUR/JPY.
EUR/JPY Price Analysis: Technical outlook
The EUR/JPY daily chart depicts the pair as neutral-to-upward biased but under some selling pressure. EUR/JPY bore stepped in around the confluence of the 20 and 50-day EMA and sent the pair tripping down almost 200 pips, but once the dust settled, it bounced off to current price levels. On the downside, the EUR/JPY’s first support would be the 100-day EMA at 137.44 before giving way to sellers on its way to July’s 8 low at 136.85. Upwards, EUR/JPY buyers need to reclaim the 20 and 50-day EMA area around 139.46-80 to regain control.
EUR/JPY 1-hour chart
The EUR/JPY hourly chart depicts the pair as downward biased after opening near the daily highs at 139.61. the cross consolidated around 139.32-60 before nose-diving towards its daily low close to 138.00. However, as the Asian session began, the EUR/JPY is trading below the daily pivot, located at 138.83. If EUR/JPY buyers reclaim the July 26 low at 138.71, that will pave the way for further upside. Nevertheless, the cross-currency pair path of least resistance is downwards.
Therefore, the EUR/JPY first support would be 138.00. Break below will expose the S1 daily pivot at 137.78, followed by the July 12 low at 137.14, and then the July 8 low at 136.85.

EUR/JPY Key Technical Levels
- NZD/USD bears are looking for the 0.61 area in a 1-3 month view.
- All eyes will be on the Fed on Wednesday as the next catalyst.
At 0.6231, NZD/USD is lower by some 0.45% and has fallen from a high of 0.6280 to a low of 0.6224 on the day. The bears have been in charge during a risk-off day amid lower Us stocks and profit warnings from Walmart. Across the pond, the gas woes crippled the euro and send a bid on the US dollar.
''With more key earnings results today and the Federal Open Market Committee tomorrow, volatility is likely going to stay elevated,'' analysts at ANZ Bank said. ''Focus will be on the Fed’s language and whether it is showing any concerns around the recent spate of disappointing survey data.''
The two-day FOMC started on Tuesday and the Fed is widely expected to hike rates 75 bp to 2.50%. WIRP suggests only around 15% odds of a 100 bp move. ''With the recent weakness in the data, there is simply no need to go bigger this week,'' analysts at Brown Brothers Harriman argued.
''Updated macro forecasts and Dot Plots won’t come until the September meeting. Another 75 bp hike on September 21 is about 50% priced in. A 25 bp hike is fully priced in for November 2 but after that, one last 25 bp hike is only partially priced in. The swaps market paints a similar picture, with 175 of tightening priced in over the next 6 months that would see the policy rate peak near 3.5%. After that, an easing cycle is priced in for the subsequent 6 months.''
However, investors will be keeping a close eye on the Fed's forward guidance as it grapples with high inflation and the potential for a recession. ''Yes, the US economic data have been weakening but we do not think a recession is imminent,'' the analysts at BBH said. ''When all is said and done, we believe the US economy remains the most resilient. However, we expect a period of consolidation ahead for the dollar until the US economic outlook becomes clearer.''
Meanwhile, analysts at Rabobank said that they expect the USD to remain well bid on the back of safe haven demand despite speculation that the market may have over-estimated the extent of Fed policy tightening in the coming months.
''In our view, USD strength is likely to push NZD/USD back towards its recent lows in the 0,61 area on a 1 to 3-month view. We expect USD strength to turn around on a 6-month view allowing NZD/USD to recover to the 0.64 regions.''
What you need to take care of on Wednesday, July 27:
Risk aversion took over financial markets on Tuesday, benefiting the greenback the most. Several factors dented the market’s mood.
Germany reported that Gazprom, the Russian gas giant, is delivering pretty much 20% of its usual natural gas provision. EU countries agreed to reduce gas use for next winter, aiming to cut gas use by 15% in the upcoming six months. Meanwhile, Moscow reported that the missing turbine for the pipeline is on its way after maintenance, but it still has not been installed.
Additionally, speculative interest was paying attention to US bond yields. The yield curve is the most inverted since 2000. 2-year Treasuries are yielding 3.03%, while the 10-year note yields 2.76%. An inverted curve is usually a sign of an upcoming recession.
The International Monetary Fund (IMF) cut the global growth forecast once again this year, from 3.6% in their April review to 2.9%. The organism also warned that downside risks from overheated inflation and the Ukraine war could push the world economy to the edge of a global recession. The World Economic Outlook also showed that in the case Russia complete cut gas to Europe and a drop in the country’s oil export would slow growth further in 2023.
The EUR was again among the weakest USD rivals, with EUR/USD flirting with 1.0100. GBP/USD held above 1.2000, while the AUD/USD settled at 0.6935. The USD/CAD pair advanced amid weaker oil prices, trading near 1.2890.
Save-haven currencies saw little activity, with USD/CHF steady around 0.9620 and USD/JPY now trading at 136.75.
Spot gold remained within familiar level, although near the lower end of its latest range. The bright metal changes hands at $1,717 a troy ounce.
Crude oil prices edged lower, partially due to the dismal mood but also because of a US decision to sell additional 20 million barrels of oil from its Strategic Petroleum Reserve. The barrel of WTI finished the day trading at $94.90 a barrel.
The focus now shifts to the US Federal Reserve. The central bank is widely anticipated to hike the funds rate by 75 bps, although there is a chance of a 100 bps movement. The latter has become increasingly unlikely since the latest Fed meeting, as economic growth keeps deteriorating. Policymakers may not risk a recession to tame inflation.
Top 3 Price Prediction Bitcoin, Ethereum, Ripple: Gepetto's guilty pleasure
Like this article? Help us with some feedback by answering this survey:
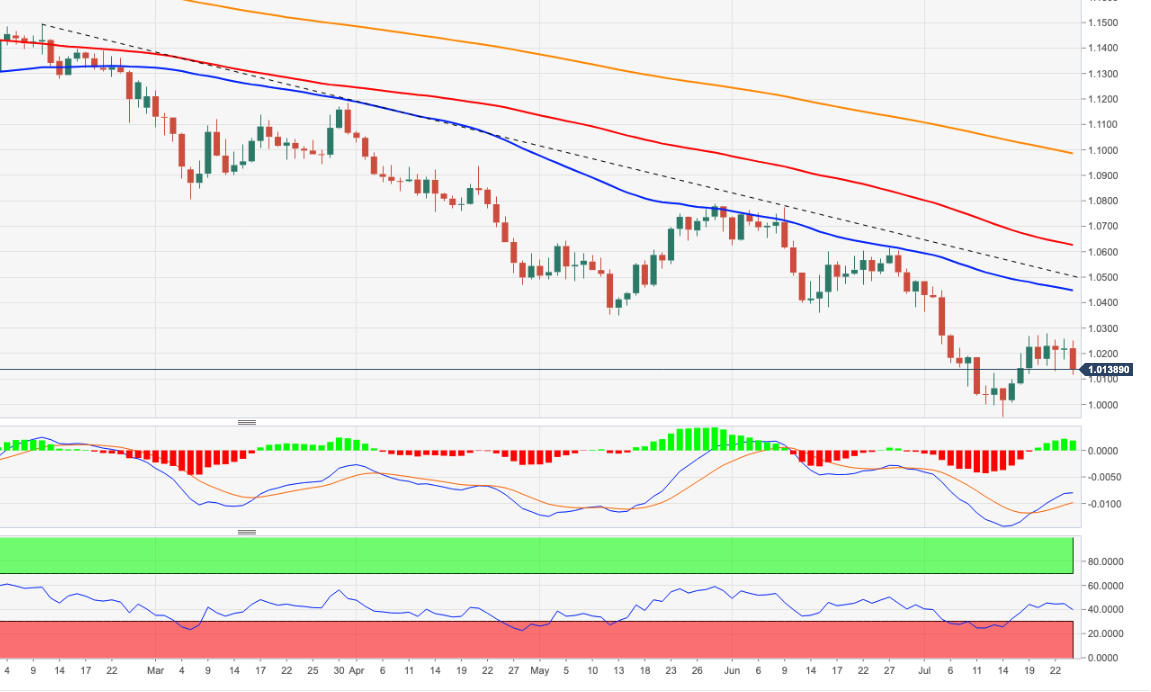
- EUR/USD bears are taking on a critical territory to the downside.
- The euro is out of favour as the US dollar picks up the safe haven flows ahead of the Fed.
At 1.0122, EUR/USD is lower on the day by some 0.90% at the time of writing, trying to establish a grounding, however, in the recent hour of the New York session. The pair has been pressured from a high of 1.0250 amid a risk-off tone stemming from both sides of the pond.
In the US, risk appetite was squashed on Wall Street. Profit warnings by Walmart and fears of an inflation-led recession in the US economy have sapped flows from stocks and sent them towards US debt instead and the US dollar. At the same time, the International Monetary Fund sliced its outlook for global growth this year which is supportive of the greenback.
Meanwhile, the euro has been hit this week by a poor business sentiment survey in Germany in the wake of the gas crisis. Eurozone growth risks have risen sharply as Russia announced another cut in natural gas shipments. On Monday, Russian energy giant Gazprom said gas flows to Germany through the Nord Stream 1 pipeline would fall to 33 million cubic metres per day from Wednesday, or half of the current flow, which was already at only 40% capacity. Subseqent Kremlin-related commentary has resulted in European Union countries approving a weakened emergency plan to curb their gas demand as they brace for further Russian reductions in supply.
Fed eyed as the next catalyst
The two-day Federal Open Market Committee starts today and the Fed is widely expected to hike rates 75 bp to 2.50%. WIRP suggests only around 15% odds of a 100 bp move. ''With the recent weakness in the data, there is simply no need to go bigger this week,'' analysts at Brown Brothers Harriman argued.
''Updated macro forecasts and Dot Plots won’t come until the September meeting. Another 75 bp hike on September 21 is about 50% priced in. A 25 bp hike is fully priced in for November 2 but after that, one last 25 bp hike is only partially priced in. The swaps market paints a similar picture, with 175 of tightening priced in over the next 6 months that would see the policy rate peak near 3.5%. After that, an easing cycle is priced in for the subsequent 6 months.''
However, investors will be keeping a close eye on the Fed's forward guidance as it grapples with high inflation and the potential for a recession. ''Yes, the US economic data have been weakening but we do not think a recession is imminent,'' the analysts at BBH said. ''When all is said and done, we believe the US economy remains the most resilient. However, we expect a period of consolidation ahead for the dollar until the US economic outlook becomes clearer.''
As for the European Central Bank, it raised all three of its main policy rates last Thursday, hiking the main refinancing rate from 0.0% to 0.5%, the marginal lending facility rate from 0.25% to 0.75%, and the deposit facility rate from -0.5% to 0.0%. This was the first rate increase in 11 years and the biggest since 2000 and surprised most economists, who had anticipated only a 25-basis-point move. However, despite the ECB’s hawkish surprise last week, the euro remains pressured due to the gas crisis which will make it difficult for the ECB to hike aggressively and can keep the euro hamstrung in the wake of a firmer US dollar.
EUR/USD technical analysis

The euro is being sent lower to the bottom of the broadening formation's lower boundary and into a price imbalance on the daily chart, as per the greyed areas between 1.0120 and 1.0058. This meets a 61.8% Fibonacci retracement of the prior bullish rally where bulls may look to step in again. On the upside, there is a significant price imbalance between 1.0276 and 1.0416 should the bulls manage to get back in control again.
- GBP/JPY barely slides 0.06% in a choppy trading session.
- Sentiment remains negative, thus putting a lid on GBP/JPY gains.
- GBP/JPY Price Analysis: Tuesday’s price action is shrinking, and a bullish-harami is forming in the daily chart, opening the door for further upside.
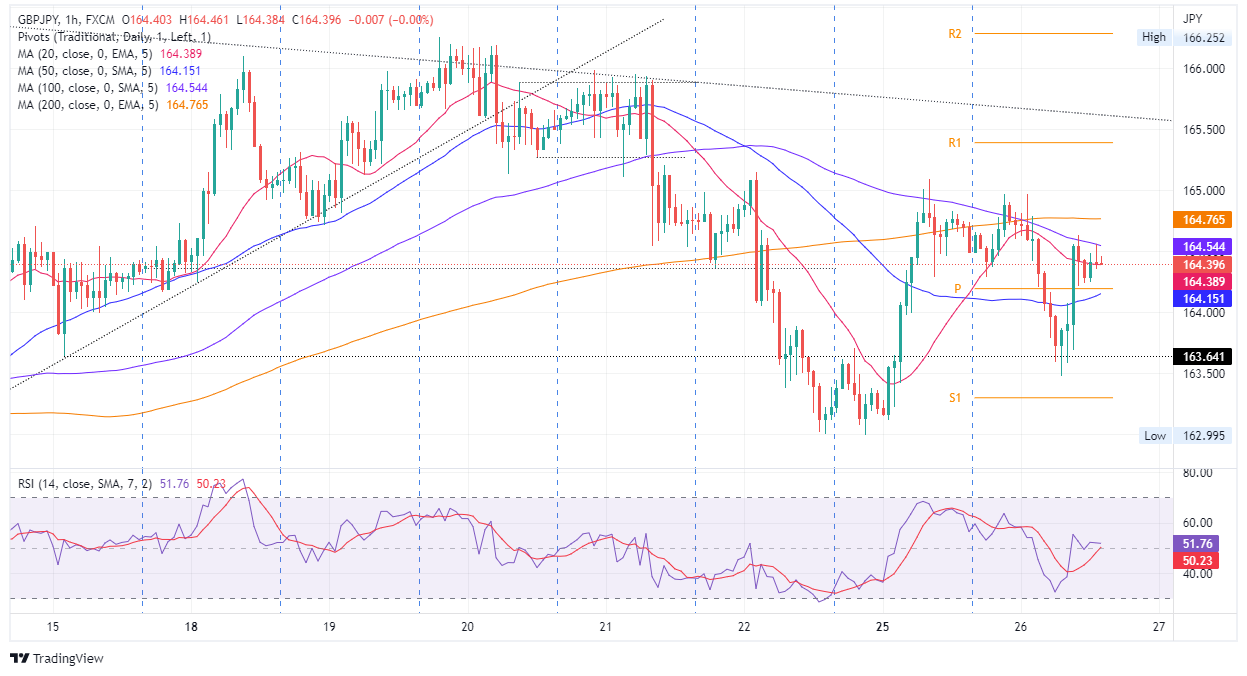
GBP/JPY slides and erases Monday’s gains due to downbeat market sentiment in the financial markets, triggered by US Walmart blaming inflation as the principal reason to rip its profit forecasts. Meanwhile, Russia reduced gas flows through Nord Stream 1, and EU countries agreed to use less natural gas for the next winter, reigniting recession fears in the bloc. At the time of writing, the GBP/JPY is trading at 164.39.
GBP/JPY Price Analysis: Technical outlook
The GBP/JPY is neutral-to-upward biased, and sellers’ failure on Tuesday to achieve a daily close below the 20 and 50-day EMAs at 164.05 and 163.68, respectively, opened the door for further gains. Despite the previously mentioned, buyers need to further lift the GBP/JPY exchange rate above the three-month-old upslope support trendline-now-resistance around 165.00 to cement the case for a rally to 166.00. Otherwise, GBP/JPY sellers would remain hopeful of dragging prices below 163.00 if they would like to regain control.
GBP/JPY 1-hour chart
The GBP/JPY hourly char portrays the cross-currency pair as neutral biased. On Tuesday, the pair’s price action shrank between the boundaries of Monday, meaning that a bullish-harami chart pattern is forming in the daily chart, which would open the door for further gains. Nevertheless, on its way up, the GBP/JPY’s first resistance would be the 100-hour EMA at 164.54. Break above will expose the 200-hour EMA at 164.76, followed by the July 25 daily and weekly high at 165.08.
On the flip side, the GBP/JPY first support would be the 20-day EMA at 164.39. Once cleared, the next support would be the intersection of the 20-hour EMA and the daily pivot around 164.15, followed by 164.00.
GBP/JPY Key Technical Levels
- GBP/USD bulls move in during the midday NY session.
- The price is meeting a key level of 4-hour resistance.
- Eyes will move from gas woes in Europe to the Fed for the next catalyst.
At 1.2031, GBP/USD is lower on the day by some 0.16% at the time of writing, recoupling the losses from the 1.1963 lows scored at the start of the New York session. The pair has been pressured from a high of 1.2090 amid a risk-off tone stemming from both sides of the Atlantic.
In the US, risk appetite was reigned in on Wall Street as the retail sector is weighed by profit warnings by Walmart which is re-energising the fears of an inflation-led recession in the US economy. However, US government bonds rose with the dollar as the International Monetary Fund sliced its outlook for global growth this year.
Across the pond, equally supportive of the safe haven US dollar in wake of the most recent Kremlin-related commentary, the euro has been pressured. European Union countries have approved a weakened emergency plan to curb their gas demand as they brace for further Russian reductions in supply.
Fed eyed as the next catalyst
Meanwhile, central bank reaction functions will come back to the fore as the Federal Reserve is widely expected to raise interest rates by 75 basis points on Wednesday. However, investors will be keeping a close eye on the central banks' forward guidance as it grapples with high inflation and the potential for a recession. With that being said, like most other G10 central banks, both Fed and the Bank of England have made it clear that forcing down inflation is its primary goal, even at the cost of growth.
The BoE said in June it was ready to act forcefully if needed and Governor Andrew Bailey has said a half percentage-point increase in interest rates is now on the table, as well as the typical quarter-point move. The MPC's next scheduled announcement on August 4. Nevertheless, according to a Reuters poll, 54% of respondents anticipate only a 25 basis point hike while 45% think we will see a 50 bps hike. This is in contrast to the prior hawkish sentiment being priced into the pound by markets.
GBP/USD technical analysis
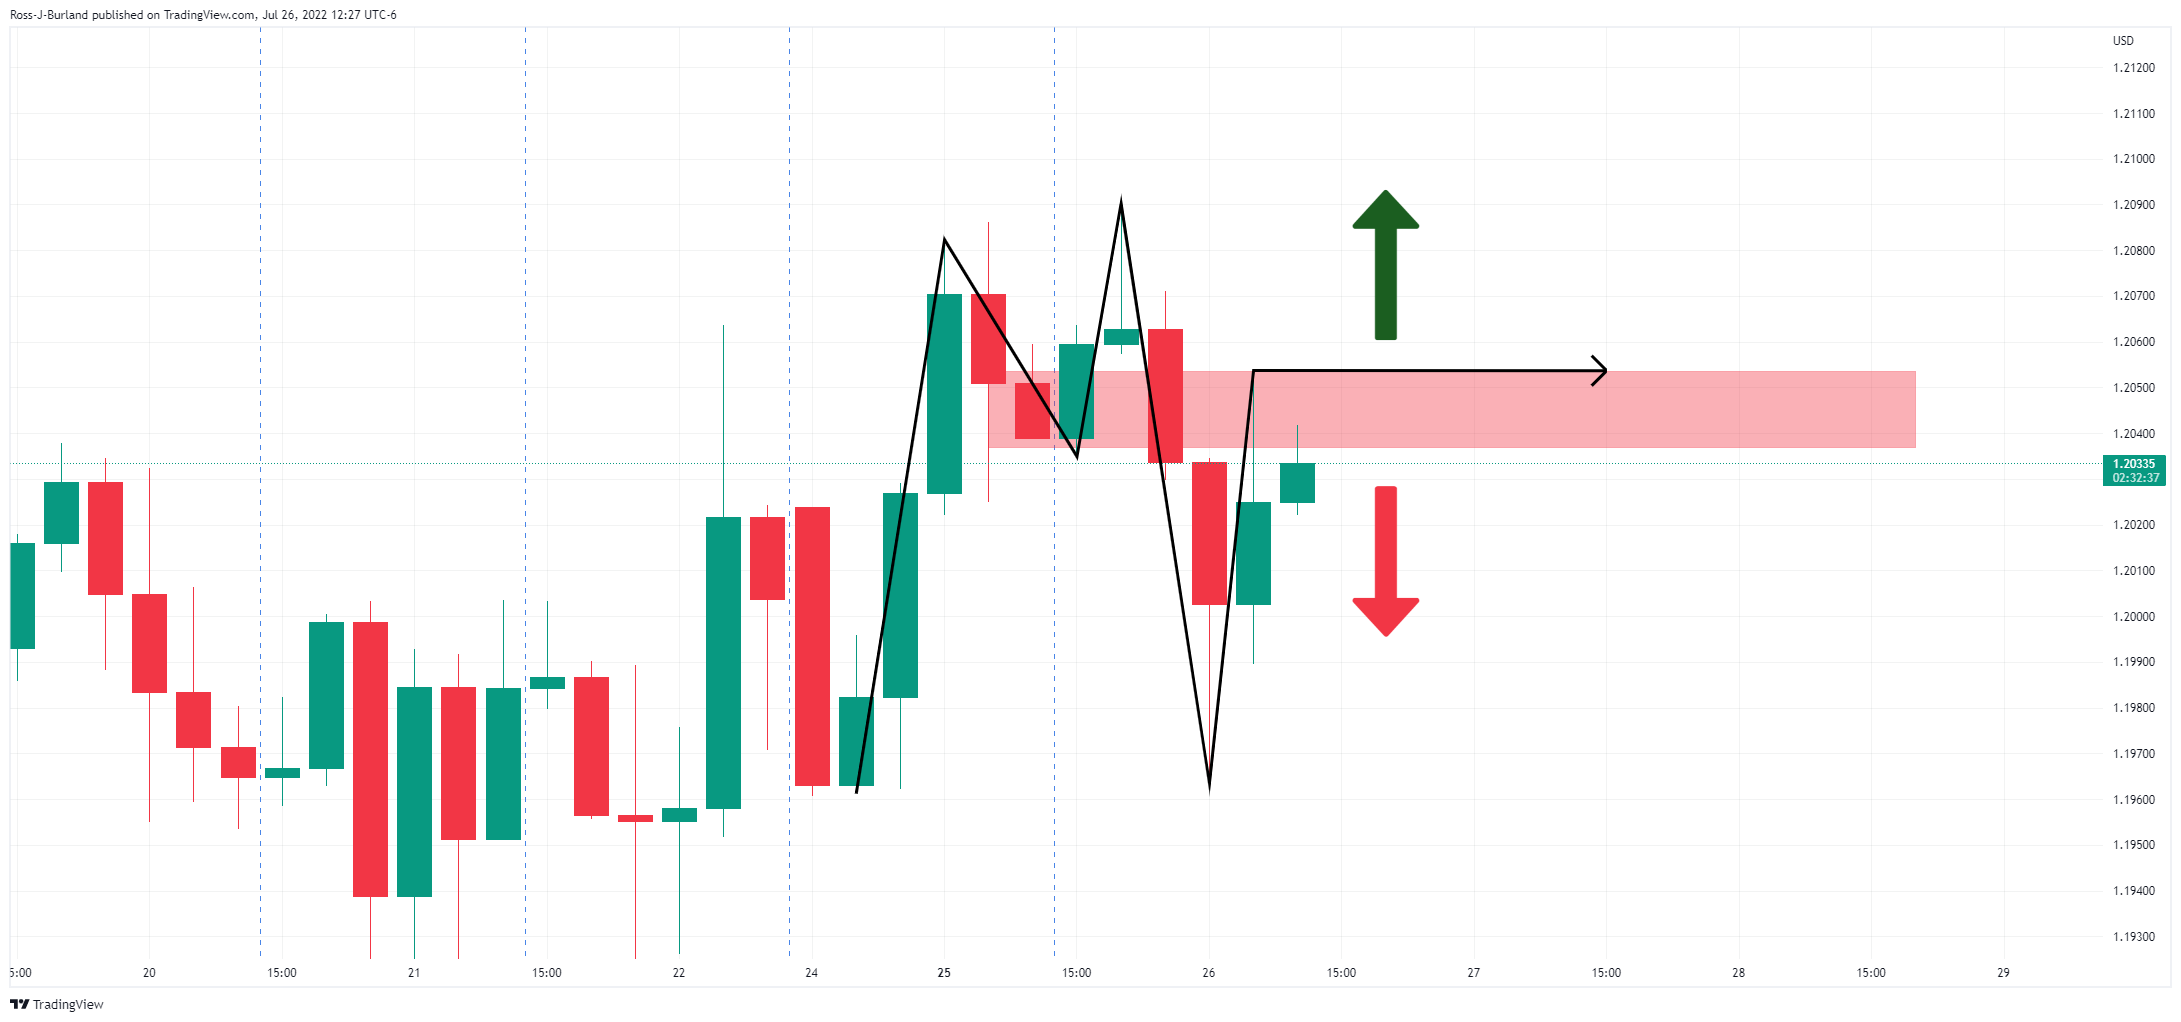
As per the prior analysis, GBP/USD Price Analysis: Bulls set a medium-term target in the 1.22 area, the price has fallen to mitigate the imbalance identified in the 4-hour time frame but has since found its footing. A break of 1.2090 will now be needed to see the price continue on its northerly trajectory. First, the bulls need to clear the neckline of the 4-hour M-formation:
- The three major US equity indices plunge between 0.44% and 1.79%.
- Sentiment shifted after Walmart blamed “high inflation” as it rips its profit outlook for the second half of 2022.
- The US Dollar Index rises above 107.000, while the US 10-year T-note yield is flat at around 2.79%.
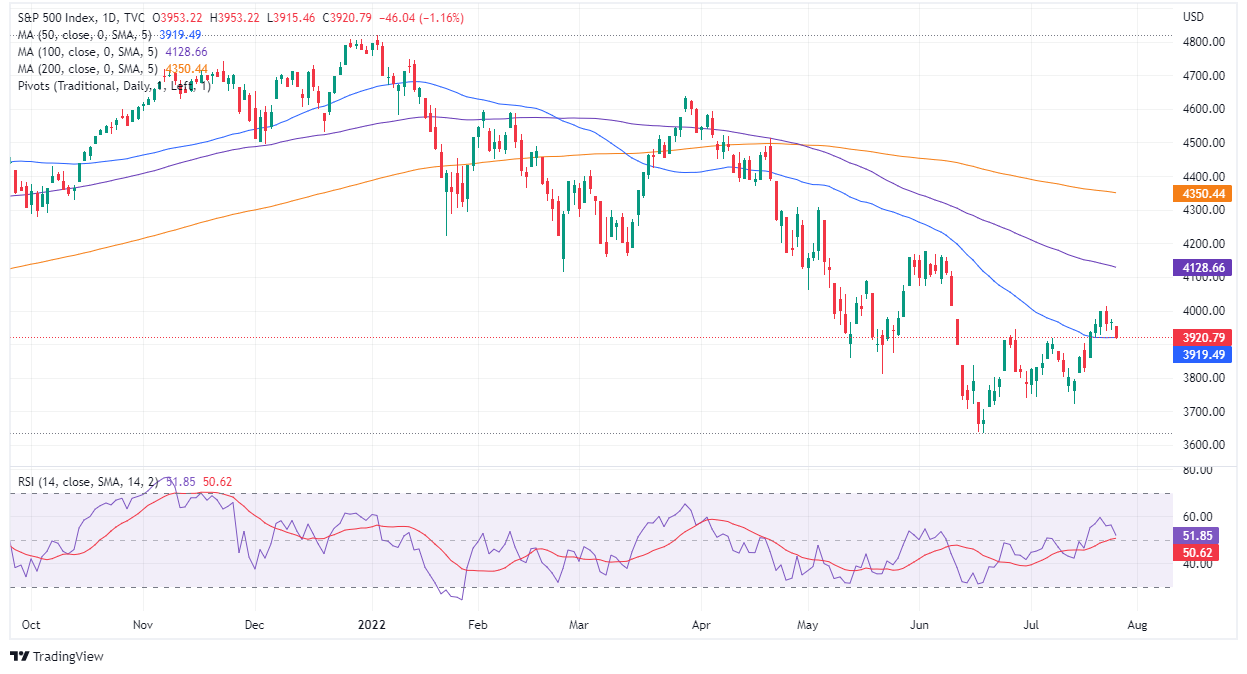
US equities slumped after jumping from YTD low levels, but a dampened market sentiment, alongside July’s Federal Reserve monetary policy decision looming, kept investors uneasy on Tuesday.
At the time of writing, the S&P 500 sits at 3,920.79, falling 1.16%, while the tech-heavy Nasdaq slumps by 1.79%, at 11,572.09, and the Dow Jones Industrial average slides 0.44% to 31,850.33
Sector-wise, the leading sectors are Health, up by 1.02%, followed by Utilities and Real Estate, each recording gains of 0.64 % and 0.25%, respectively. The biggest losers were Consumer Discretionary, Communication Services, and Technology, plummeting 3.09%, 1.88%, and 1.36% each.
Shares fell due to Walmart cutting its earnings forecast, complaining about double-digit food prices and elevated energy prices. Additionally, the US Federal Reserve monetary policy decision is looming, and Europe’s escalating energy crisis re-ignited recession fears amongst traders, which turned to safe-haven assets, namely the greenback.
The US Dollar Index (DXY), a measurement of the greenback’s value against some currencies, rallies 0.62% to 107.132, while the 10-year US Treasury yield is almost flat, yielding 2.792%.
in the commodities complex, WTI drops 1.13%, exchanging hands at $95.60 BPD. Meanwhile, precious metals like gold (XAU/USD) drop 0.11%, trading at $1717.15 a troy ounce.
SP 500 Chart
Key Technical Levels
- AUD/USD tumbles due to downbeat sentiment and a stronger greenback.
- US Consumer confidence deteriorates further, while housing data reveals that prices are slumping.
- AUD/USD Price Analysis: Neutral to downward biased, could test the 20-day EMA in the near term.
The AUD/USD slides for the first time in the week, retracing from last week’s high around 0.6983, falling below the 50-day EMA at 0.6969, amidst a dampened market mood, courtesy of US companies complaining about high prices while traders prepare for July’s FOMC meeting.
The AUD/USD is trading at 0.6935, after hitting a 0.6983 daily high, but tumbled as sentiment deteriorated during the day, reaching a daily low at 0.6921, before settling at current price levels.
AUD/USD capped by deteriorated sentiment ahead of Fed’s decision
Several factors worth mentioning weighed on market sentiment. Walmart cut its profit outlook in the year ahead and mentioned double-digit inflation in food prices as one of the reasons, dragging US equities lower. That, alongside EU countries agreeing to reduce gas consumption while Russia reduces gas flows to Europe, increased the chances of the bloc getting into a recession.
In the meantime, a light US calendar, led by the CB Consumer Confidence, dropped to its lowest level since February 2021, from 98.7 to 95.7. Lyn Franco, senior director of economic indicators at the Conference Board, said, “Concerns about inflation -- rising gas and food prices, in particular -- continued to weigh on consumers.” Furthermore, she added, “looking ahead, inflation and additional rate hikes are likely to continue posing strong headwinds for consumer spending and economic growth over the next six months.”
Earlier, housing data showed that prices are falling nationwide, as the Federal Housing Financial Agency revealed. Meanwhile, the Richmond Fed Manufacturing Index for July stood at 0, better than June’s -11, while the Dallas Fed Services Index in July recovered some ground to -10.9 vs. -12.4 in June.
What to watch
The Australian economic docket will feature CPI figures, awaited to increase more than the RBA’s forecast, as TDS analysts wrote. “Our headline forecast implies the peak is likely to exceed the RBA’s 7% year-end target, warranting at least a 50bps Aug policy rate hike. We see upside risks to our forecast.”
On the US front, the US economic docket will feature the Durable Good Orders, Retail Inventories, and Pending Home Sales ahead of the FOMC monetary policy decision.
AUD/USD Price Analysis: Technical outlook
The AUD/USD is neutral-to-downward biased, despite having broken the 20-day EMA. Tuesday’s price action tested the 50-day EMA but tripped down as sellers stepped in around that area, which also intersects with a four-month-old downslope trendline, acting as resistance. Hence, the AUD/USD fell, but it was capped by the Relative Strength Index (RSI) resilience to cross below its 7-day RSI’s SMA, which would trigger a selling signal that could send the AUD/USD lower.
The AUD/USD first resistance would be 0.7000. A breach of the latter could pave the way for further gains, and the target could be the 100-day EMA at 0.7130. On the other hand, if the AUD/USD resumes downwards, its first support would be 0.6900. Once cleared, the next stop would be the 20-day EMA at 0.6842.
The European Central Bank Pablo Hernández de Cos is crossing the wires and has said that there are risks to the eurozone inflation outlook that remain on the upside and have intensified, ‘, particularly in short term’.
de Cos has stated that the risks include lasting deterioration of the economy in the eurozone, and persistently high energy & food prices.
''The ECB stands ready to adjust all instruments to ensure inflation stabilises at 2% medium-term target.''
Meanwhile, the comments follow the last meeting where the ECB announced its new Transmission Protection Instrument (TPI), which will let it buy bonds from indebted countries such as Italy to cap any excessive rise in their borrowing costs, helping limit financial fragmentation within the eurozone.
At 1.1027 vs. the greenback, the euro is under pressure as the week moves along with the prospect of another Russian gas supply cut. Russia said on Monday it would cut gas flows to Germany via the Nord Stream 1 pipeline to 33 million cubic metres per day (bpd) from Wednesday. That is half of the current flow, which is already only 40% of normal capacity. Additionally, risk-off sentiment has sent a bid into the US dollar, while US equities are pulled lower following a profit warning from retail giant WalMart which said it would slash prices to reduce inventory. EUR/USD is down 0.89% at the time of writing.
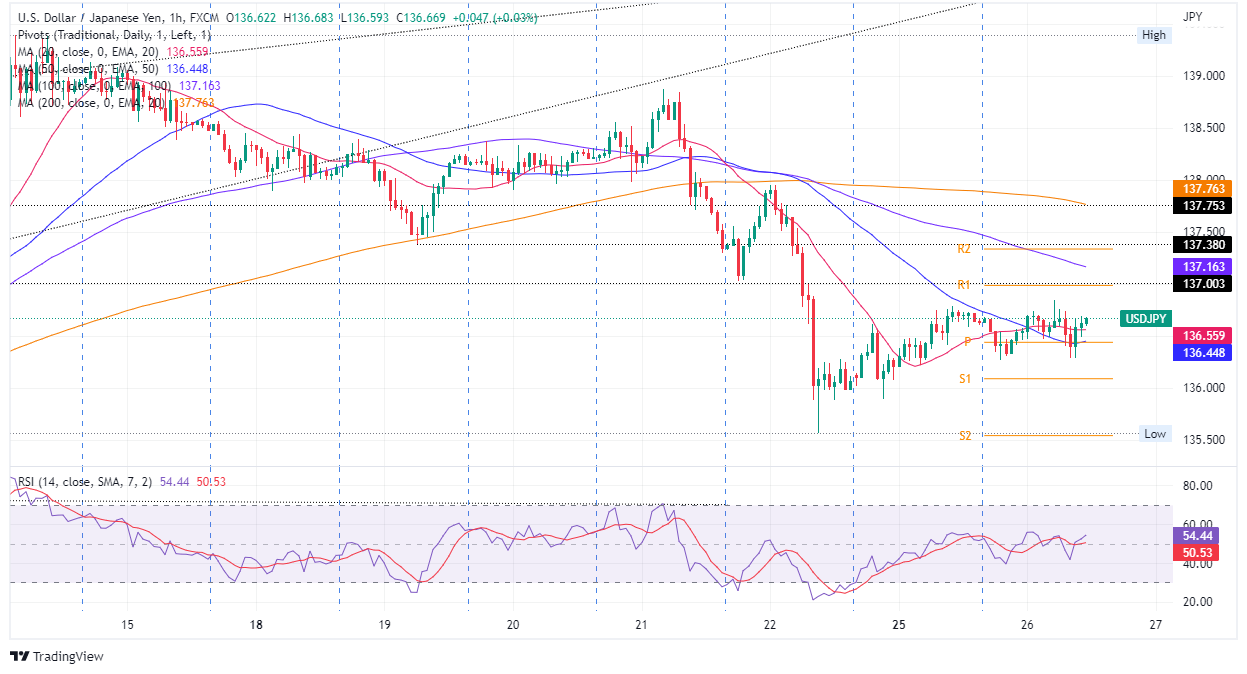
- The USD/JPY is trendless as investors await the Federal Reserve monetary policy decision.
- Sentiment remains downbeat, keeping FX majors in choppy trading ranges.
- USD/JPY Price Analysis: The USD/PY is upward biased, long term, but in the near-term is range-bound.
The USD/JPY is subdued during the North American session as investors brace for the Federal Reserve monetary policy decision, to be revealed on Wednesday, with traders expecting a 75 bps rate hike to the Federal funds rate. On Tuesday, the USD/JPY reached a daily low at 136.27. But the pair edged higher and hit a daily high around 136.84 before settling around 136.64 at the time of writing.
USD/JPY Price Analysis: Technical outlook
From a technical perspective, the USD/JPY in the long term is upward biased. Nevertheless, the sudden drop below the 20-day EMA at 136.85 keep sellers hopeful of driving prices further down towards the rising-wedge target profit at 133.50. On the other hand, if USD/JPY buyers achieve a daily close above 137.00, that would keep them in play for a re-test of the YTD high at 139.38.
USD/JPY 1-hour chart
The USD/JPY hourly chart depicts the major as neutral-to-upward biased. The Relative Strength Index (RSI) is seesawing around the 50-midline, portraying the previously mentioned, as traders prepare for the Fed. If the USD/JPY breaks to the upside, the first resistance would be the R1 daily pivot at 136.98. Break above will expose the 100-hour EMA at 137.16, followed by the R2 pivot point at 137.33. On the flip side, the USD/JPY first support would be the S1 pivot point at 136.08. Once cleared, the USD/JPY could tumble towards the confluence of the July 22 low and the S2 daily pivot at 135.57.
USD/JPY Key Technical Levels
The euro will likely weaken further against the Swiss franc over the next weeks, according to anañysts at TD Securities. They consider the EUR/CHF cross could target 0.95 over the next 1-2 months, while it remains under 0.9890.
Key Quotes:
“Despite the ECB (European Central Bank) delivering a 50bp 'surprise' hike alongside an anti-fragmentation tool, the decision in totality appears to be more of a faux-flex and likely marked peak hawkishness. While adopting a "meeting by meeting" approach to rate decisions might introduce more policy optionality in the curve, it seems the ECB was reluctant to commit to being as aggressive going forward. They also seemed to confirm that more policy aggression now is borrowing from tightening in the future.”
“Data is only going to get worse from here and Germany is likely to be at the heart of it. We believe the EZ is headed for recession in H2 (unlike the ECB), so the capacity for aggressive hikes amid weak growth and an impending energy crisis is constrained. The latter will receive significant focus given shortage concerns.”
“We think the SNB (Swiss National Bank) is willing to allow FX strength to help offset import price inflation. That, alongside a more supportive current account backdrop (unlike the implosion in the EZ) allows the CHF to be used to diversify away from well-populated USD longs. Indeed, we are concerned that the USD may be on a tactical pause.”
Conference Board’s consumer confidence indicators dropped in July for the third consecutive month. According to analysts at Wells Fargo, point out high inflation, rising interest rates and volatile financial markets weighed on consumer confidence.
Key Quotes:
“The third consecutive monthly decline in consumer confidence to 95.7 in July came with somewhat unsettling developments in the details, with the present situation index falling by the most in 12 months and the expectations component hitting its lowest since 2013.”
“As optimism has faltered, so too has consumers' assessment of the labor market. The so-called labor differential, which is the difference in those reporting jobs as “plentiful” less those who report jobs as “hard to get”, slid to its lowest reading in over a year to 37.8%.”
“Most data in the July confidence report moved in the wrong direction. While lower confidence does not always lead spending lower, the recent loss of momentum doesn't bode well for consumption. It's the directional move and rate of change in confidence that is more important than the absolute level, and the overall consumer confidence index is now 12.9 points lower than where it was just three months ago. That sharp move lower may provide an added headwind to spending.”
The US Dollar is likely to remain well bid on the back of safe haven demand despite speculation that the market may have over-estimated the extent of Federal Reserve policy tightening in the coming months, warn analysts at Rabobank. They see the NZD/USD pair moving back to the 0.61 area in the short-term and then moving toward 0.64.
Key Quotes:
“The outlook for the NZD in the coming months is likely to influenced by what the RBNZ may have got right. Since the RBNZ was quick to tighten policy relative to its peers, it may reach peak interest rates ahead of other central banks. This could have negative implications for the NZD vs some of its peers.”
“In addition to higher interest rates, stuttering Chinese growth and New Zealand’s energy import needs are likely to be headwinds to growth. Imports of crude oil have stopped since refining was stopped in the Marsden refinery, and this has shifted demand to more expensive downstream products. In June petroleum and products imports reached a new high.”
“FX volatility has been heightened in recent months and we expect this to continue. We expect the USD to remain well bid on the back of safe haven demand despite speculation that the market may have over-estimated the extent of Fed policy tightening in the coming months. In our view, USD strength is likely to push NZD/USD back towards its recent lows in the 0,61 area on a 1 to 3 month view. We expect USD strength to turn around on a 6 month view allowing NZD/USD to recover to the 0.64 region. We see scope for AUD/NZD to trend higher to 1.12 in the coming months.”
- US Dollar strengthens across the board as FOMC meeting kicks off.
- Risk aversion weighs on the Canadian dollar.
- USD/CAD finds support again at the 1.2815/30 area.
The USD/CAD rebounded sharply after hitting 1.2814, the lowest level in six weeks. It printed a fresh daily high at 1.2888, boosted by a stronger US Dollar across the board.
Dollar wakes up
After falling for three consecutive days, the dollar is up across the board. It woke up the day the FOMC began its two-day meeting, amid a deterioration in market sentiment. The Fed is expected to hike rates by 75bp, as it did in June. “In doing so, the Committee would bring the policy stance to its estimate of neutral. We also look for Chair Powell to retain optionality by leaving the door open to additional 75bp rate increases”, said analysts at TD Securities.
On Wall Street the Dow Jones is falling by 0.66% and the Nasdaq is declining by 1.75%. Crude oil prices are losing more than 0.50% after being unable to hold onto gains. The DXY is up 0.65%, back above 107.00.
Technical outlook
The decline of the USD/CAD found support at 1.2815 and rebounded above 1.2850 like what happened back late in June. A daily close clearly below 1.2845 should open the doors to more losses.
The pair's rebound could point that a short-term bottom is in place. Near 1.2900 is the immediate resistance, followed by the 1.2945/50 area that also contains the 20-day moving average.
Technical levels
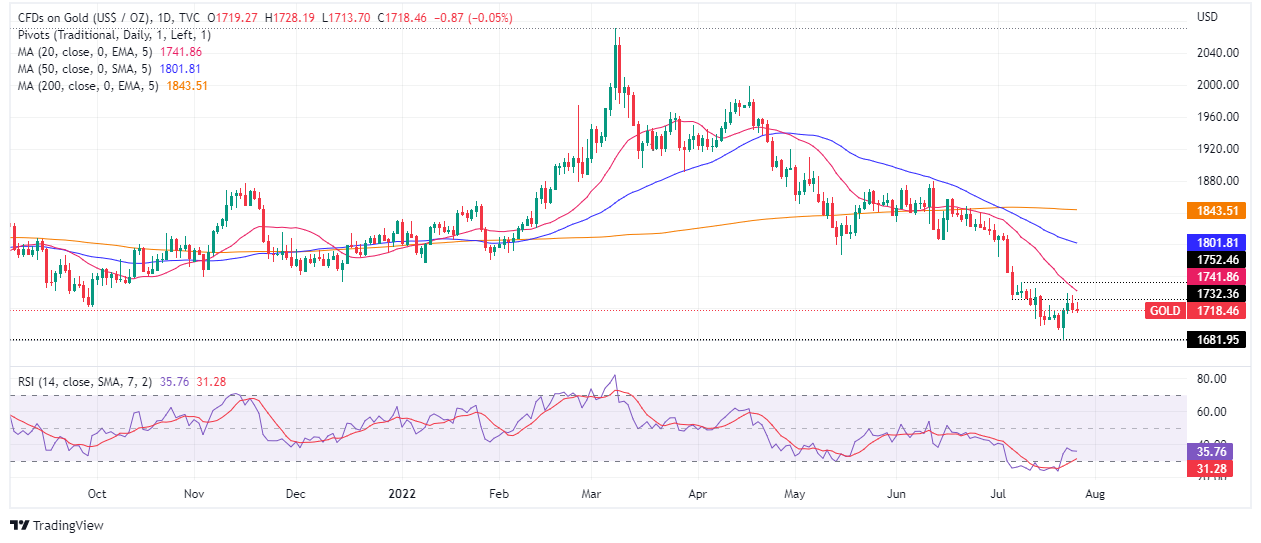
- Gold price remains in choppy trading conditions as investors await Fed’s 75 bps rate hike.
- US corporate earnings weigh on mood as they complain about inflation as the main reason for cutting or missing profits.
- Gold Price Forecast (XAUUSD): Downward biased but will remain sideways ahead of the FOMC meeting.
Gold price turned negative during the day, after hitting a daily high at around $1728, but so far slid amidst downbeat investors’ market mood as they brace for the July FOMC monetary policy meeting. At the time of writing, XAUUSD is trading at $1718.46, down 0.05%.
US companies complain about inflation and a higher US dollar, headwinds for gold
Several factors, like Walmart cutting its profit outlook, blamed on double-digit food prices and elevated energy prices, and the IMF cut its global growth outlook for 2022 and 2023, weighed on sentiment. Also, EU countries agreed to reduce their gas use by 15%, alongside reduced gas flows in the Nord Stream 1 pipeline, adding fuel to the already battered mood. Traders seeking safety propelled the greenback higher. The US Dollar Index, a gauge of the buck’s value vs. a basket of its peers, gains 0.54%, up at 107.060.
Global bond yields followed suit, edged higher, but pared some gains. The US 10-year benchmark note drops three bps and sits at 2.761%. Worth noting that the yield curve inversion between 2s and 10s had further deepened towards -0.253%. However, the US 3-month 10-year yield curve has bear flattened to 0.228%, about to flag recession.
In the meantime, a light US economic calendar ahead of Chair Powell and Co. meeting witnessed the release of the CB Consumer Confidence, which dropped to its lowest level since February 2021. Lyn Franco, senior director of economic indicators at the Conference Board, said American “Concerns about inflation -- rising gas and food prices, in particular -- continued to weigh on consumers.” Furthermore, she added, “looking ahead, inflation and additional rate hikes are likely to continue posing strong headwinds for consumer spending and economic growth over the next six months.”
At the same time, the S&P/Case-Shiller Home Price YoY for May missed expectation by 0.5%, while the US House Price Index for May, trailed April’s reading to 18.3%, lower than the 18.9%.
What to watch
On Wednesday, the US economic docket will feature the Durable Good Orders, Retail Inventories, and Pending Home Sales ahead of the FOMC monetary policy decision.
Gold Price Forecast (XAUUSD): Technical outlook
Gold price remains downward biased, despite holding above the $1700 price level. The daily EMAs above the spot price, and buyers failing to reclaim the May 16 low-turned-resistance at $1787.03, would keep the bias intact. Additionally, the Relative Strength Index (RSI) at 35.80 but aiming lower suggest the yellow metal price is skewed to the downside.
Upwards, a break above the 20-day EMA at $1741.87 would open the door for challenging $1750. On the flip side, a break below $1700 would send the precious metal towards $1681.
- EUR/USD loses further ground and approaches 1.0100.
- The greenback reverses the initial decline and surpasses 107.00.
- US CB’s Consumer Confidence came at 95.7 in July.
Sellers quickly returned to the European currency and dragged EUR/USD to fresh multi-session lows in the vicinity of 1.0100 on Tuesday.
EUR/USD offered ahead of FOMC
EUR/USD rapidly abandoned the area around 1.0250 to retreated nearly 15 cents after EU countries decided to reduce the gas consumption in the next winter, all following the decision by Russian giant Gazprom to cap the supply of gas to the old continent to around 20%.
The decision sparked recession fears in the euro area at the time when the IMF cut the growth prospects for 2023 and several major banks now see the region entering recession at some point in Q4.
Absent releases in the euro area, the US Consumer Confidence tracked by the Conference Board eased to 95.7 in July, while New Home Sales contracted 8.1% MoM in June, or .59M units. Earlier in the session, the FHFA’s House Price Index rose 1.4% in May from a month before.
What to look for around EUR
EUR/USD remains under pressure in the pre-FOMC and threatens to revisit the 1.0100 region amidst the sudden resumption of the demand for the greenback.
Renewed market chatter surrounding the likelihood of an economic slowdown in the euro area in the medium term seems to have resurfaced and weigh on the European currency ahead of the upcoming FOMC event on Wednesday.
In the meantime, the price action around the European currency closely follows increasing speculation of a probable recession in the euro area, dollar dynamics, geopolitical concerns, fragmentation worries and the Fed-ECB divergence.
Key events in the euro area this week: Germany GfK Consumer Confidence (Wednesday) – EMU Final Consumer Confidence, Economic Sentiment, Germany Flash Inflation Rate (Thursday) – Germany Unemployment Change, Unemployment Rate, Flash Q2 GDP, EMU Flash Inflation Rate, Advanced Q2 GDP (Friday).
Eminent issues on the back boiler: Continuation of the ECB hiking cycle. Italian elections in late September. Fragmentation risks amidst the ECB’s normalization of monetary conditions. Performance of the economic recovery post-pandemic in the region. Impact of the war in Ukraine on the region’s growth prospects and inflation.
EUR/USD levels to watch
So far, spot is losing 0.84% at 1.0131 and faces initial contention at 1.0116 (weekly low July 26) seconded by 1.0000 (psychological level) and finally 0.9952 (2022 low July 14). On the upside, a breakout of 1.0278 (weekly high July 21) would target 1.0446 (55-day SMA) en route to 1.0615 (weekly high June 27).
“Ukraine and Russia signed two separate agreements in Istanbul to resume grain exports from three Ukrainian ports. However, the agreements were already called into question again just one day after they were signed because of a Russian missile attack on the port of Odessa,” writes Carsten Fritsch, Analyst Energy, Agriculture, Precious Metals at Commerzbank.
Additional Quotes:
“The wheat price on CBOT fell by almost 6% to around 760 US cents per bushel in the September contract, which was the lowest closing level for the most actively traded contract since the beginning of February. The European wheat price on Euronext in Paris (also expiring in September) closed down 7% at just over EUR 325 per ton. The most actively traded contract (December maturity) fell in the meantime to a 5-month low of just over EUR 310 per ton.”
“The agreement was called into question just one day after it was signed because of a Russian missile attack on the port of Odessa. Russia had committed itself in the agreement not to attack the ships and the ports. Accordingly, wheat prices rose again at the beginning of the week. This shows how fragile the hope is that there will be a quick and smooth resumption of grain exports from Ukraine. This is necessary for wheat prices to fall sustainably.”
Analysts at TD Securities (TDS) offered a brief preview of this week's key central bank event risk - the highly anticipated FOMC monetary policy decision on Wednesday.
Key Quotes:
“With markets pricing in 78bp of hikes in July, investors will focus on what the Fed does after reaching neutral. The potential for more hikes given a sticky inflation backdrop is likely to put upward pressure on front end rates and flattening pressure on the curve. We remain long 2y TIPS BEs and long 30y real rates to position for still high near-term inflation and great fears of recession.”
“A heavy US-centric week with the Fed decision and top-tier data releases including ECI, core PCE, and real GDP. We think FX markets are waiting to see how these event risks unfold to establish a directional view on the broad USD. We do not get the sense that this meeting carries a great deal of weight despite our expectation for a 75bp hike. And, with markets about 50/50 priced for a 75bp hike in September, we think focus will be placed on the activity data between now and then.”
- AUD/USD retreated from over a one-month high amid the emergence of fresh USD buying.
- The risk-off mood benefitted the safe-haven buck and weighed on the risk-sensitive aussie.
- Traders now eye US consumer confidence data for some impetus ahead of Australian CPI.
The AUD/USD pair is seen retreating further from over a one-month high, around the 0.6980-0.6985 region touched this Tuesday. The emergence of fresh US dollar buying turned out to be a key factor exerting downward pressure and dragged spot prices back closer to the 0.6900 mark during the early North American session.
The market sentiment remains fragile amid growing worries about a possible global recession. This, along with the pre-Fed nervousness, tempered investors' appetite for perceived riskier assets. This was evident from a weaker tone around the equity markets, which boosted demand for the safe-haven US dollar and weighed on the risk-sensitive aussie.
The global flight to safety, meanwhile, triggered a steep intraday slide in the US Treasury bond yields, which might cap the USD and lend support to the AUD/USD pair. Investors might also prefer to wait on the sidelines ahead of this week's heavyweight US macro data and the highly anticipated FOMC monetary policy decision on Wednesday.
A rather busy week in terms of important US economic releases kick starts with the Conference Board's Consumer Confidence Index on Tuesday. The focus, however, would remain on the outcome of a two-day FOMC policy meeting. The Fed is expected to hike interest rates by another 75 bps and leave the door open for further policy tightening.
Heading into the key central bank event risk, traders would take cues from the quarterly consumer inflation figures from Australia, scheduled during the Asian session on Wednesday. This week's US economic docket also highlights the release of Durable Goods Orders on Wednesday and the Advance Q2 GDP report on Thursday.
This, along with the US Personal Consumption Expenditures (PCE report) - the Fed's preferred inflation gauge - due on Friday will influence the USD and provide a fresh impetus to the AUD/USD pair. In the meantime, traders might refrain from placing aggressive bets, warranting caution before confirming that the recent move up has run out of steam.
Technical levels to watch
- EUR/USD quickly breaches the 1.0200 region to multi-day lows.
- The continuation of the decline could expose another test of parity.
EUR/USD breaks below the prevailing consolidation and threatens to revisit the 1.0100 zone on Tuesday.
If the pair breaches the 1.0100 region, then the next support of note is seen at the parity level, which is expected to hold the downside ahead of a potential drop to the 2022 low at 0.9952 (July 14).
In the meantime, the pair is expected to remain under downside pressure while below the 5-month support line around 1.0490.
In the longer run, the pair’s bearish view is expected to prevail as long as it trades below the 200-day SMA at 1.0984.
EUR/USD daily chart
- GBP/USD witnessed a dramatic intraday turnaround from a three-week high touched on Tuesday.
- The risk-off mood, recession fears revived demand for the safe-haven USD and exerted pressure.
- The UK political drama undermined the British pound and contributed to the intraday pullback.
The GBP/USD pair is seen extending its intraday retracement slide from a three-week top touched earlier this Tuesday and continued losing ground through the mid-European session. The downward trajectory dragged spot prices to a fresh daily low, around the 1.1970-1.1965 region in the last hour.
Investors remain concerned about a possible global recession, which was evident from a generally weaker tone around the equity markets. This assisted the safe-haven US dollar to stage a goodish rebound from the vicinity of a multi-week low touched the previous day, which, in turn, exerted downward pressure on the GBP/USD pair.
Furthermore, UK politics was seen as another factor that added to negative sentiment surrounding the British pound and further contributed to the pair's intraday turnaround. The combination of factors, to a larger extent, overshadowed the prospects for a 50 bps rate hike move by the Bank of England at the upcoming meeting in August.
The global flight to safety, meanwhile, triggered a fresh leg down in the US Treasury bond yields, which might cap gains for the USD and offer some support to the GBP/USD pair. Traders might also refrain from placing aggressive bets ahead of the highly-anticipated FOMC policy decision on Wednesday and heavyweight US macro data.
A rather busy week in terms of important US economic releases kick starts with the Conference Board's Consumer Confidence Index on Tuesday. The focus, however, would remain on the outcome of a two-day FOMC meeting. The Fed is expected to hike interest rates by another 75 bps and leave the door open for further policy tightening.
This week's US economic docket also features the release of Durable Goods Orders on Wednesday and the Advance Q2 GDP report on Thursday. Apart from this, the Personal Consumption Expenditures (PCE report) - the Fed's preferred inflation gauge - due on Friday will influence the USD and provide a fresh impetus to the GBP/USD pair.
Technical levels to watch
“DXY is up for the first time after three straight down days and trading back above 107. We are not yet ready to change our strong dollar call. However, we expect a period of consolidation ahead for the dollar until the U.S. economic outlook becomes clearer,” explains Win Thin, Global Head of Currency Strategy at BBH.
Additional Quotes:
“The two-day FOMC starts today and the Fed is widely expected to hike rates 75 bp to 2.50%. WIRP suggests only around 15% odds of a 100 bp move. With recent weakness in the data, there is simply no need to go bigger this week. Updated macro forecasts and Dot Plots won’t come until the September meeting.
Another 75 bp hike September 21 is about 50% priced in.”
“A 25 bp hike is fully priced in for November 2 but after that, one last 25 bp hike is only partially priced in. The swaps market paints a similar picture, with 175 of tightening priced in over the next 6 months that would see the policy rate peak near 3.5%. After that, an easing cycle is priced in for the subsequent 6 months.”
- DXY reverses three daily pullbacks in a row and regains 107.00.
- There are no resistance levels of note until the 2022 top past 109.00.
DXY picks up extra pace and advances to 2-day highs north of the 109.00 yardstick on Tuesday.
There seems to be strong contention in the 106.00 neighbourhood for the time being, while the next barrier on the upside is not seen before the YTD high near 109.40 (July 14). In case sellers push harder, the index carries the potential to drop further and retest the post-FOMC peak at 105.78 (June 15).
Despite the ongoing downside, the near-term outlook for DXY is seen constructive while above the 5-month support line near 103.70.
In addition, the broader bullish view remains in place while above the 200-day SMA at 99.25.
DXY daily chart
- EUR/JPY resumes the selling bias and breaks below 139.00.
- A deeper decline should face the 100-day SMA near 137.30.
EUR/JPY quickly fades Monday’s advance and regains downside momentum well below the 139.00 mark on Tuesday.
Further losses remain in store for the cross while below the 4-month resistance line near 141.70. Against that, the next temporary support comes at the 100-day SMA at 137.34 ahead of the July low at 136.85 (July 8).
In the longer run, the constructive stance in the cross remains well underpinned by the 200-day SMA at 133.59.
EUR/JPY daily chart
The shared currency, so far, hasn't reacted to growing market concerns about gas supply and rising gas prices, explains Kit Juckes, Macro Strategist at Societe Generale.
Key Quotes:
“Gazprom announced yesterday the flow through Nord Stream 1 will be cut to 20% of capacity in the next day or two, for an indeterminate time. Prices at the Netherland virtual trading point have risen to EUR 182/MWh, close to post-March highs. The euro hasn't over-reacted to this news, however. Maybe that reflects a willingness to wait and see how temporary the supply reduction will be, though the uncertainty about supplies in the months ahead will hurt growth because Europe's leaders will need to curb demand regardless of what transpires. Maybe also, euro shorts are finally big enough, after another increase last week, to cushion the currency.”
Analysts at TD Securities offer a brief preview of the Australian quarterly consumer inflation data, due for release during the Asian session on Wednesday.
Key Quotes:
“We expect outsized headline/ underlying CPI prints vs consensus. The magnitude of the increases for the main drivers of Australia CPI inflation are: 1) Housing 3.2% q/q; 2) Food 2.25% q/q; 3) Transport 2.3% q/q; 4) Household Services 1.65% q/q & 5) Recreation 1.2% q/q. Our headline forecast implies the peak is likely to exceed the RBA's 7% year-end target warranting at least a 50bps Aug policy rate hike. We see upside risks to our forecast.”
- Gold price struggles to preserve its modest intraday gains amid the emergence of some USD buying.
- The prospects for a more aggressive major central banks also acted as a headwind for the metal.
- The downside seems limited ahead of this week’s key US macro releases and the FOMC decision.
Gold price attracted some selling near the $1,728 region on Tuesday and retreated to the lower end of its daily range during the first half of the European session. The XAUUSD was last seen trading just below the $1,720 level, nearly unchanged for the day.
The US dollar staged a goodish rebound from the vicinity of its lowest level since July 5 touched the previous day, which, in turn, acted as a headwind for the dollar-denominated gold. This, along with the prospects for a more aggressive move by major central banks to curb soaring inflation, was seen as another factor weighing on the non-yielding yellow metal.
That said, growing fears about a possible global recession continue weighing on investors' sentiment and offer some support to the safe-haven gold. The flight to safety is triggering a fresh leg down in the US Treasury bond yields, which could keep a lid on any meaningful gains for the greenback and help limit losses for the precious metal, at least for the time being.
Investors might also be reluctant to place aggressive bets ahead of the heavyweight US macro data and the key central bank event risk. A rather busy week kicks off with the release of the Conference Board's US Consumer Confidence Index on Tuesday. The focus, however, will remain on the outcome of a two-day FOMC meeting, scheduled to be announced on Wednesday.
The US central bank is widely expected to hike interest rates by 75 bps and leave the door open for further hikes. The outlook, along with Fed Chair Jerome Powell's remarks, will influence the USD price dynamics. This week's US economic docket also highlights the release of Durable Goods Orders data on Wednesday and the Advance Q2 GDP report on Thursday.
Apart from this, traders will take cues from the US Personal Consumption Expenditures (PCE report) - the Fed's preferred inflation gauge - scheduled for release on Friday. This, in turn, will play a key role in driving gold price in the near term and help investors to determine the next leg of a directional move.
Technical levels to watch
Citing people familiar with the matter, Reuters reports that the European Union (EU) member countries have reached an agreement on regulation for emergency gas cuts this winter.
The deal on the regulation is likely to affect the proposal, which urges the EU countries to cut gas use by 15% from August through to March next year.
According to Reuters, the deal is a weakened emergency proposal to curb their gas demand, with opt-outs allowing them to follow different national paths to prepare for Russian supply cuts.
Market reaction
EUR/USD is losing 0.82% on the day, currently trading at 1.1056.
Analysts at Australia and New Zealand (ANZ) banking group “expect the Fed to hike by 75bp at its meeting this week.”
Also read: Fed Preview: Dollar’s fate hinges on Powell’s policy guidance
Key quotes
“Chair Powell is likely to be less sanguine about the growth outlook compared to the June meeting, but this won’t change the Fed’s resolve to take the policy rate to restrictive settings by the end of 2022 to limit inflation.”
“Housing data continue to roll over as rising mortgage rates, high raw material costs and labor shortages take their toll.”
“The slowdown in activity appears to be broadening with the Composite PMI index falling below 50 in July amid surprising weakness in the services sector.”
“And a negative 2Q GDP print this week will likely fuel recession talk even further given it would be the second straight quarter of negative growth.”
German Foreign Minister Annalena Baerbock responds to the reduced gas flow from Russia and the coordinated effort by the EU members to ward off the crisis.
Key quotes
"We will not be divided because gas is scarce, instead we stand together, and that is the most important signal to the Russian president."
“Nuclear power is not an answer to the question of gas security in Germany.”
Market reaction
At the time of writing, EUR/USD is losing 0.39% on the day to trade at 1.1078. Recession fears dominate the European markets amid the worsening gas crisis in the old continent.
“Euro area growth is expected to be hit further by Russian gas worries, with the biggest contractions expected in Germany and Italy,” Credit Suisse economists noted, adding that they think gas rationing may still be avoided.
Key quotes
"We expect the sharpest contractions in Germany and Italy – i.e. countries with large manufacturing sectors that are highly reliant on Russian gas, and in the case of Italy, also due to domestic political stress.”
"And in any case – even if rationing is avoided – the surge in gas prices driven by supply uncertainty will depress activity further.”
“Expect two 50 bps rate hikes in September and October, followed by increases of 25bps in December and February.”
"We expect the ECB to stay hawkish in the near term due to high inflation, but reach the end of the hiking cycle sooner than previously expected.”
Analysts at Australia and New Zealand (ANZ) banking group offer their afterthoughts on the South Korean Q2 Preliminary GDP release.
Key quotes
“South Korea’s preliminary Q2 GDP showed a pick-up in economic growth, as a rebound in private consumption and government spending offset the decline in exports and private investment.”
“Looking ahead, weak export prospects, high domestic inflation and rising interest rates all point to intensifying headwinds.”
“But until there are clear signs that inflation is on a sustainable downtrend back towards the Bank of Korea’s 2% target, further rate hikes are on the cards, in our view.”
Philip Marey, Senior US Strategist at Rabobank offered a brief overview of the upcoming FOMC monetary policy decision on Wednesday. The US central bank is all but set to hike interest rates by 75 bps and keep the door open for further policy tightening.
Key Quotes:
“The FOMC will start its two-day meeting that will lead to tomorrow’s rate decision, formal statement and press conference by Fed Chair Powell. We expect the FOMC to raise the target range for the federal funds rate by 75 bps to 2.25-2.50%. Meanwhile, the balance sheet reduction schedule is expected to remain unchanged. There will be no update of economic projections, so we only have the formal statement and Powell’s press conference to look forward to.”
“While FOMC speakers have pushed against a 100 bps rate hike this month, Powell may shed more light on the rate path beyond July, especially in relation to the stronger-than-expected CPI print on July 13. With headline inflation rising to 9.1% in June from 8.6% in May, against a Bloomberg consensus expectation of 8.8%, markets initially increased their speculations on a 100 bps hike in July. However, although the FOMC may not be ready to take a 100 bps hike, they may want to take a few more big rate steps in the remainder of the year.”
- GBP/USD returns to the red as the US dollar sees resurgent demand.
- Lack of UK political news and risk-off flows weigh on cable.
- The pair recaptures 21 DMA but RSI still remains bearish.
GBP/USD is extending its pullback from three-week highs of 1.2091 in the European session, as risk-off flows dominate amid the worsening European gas crisis and an imminent recession in Germany.
Investors seek refuge in the traditional safe-haven asset, the US dollar, as the buck picks up fresh bids to recapture 106.50 against its major peers. The ongoing sell-off in the US Treasury yields fail to deter the dollar bulls. The greenback also finds demand, as investors turn cautious ahead of the Fed’s expected 75 bps rate hike announcement.
Meanwhile, various factors continue to limit the bullish attempts in the pound. A lack of any encouraging on the UK political front, with candidates Liz Truss and Rishi Sunak battling out the leadership race. Ahead of next week’s BOE rate decision, money markets suggest a bold 50 bps than a conservative 25 bps increase. However, economists are much less certain, with 25 out of 54 polled by Reuters expecting a half-point hike, according to the latest Reuters poll.
Friday’s CFTC data showed IMM speculators reduced their GBP exposure by 10% in the fortnight to July 19, with gross GBP longs cut by 7,675 contracts to 33,850, per Reuters. The pair now awaits the US Durable Goods Orders and New Home Sales data. The main event risk for this week, however, remains the FOMC decision due on Wednesday.
Looking at the cable’s daily chart, the pair closed Monday above the bearish 21-Daily Moving Average (DMA), then at 1.2006.
Although with the 14-day Relative Strength Index (RSI) lurking below the midline, sellers have returned and look to retest the 21 DMA resistance turned support, now at 1.1997.
A sustained break below the latter will expose Monday’s low of 1.1960, below which a test of the 1.1900 level will be inevitable.
On the flip side, if bulls manage to defend the 21 DMA, then a fresh advance towards the descending 50 DMA at 1.2238 cannot be ruled out.
GBP/USD: Daily chart
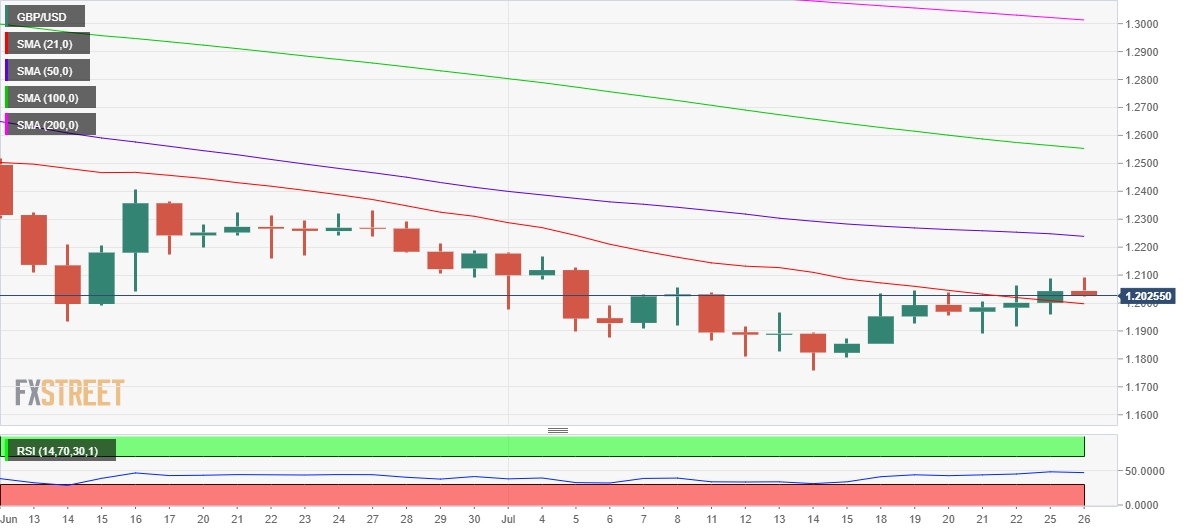
GBP/USD: Additional technical levels
- EUR/USD alternates gains with losses above 1.0200.
- Investors look cautious ahead of key US data and the Fed event.
- US Conference Board’s Consumer Confidence takes centre stage later.
EUR/USD exchanges ups and downs above the 1.0200 mark on Tuesday amidst the broad-based consolidative mood in the global markets.
EUR/USD focused on the US calendar
EUR/USD gyrates in the low-1.0200s as a clear direction in the markets remains absent in the first half of the week, while cautiousness remains on the rise among market participants in light of the upcoming Fed event.
In the meantime, threats of further deterioration of the energy scenario, particularly regarding the supply of Russian gas to Germany (via the Nord Stream 1 pipeline), keeps undermining the growth outlook in the country and the region as a whole and could eventually be a source of extra weakness for the single currency in the upcoming months.
On the political side, the euro is predicted to face further headwinds, as the far-right party Fratelli d’Italia (Brothers of Italy) keeps leading the race to the general elections in Italy on September 25.
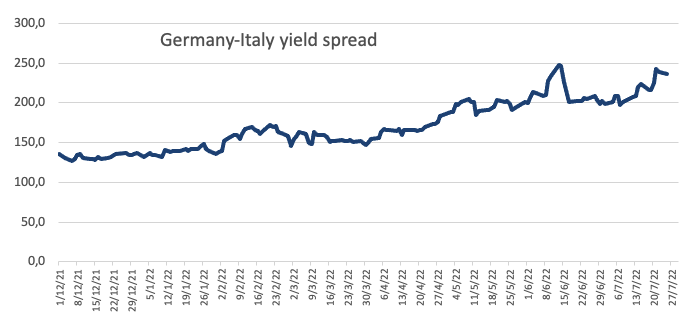
Nothing scheduled data wise in the Euroland on Tuesday leaves all the attention to publications across the pond: the US Consumer Confidence gauged by the Conference Board, the House Price Index tracked by the FHFA and New Home Sales.
What to look for around EUR
EUR/USD remains within the pre-FOMC consolidative phase above the 1.0200 region, broadly in line with the generalized side-lined mood in the rest of the global assets.
The pair extends its range bound stance, as market participants continue to gauge the latest ECB announcements and appear cautious ahead of the upcoming FOMC event on Wednesday.
In the meantime, the price action around the European currency closely follows increasing speculation of a probable recession in the euro area, dollar dynamics, geopolitical concerns, fragmentation worries and the Fed-ECB divergence.
Key events in the euro area this week: Germany GfK Consumer Confidence (Wednesday) – EMU Final Consumer Confidence, Economic Sentiment, Germany Flash Inflation Rate (Thursday) – Germany Unemployment Change, Unemployment Rate, Flash Q2 GDP, EMU Flash Inflation Rate, Advanced Q2 GDP (Friday).
Eminent issues on the back boiler: Continuation of the ECB hiking cycle. Italian elections in late September. Fragmentation risks amidst the ECB’s normalization of monetary conditions. Performance of the economic recovery post-pandemic in the region. Impact of the war in Ukraine on the region’s growth prospects and inflation.
EUR/USD levels to watch
So far, spot is losing 0.12% at 1.0206 and faces initial contention at 1.0129 (low July 22) seconded by 0.9952 (2022 low July 14) and finally 0.9859 (low December 2002). On the upside, a breakout of 1.0278 (weekly high July 21) would target 1.0446 (55-day SMA) en route to 1.0615 (weekly high June 27).
Analysts at TD Securities (TDS) offer their outlook on the EM currencies and the main underlying theme impacting them this week.
Key quotes
“The trend remains for richer G-spread curves across the EM SSA spectrum. Both Asian and Latin American names exhibit a clear tendency in this direction, while this is less obvious in EMEA.”
“Spread cheapness is the starkest on the TRY curve, but this is mostly symptomatic of a distress situation with locals buying govies and not exploiting the cheapness of TRY-denominated SSAs.”
“In BRL and MXN, spreads continue to fall, and so they do in CNH and ZAR. In IDR and INR, spreads are roughly stable but at rich levels, with part of the curve flirting with or below the zero bound.”
“Finally, PLN saw sharp cheapening in G-spreads, but from very rich levels recently.”
Spain's Energy Minister Teresa Ribera said in a statement that she expects the European Union (EU) member countries to reach an agreement on natural gas during Tuesday's meeting.
She added that she hopes the EU will agree on a goal to cut gas consumption by less than 15% through the winter if Russia halts deliveries.
Energy ministers from the bloc’s 27 member states are meeting in Brussels on Tuesday to debate over backing a proposal from the European Commission.
Related reads
- EU Energy Policy Chief: No technical reason for Russia to further cut Nord Stream flows
- EUR/USD Analysis: Traders seem non-committal, await this week's key central bank event/data risks
- The index extends the range bound theme in the mid-106.00s.
- US yields also appear side-lined ahead of he upcoming Fed event.
- Consumer Confidence, housing data next on tap in the US docket.
The greenback, in term of the US Dollar Index (DXY), extends its consolidative mood around the 106.50 region on turnaround Tuesday.
US Dollar Index now looks to data ahead of FOMC
The index sheds ground for the fourth consecutive session so far on Tuesday, although it appears well supported by the 106.00 neighbourhood amidst prevailing cautiousness ahead of the key FOMC gathering on Wednesday.
Indeed, the Federal Reserve will start its 2-day meeting on Tuesday and is expected to announce a 75 bps interest rate hike on Wednesday. The probability of such outcome is now nearly 73% according to CME Group’s FedWatch Tool.
In the meantime, the dollar appears within a consolidative phase ahead of the release of the always relevant Consumer Confidence tracked by the Conference Board, New Home Sales and the FHFA’s House Price Index.
What to look for around USD
The index came under downside pressure following nearly 20-year highs north of the 109.00 mark in mid-July, although it seems to have met some decent support near 106.00 for the time being.
So far, the dollar remains underpinned by the Fed’s divergence vs. most of its G10 peers (especially the ECB) in combination with bouts of geopolitical effervescence and the re-emergence of the risk aversion among investors.
On the flip side, market chatter of a potential US recession could temporarily undermine the uptrend trajectory of the dollar somewhat.
Key events in the US this week: House Price Index, CB Consumer Confidence, New Home Sales (Tuesday) – MBA. Mortgage Applications, Durable Goods Orders, Advanced Goods Trade Balance, Pending Home Sales, Fed Interest Rate Decision, Powell Press Conference (Wednesday) – Flash Q2 GDP, Initial Claims (Thursday) – PCE Price Index, Personal Income, Personal Spending, Final Michigan Consumer Sentiment (Friday).
Eminent issues on the back boiler: Hard/soft/softish? landing of the US economy. Escalating geopolitical effervescence vs. Russia and China. Fed’s more aggressive rate path this year and 2023. US-China trade conflict. Future of Biden’s Build Back Better plan.
US Dollar Index relevant levels
Now, the index is down 0.09% at 106.39 and faces initial support at 106.11 (weekly low July 22) followed by 103.67 (weekly low June 27) and finally 103.41 (weekly low June 16). On the other hand, a break above 109.29 (2022 high July 15) would expose 109.77 (monthly high September 2002) and then 110.00 (round level).
FX option expiries for July 26 NY cut at 10:00 Eastern Time, via DTCC, can be found below.
- EUR/USD: EUR amounts
- 1.1000 487m
- 1.0125 386m
- 1.0200 763m
- 1.0225 325m
- 1.0265 976m
- 1.0300 402m
- GBP/USD: GBP amounts
- 1.1900 368m
- 1.1950 392m
- 1.2000 626m
- 1.2200 361m
- USD/JPY: USD amounts
- 134.45 400m
- 139.00 970m
- USD/CHF: USD amounts
- 0.9530 300m
- AUD/USD: AUD amounts
- 0.7150 456m
- USD/CAD: USD amounts
- 1.2750 700m
- 1.2800 425m
- 1.2900 767m
- 1.3000 475m
- NZD/USD: NZD amounts
- 0.6100 489m
- 0.6500 335m
- EUR/GBP: EUR amounts
- 0.8700 327m
- Silver edged higher on Tuesday and recovered a part of the previous day’s decline.
- The set-up still favours bearish traders and supports prospects for further losses.
- Sustained strength beyond the $19.50 is needed to negate the bearish outlook.
Silver gained some positive traction on Tuesday and for now, seems to have snapped a two-day losing streak. The white metal held on to the modest intraday gains through the early European session and was last seen hovering near the daily high, around mid-$18.00s.
Looking at the broader picture, the XAG/USD has been oscillating in a familiar range over the past one-and-a-half week or so. Given the recent fall from mid-$22.00s or the June monthly high, the rangebound price moves could be categorized as a bearish consolidation phase.
Adding to this, repeated failures near the $19.00 round figure suggest that the near-term selling bias might still be far from being over. Furthermore, oscillators on the daily chart are holding deep in the bearish territory and add credence to the negative outlook.
Hence, any subsequent move up might still be seen as a selling opportunity near the $19.00 mark. Some follow-through buying has the potential to lift the XAG/USD further, though the momentum is likely to remain capped near the $19.40-$19.50 heavy supply zone.
On the flip side, the YTD low, around the $18.20-$18.15 region, is likely to protect the immediate downside ahead of the $18.00 mark. A convincing break below would be seen as a fresh trigger for bearish traders and set the stage for a further depreciating move.
The XAG/USD could then accelerate the downfall towards the $17.45-$17.40 intermediate support en-route to the $17.00 mark. The bearish trend could get extended and spot prices could eventually drop to test the next relevant support near the $16.70-$16.60 region.
Silver 4-hour chart
-637944161213895389.png)
Key levels to watch
- An establishment above 38.2% Fibo retracement and 200-EMA bolsters a bullish reversal structure.
- The RSI (14) has shifted into a bullish range of 60.00-80.00 which indicates a sheer upside momentum.
- A bull cross, represented by 20-and 200 EMAs adds to the upside filters.
The AUD/USD pair is oscillating in a narrow range of 0.6955-0.6966 in the early London session after a downside move from an intraday high near 0.6980. The asset has witnessed a steep fall after failing to sustain above Friday’s high at 0.6977. However, the upside trend has not turned down yet.
On a four-hour scale, the asset has comfortably established above the 38.2% Fibonacci retracement (which is placed from June 3 high at 0.7283 to July 14 low at 0.6680) at 0.6920. The major has failed to kiss the 50% Fibo retracement for the second time, which is placed at 0.6984.
Also, an establishment above the 200-period Exponential Moving Average (EMA) at 0.6900, adds to the upside filters. A bull cross, represented by the 20-and 200-EMAs at 0.6903 indicates more gains ahead.
Adding to that, the Relative Strength Index (RSI) (14) has shifted into the bullish range of 60.00-80.00, which indicates the continuation of a bullish momentum ahead.
Should the asset oversteps Monday’s high at 0.6965, aussie bulls will drive the asset towards the psychological resistance at 0.7000. A breach of the latter will infuse fresh blood and the asset may record a high of June 16 high at 0.7069.
On the flip side, a steep fall below the round-level support of 0.6800 will strengthen the greenback bulls. This may decline the pair towards July 13 low at 0.6724, followed by July 14 low at 0.6680.
AUD/USD four-hour chart
-637944155895759315.png)
- USD/RUB remains pressured around intraday low, reverses the week-start rebound.
- EU’s Energy Chief Simson highlights the need to be ready for supply cuts from Russia at any moment.
- US dollar prints four-day downtrend as traders brace for FOMC.
- US Consumer Confidence, recession talks can direct intraday moves.
USD/RUB reverses the week-start gains around 57.80, down 1.15% intraday heading into Tuesday’s European session. In doing so, the Russia ruble (RUB) pair cheers the downbeat US dollar, as well as firmer oil prices of late.
That said, the US Dollar Index (DXY) prints a four-day downtrend, paring intraday losses around 106.40 by the press time. It’s worth noting that a rebound in the US 10-year Treasury yields, down 2.8 basis points near 2.79%, appears to favor the US dollar in consolidating the recent losses.
Behind the US dollar’s recent weakness could be the recently downbeat US PMIs and the second-tier activity data, as well as fears of the US recession. Recently, the global rating giant Moody’s downgraded growth forecasts for Eurozone and the US. Additionally, the greenback traders’ preparations for Wednesday’s Federal Open Market Committee (FOMC) meeting also keep the DXY pressured.
On the other hand, prices of Russia’s key export item crude oil rose for the second consecutive day, up 2.0% daily while refreshing intraday high around $97.80 by the press time, also weighing on the USD/RUB prices.
The oil prices seem to cheer talks that Russia could cut the Eurozone gas supplies anytime. Recently, European Union (EU) Energy Policy Chief Kadri Simson said, per Reuters, “Expect to have a deal on EU regulation to curb gas demand.” On Monday, Russia’s Gazprom announced that it will slow flows on its Nord Stream 1 pipeline. The company will halt another turbine in the pipeline to Germany, which will reduce the flow to just 20% of capacity (currently at 40%) from July 27.
It should be noted, however, that the risk-off mood challenges the USD/RUB bears ahead of the US CB Consumer Confidence for July, prior 98.7. Additionally important will be the chatters surrounding the global recession and EU energy crisis.
Technical analysis
USD/RUB bulls need successful trading above 68.75 to retake controls. Otherwise, a gradual downside towards the yearly low marked in June, around 50.55, can’t be ruled out.
European Union (EU) Energy Policy Chief Kadri Simson said on Tuesday, there is no technical reason for Russia to further cut Nord Stream 1 gas flows.
Additional quotes
“We have to be ready for supply cuts from Russia at any moment.”
“Expect to have deal on EU regulation to curb gas demand.”
This comes after Russia’s Gazprom announced on Monday it will slow flows on its Nord Stream 1 pipeline. The company will halt another turbine in the pipeline to Germany, which will reduce the flow to just 20% of capacity (currently at 40%) from July 27.
Market reaction
EUR/USD is keeping its range around 1.0220, holding the lower ground on the above comments. The spot is adding 0.05% on the day.
- GBP/JPY fades the week-start recovery as buyers flirt with bullish chart pattern.
- Sustained trading above 50-HMA, firmer RSI teases bulls.
- Successful trading above 165.00 appears necessary to aim for late June’s peak.
GBP/JPY struggles to keep buyers on the table as it retreats to 164.70 heading into Tuesday’s London open. Even so, the weekly inverse head-and-shoulder (H&S) bullish formation joins the quote’s sustained trading above 50-HMA to push back the bears.
However, the cross-currency pair’s upside hinges on the successful break of the stated bullish formation’s neckline, around 165.00.
Following that, the theory suggests a run-up towards late June’s swing high near 167.00 while the monthly peak of 166.25 can act as an intermediate halt.
It’s worth noting that June 22 peak near 167.85 and the yearly high marked in the last month around 168.75 could challenge the GBP/JPY buyers past 167.00.
Alternatively, pullback remains elusive until the quote stays beyond the 50-HMA, around 164.10.
Following that, the recent swing low around 163.00 and the monthly low of 160.40 could lure the GBP/JPY sellers. Also acting as the downside filter is the 160.00 psychological magnet.
Overall, GBP/JPY hints at further upside as it portrays a bullish chart formation.
GBP/JPY: Hourly chart

Trend: Further upside expected
- EUR/GBP is eyeing more weakness if the cross drops below 0.8470.
- Investors have ignored energy issues in Europe as Russia has cut-off energy supply from its main pipeline.
- The downbeat UK Retail Sales have weakened the pound bulls.
The EUR/GBP pair is displaying back and forth moves in a narrow range of 0.8473-0.8480 in the early European session. On a broader note, the cross has remained in the grip of bears after the interest rate hike by the European Central Bank (ECB) for the first time in the past 11 years.
Last week, the ECB surprisingly announced a rate hike by 50 basis points (bps), higher than the consensus of 25 bps. In addition to the policy tightening, the ECB introduced the Transmission protection Instrument (TPI) to support southern European economies.
The announcement of higher interest rates may be fruitful for core European Union (EU) members such as Germany and France due to their stable financial position. However, southern European economies such as Italy, Greece, and Spain that are facing financial instability may face more headwinds due to higher borrowing costs. The ECB will purchase public securities of these countries and also private securities, if required, to support them against unwarranted deterioration in financing conditions.
Meanwhile, investors are ignoring the energy supply issues in Europe as Russia has cut off energy supplies from its main pipeline. No doubt, the European nations have shifted their energy demand to other suppliers but still cater majority of their energy demand from Russia.
On the UK front, lower Retail Sales data have weakened the pound bulls against the shared currency. The economic data landed at -5.8%, lower than the expectations of -5.3% and the prior release of -4.7% on an annual basis. Investors should be aware of the fact that higher price pressures are driving Retail Sales for now. And, a release of lower Retail Sales indicates that the overall demand is extremely weak.
Here is what you need to know on Tuesday, July 26:
Tepid optimism remains the main underlying theme in Tuesday’s trading so far, with the US dollar finding some demand and equity futures losing about 0.30% on the day. Pre-Fed anxiety dominates but the rally in the Chinese tech stocks helped ease off some pressure on the market. Alibaba Group Holding Ltd. led the advance in China tech stocks. The e-commerce giant plans to seek a primary listing in Hong Kong, per Bloomberg.
However, China’s covid concerns are here to stay, as the country’s tech hub, Shenzhen ordered 100 major companies including iPhone maker Foxconn to set up "closed-loop" systems as it battles the latest covid flare-up. Investors also digested reports that US President Joe Biden and his Chinese counterpart Xi Jinping will speak over a call later this week.
Among other news, Moody’s Investors Service lowered its GDP growth forecasts for the US and Europe for 2022 as well as 2023. The Bank of Japan (BOJ) June meeting minutes revealed that the board saw price rises broadening and agreed economic uncertainty was 'extremely high'.
Risk sentiment also remains in a weaker spot, as recession now appears inevitable with the worsening European gas crisis. Russia’s Gazprom announced on Monday it will slow flows on its Nord Stream 1 pipeline. The company will halt another turbine in the pipeline to Germany, which will reduce the flow to just 20% of capacity (currently at 40%) from July 27.
EUR/USD is trading sideways around 1.0220, having failed to find acceptance once again above 1.0250. The euro remains vulnerable amid a disappointing German IFO Business Survey and intensifying tensions over the Russian gas deliveries to Germany.
GBP/USD is retreating from a new three-week high of 1.2091, in absence of any encouraging news from the UK political scenario. USD/JPY is staging a solid comeback, recapturing 136.50 despite the unimpressive BOJ minutes and the renewed downtick in the US Treasury yields. US CB Consumer Confidence is next of note.
Gold is keeping its consolidative mode intact at around $1,720, defending minor bids amid cautious optimism.
Bitcoin remains pressured around the $21,000 mark while Ethereum tests the $1,400 demand area. “Coinbase Global Inc. is facing a US probe into whether it improperly let Americans trade digital assets that should have been registered as securities,” Reuters reports, citing three people familiar with the matter.
CME Group’s preliminary readings for natural gas futures markets noted open interest increased for the second session in a row at the beginning of the week, this time by around 7.2K contracts. On the other hand, volume, shrank for the third straight session, now by around 59.5K contracts.
Natural Gas keeps targeting the YTD high near $9.50
Prices of natural gas have almost fully recovered June’s sharp pullback and already trades at shouting distance from the $9.00 mark per MMBtu. Monday’s uptick was against the backdrop of rising open interest and exposes the likelihood of further gains in the very near term and always with the next target at the 2022 peak around $9.50 (June 8).
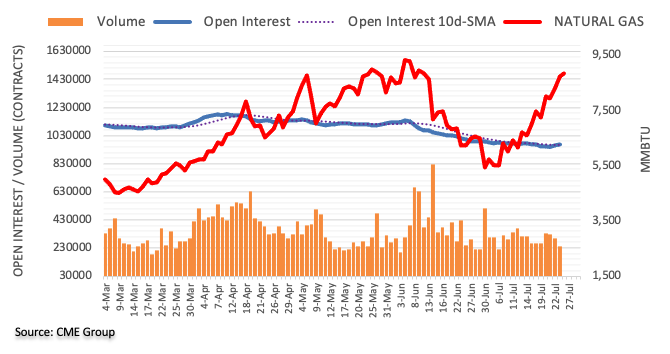
- EUR/USD has been struggling to gain any meaningful traction and remains confined in a range.
- A softer tone surrounding the USD offered support, though recession fears capped the upside.
- Sustained strength beyond the post-ECB high is needed to support prospects for further gains.
The EUR/USD pair extended its sideways consolidative price move on Tuesday and remained confined in a familiar trading band heading into the European session. The pair was last seen hovering around the 1.0220-1.0225 region, nearly unchanged for the day.
The US dollar languished near its lowest level since July 5, which, in turn, was seen as a key factor that offered some support to the EUR/USD pair. That said, recession fears continued weighing on the shared currency and acted as a headwind for spot prices.
From a technical perspective, the EUR/USD pair was seen flirting with the top boundary of a short-term descending channel. This is followed by the post-ECB swing high, around the 1.0275-1.0280 region, which should now act as a key pivotal point for short-term traders.
Sustained strength beyond the said hurdles would set the stage for an extension of the recent recovery move from the 0.9950 region, or the lowest level since December 2002 touched earlier this month. The EUR/USD pair might then aim to surpass the 1.0300 round-figure mark.
The momentum has the potential to lift spot prices towards the 1.0350 horizontal support breakpoint, now turned resistance. The EUR/USD pair could eventually reclaim the 1.0400 round-figure mark, though might struggle to gain any follow-through traction.
On the flip side, the overnight low, around the 1.0180-1.0175 region, now seems to protect the immediate downside ahead of the 1.0130-1.0125 zone and the 1.0100 mark. A convincing break below the latter would suggest that the recent corrective bounce has run out of steam.
The subsequent downfall would make the EUR/USD pair vulnerable and expose the parity mark. The downward trajectory could further get extended and force spot prices to challenge the YTD low, around the 0.9950 region.
EUR/USD daily chart
-637944121457443424.png)
Key levels to watch
- Copper prints three-day uptrend despite recession fears, pre-Fed anxiety.
- Downbeat USD, fears of lesser supplies from China, Peru also underpin recovery moves.
- US Consumer Confidence, slowdown chatters can entertain traders ahead of FOMC.
Copper prices remain on the front foot as markets cheer softer US dollar, as well as chatters surrounding more supply constraints ahead. That said, the red metal’s futures on the COMEX rises for the third consecutive day to $3.41, up 1.55% intraday during early Tuesday morning in Europe.
It’s worth noting that the three-month copper prices on the London Metal Exchange also rise around 1.5% as bulls attack the $7,600 mark. Further, the metal’s most-traded September contract on the Shanghai Futures Exchange (SFE) advanced 2.1% to 58,350 yuan ($8,640.86) a tonne.
That said, the US Dollar Index (DXY) drops for the fourth consecutive day, paring intraday losses around 106.40 by the press time. Recently, a rebound in the US 10-year Treasury yields, down 2.8 basis points near 2.79%, appears to favor the US dollar in consolidating the daily losses. However, softer US data and fears of economic slowdown, recently favored by the global rating giant Moody’s weigh on the US dollar.
Elsewhere, Chinese miner MMG Ltd said on Monday, per Reuters, that it had suspended its copper production targets for the year following a 60% output drop due to a long protest at its Las Bambas mine in Peru, which significantly disrupted operations.
Anticipated declines in the world’s biggest copper producer’s output, namely Peru, also tease the metal buyers amid hopes of a supply crunch.
On the contrary, fears of recession and heavy inventories in China, as well as the dragon nation’s inability to regain economic traction, also keep the copper buyers in check. “China’s economic slowdown is spilling over to major exporting nations in Europe and East Asia through falling demand for manufactured goods, causing Germany and South Korea to post rare deficits with the world’s second-largest economy,” said Bloomberg.
Looking forward, the US CB Consumer Confidence for July, prior 98.7, will precede Wednesday’s Federal Open Market Committee (FOMC) meeting to decorate the calendar. Also important will be the chatters surrounding the recession.
- NZD/USD has slipped to near 0.6260 as investors are trimming longs in risky assets ahead of Fed policy.
- It is highly likely that the Fed will elevate its interest rates to 2.25-2.50%, after a 75 bps rate hike.
- The RBNZ has announced that it will review the policy-tightening performance.
The NZD/USD pair has surrendered its entire gains after re-testing Monday’s high at around 0.6280 in the Asian session. The asset has tumbled to near 0.6260 and is likely to remain subdued as the investing community is turning cautious on expectations of one more interest rate hike by the Federal Reserve (Fed).
It is worth noting that the Fed has already elevated its interest rates by 1.5% in its previous three monetary policy meetings. To combat the inflation monster, policy tightening measures are extremely required and on Wednesday, Fed chair Jerome Powell will announce one more 75 basis points (bps) interest rate hike as expected by the market participants. This will elevate the Fed’s interest rates to 2.25-2.50%.
Apart from the Fed’s interest rate policy, the US Durable Goods Orders also carry significant importance. The economic data is seen plunging to -0.2% from the prior release of 0.8%. A slippage in the aforementioned economic data indicates that the overall demand in the US economy is currently dominated by higher energy and food bills. And, a slippage in the demand for durable goods dictates lower buying interest of the consumers.
On the kiwi front, Reserve Bank of New Zealand (RBNZ) Governor Adrian Orr said on Tuesday that it is undertaking a review of its recent performance in conducting monetary policy, as per Reuters. The central bank will scrutiny the performance of inflation and employment catalysts, which will help them to identify the outcome of the monetary policy decisions.
Considering flash data from CME Group for crude oil futures markets, traders added around 1.4K contracts to their open interest positions on Monday, reaching the fourth consecutive daily build. Volume, instead, extended the downtrend and went down by around 79.4K contracts.
WTI: Initial target comes at $100.00 ahead of $104.00
Prices of the WTI rose for the second session in a row at the beginning of the week amidst the continuation of the uptrend in open interest, which should be supportive of further recovery in the very near term. Immediately to the upside comes the psychological $100.00 hurdle ahead of the weekly top at $104.44 (July 19).
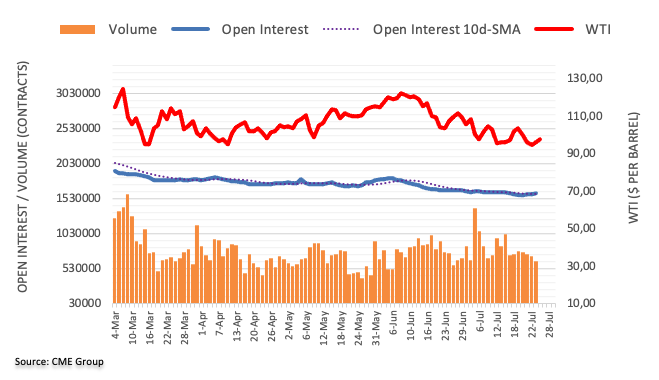
- GBP/USD retreats from monthly high during the four-day uptrend.
- Sustained trading beyond 21-DMA, weekly support line keeps buyers hopeful.
- Downward sloping resistance line from mid-April lures buyers.
GBP/USD pares intraday losses as bulls take a breather around the monthly peak heading into Tuesday’s London open. Even so, the Cable pair prints four-day uptrend while staying inside a 2.5-month-old bearish channel formation, recently easing to 1.2065.
Despite the pair’s latest pullback, it keeps the previous day’s upside break of the 21-DMA surrounding the 1.2000 threshold. Also keeping the GBP/USD buyers hopeful are the bullish MACD signals.
That said, the quote’s further advances aim for the stated channel’s upper line, near 1.2125 at the latest, appears a tough nut to crack for the GBP/USD bulls. Also acting as the key resistance is the 50-DMA hurdle of 1.2240.
Meanwhile, pullback moves may initially aim for the 21-DMA level near 1.2000. However, the sellers remain off the table until the quote stays beyond an upward sloping support line from July 14, at 1.1970 by the press time.
In a case where the GBP/USD prices drop below 1.1970, the odds of witnessing further downside towards the monthly low near 1.1760 can’t be ruled out.
It’s worth mentioning that the pair’s weakness past 1.1760 will be challenged by the lower line of the aforementioned bearish channel, close to 1.1625.
GBP/USD: Daily chart

Trend: Further upside expected
Japan upgraded its overall view on the economy for the first time in three months in July, signalling a broader recovery in economic activity as the drag from the COVID-19 pandemic continued to fade, reported Reuters as Japan released July economic report.
Key findings
The upgrade was largely because the government turned more positive about consumption and employment amid hopes that strength in consumer activity will help shield the economy from rising risks of slowing global demand.
The government raised its view on private consumption, saying it was gently picking up as it became more optimistic about spending on services such as overnight stays and transportation.
The government raised its view on employment conditions, reporting a rising trend in the number of workers, adding that the number of women who were in regular employment was rising.
However, the government warned that attention should be paid to downside risks from climbing raw material costs and supply constraints, as well as fluctuations in financial and capital markets amid tightening of monetary conditions around the world.
USD/JPY extends corrective pullback
USD/JPY pares intraday losses around 136.50, keeping the mid-Asian rebound, following the news.
Also read: USD/JPY surpasses 135.50 as DXY recovers, Fed’s pre-anxiety hit market mood
According to advanced prints from CME Group for gold futures markets, open interest retreated for the third session in a row, this time by around 5.7K contracts. Volume followed suit and shrank by nearly 40K contracts.
Gold: Gains remain capped by $1,740/50
Monday’s pullback in gold prices was amidst shrinking open interest and volume, hinting at the probability of further gains in the very near term. While price action in bullion appears consolidative, it could attempt a move higher to the $1,740 region per ounce troy in the short-term horizon.
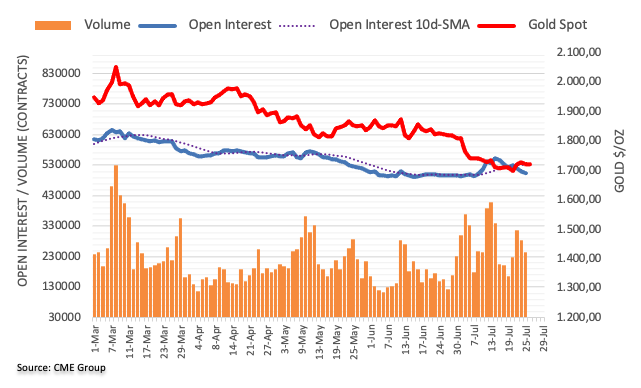
- Gold price has extended its corrective move to near $1,720.00 ahead of Fed policy.
- The resurgence of recession fears will keep the DXY on the back foot broadly.
- A symmetrical triangle formation is indicating a consolidation ahead.
Gold price (XAU/USD) has shifted into a corrective phase after facing barricades at around $1,728.00 in the Asian session. The precious metal has surrendered the majority of its gains and is likely to remain lackluster as investors are getting anxious ahead of the monetary policy announcement by the Federal Reserve (Fed). The bright metal may display more losses if it drops below Monday’s low at $1,714.80.
A rate hike by the Fed with 75 basis points (bps) looks imminent as price pressures have climbed to 9.1% and are hurting the paychecks of the households badly. This time, the gold prices won’t find significant offers after the rate hike announcement as market participants were betting over a rate hike by 100 bps but the downbeat US economic data trimmed Fed’s ambitious mood.
Initial jobless benefits have reached to seven-month high at 250k and the S&P PMI remained downbeat last week. Now, lower consensus for US Durable Goods Orders is indicating that higher interest rates have started displaying their consequences. This may keep the US dollar index (DXY) on the backfoot on a broader basis. While, on an intraday basis, a firmer rebound in the DXY has dragged the gold prices.
Gold technical analysis
On an hourly scale, the gold price is auctioning in a symmetrical triangle pattern. The upward and downward-sloping trendline of the volatility contraction pattern is placed from July 22 low and high at $1,712.94 and $1,739.37 respectively. The above-mentioned chart pattern indicates a volatility squeeze, which will be followed by an expansion in volumes and candlesticks’ range.
The gold prices are overlapping with the 50-period Exponential Moving Average (EMA) at $1,721.40, which signals a consolidation ahead.
Also, the Relative Strength Index (RSI) (14) has shifted into a 40.00-60.00 range, which signals that the asset is awaiting potential a trigger for a decisive move.
Gold hourly chart

- USD/CAD picks up bids to consolidate daily losses and stays on the bear’s radar for the second consecutive day.
- Recession fears weigh on oil prices; US dollar rebounds strengthen corrective pullback.
- US Consumer Confidence, FOMC will be in focus as slowdown concerns probe central banks.
USD/CAD licks its wounds around 1.2840, heading into Tuesday’s European session. In doing so, the Loonie pair takes clues from the latest rebound in the US dollar and a pullback in prices of Canada’s key export item, WTI crude oil.
WTI crude oil prices fade upside momentum during the second consecutive positive day, up 1.50% intraday around 97.25 by the press time. The black gold’s latest weakness could be linked to the growing fears surrounding macro-economic slowdown and escalating fears that China won’t be able to renew market optimism despite heavy stimulus.
On the other hand, US Dollar Index (DXY) drops for the fourth consecutive day, paring intraday losses around 106.40 by the press time. It’s worth noting that a rebound in the US 10-year Treasury yields, down 2.8 basis points near 2.79%, appears to favor the US dollar in consolidating the recent losses. It’s worth noting that the global rating giant Moody’s downgraded growth forecasts for Eurozone and the US but failed to lift the US dollar.
Amid these plays, the S&P 500 Futures fail to trace Wall Street as it retreats to 3,955, down 0.30% intraday, whereas stocks in Asia-Pacific also remain pressured.
Moving on, the US CB Consumer Confidence for July, prior 98.7, and chatters surrounding the recession, can offer intermediate direction to the USD/CAD traders ahead of Wednesday’s Federal Open Market Committee (FOMC) meeting. It’s worth noting that the Bank of Canada’s (BOC) 100 bps rate hike remains support to the USD/CAD bears until the Fed follows the route, which is less likely.
Read: Fed Preview: Powell to reignite dollar rally with a promise to crush inflation, whatever the cost
Technical analysis
Sustained trading below the 50-DMA, around 1.2855 by the press time, keeps USD/CAD bears hopeful of breaking the 1.2800 threshold.
- Asian equities have displayed a mixed performance as investors are turning cautious ahead of Fed policy.
- A downbeat performance of various US economic catalysts has triggered recession fears.
- Oil prices have advanced as Russia cut gas supply to Europe.
Markets in the Asian domain are trading mixed as S&P500 has turned negative in overnight New York. It seems like pre-Federal Reserve (Fed) anxiety has kicked in and risk-sensitive assets are misbehaving. The market participants are expected to remain anxious as the Fed is likely to step up interest rates by 75 basis points to 2.25-2.50%.
At the press time, Japan’s Nikkei225 remained flat, Shanghai Composite gained 0.81%, Hong Kong surged 1.46% while Nifty50 eased 0.58%.
Investors are turning cautious ahead of the interest rate event by the Federal Reserve (Fed) on Wednesday. Earlier, the market participants were betting over a rate hike announcement by 100 basis points (bps) as the inflation rate climbed to 9.1%. Now, the resurgence of recession fears after the subdued PMI data, lower consensus for Durable Goods Orders, and seven-month high Initial Jobless Claims have evaporated the option of a 1% rate hike. And, the Fed will paddle up its interest rates by 75 bps.
Meanwhile, the release of the dovish Bank of Japan (BOJ) minutes has failed to support the Japanese equities. The BOJ is committed to its ultra-loose monetary policy considering its fragile economy after the pandemic period.
On the oil front, oil prices have extended their recovery above $97.00 as supply worries have accelerated after Russia cut gas supply to Europe through a major pipeline. No doubt, the European nations have shifted their energy demand to other suppliers but still cater majority of their energy demand from Russia.
- USD/TRY grinds higher inside a bearish chart pattern.
- RSI fails to back higher low on prices, suggests bull’s exhaustion.
- 50-HMA adds strength to the support, buyers can aim for 2021 peak.
USD/TRY rebounds from intraday low as it picks up bids to 17.83 during early Tuesday morning in Europe. In doing so, the Turkish lira (TRY) pair approaches the yearly top marked the previous day while staying inside a weekly rising wedge bearish chart formation.
It’s worth noting that the RSI’s (14) inability to match the higher low on prices portrays the bearish divergence on the chart. The same hints at the quote’s further weakness and can favor bears should the quote confirms the rising wedge formation.
However, the 50-HMA adds strength to the 17.78 key support, a break of which could quickly drag USD/TRY to the 200-HMA around 17.50 before the theoretical target surrounding the 17.00 threshold.
In a case where the pair bears keep reins past 17.00, June’s bottom surrounding 16.00 will be in focus.
Alternatively, the yearly high near 17.85 and the stated wedge’s upper line, close to 17.90 at the latest, could restrict the USD/TRY pair’s immediate upside ahead of the 18.00 threshold.
Should USD/TRY remains firmer past 18.00, the odds of its run-up beyond the 2021 peak of 18.36 can’t be ruled out.
USD/TRY: Hourly chart

Trend: Pullback expected
- AUD/USD eases from five-week top, pares recent gains amid sluggish session.
- Growth concerns, pre-Fed chatters join anxiety ahead of Australia Q2 CPI to tame the bullish bias.
- US Consumer Confidence will decorate today’s calendar, buyers keep reins.
AUD/USD steps back from monthly high while taking offers to pare intraday gains around 0.6960 during early Tuesday morning in Europe. The Aussie pair’s latest pullback could be considered as the market’s preparations for the key data/events. However, a softer US dollar and hopes of firmer Australian inflation data appear to keep the buyers hopeful.
That said, the US Dollar Index (DXY) rebounds from its intraday low to 106.37, down 0.10% intraday by the press time. In doing so, the greenback gauge drops for the fourth consecutive day despite the latest bounce.
The US dollar’s recent recovery, as well as the AUD/USD pullback, could be linked to the talks surrounding the economic weakness in the US, as well as abroad. The recession fears initially gained clues from Monday’s Chicago Fed National Activity Index for June and Dallas Fed Manufacturing Index for July, preceded by Friday’s US S&P Global PMIs for July. On the same line was Walmart’s slashing of profit forecasts and fears of lesser consumer spending.
It’s worth noting that a rebound in the US Treasury yields from the daily low, to 2.79% at the latest, also underpins the rebound in the US dollar and weighs on the AUD/USD.
Moving on, AUD/USD traders should pay attention to the US CB Consumer Confidence for July, prior 98.7, as well as chatters surrounding recession for fresh impulse. However, Wednesday’s Australia Consumer Price Index for the second quarter (Q2), expected 6.2% YoY versus 5.1% prior, will precede the Federal Open Market Committee (FOMC) meeting to mark the key day for the Aussie pair traders. It’s worth noting that Australia’s push to China, for removing trade sanctions, could join the recently mixed comments from the Reserve Bank of Australia (RBA) to weigh on the quote if the Q2 CPI arrives short of market forecasts.
Also read: Fed Preview: Powell to reignite dollar rally with promise to crush inflation, whatever the cost
Technical analysis
Despite the latest run-up, AUD/USD remains inside a short-term trading area between 0.6955 and 0.6975 levels comprising a downward sloping resistance line from early April and 50-DMA in that order.
Reserve Bank of New Zealand (RBNZ) Governor Adrian Orr said on Tuesday that it is undertaking a review of its recent performance in conducting monetary policy, per Reuters.
Key quotes
The review will assess inflation and employment outcomes relative to the targets outlined in the remit and the decisions taken at various times based on the information available when they were made.
The review of monetary policy performance is in addition to an ongoing review of the Monetary Policy Remit.
NZD/USD retreats
Following the news, NZD/USD reverses the early Asian session run-up while taking rounds to 0.6265-60.
Also read: NZD/USD oscillates around 0.6250 amid sluggish session, US Consumer Confidence eyed
- USD/JPY has crossed 135.50 as the DXY has rebounded firmly ahead of Fed policy.
- An interest rate decision by the Fed will widen the Fed-BOJ policy divergence.
- The BOJ will continue with its ultra-loose monetary policy to spurt the growth rate.
The USD/JPY pair has displayed a meaningful rebound after hitting a low of 136.30 in the Asian session. The asset has surpassed the crucial hurdle of 135.50 and is heading towards Monday’s high at 136.80. Market mood is expected to turn sour as investors usually get anxious ahead of the interest rate decision by the Federal Reserve (Fed).
On a rate hike announcement by the Fed, the USD/JPY is likely to be the major victim as the Fed-Bank of Japan (BOJ) policy divergence will escalate further. There is no denying the fact that the option of a 1% rate hike is not viable now as the US economy is likely to meet the recession situation ahead. However, price pressures are still persisting in the US economy and the Fed will announce a rate hike by 75 basis points (bps).
While the BOJ is committed to flush liquidity in the economy as it has been fragile after the pandemic period and has yet not returned to its pre-pandemic levels. This will escalate the Fed-BOJ policy divergence and may strengthen the pair more.
Apart from the Fed policy, investors' focus will remain on the US Durable Goods Orders data, which is due on Wednesday. The economic data is seen at -0.2%, lower than the prior release of 0.8%. This indicates a severe slump in the aggregate demand as Retail data remained higher, which is contaminated with higher energy bills and costly food products.
- USD/INR holds lower ground after refreshing eight-day low the previous day.
- US dollar tracks downbeat yields as weak US data underpins fears of recession.
- Mixed sentiment in Asia-Pacific, lack of major data/events restrict immediate moves.
- US Consumer Confidence can entertain traders ahead of Fed.
USD/INR remains pressured around a one-week low, marked the previous day, as traders seek fresh clues during Tuesday’s Asian session. In doing so, the Indian rupee (INR) pair cheers the softer US dollar, amid cautious optimism, around 79.70 at the latest.
US Dollar Index (DXY) drops for the fourth consecutive day, down 0.18% intraday around 106.30 by the press time. It’s worth noting that the US 10-year Treasury yields, down 3.5 basis points near 2.78%, reversing the previous day’s rebound to 2.81%. Further, Monday’s Chicago Fed National Activity Index for June and Dallas Fed Manufacturing Index for July, preceded by Friday’s US S&P Global PMIs for July, also strengthened economic fears surrounding the US. Recently, global rating giant Moody’s downgraded growth forecasts for Eurozone and the US but failed to lift the US dollar.
On the other hand, WTI crude oil prices rise for the second consecutive day, up 1.75% intraday around 97.50 by the press time. While the US dollar weakness can justify the rebound in the oil prices, Russia’s restrictive gas supplies to Europe and OPEC leaders’ refrain to respect the US push for more output appear to underpin the black gold’s recent upside.
At home, mixed sentiment and downbeat performance of technology shares appear to keep the USD/INR prices tensed of late. It’s worth noting that Walmart’s slashing of profit forecasts and fears of lesser consumer spending also contributes to the risk-off mood amid a sluggish session and restrict the pair’s moves.
While portraying the mood, the S&P 500 Futures fail to trace Wall Street as it retreats to 3,955, down 0.25% intraday.
Moving on, chatters surrounding recession and inflation will be crucial for the USD/INR traders to watch ahead of Wednesday’s Federal Open Market Committee (FOMC) meeting. That said, US CB Consumer Confidence for July, prior 98.7, appears to be the key for traders to watch. Also important will be the US New Home Sales for June, Richmond Fed Manufacturing Index for July and House Price Index data for May.
Technical analysis
USD/INR traders seek a clear break of the 79.60-90 area for conviction. That said, oscillators seem to fade bullish bias of late.
- EUR/USD is eyeing more upside after overstepping the barricade of 1.0250.
- Escalating recession worries have weighed pressure on the DXY.
- The Fed is likely to hike interest rates by 75 bps as a 1% rate hike is out of the picture.
The EUR/USD pair has sensed a mild selling pressure while attempting an upside move above the critical hurdle of 1.0250. The asset is expected to surpass the same as the US dollar index (DXY) has entered into a negative trajectory.
The DXY is likely to surrender the cushion of 106.00 as the US economic events are bolstering the odds of a recession in the economy. Initial Jobless Claims have reached a seven-month high of 250k and major US tech companies are hinting at a halt on the recruitment process. On that, tech giant Google has halted its recruitment process from the past two weeks and other big techs are considering a lay-off program.
Accelerating jobless benefits and a steep reduction in employment generation will result in a slump in the overall demand in an already high inflation market. Also, this has vanished the option of 100 basis points (bps) interest rate hike by the Federal Reserve (Fed) and a rate hike of 75 bps is in the limelight.
On the eurozone front, investors are awaiting the release of the Gross Domestic Product (GDP) numbers, which are due on Friday. A preliminary estimate for the economic data is 3.4%, significantly lower than the prior release of 5.4%. Also, the quarterly economic data will tumble to 0.1% vs. 0.6% released earlier. Apart from that, the eurozone Harmonized Index of Consumer Prices (HICP) holds significant importance. The eurozone inflation is seen at 8.7%, 10 bps higher than the prior close.
- Steel prices have rebounded firmly as higher passenger vehicles retail sales escalate hopes for recovery.
- Russia is offering steel at lucrative discounts to cater mass market of Asia.
- The conclusion of the monsoon will resume construction activities in China.
Steel prices have advanced as the monsoon season is about to over in most provinces of China and the demand will recover soon. The resumption of construction activities for real estate and infrastructure will bring a revival in the demand for steel and the corresponding prices may accelerate further.
Production of steel in China has remained vulnerable after the announcement of export duty of 15% on selected pig iron, flat-rolled products of iron or non-alloyed steel, bars and rods, and various flat-rolled products of stainless steel, as per The Hindu. The export market of steel in China has witnessed a serious slump after the sanctioning of export duty and the pledge of saving the environment from the harmful effects of steel production.
Meanwhile, Russia is planning to escalate exports of steel at cheaper prices to cater to a large market in Asia. However, the payment mechanism will remain critical as the US abandoned Russia from the SWIFT payment mechanism after it invaded Ukraine. Russia is providing attractive discounts to address the mass market of Asia, which might force China to sum up its export duty levied on steel.
On the demand front, retail sales of passenger vehicles remained upbeat in July 11-17 after remaining 16% higher on an annual basis and 20% higher on a weekly basis. A gradual improvement in the overall demand after remaining muted due to the arrival of the monsoon may advance the steel price vigorously.
- Gold price rebounds towards 100-SMA resistance after a softer start to the key week.
- US dollar weakness underpins XAU/USD up-moves but risk-aversion tests buyers.
- US Consumer Confidence for July can offer intermediate clues ahead of Wednesday’s FOMC.
- Recession fears, inflation talks are also important for clear directions.
Gold price (XAU/USD) consolidates the week-start losses as bulls again approach the 100-SMA resistance during Tuesday’s Asian session, after failing to cross the same during the last two days. That said, the yellow metal prints mild gains around $1,725 by the press time.
The bullion’s latest gains could be linked to the softer US dollar amid downbeat Treasury yields and fears of the US recession. As a result, the US Dollar Index (DXY) drops for the fourth consecutive day, down 0.18% intraday around 106.30 by the press time. It’s worth noting that the US 10-year Treasury yields, down 3.5 basis points near 2.78%, reversing the previous day’s rebound to 2.81%. Further, Monday’s Chicago Fed National Activity Index for June and Dallas Fed Manufacturing Index for July, preceded by Friday’s US S&P Global PMIs for July, also strengthened economic fears surrounding the US. Recently, global rating giant Moody’s downgraded growth forecasts for Eurozone and the US but failed to lift the US dollar.
Elsewhere, Bloomberg’s analysis suggests the Chinese recession concerns teasing the global economic slowdown also weigh on the market sentiment and underpins the XAU/USD rebound, due to the softer USD and the metal’s traditional safe-haven status.
On the same line, Walmart’s slashing of profit forecasts and fears of less consumer spending going forward are additional catalysts that contribute to the risk-off mood amid a sluggish session. Further, the global rating giant Moody’s downgrade of European and US growth forecasts act as an additional burden on the risk appetite.
Amid these plays, the S&P 500 Futures fail to trace Wall Street as it retreats to 3,955, down 0.40% intraday.
That said, a light calendar in Europe may restrict the gold price moves. However, today’s US CB Consumer Confidence for July, prior 98.7, appears to be the key for the pair traders to watch. Also important will be the US New Home Sales for June, Richmond Fed Manufacturing Index for July and House Price Index data for May. Above all, the pre-Fed chatters and growth-related talks will be crucial to watch for clear directions.
Also read: Gold Price Forecast: Sellers maintain the pressure
Technical analysis
Gold extends rebound from the 50-SMA towards the 100-SMA hurdle surrounding $1,732-33. However, sluggish MACD hints at further grinding of the metal between the key 100-SMA and the 50-SMA, near $1,732-33 and $1,712 in that order.
It’s worth noting that July’s 08 swing high and a downward sloping resistance line from early June, close to $1,752 and $1,766 in that order, could also challenge the XAU/USD buyers past $1,733.
On the contrary, eight-day-long horizontal support around $1,698-97 may restrict the metal’s weakness past 50-SMA.
Should the quote drop below $1,698, the latest multi-month low near $1,680 and the 61.8% Fibonacci Expansion (FE) of July 04-22 downside, around $1,656, could lure the bears.
Overall, gold pares recent losses but stays pressured around a yearly low.
Gold: Four-hour chart
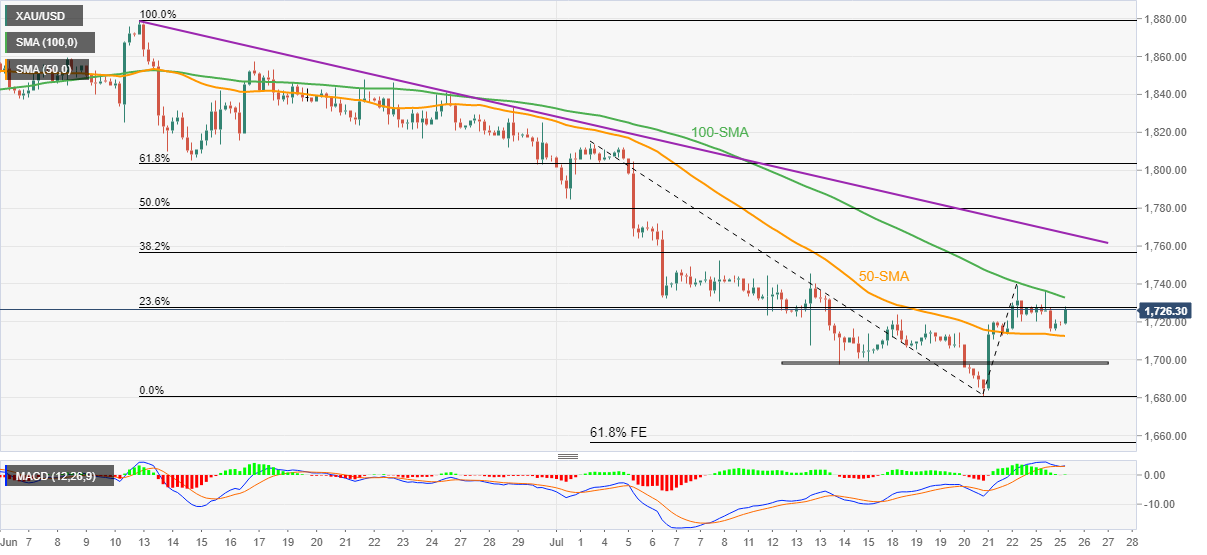
Trend: Further weakness expected
| Raw materials | Closed | Change, % |
|---|---|---|
| Silver | 18.43 | -0.79 |
| Gold | 1719.57 | -0.37 |
| Palladium | 2007.17 | -0.98 |
- GBP/USD takes the bids to refresh intraday high, print four-day uptrend.
- Fears of US economic slowdown, softer data join downbeat yields to weigh on US dollar.
- BOE hawks struggle amid UK PM race, inflation concerns in Britain.
- Talks surrounding UK politics, US Consumer Confidence for July will be important ahead of Wednesday’s FOMC.
GBP/USD grinds higher at the monthly top, printing the four-day uptrend as it rises to 1.2085 during Tuesday’s Asian session. it’s worth noting that the cable pair’s recent strength takes clues from the US dollar’s weakness while ignoring concerns over UK inflation and politics.
US Dollar Index (DXY) drops for the fourth consecutive day, down 0.22% intraday around 106.25 by the press time. In doing so, the greenback gauge takes clues from the downbeat US Treasury yields, as well as recently softer US data.
It’s worth noting that the US 10-year Treasury yields, down 3.5 basis points near 2.78%, reversing the previous day’s rebound to 2.81%. Further, Monday’s Chicago Fed National Activity Index for June and Dallas Fed Manufacturing Index for July, preceded by Friday’s US S&P Global PMIs for July, also strengthened economic fears surrounding the US.
Recently, global rating giant Moody’s downgraded growth forecasts for Eurozone and the US but failed to lift the US dollar.
That said, Bloomberg came out with the findings from a research company Ipsos that said, 45% of adults thought inflation is one of the most troubling issues confronting the nation, the highest level recorded since the survey started in the early 1980s. Elsewhere, Foreign secretary Liz Truss will promise on Tuesday to bring in "tough and decisive action" to limit strike action by trade unions if she becomes Britain's next prime minister, per Reuters.
On a different page, the indecision over the Bank of England’s (BOE) next move should have also weighed on the GBP/USD prices, but did not. The Bank of England (BoE) will likely shy away from a bigger interest rate rise in August and instead stick to the more modest 25 basis point increases it has been delivering, but it is a very close call, per the latest Reuters poll of economists.
It should be observed that the S&P 500 Futures fail to cheer downbeat US Treasury yields and softer US data, not to forget the US dollar weakness.
Amid these plays, the GBP/USD prices are likely to remain firmer as the hawkish hopes from the BOE join softer yields ahead of Wednesday’s Federal Open Market Committee (FOMC) meeting. Even so, S CB Consumer Confidence for July, prior 98.7, appears the key for traders to watch.
Technical analysis
A successful upside break of the 21-DMA, around 1.2000 by the press time, directs GBP/USD buyers towards a downward sloping resistance line from late April, around 1.2110 at the latest. It’s worth noting that an eight-day-old support line, close to 1.1970, adds to the downside filters for the pair.
- AUD/USD bulls have taken control in Asia along a daily trendline support.
- The hourly broadening formation points to a move higher also.
AUD/USD has spiked in the Asian trade and eyes are on a move higher from both a daily and hourly perspective. The following illustrates the bullish trajectory from a bullish bias within the daily and hourly charts.
AUD/USD daily chart
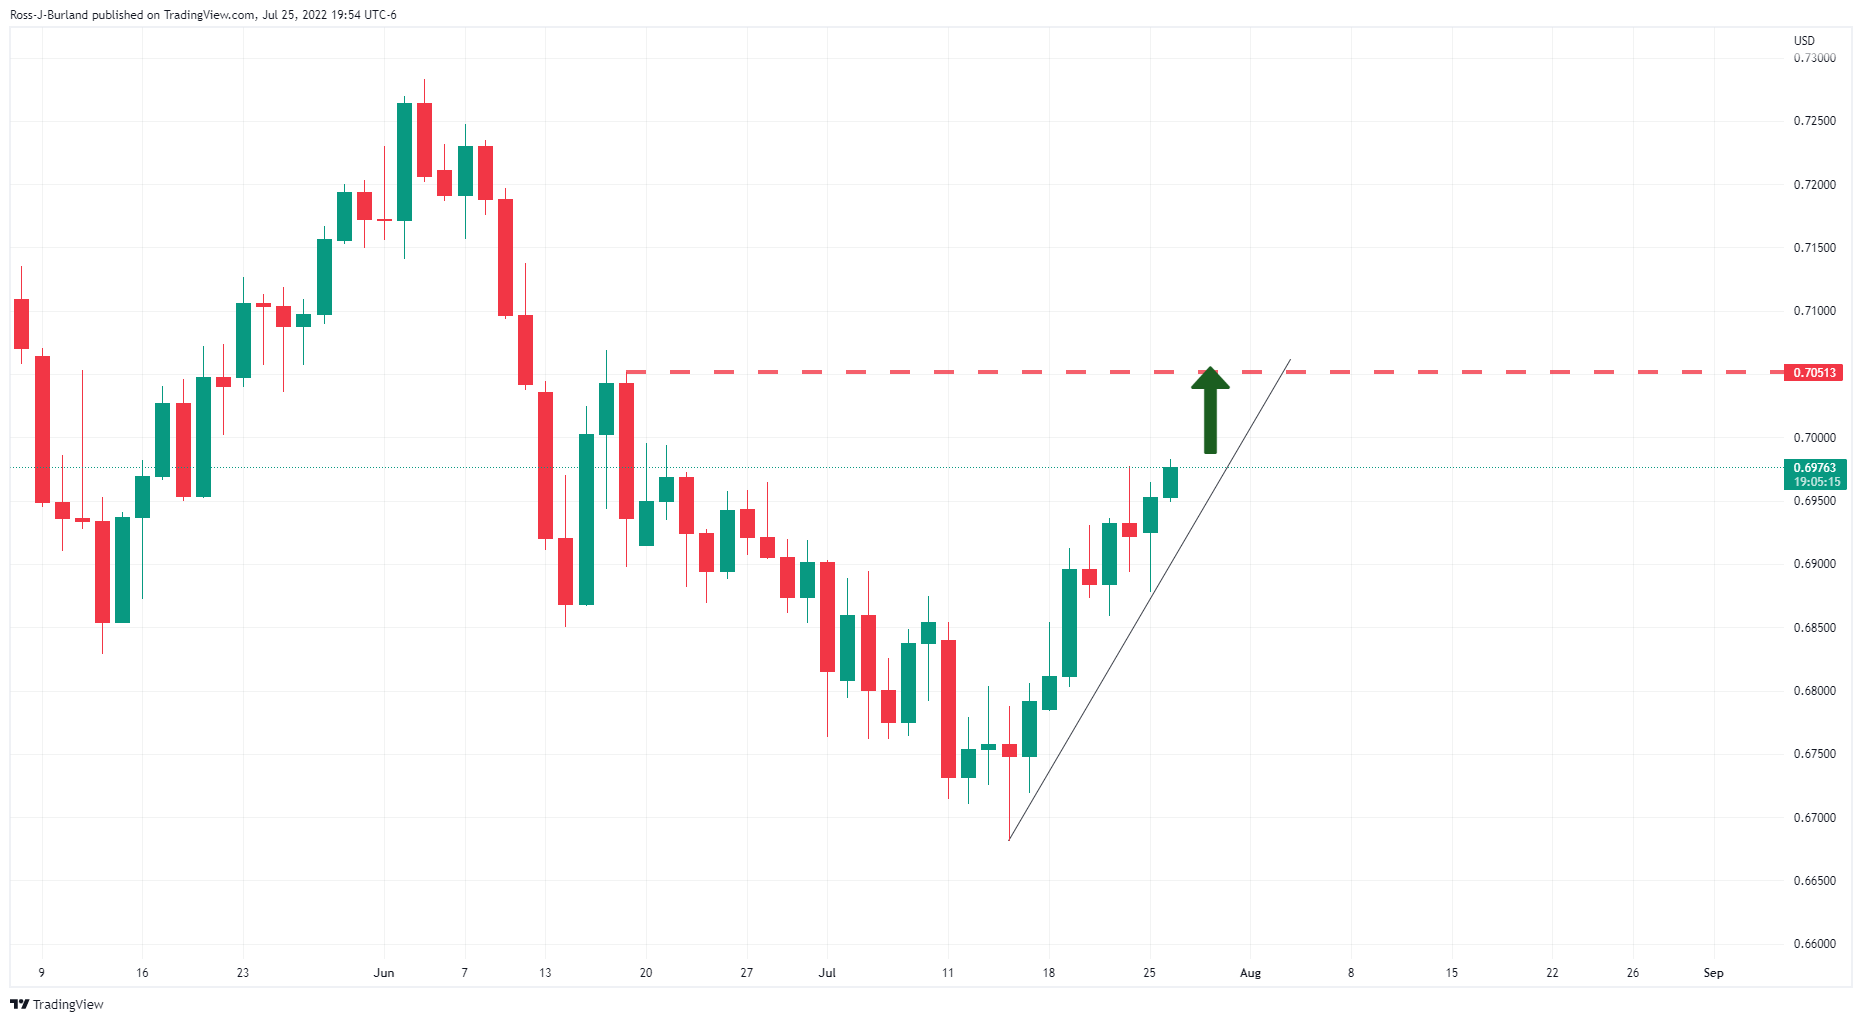
From a daily perspective, the bulls have their eyes on a move beyond the recent highs towards the 0.7050 mark as the price climbs the trendline support.
AUD/USD H1 chart
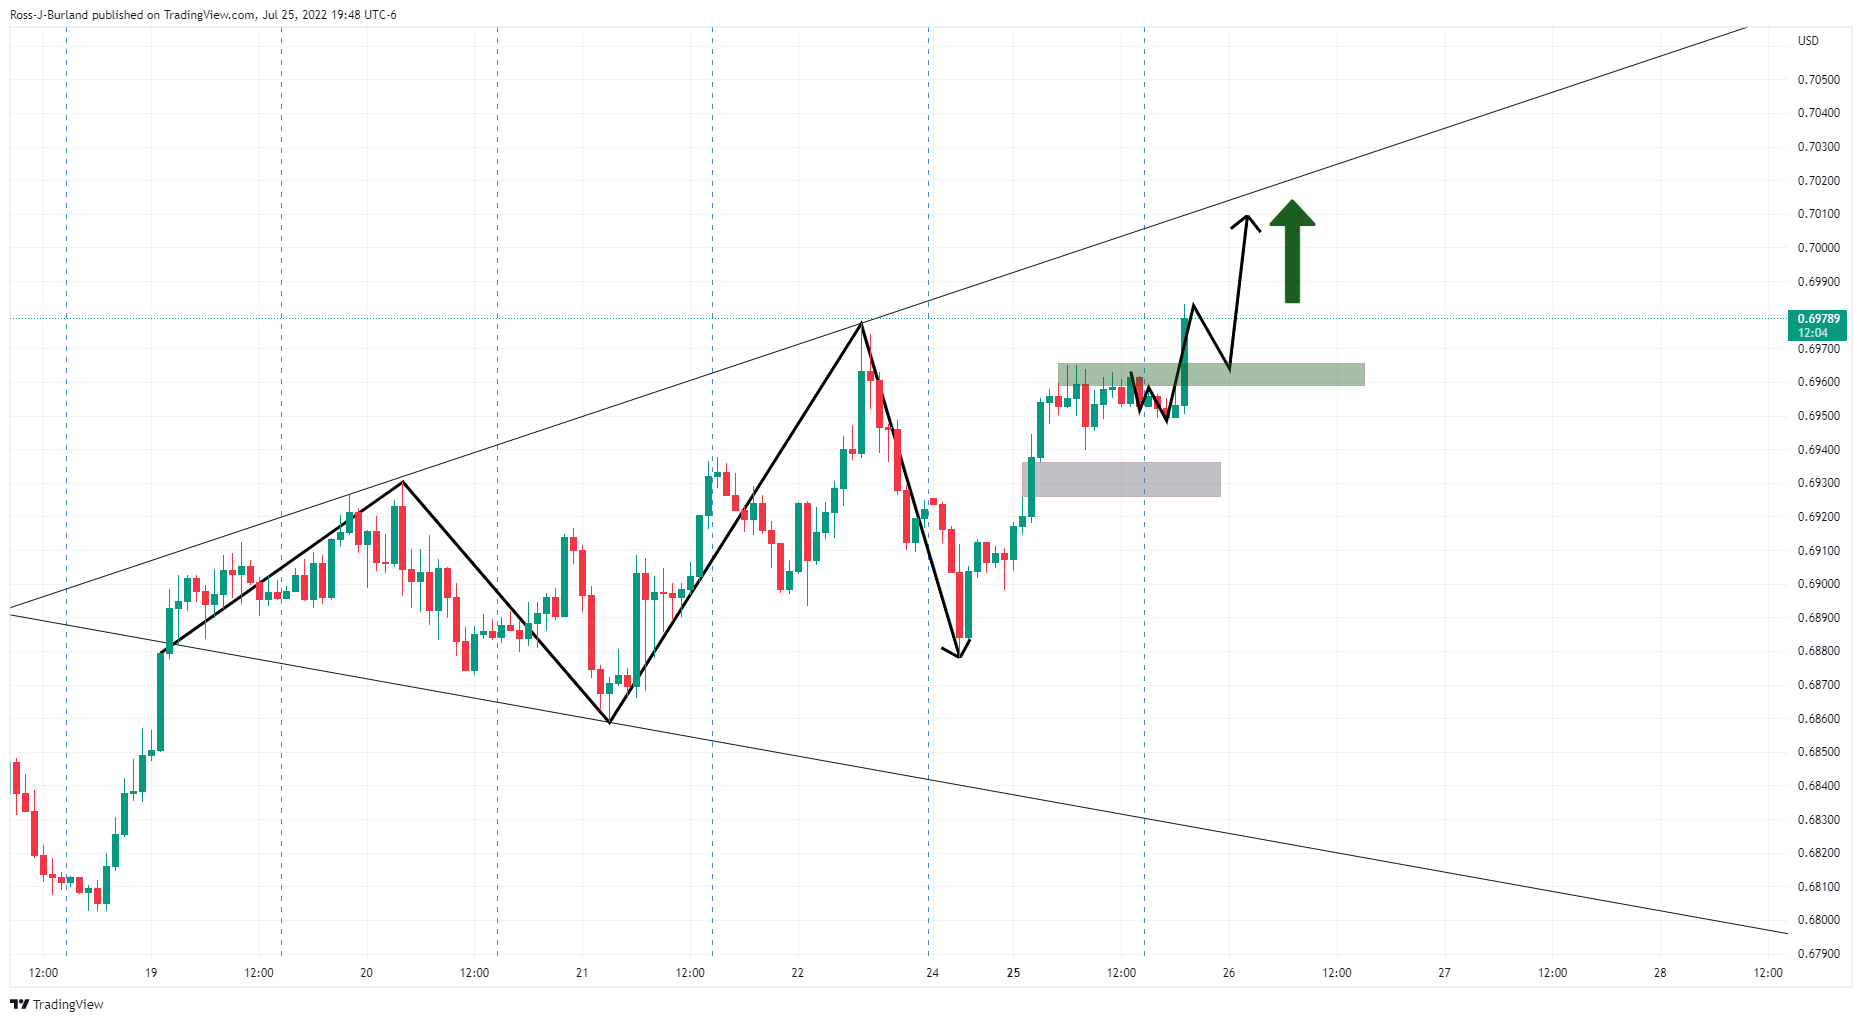
The broadening formation on the hourly chart leaves the upside trendline resistance exposed and vulnerable as well prior to a move lower within the confines of the shorter-term pattern.
Economists at Goldman Sachs offer their outlook on the US dollar heading into this week's FOMC policy meeting.
Key quotes
"A convincing turn in the Dollar will likely require more calming inflation news and more balanced Fed policy. While some of the very recent news on inflation has been encouraging, we think a tactical Dollar selloff will require some acknowledgement of this by Fed officials this week.”
“While markets will again focus on the hiking increment at this meeting and guidance for September, the lesson from the June meeting is that it will be more important to focus on the Fed's criteria for adjusting its approach.”
"At the meeting this week, we will primarily be focused on whether officials broaden that criteria to put more focus on slowing activity data. Until that shift is clearer, it will be difficult for the market to price a more accommodative Fed and a weaker Dollar.”
In the latest research reports published on Tuesday, Moody’s Investors Service slashes the GDP growth forecasts for the US and Europe for 2022 as well as 2023.
Key quotes
“Now expects US real GDP growth of 2.1% in 2022 and 1.3% in 2023, down from its May forecasts of 2.8% and 2.3%, respectively.”
“Tighter monetary and financial conditions to reduce stubbornly high inflation will slow economic growth.”
“While Moody's expects inflation to trend down as growth weakens, it will still remain elevated, dropping from 9.1% in June to 7.0% by the end of 2022 and to 2.3% by the end of 2023.
“Moody's baseline forecast for the euro area is for real GDP to grow 2.2% in 2022, followed by 0.9% in 2023, down from its May forecasts of 2.5% and 2.3%, respectively.”
"Our baseline forecasts assume that persistently high energy prices and broad-based inflation will continue to squeeze real incomes and dampen consumption spending as the energy crisis drags on.”
“The main factors driving the lower growth projections are: gas supply interruptions and uncertainty that will require adjustment on the demand side; high inflation, which is denting consumer spending; withdrawal of monetary policy support by the European Central Bank (ECB); tighter global liquidity; and subdued external demand.”
“There are substantial downside risks to Moody's forecasts should Russia completely shut off gas flows to Europe.”
Related reads
- S&P 500 Futures, yields return to the bear’s desk as recession fears weigh on sentiment
- US Dollar Index sees downside below 106.00 as recession fears elevate, spotlight is on Fed
- Market sentiment fades the week-start cautious optimism amid fears of economic slowdown.
- Downbeat US data, Walmart’s profit warning joins pre-Fed anxiety to spoil the mood.
- S&P 500 Futures, US 10-year Treasury yields fade the previous day’s corrective pullback.
- US Consumer Confidence eyed ahead of Wednesday’s FOMC.
The risk profile fails to extend the week-start cautious optimism amid fears of economic slowdown. Also weighing on the sentiment could be the traders’ cautious mood ahead of Federal Open Market Committee (FOMC) meeting.
While portraying the mood, the S&P 500 Futures fail to trace Wall Street as it retreats to 3,955, down 0.40% intraday. On the same line is the US 10-year Treasury yields, down 3.5 basis points near 2.78%, reversing the previous day’s rebound to 2.81%.
It’s worth noting that the inversion between the 10-year and the 2-year US Treasury yields, as well as the recently high inflation expectations, per the 10-year breakeven inflation rate per the St. Louis Federal Reserve (FRED) data, highlight fears of recession.
That said, Monday’s Chicago Fed National Activity Index for June and Dallas Fed Manufacturing Index for July, preceded by Friday’s US S&P Global PMIs for July, also strengthened economic fears.
However, two US Treasury officials, namely Ben Harris, Treasury Assistant Secretary for Economic Policy and Neil Mehrotra, Deputy Assistant Secretary for Macroeconomics raised hopes for a firmer US Gross Domestic Product (GDP). The officials wrote, per Reuters, that gross domestic income (GDI), which measures aggregate income -- wages, business profits, rental and interest income -- continued to rise in the first quarter at a 1.8% annual pace, while GDP fell.
Earlier in the week, US Treasury Secretary Janet Yellen talked down fears of the US recession while saying, “A second quarter GDP contraction would not signal recession because of underlying job market strength, demand and other indicators of economic health.”
On a different page, Bloomberg’s analysis suggests the Chinese recession concerns weighing on the economic slowdown in the major economies also weigh on the market sentiment. “China’s economic slowdown is spilling over to major exporting nations in Europe and East Asia through falling demand for manufactured goods, causing Germany and South Korea to post rare deficits with the world’s second-largest economy,” said Bloomberg.
Elsewhere, Walmart’s slashing of profit forecasts and fears of less consumer spending going forward are additional catalysts that contribute to the risk-off mood amid a sluggish session. On the same line was the global rating giant Moody’s downgrade of European growth forecasts amid the energy crisis.
Looking forward, US CB Consumer Confidence for July, prior 98.7, appears the key for traders to watch. Also important will be the US New Home Sales for June, Richmond Fed Manufacturing Index for July and House Price Index data for May. Above all, the pre-Fed chatters and growth-related talks will be crucial to watch for clear directions.
- USD/CAD broadening formations are compelling across the daily and 4-hour charts.
- The price imbalances are identified and could be mitigated in the coming days.
USD/CAD is under pressure on Tuesday in what is a relatively quiet session with nothing left on the calendar until a slew of US data for the US session which leaves the technicals in play. The pair is carving out a broadening formation on the 4-hour chart within a longer-term bearish landscape as per the daily broadening formation.
USD/CAD daily chart
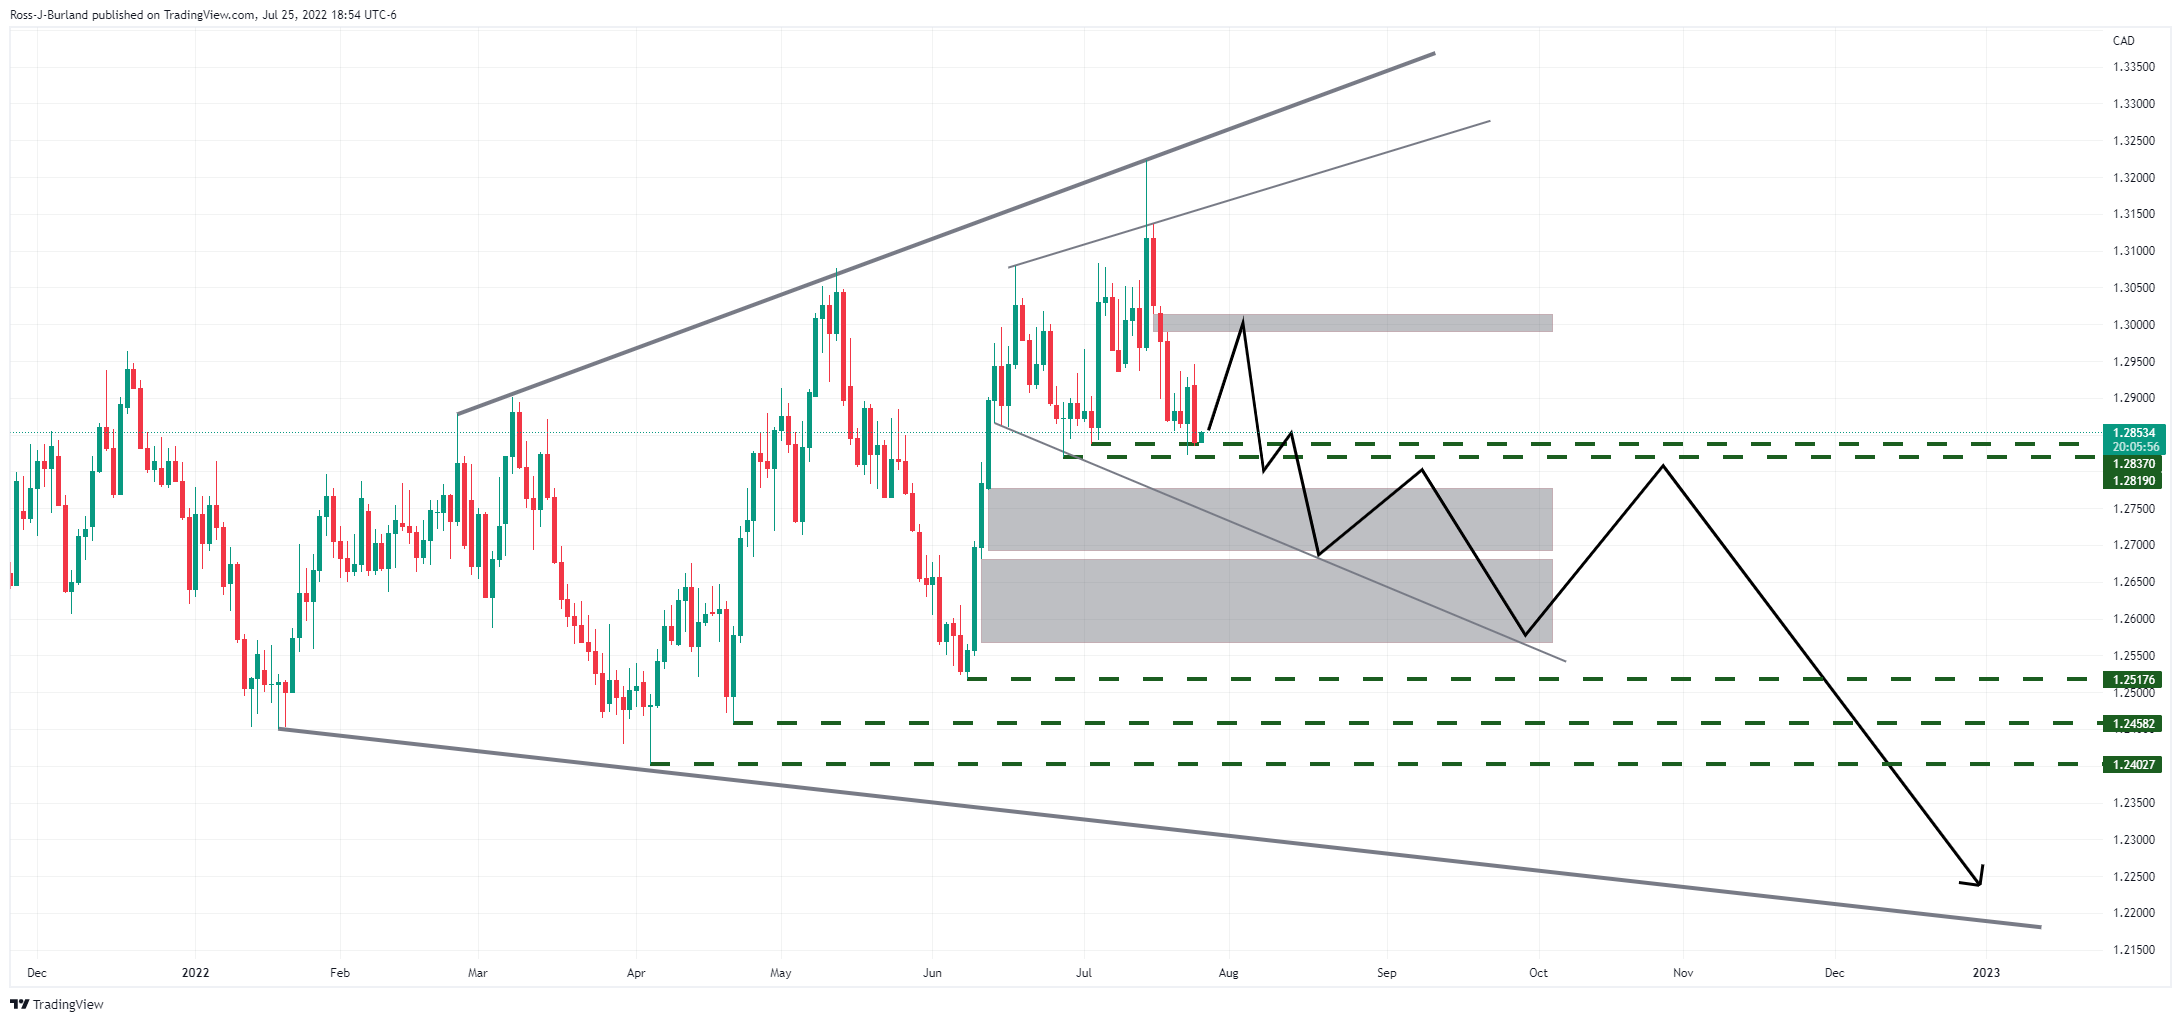
The daily chart has a series of price imbalances to the downside that could be mitigated if the daily broadening formation plays out to the downside. The grey areas are the imbalance left behind by the bullish surge and guard a series of lower pivots to the downside. There is a price imbalance to the upside that could be mitigated first.
USD/CAD H4 chart
On the 4-hour time frame, the price is trading in accordance with the broadening formation there also and there are price imbalances to the upside that could lure in the bulls prior to the next significant downside continuation. In the meantime, the bears are movioiong in and have eyes on the lower end of the formaiton towards a test of 1.2800.
In recent trade today, the People’s Bank of China (PBOC) set the yuan (CNY) at .7483 vs. the last close of 6.7520 and estimate of 6.4790.
About the fix
China maintains strict control of the yuan’s rate on the mainland.
The onshore yuan (CNY) differs from the offshore one (CNH) in trading restrictions, this last one is not as tightly controlled.
Each morning, the People’s Bank of China (PBOC) sets a so-called daily midpoint fix, based on the yuan’s previous day's closing level and quotations taken from the inter-bank dealer.
- AUD/JPY has struggled to surpass the critical hurdle of 95.00 despite dovish BOJ minutes.
- The BOJ seeks support from the wage-price index to keep inflation above desired levels.
- Australian inflation rate for Q2CY22 is seen higher at 6.2% vs. 5.1% reported earlier.
The AUD/JPY pair is declining after giving a downside break of the minute consolidation formed in a range of 94.97-95.18 in the early Tokyo session. Broadly, the asset has remained firmer and this mild correction could be termed as ‘profit-booking’ by the market participants. The risk barometer has slipped after the release of the dovish minutes by the Bank of Japan (BOJ) of its June monetary policy.
Investors should be aware of the fact that BOJ Governor Haruhiko Kuroda kept its interest rate policy unchanged last week. The BOJ remained continued with its ultra-loose monetary policy in order to keep the inflation rate above the desired levels. However, its inability in elevating its wage rates is becoming a major hurdle and the inflation rate above 2% is seldom by the support of soaring energy bills and food items. Also, the BOJ announced that it will defend its cap on bond yields with unlimited buying.
On the aussie front, investors are awaiting the release of the inflation data by the Australian Bureau of Statistics, which is due on Wednesday. The overall Consumer Price Index (CPI) for the second quarter of CY2022 is seen at 6.2% vs. 5.1% reported earlier. This will force the Reserve Bank of Australia (RBA) to elevate its interest rates further in its August monetary policy. RBA Governor Philip Lowe has already elevated its Official Cash Rate (OCR) to 1.35% after a consecutive 50 basis points (bps) rate hike in July.
- USD/CHF remains pressured around intraday low, fades bounce off three-week low marked the previous day.
- RSI retreat, sustained trading below 200-SMA keeps sellers hopeful.
- Bulls need validation from six-week-old resistance line to retake control.
USD/CHF retreats to 0.9635 as it refreshes its intraday low during Tuesday’s Asian session, reversing the previous day’s rebound from a three-week low.
Given the quote’s sustained trading below the 200-SMA, as well as downbeat RSI (14), USD/CHF bears are likely to keep reins.
However, an upward sloping support line from late June, around 0.9610 by the press time, could restrict the quote’s immediate downside.
Following that, the lower line of the two-week-long falling wedge bullish chart pattern, close to 0.9580, will be in focus.
Should the quote USD/CHF prices fail to rebound from 0.9580, the odds of witnessing further downside towards June’s low of 0.9495 can’t be ruled out.
Alternatively, an upside break of the stated wedge’s resistance line, near 0.9660 at the latest, can trigger the pair’s short-term rebound towards the 200-SMA level surrounding 0.9715.
It’s worth noting, however, that the pair’s upside past 0.9715 hinges on the USD/CHF pair’s ability to cross the downward sloping resistance line from mid-June, near 0.9825 by the press time.
Overall, USD/CHF remains pressured towards a short-term key support line inside a bullish chart formation.
USD/CHF: Four-hour chart

Trend: Further weakness expected
The Bank of England (BoE) will likely shy away from a bigger interest rate rise in August and instead stick to the more modest 25 basis point increases it has been delivering, but it is a very close call, per the latest Reuters poll of economists.
Key findings
A slight majority in the July 13-25 Reuters poll - 29 of 54 economists - said the BoE will stick to 25 basis points at its next meeting on Aug. 4, to 1.50%. The remaining 25 forecast 50 basis points, which would put it more in line with its peers.
Among gilt-edged market makers, the narrow split was reversed. Of the 15 who responded, eight forecast a 50 basis point hike, while seven saw a 25 basis point hike.
A majority of respondents expect Bank Rate to end the year at 2.25% or higher, compared with 1.75% in the previous poll.
The poll gave a median 55% chance of a recession in the coming year, up sharply from 35% in the June poll. But that was based on a small sample of 11 respondents, with several declining to answer as they thought the recession was already here.
The poll suggested inflation, currently at a 40-year high of 9.4%, would likely peak in the fourth quarter, when it is expected to average 10.2% - five times the BoE's 2% target.
Also read: GBP/USD Price Analysis: Bulls set medium-term target on the 1.22 area
- The DXY is eyeing more downside if it drops below 106.00 as recession fears escalate.
- Odds of a disappointment in the US employment data look imminent.
- A downward consensus for the US Durable Goods Orders will have significant impact on the DXY.
The US dollar index (DXY) has given a downside break of the consolidation formed in a narrow range of 106.42-106.53 in the late New York session. The asset has remained vulnerable from the past week and is likely to display more downside after violating the critical support of 106.00. A slippage below the above-mentioned cushion may drag the DXY towards 105.60.
Fed rate hike seems restricted to 75 bps
No doubt, the current situation of the price pressures is forcing the Federal Reserve (Fed) to follow the footprint of the Bank of Canada (BOC) and accelerate its borrowing rates by 100 basis points (bps). The overall inflation rate has climbed to 9.1% and has not displayed any signs of exhaustion yet. However, the signs of recession in the US economy are restricting the Fed till 75 bps rate hike. Soaring jobless benefits and expectations of a significant decline in the US Nonfarm Payrolls (NFP) data are bolstering the odds of a recession in the US economy.
A divergence in Retail Sales and Durable Goods Orders looks imminent
The consensus for the US Durable Goods Orders is -0.2% vs. 0.8% reported earlier. It is worth noting that July’s Retail Sales print remained at 1%, significantly higher than the consensus and former print. A huge divergence between Retail Sales data and US Durable Goods Orders data indicate that soaring energy bills and costly food products were responsible for higher former economic data and the overall demand is vulnerable.
Key data this week: Consumer Confidence, New Home Sales, Durable Goods Orders, Pending Home Sales, Core Personal Consumption Expenditure (PCE), Gross Domestic Product (GDP), Initial Jobless Claims, and Michigan Consumer Sentiment Index (CSI).
Major events this week: Fed monetary policy
- USD/JPY takes offers to renew intraday low, reverses the week-start rebound.
- BOJ Minutes cited the need to watch impact of financial, forex market moves on economy, prices.
- Yields remain pressured as recession woes stay on the table ahead of Wednesday’s FOMC.
- Pre-Fed anxiety, fears of economic slowdown exert downside pressure ahead of US Consumer Confidence for July.
USD/JPY renews its intraday low around 136.30 during the initial hour of Tokyo open on Tuesday. In doing so, the yen pair reverses the previous day’s corrective pullback amid downbeat US Treasury yields and the mixed comments from the Bank of Japan’s (BOJ) Monetary Policy Meeting Minutes.
“Bank of Japan policymakers agreed on the need to maintain ultra-low interest rates to support a fragile economy and ensure rising inflation was accompanied by higher wages, minutes of their June rate-setting meeting showed on Tuesday,” reported Reuters. The Minute statement also mentioned that members shared the view that BOJ must support the economy, which is under pressure from rising commodity prices.
Elsewhere, fears of recession returned to the table, despite the US policymakers’ attempts to talk down the pessimism. Recently, two US Treasury officials, namely Ben Harris, Treasury Assistant Secretary for Economic Policy and Neil Mehrotra, Deputy Assistant Secretary for Macroeconomics raised hopes for a firmer US Gross Domestic Product (GDP). The officials wrote, per Reuters, that gross domestic income (GDI), which measures aggregate income -- wages, business profits, rental and interest income -- continued to rise in the first quarter at a 1.8% annual pace, while GDP fell.
Earlier in the week, US Treasury Secretary Janet Yellen talked down fears of the US recession while saying, “A second quarter GDP contraction would not signal recession because of underlying job market strength, demand and other indicators of economic health.”
It’s worth noting that Chicago Fed National Activity Index reprinted -0.19 in June, versus a -0.03 forecast while Dallas Fed Manufacturing Index for July slumped to the lowest levels since mid-2020 to -22.6 versus -12.5 expected and -17.7 prior.
Additionally, Bloomberg’s analysis suggests the Chinese recession concerns weighing on the economic slowdown at the major economies also drown the USD/JPY prices due to the closed trade links between Australia and China. “China’s economic slowdown is spilling over to major exporting nations in Europe and East Asia through falling demand for manufactured goods, causing Germany and South Korea to post rare deficits with the world’s second-largest economy,” said Bloomberg.
Amid these plays, Wall Street managed to close mixed, with Nasdaq posting mild losses versus the softer gains of the DJI30 and S&P 500. However, the US 10-year Treasury yields snapped a three-day downtrend and rose nearly 1.75% while regaining the 2.81% mark of late. It should be noted that the S&P 500 Futures drop 0.37% intraday by the press time.
Looking forward, US CB Consumer Confidence for July, prior 98.7, appears to be the key for the pair traders to watch for the intraday directions. Following that, Wednesday’s Federal Open Market Committee (FOMC) will be crucial as traders brace for a 0.75% rate hike from the Fed.
Technical analysis
Failure to cross the 21-DMA hurdle, around 136.80 by the press time, during the previous day’s rebound directs USD/JPY prices towards an upward sloping support line from early March, at 135.00 by the press time.
The minutes of the Bank of Japan showed that policymakers agreed on the need to maintain ultra-low interest rates to support a fragile economy, as Reuters reports, and ensure rising inflation was accompanied by higher wages, minutes of their June rate-setting meeting showed on Tuesday.
Key notes
''Some in the nine-member board, however, saw price rises broadening and leading to changes in long-held public perceptions that inflation and wages would not rise much in the future, the minutes showed.
At the June meeting, the BOJ maintained ultra-low interest rates and vowed to defend its cap on bond yields with unlimited buying, bucking a global wave of monetary tightening in a show of resolve to focus on supporting a tepid recovery.''
USD/JPY update
USD/JPY has been slightly offered in Tokyo as the US dollar continues to bleed out with 136.20 on the radar as a key pivot area on the bullish correction in the hourly time frame:
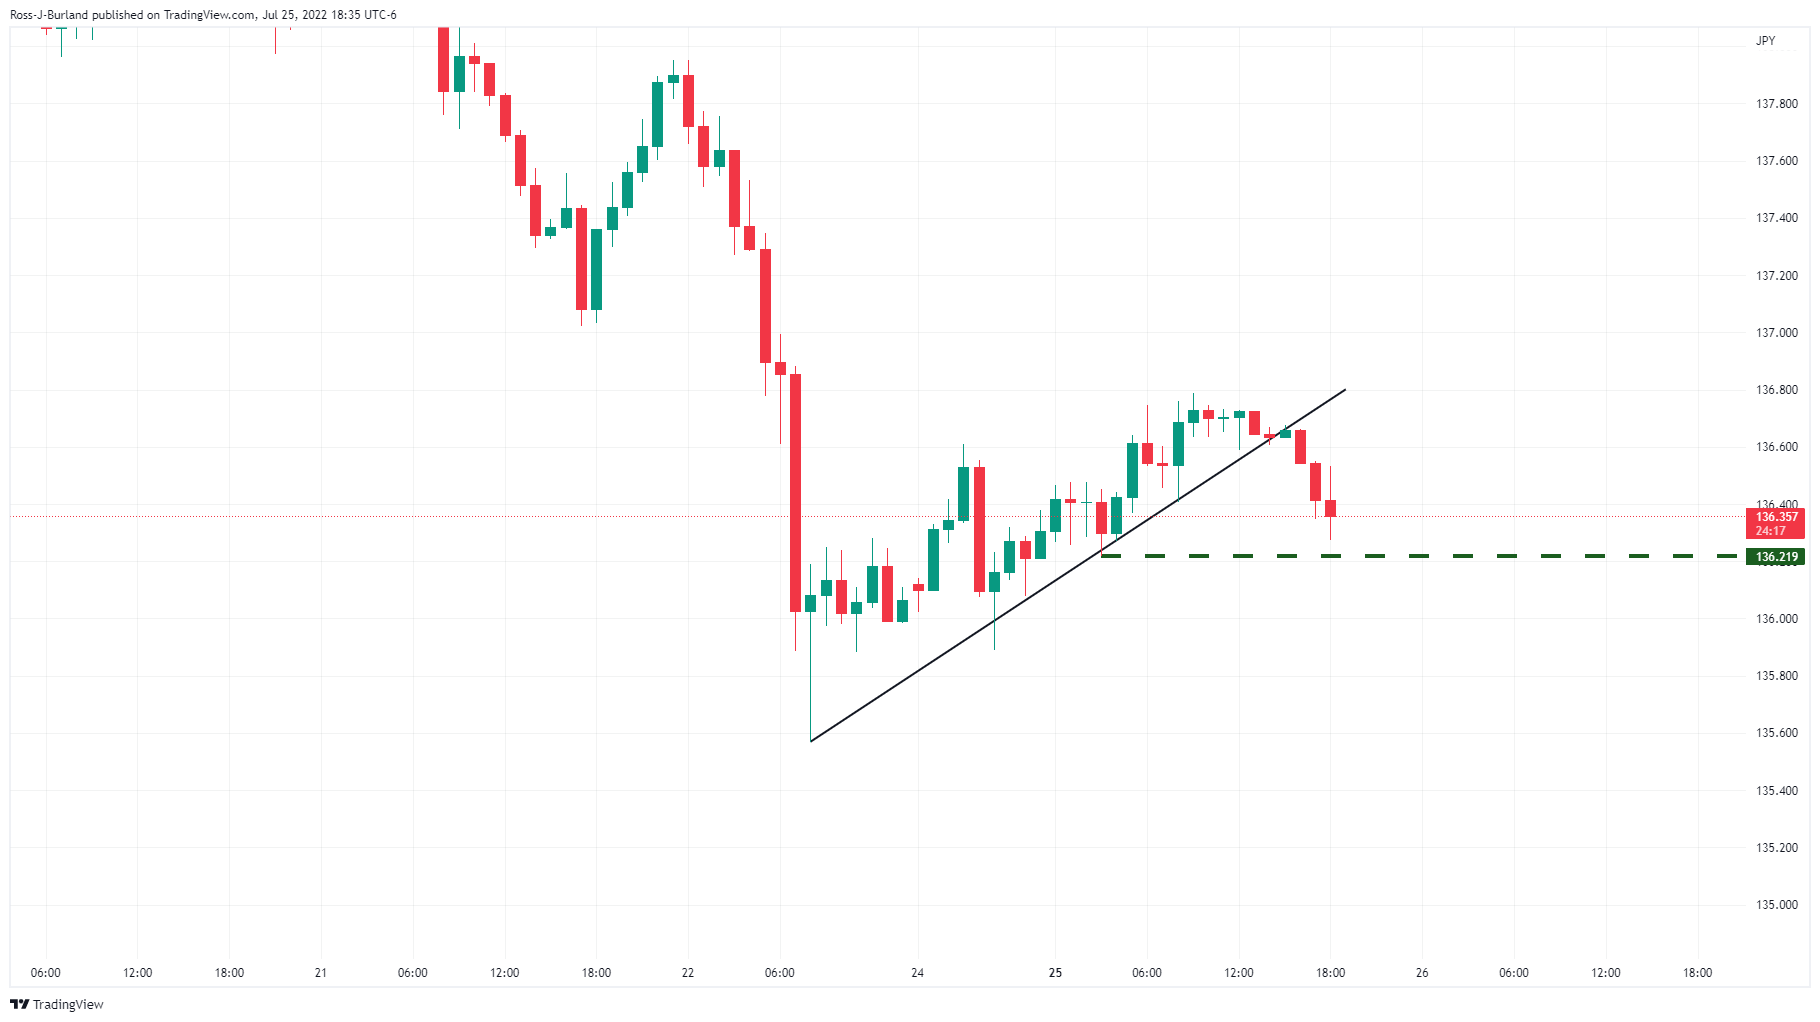
| Index | Change, points | Closed | Change, % |
|---|---|---|---|
| NIKKEI 225 | -215.41 | 27699.25 | -0.77 |
| Hang Seng | -46.2 | 20562.94 | -0.22 |
| KOSPI | 10.55 | 2403.69 | 0.44 |
| ASX 200 | -1.6 | 6789.9 | -0.02 |
| FTSE 100 | 29.9 | 7306.3 | 0.41 |
| DAX | -43.36 | 13210.32 | -0.33 |
| CAC 40 | 20.73 | 6237.55 | 0.33 |
| Dow Jones | 90.75 | 31990.04 | 0.28 |
| S&P 500 | 5.21 | 3966.84 | 0.13 |
| NASDAQ Composite | -51.44 | 11782.67 | -0.43 |
- EUR/USD is on the verge of a breakout one way or the other.
- The bulls could be tiring for the meanwhile which leaves scope for a meanwhile correction.
The euro bulls have been in charge at the start of the week but they could be tiring at this juncture. The following illustrates the prospects of a move lower in the meantime prior to the next leg higher for the medium term.
EUR/USD daily chart
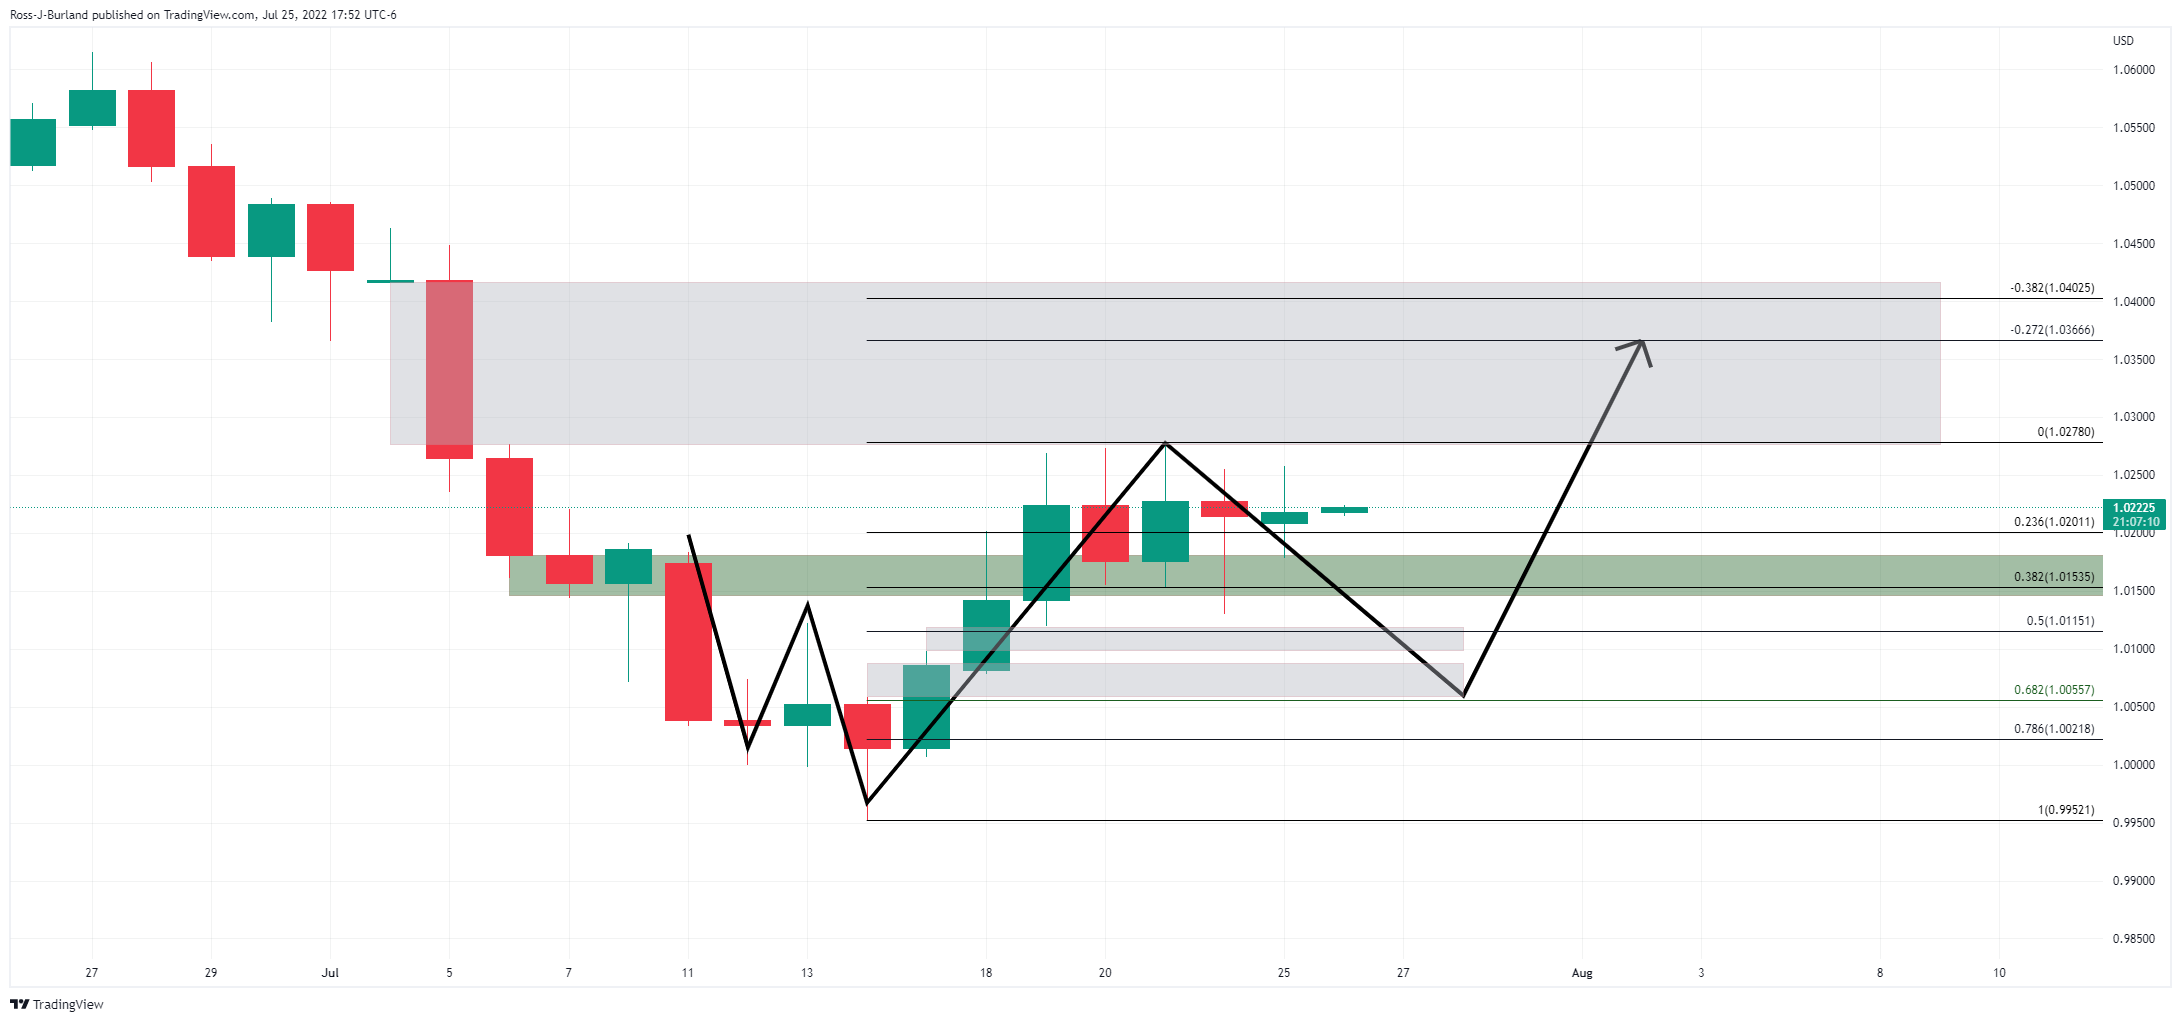
The daily chart's W-formation has yet to complete a retest of the neckline which leaves prospects on the table for some meanwhile mitigation of the price imbalance left behind following the bullish impulse. These are drawn as grey areas on the chart above and align with the Fibonaccis, with the 61.8% golden ratio a potential last stop.
EUR/USD H4 chart
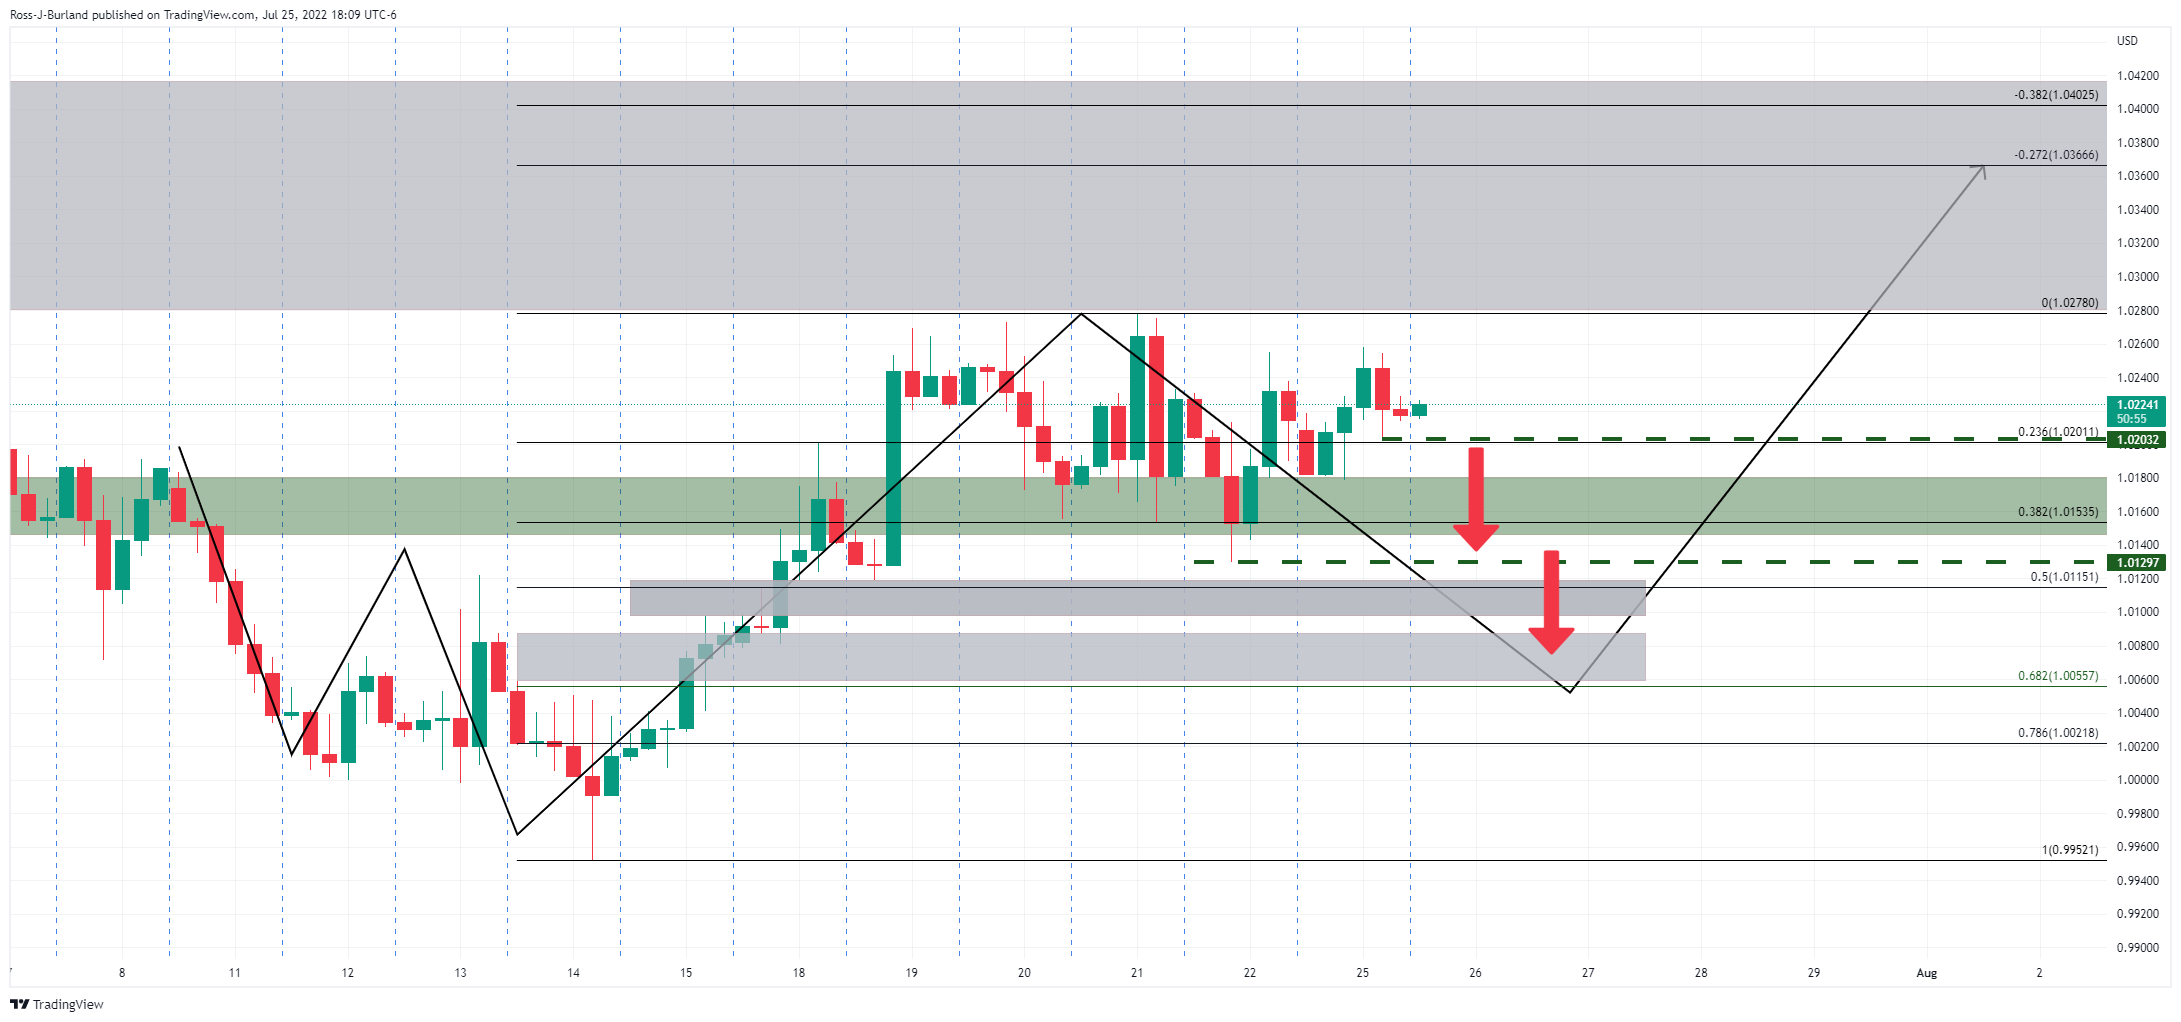
If the above were to play out, then the bears will need to commit to a break of the 1.0203 recent lows and 1.01297 below there on the 4-hour chart.
- Gold price is likely to display a firmer rebound s correction seems over.
- Higher jobless benefits and lower expectations for job additions may turn into a laborious job for the Fed.
- Big tech boys in the US may lay off some employees this year.
Gold price (XAUUSD) is likely to rebound after a steep correction to near $1,714.76 as oscillators have turned extremely oversold on a smaller timeframe. The precious metal witnessed a meaningful fall on Monday after failing to overstep the prior week’s high near $1,740.00. The gold prices have turned sideways and are likely to continue the sideways trend as investors are on the sidelines ahead of the interest rate policy by the Federal Reserve (Fed).
Investors should brace for a rate hike by 75 basis points (bps) as Fed chair Jerome Powell is dedicated to bringing price stability. Earlier, market participants were betting on a rate hike by 1% as price pressures have not displayed any sign of exhaustion and have climbed to 9.1% on an annual basis. However, signs of a slowdown in the US economy are not empowering the Fed policymakers to announce a mega rate hike.
The Initial Jobless Claims have reached a seven-month high to 251k as the costly US dollar index (DXY) has resulted in a significant fall in export business for the US and of course lower corporate earnings. After a halt in the recruitment process by tech giant Google; Meta, Spotify, and other big tech boys are favoring employees’ lay-off programs. This may keep the US Nonfarm Payrolls (NFP) data on the tenterhooks ahead. And, will strengthen the gold bulls.
Gold technical analysis
On an hourly scale, gold price has slipped below the 200-period Exponential Moving Average (EMA) at $1,720.43 after establishing above the same. This doesn’t imply a reversal but indicates a corrective move, which will be followed by an impulsive bullish wave.
It is worth noting that the Relative Strength Index (RSI) (14) displayed an establishment in the bullish range of 60.00-80.00 for the first time after a period of eight weeks. This indicates that the short-to-long term trend is bullish and a mild correction will be considered a buying opportunity by the market participants. Also, the RSI (14) is taking support at around 40.00.
Gold hourly chart

- AUD/USD struggles to defend recent gains amid mildly sour sentiment, sluggish session.
- Mixed concerns over the US, China recession battles latest downbeat US data to restrict immediate moves.
- Lack of major catalysts, cautious mood ahead of the key data also challenge momentum traders.
- US Consumer Confidence for July to decorate calendar, qualitative factors are the key.
AUD/USD portrays the market’s indecision ahead of the week’s key data/events as it fades the week-start bullish bias around 0.6950 during Tuesday’s Asian session. In addition to the anxiety before Wednesday’s Aussie quarterly inflation and the Federal Open Market Committee (FOMC) meeting, mixed concerns over the US recession and the Fed’s next moves also test the pair traders.
On Monday, softer US data joined the firmer equities to help the AUD/USD pair buyers to keep reins after the first weekly gains in four. That said, Chicago Fed National Activity Index reprinted -0.19 in June, versus a -0.03 forecast. Further, Dallas Fed Manufacturing Index for July slumped to the lowest levels since mid-2020 to -22.6 versus -12.5 expected and -17.7 prior.
Also fueling the AUD/USD quotes were mixed concerns over the Fed’s next move as Friday’s downbeat prints of the US activity numbers for July raised concerns that the US central bank may not be too aggressive.
In this regard, two US Treasury officials, namely Ben Harris, Treasury Assistant Secretary for Economic Policy and Neil Mehrotra, Deputy Assistant Secretary for Macroeconomics raised hopes for a firmer US Gross Domestic Product (GDP). The officials wrote, per Reuters, that gross domestic income (GDI), which measures aggregate income -- wages, business profits, rental and interest income -- continued to rise in the first quarter at a 1.8% annual pace, while GDP fell.
Earlier in the week, US Treasury Secretary Janet Yellen talked down fears of the US recession while saying, “A second quarter GDP contraction would not signal recession because of underlying job market strength, demand and other indicators of economic health.”
It’s worth noting that Bloomberg’s analysis suggests the Chinese recession concerns weighing on the economic slowdown at the major economies also drown the AUD/USD prices due to the closed trade links between Australia and China. “China’s economic slowdown is spilling over to major exporting nations in Europe and East Asia through falling demand for manufactured goods, causing Germany and South Korea to post rare deficits with the world’s second-largest economy,” said Bloomberg. On Monday, Australian Prime Minister Anthony Albanese requested China to remove its trade sanctions to begin repairing the fractured relationship.
While portraying the mood, Wall Street managed to close mixed, with Nasdaq posting mild losses versus the softer gains of the DJI30 and S&P 500. However, the US 10-year Treasury yields snapped a three-day downtrend and rose nearly 1.75% while regaining the 2.81% mark of late. It should be noted that the S&P 500 Futures drop 0.30% intraday by the press time.
Given the recently downbeat concerns and a lack of major catalysts, AUD/USD prices are likely to remain pressured. However, US CB Consumer Confidence for July, prior 98.7, appears to be the key for the pair traders to watch for the intraday directions.
Technical analysis
A downward sloping resistance line from early April and 50-DMA limit short-term AUD/USD upside around 0.6955 and 0.6975 in that order. The pullback moves, however, need validation from the 21-DMA level surrounding 0.6850 to convince bears.
| Pare | Closed | Change, % |
|---|---|---|
| AUDUSD | 0.69547 | 0.51 |
| EURJPY | 139.682 | 0.38 |
| EURUSD | 1.02197 | 0.04 |
| GBPJPY | 164.596 | 0.7 |
| GBPUSD | 1.20441 | 0.36 |
| NZDUSD | 0.62589 | 0.06 |
| USDCAD | 1.28464 | -0.58 |
| USDCHF | 0.96429 | 0.37 |
| USDJPY | 136.662 | 0.32 |


© 2000-2026. All rights reserved.
This site is managed by Teletrade D.J. LLC 2351 LLC 2022 (Euro House, Richmond Hill Road, Kingstown, VC0100, St. Vincent and the Grenadines).
The information on this website is for informational purposes only and does not constitute any investment advice.
The company does not serve or provide services to customers who are residents of the US, Canada, Iran, The Democratic People's Republic of Korea, Yemen and FATF blacklisted countries.
Making transactions on financial markets with marginal financial instruments opens up wide possibilities and allows investors who are willing to take risks to earn high profits, carrying a potentially high risk of losses at the same time. Therefore you should responsibly approach the issue of choosing the appropriate investment strategy, taking the available resources into account, before starting trading.
Use of the information: full or partial use of materials from this website must always be referenced to TeleTrade as the source of information. Use of the materials on the Internet must be accompanied by a hyperlink to teletrade.org. Automatic import of materials and information from this website is prohibited.
Please contact our PR department if you have any questions or need assistance at pr@teletrade.global.
transfers