- Analytics
- News and Tools
- Market News
CFD Markets News and Forecasts — 25-07-2022
- WTI fades bounce off one-week low below six-week-old resistance line, 100-SMA.
- Eight-day-old support line, fortnight-long horizontal area restrict short-term downside.
- Bulls need validation from $100.70 to retake control.
WTI crude oil prices drop back to $95.50 during Tuesday’s Asian session, after posting the first positive daily closing in four the previous day.
In doing so, the black gold retreats from the 50-SMA while recalling the bears. The downside bias also takes clues from the sluggish MACD and steady RSI.
However, an upward sloping trend line from July 14, around $92.80 by the press time, restricts the quote’s immediate weakness. Also acting as the downside filter is the two-week-old horizontal area near $91.60-80.
Should the WTI bears keep reins past $91.60, the odds of witnessing a slump towards the monthly low of $88.34, also the lowest level since February, can’t be ruled out.
Meanwhile, the upside break of the 50-SMA level, close to $96.15 at the latest, isn’t an open invitation to the WTI buyers as a convergence of the 100-SMA and a downward sloping resistance line from mid-June appear a tough nut to crack around $98.00.
Even if the quote manages to cross the $98.00 hurdle, the previous weekly high around $100.70 could test the upside momentum before giving control to the bulls.
WTI: Four-hour chart

Trend: Further weakness expected
- GBP/JPY is expected to display more gains after overstepping the critical hurdle of 165.00.
- The BOJ minutes are expected to remain extremely dovish.
- Pound bulls are performing well despite the downbeat Retail Sales data.
The GBP/JPY pair has displayed selling pressure in the early Tokyo session as investors are awaiting the release of the Bank of Japan (BOJ) minutes of July’s monetary policy. However, the upside remains favored as the minutes are expected to remain extremely dovish. Broadly, the asset has turned sideways in a 164.29-165.08 range after a sheer upside move from Monday’s low near 163.00.
It is worth noting that BOJ Governor Haruhiko Kuroda kept its interest rate policy unchanged last week. The BOJ is continued with its ultra-loose monetary policy in order to keep the inflation rate above the desired levels. However, its inability in elevating its wage rates is becoming a major hurdle and the inflation rate is above 2% seldom on the support of soaring price pressures.
What interesting would be in observing the BOJ minutes are the economic indicators, which will help in determining the economic situation of Japan.
On the UK front, pound bulls are performing against yen despite the weaker Retail Sales data on Friday. The annual economic data landed at -5.8%, lower than the expectations of -5.3% and the prior release of -4.7%. The investing community should be aware of the fact that higher price pressures are driving Retail Sales for now. And, a release of lower Retail Sales indicates that the overall demand is extremely weak.
- GBP/USD bulls are in control with eyes on the 1.22 areas.
- The price is stalling on the bid on the short-term, however.
GBP/USD is offering mixed signals across the time frames, from bullish on the weekly to meanwhile bearish lower down on the 4-hour, but ultimately the bulls are in control. The following illustrates the prospects of a correction in the coming hours from which bulls might appear in droves for a continuation into the 1.22 areas.
GBP/USD weekly chart
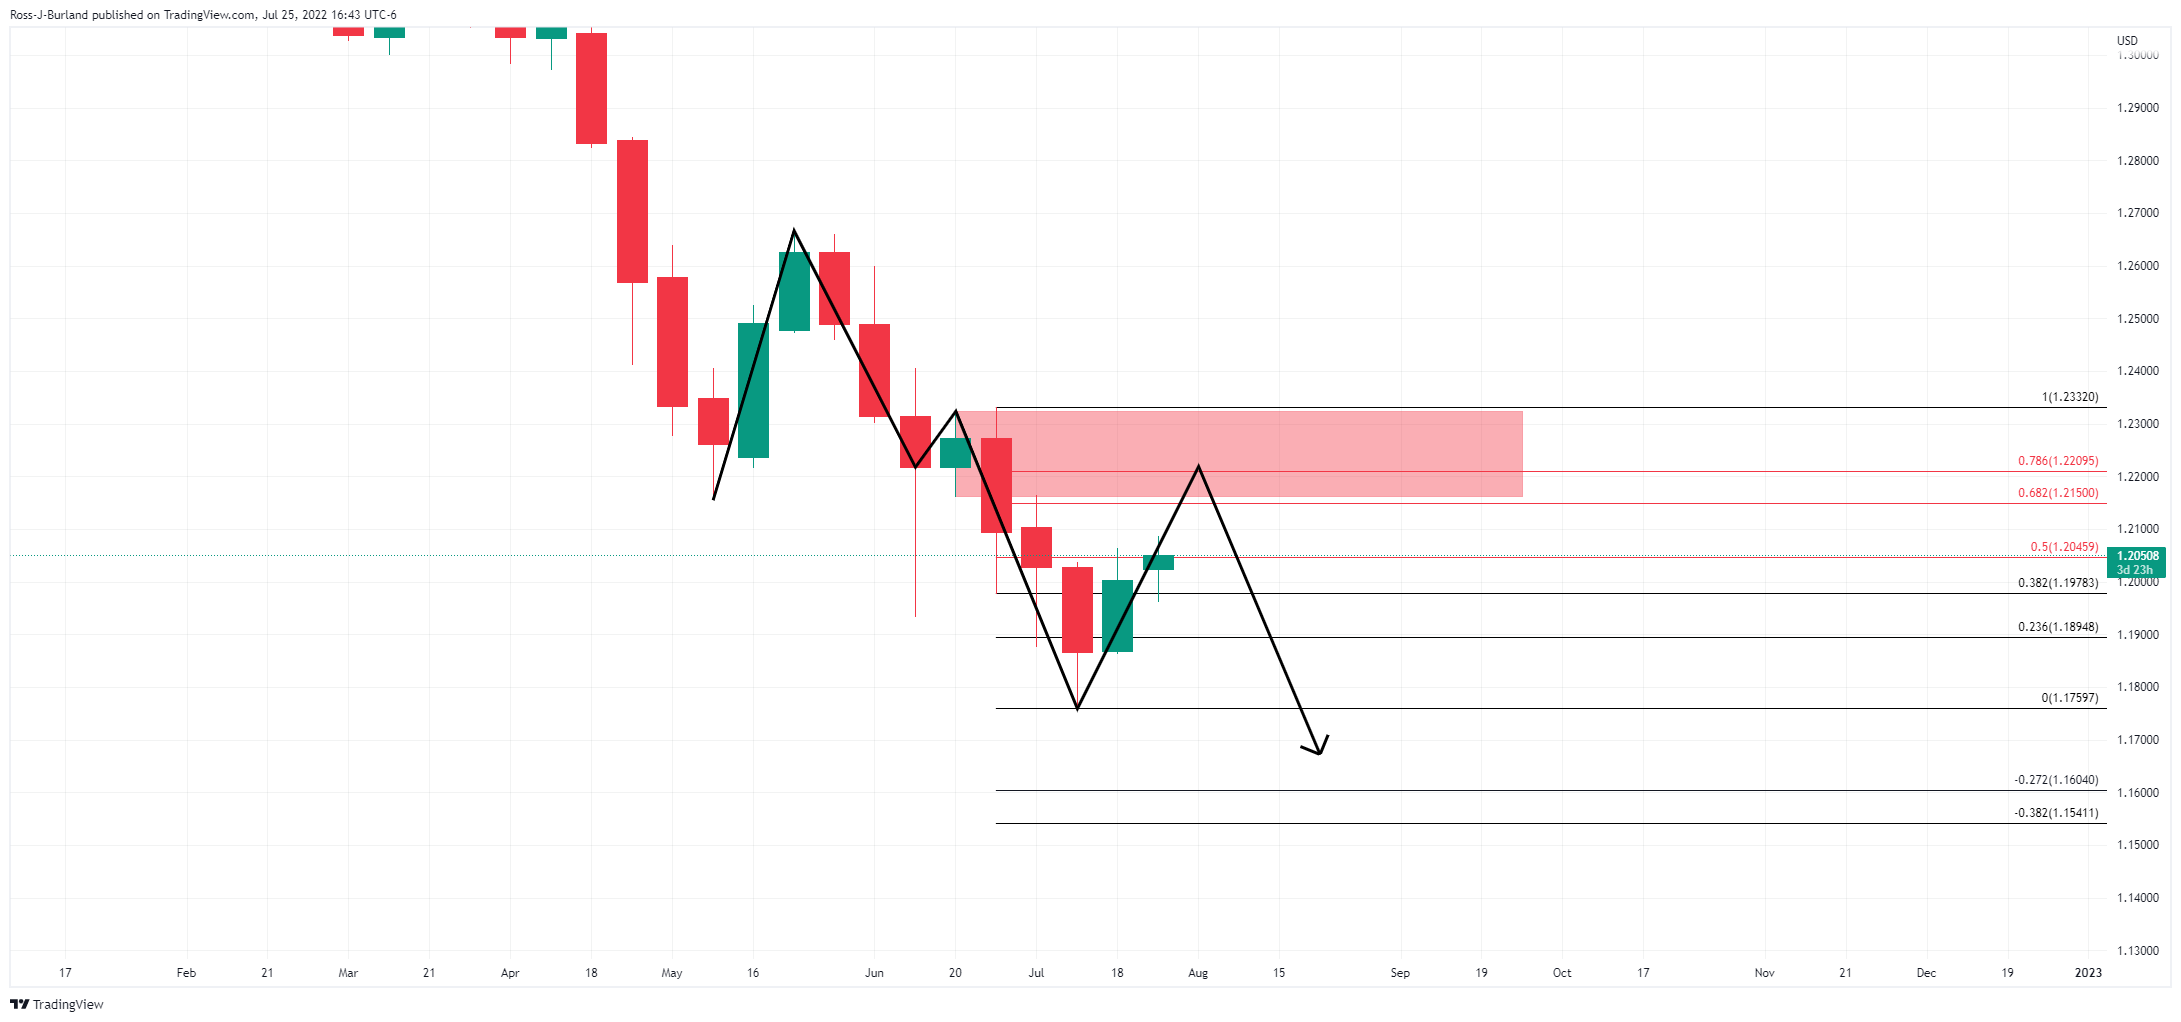
The weekly chart's M-formation's neckline is a compelling target area for the bulls to aim for where it aligns with key Fibonaccis.
GBP/USD daily chart
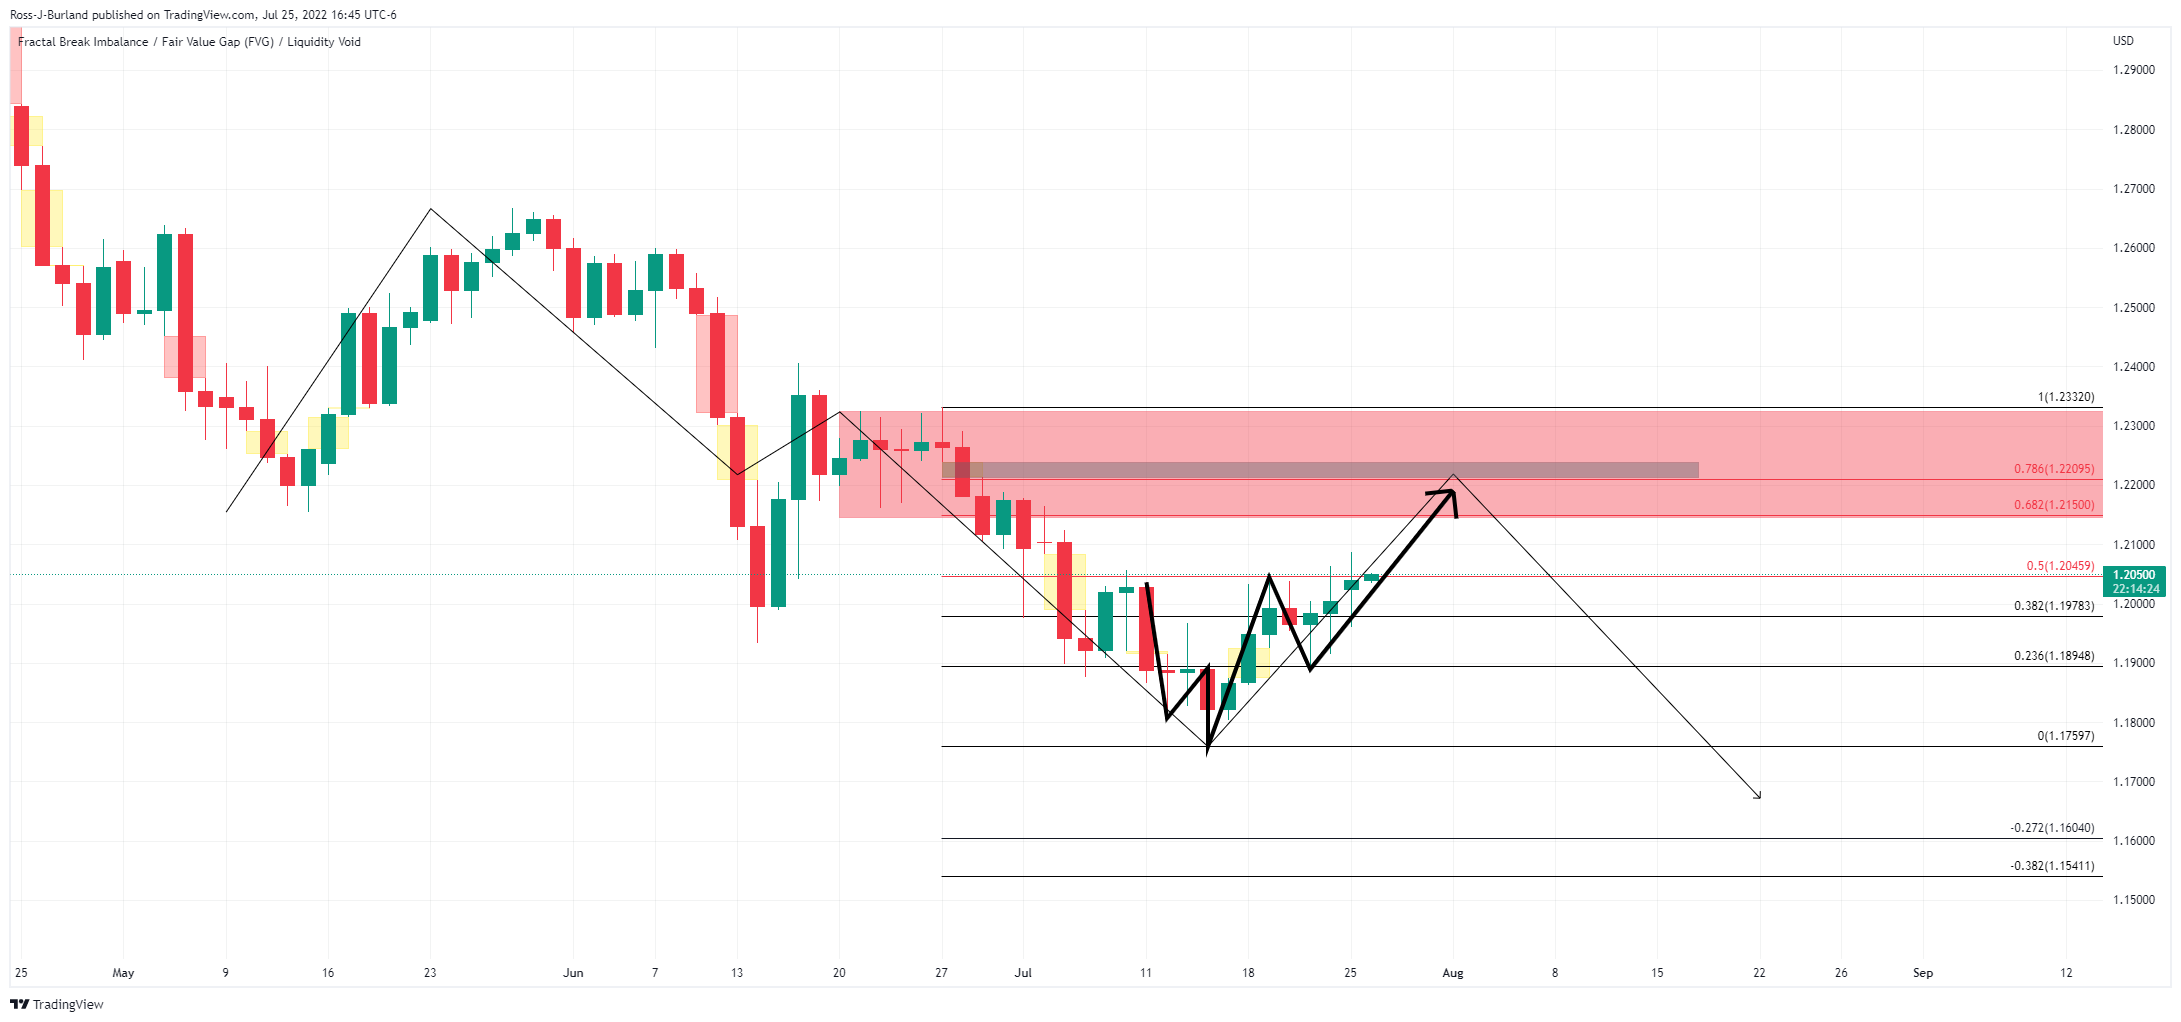
Within the resistance area, there is a price imbalance on the daily chart which could lure the price in following the recent rally from the neckline of the W-formation.
GBP/USD H4 chart
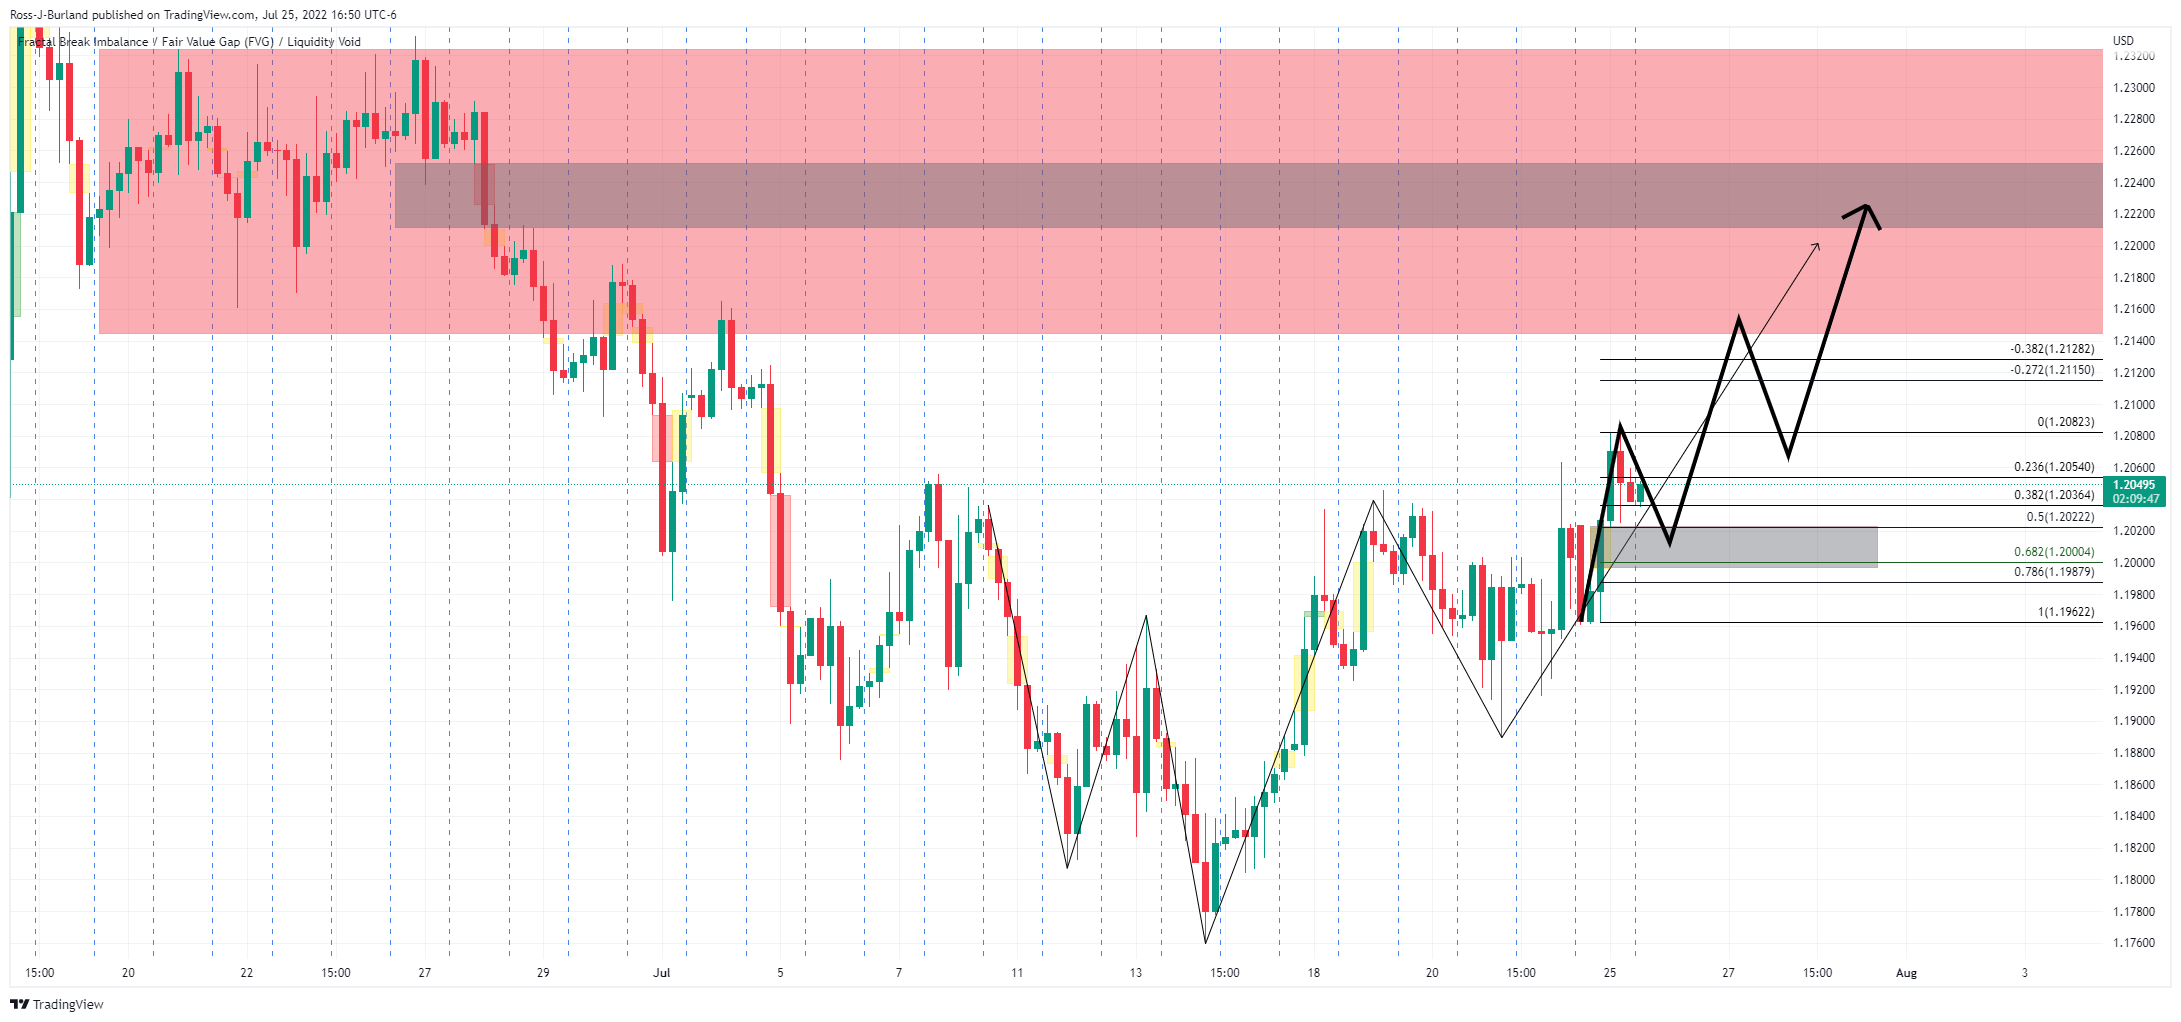
The 4-hour chart has a price imbalance just below the recent lows as per the greyed-out area. A move into mitigating this where the 61.8% Fibo lies could be the next move on the cards before bulls fully engage.
- NZD/USD bulls take a breather around monthly high, probes two-day uptrend.
- Fears of firmer US GDP, hawkish Fed challenge Kiwi pair buyers.
- Firmer sentiment, downbeat US data offered positive start to the key week.
- US Consumer Confidence for July will decorate calendar, risk catalysts are the key.
NZD/USD fades upside momentum as it takes rounds to 0.6260 during Tuesday’s Asian session. In doing so, the Kiwi pair remains near the monthly high flashed on Friday but snaps the two-day uptrend as traders await the key data/events amid a sluggish session.
The quote witnessed a softer start to the week comprising the Federal Open Market Committee (FOMC) meeting amid a light calendar and mixed concerns over the US economic conditions.
That said, Chicago Fed National Activity Index reprinted -0.19 in June, versus -0.03 forecast. Further, Dallas Fed Manufacturing Index for July slumped to the lowest levels since mid-2020 to -22.6 versus -12.5 expected and -17.7 prior.
Even so, two US Treasury officials, namely Ben Harris, Treasury Assistant Secretary for Economic Policy and Neil Mehrotra, Deputy Assistant Secretary for Macroeconomics raised hopes for a firmer US Gross Domestic Product (GDP). The officials wrote, per Reuters, that gross domestic income (GDI), which measures aggregate income -- wages, business profits, rental and interest income -- continued to rise in the first quarter at a 1.8% annual pace, while GDP fell.
Previously, US Treasury Secretary Janet Yellen talked down fears of the US recession while saying, “A second quarter GDP contraction would not signal recession because of underlying job market strength, demand and other indicators of economic health.”
It’s worth noting that the inversion between the 10-year and the 2-year US Treasury yields, as well as the recently high inflation expectations, per the 10-year breakeven inflation rate per the St. Louis Federal Reserve (FRED) data, highlight fears of recession and the Fed’s aggression.
Against this backdrop, Wall Street managed to close mixed, with Nasdaq posting mild losses versus the softer gains of the DJI30 and S&P 500. However, the US 10-year Treasury yields snapped a three-day downtrend and rose nearly 1.75% while regaining the 2.81% mark of late. It should be noted that the S&P 500 Futures drop 0.30% intraday by the press time.
Moving on, US CB Consumer Confidence for July, prior 98.7, appears to be the key for the pair traders to watch for the short-term directions. However, major attention will be given to the pre-Fed chatters and growth related talks will be crucial to watch for clear directions. Additionally important will be the US New Home Sales for June, Richmond Fed Manufacturing Index for July and House Price Index data for May.
Technical analysis
NZD/USD remains sidelined between the 21-DMA and the 50-DMA, respectively around 0.6195 and 0.6315.
US inflation expectations, as per the 10-year breakeven inflation rate per the St. Louis Federal Reserve (FRED) data, rose for the second consecutive day by the end of Monday’s North American session. That said, the inflation gauge recently flashed the 2.36% mark, reversing the previous week’s losses of late.
The recovery in the long-term inflation expectations gain major should ideally help the US dollar as traders brace for this week’s Federal Open Market Committee (FOMC) meeting. However, the difference between the 2-year Treasury yields and the 10-year Treasury yields remain negative, known as the yield curve inversion, which in turn raises concerns over the US recession and challenges the USD bulls.
That said, the US 10-year Treasury yields snapped a three-day downtrend and rose nearly 1.75% while regaining the 2.81% mark of late. On the other hand, the 2-year Treasury yields marked the 3.01% figures at the latest.
It should be noted that the two US Treasury officials, namely Ben Harris, Treasury Assistant Secretary for Economic Policy and Neil Mehrotra, Deputy Assistant Secretary for Macroeconomics, recently raised hopes for a firmer US Gross Domestic Product (GDP). Earlier, US Treasury Secretary Janet Yellen talked down fears of the US recession earlier while saying, “A second quarter GDP contraction would not signal recession because of underlying job market strength, demand and other indicators of economic health.”
Also read: EURUSD price steadies above 1.0200 with eyes on US Consumer Confidence, Fed
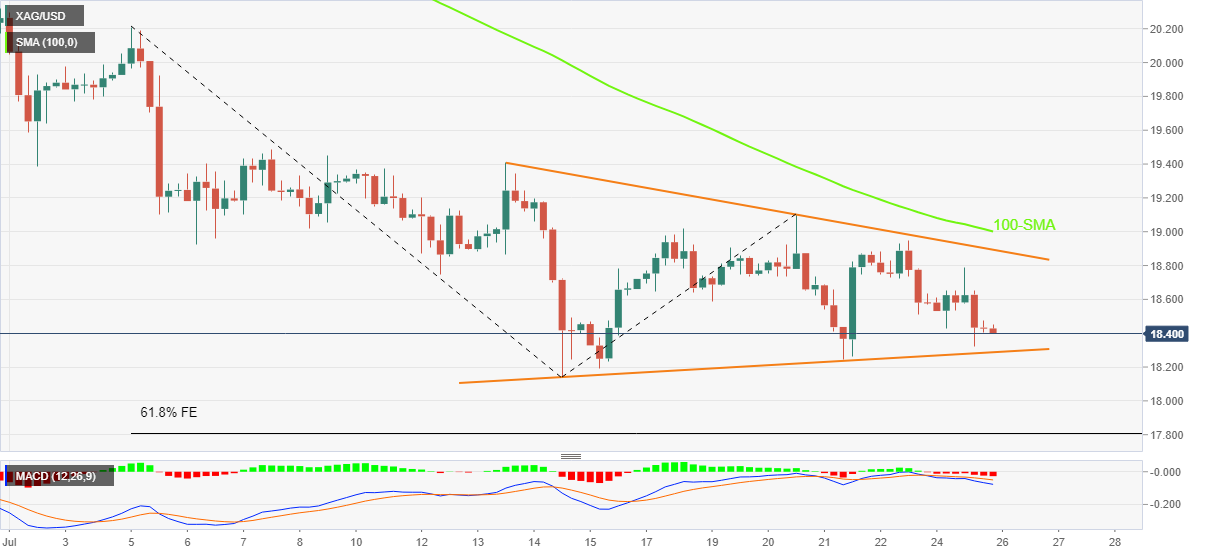
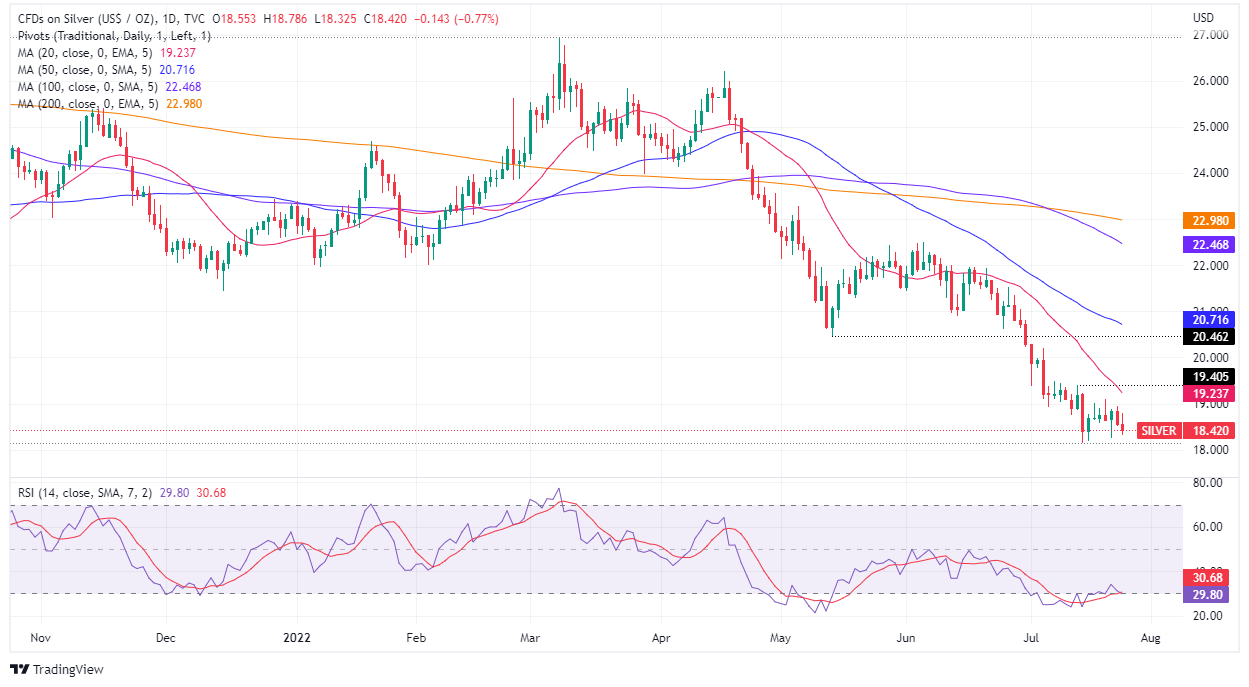
- Silver remains pressured for the third consecutive day inside short-term symmetrical triangle.
- Bearish MACD signals, sustained trading below 100-SMA keep sellers hopeful.
- Mid-month high, 61.8% FE act as extra filters to trade.
Silver price (XAG/USD) remains depressed at around $18.40 inside a two-week-old symmetrical triangle. That said, the bright metal recently approaches the stated triangle’s support line.
Given the bearish MACD signals and the quote’s successful trading below the 100-SMA, XAG/USD is likely to witness further downside.
That said, the triangle’s lower line, around $18.25, appears the immediate support to watch for the metal traders.
Following that, the $18.00 threshold and the 61.8% Fibonacci Expansion (FE) of July 05-20 moves, near $17.80, could challenge silver bears.
In a case where the XAG/USD prices remain weak past $17.80, the odds of witnessing a south-run towards the June 2020 low near $16.95 can’t be ruled out.
Alternatively, the aforementioned triangle’s upper line, around $18.90, precedes the $19.00 round figure, also comprising the 100-SMA, which restricts the XAG/USD pair’s short-term upside moves.
If the silver buyers keep reins past $19.00, the mid-July swing high near $19.40 and the $20.00 psychological magnet will be on their radars afterward.
Overall, silver remains pressured around a multi-month low but the short-term triangle may restrict immediate moves.
Silver: Four-hour chart
Trend: Further weakness expected
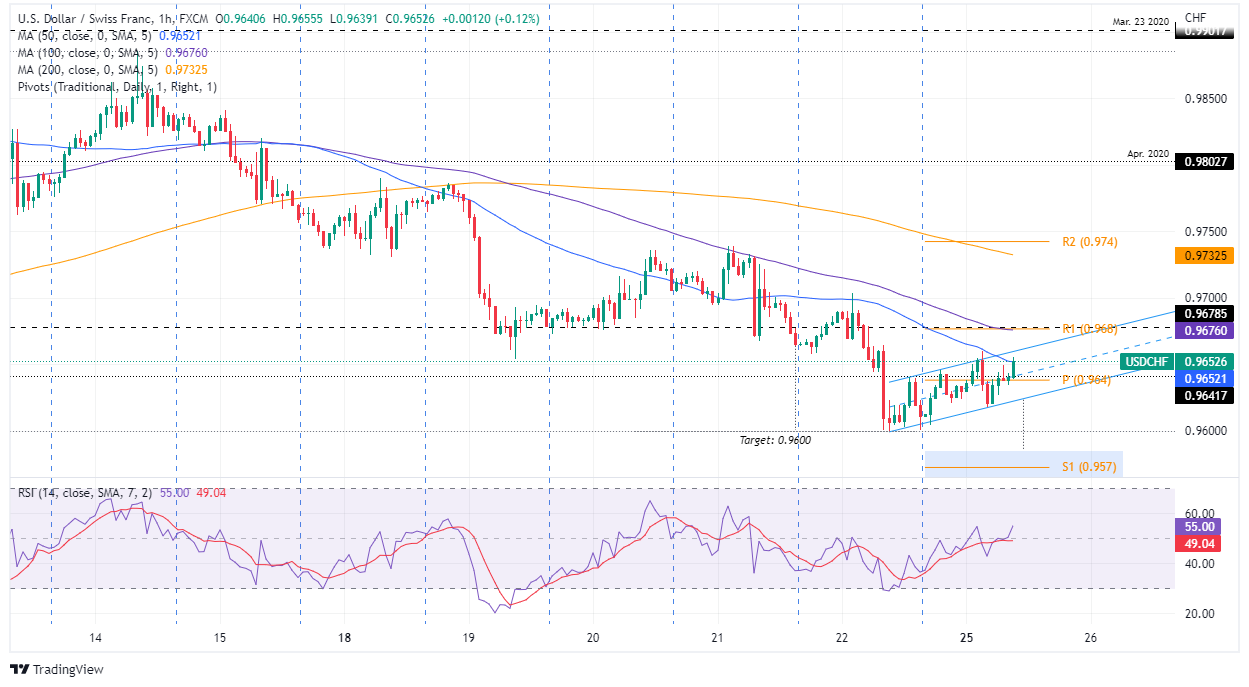
- USD/CHF is juggling in a 0.9633-0.9648 range as focus shifts to Fed policy.
- A divergence in US Retail Sales data and the US Durable Goods Orders data may impact the DXY.
- The Fed will most likely dictate a consecutive 75 bps rate hike.
The USD/CHF pair is auctioning in a minute range of 0.9633-0.9648 from the late New York session after failing to cross the critical hurdle of 0.9660. The asset is expected to keep juggling ahead as investors are awaiting the announcement of the interest rate decision by the Federal Reserve (Fed), which is due on Wednesday.
On a broader note, the asset has remained in the grip of bears as the US dollar index (DXY) has remained vulnerable over the past week. The DXY has established below the critical support of 107.00 and is likely to deliver more downside as the Federal Reserve (Fed) is not expected to remain ambitious this time.
Softer earnings from big tech boys and a decline in overall demand due to soaring price pressures are going to weaken Fed policymakers in making a bold announcement. However, maintenance of the status quo looks imminent.
Apart from the Fed policy, the US Durable Goods Orders data will also fetch investors’ sight. The economic data is expected to display a vulnerable performance as a downward shift to -0.2% vs. 0.8% signals a huge deviation.
It is worth noting that July’s Retail Sales print remained at 1%, significantly higher than the consensus and former print. A huge divergence between Retail Sales data and US Durable Goods Orders data indicates that soaring energy bills and costly food products were responsible for higher former economic data and overall demand is vulnerable.
On the Swiss franc front, the release of Real Retail Sales will hog the limelight. Earlier, the economic data landed at -1.6%. The economic catalyst is expected to remain higher as soaring energy bills and prices of food products will elevate Real Retail Sales. However, a slippage in the economic data will indicate a major slump in the overall demand. This may weaken the Swiss franc bulls ahead.
- EUR/JPY begins the week on the right foot, up by 0.49%.
- EUR/JPY Price Analysis: Short term is downwards-to-neutral, and a break below 139.47 would tumble the cross towards 138.00.
The EUR/JPY recovers some ground lost last Friday but faces solid resistance at the confluence of the 20 and 50-day EMA around 139.72-74, amidst a risk-off impulse. Sentiment shifted sour on Russia’s Gazprom reducing natural gas flows by half to 20% through Nord Stream 1 pipeline, alongside the Federal Reserve tightening policy by 75 bps late in the week, keeps investors on their toes. At the time of writing, eh EUR/JPY is trading at 139.63.
EUR/JPY Price Analysis: Technical outlook
The EUR/JPY is neutral-to-upward biased, as illustrated by the daily chart. Buyers unable to reclaim the July 21 high at 142.32 left the pair exposed to selling pressure. Further, oscillators like the Relative Strenght Index (RSI) at 48.74 shifted downwards, meaning that Monday’s correction might be a better entry price for EUR/JPY sellers, as they aim to drag prices lower, with their first target being the 100-day EMA at 137.35.
EUR/JPY 1-hour chart
The EUR/JPY hourly chart illustrates the pair as downwards-to-neutral. On Monday, the EUR/JPY buyers could not break above the 200-hour EMA at 139.97 three times. On their third attempt, EUR/JPY sellers stepped in and tumbled the price towards 139.41. Nevertheless, the downtrend lost steam; since then, it settled above the daily pivot point at 139.47.
Therefore, the EUR/JPY first support would be the daily pivot. Once broken, the cross next support would be the S1 daily pivot at 138.587, followed by the July 24 daily low at 138.71, and then the 138.00 mark.

EUR/JPY Key Technical Levels
- EURUSD stays inside weekly trading range after a softer start to the key week.
- Bulls and bears jostle as German IFO, US activity/sentiment numbers both came in downbeat.
- Fears of economic slowdown in the bloc probe Euro bulls while pre-Fed anxiety, firmer equities challenge greenback’s upside.
- US CB Consumer Confidence for July will be important to watch for fresh impulse.
EURUSD price remains sidelined at around 1.0220, keeping the one-week-old trading range, as traders await fresh clues after a sluggish start to the key week. That said, the major currency pair trades between 1.0130 and 1.0280 in the last week with eyes on Wednesday’s Federal Open Market Committee (FOMC). It’s worth noting that the mildly positive performance of the Wall Street and downbeat economics from the US and Eurozone restricted the quote’s latest moves.
Recently, two US Treasury officials, namely Ben Harris, Treasury Assistant Secretary for Economic Policy and Neil Mehrotra, Deputy Assistant Secretary for Macroeconomics raised hopes for a firmer US Gross Domestic Product (GDP). The officials wrote, per Reuters, that gross domestic income (GDI), which measures aggregate income -- wages, business profits, rental and interest income -- continued to rise in the first quarter at a 1.8% annual pace, while GDP fell.
It’s worth noting that US Treasury Secretary Janet Yellen talked down fears of the US recession earlier while saying, “A second quarter GDP contraction would not signal recession because of underlying job market strength, demand and other indicators of economic health.”
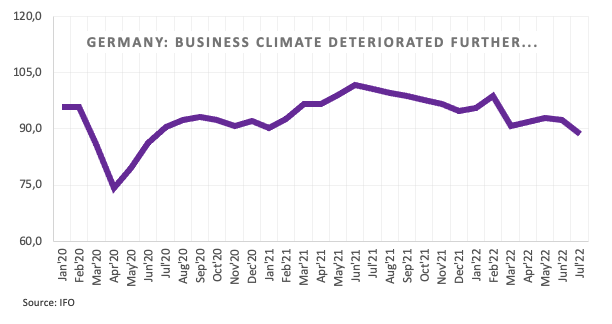
On the other hand, downbeat prints of the German IFO Sentiment data for July pushed IFO Economist Klaus Wohlrabe to mention, “Germany is on brink of recession.” It should be noted that the German IFO Business Climate Index slumped to 88.6 in July versus market forecasts of 90.5 and the previous monthly print of 92.2.
Not only the German figures but the US data was also downbeat as Chicago Fed National Activity Index reprinted -0.19 in June, versus -0.03 forecast. Further, Dallas Fed Manufacturing Index for July slumped to the lowest levels since mid-2020 to -22.6 versus -12.5 expected and -17.7 prior.
Amid these plays, Wall Street managed to close mixed, with Nasdaq posting mild losses versus the softer gains of the DJI30 and S&P 500. However, the US 10-year Treasury yields snapped a three-day downtrend and rose nearly 1.75% while regaining the 2.81% mark of late.
Moving on, a light calendar in Europe may keep the EURUSD price inside the aforementioned trading range. However, today’s US CB Consumer Confidence for July, prior 98.7, appears to the key for the pair traders to watch. Also important will be the US New Home Sales for June, Richmond Fed Manufacturing Index for July and House Price Index data for May. Above all, the pre-Fed chatters and growth related talks will be crucial to watch for clear directions.
Technical analysis
EUR/USD dribbles between the 10-DMA and the 21-DMA, respectively around 1.0160 and 1.0230. That said, the recently firmer RSI and MACD signals hint at the pair’s further upside.
- USD/CAD is minutely higher than weekly lows at around 1.2830, downside looks likely ahead.
- The Fed is expected to announce a consecutive rate hike by 75 bps.
- Oil prices have rebounded firmly as the DXY has extended losses.
The USD/CAD pair has displayed a less-confident rebound after testing its weekly lows at 1.2835 in early Tokyo. The asset displayed a steep fall on Monday after sensing tough hurdles at around 1.2940. On a broader note, the asset has turned into a balancing mode, which covers a wide range of 1.2835-1.2940 and is likely to display a downside break as the overall has remained bearish.
The responsiveness of weakness in the USD/CAD pair seems higher than the US dollar index (DXY), which indicates that the Canadian dollar is also extremely strong and is dragging the asset swiftly. A rebound move has been witnessed in the DXY, however, the asset will remain on the back foot as pre-anxiety of investors ahead of the Federal Reserve (Fed) monetary policy has cooled off.
Odds of a rate hike by 100 basis points (bps) are not in sight as the long-run inflation expectations have trimmed and the US economic data is displaying a bumpy ride ahead. This will compel Fed chair Jerome Powell, not to get too much ambitious and follow a status-quo structure rather than going all in.
On the loonie front, higher-than-expected Retail Sales have failed to support the loonie bulls. It is worth noting that the economic data was highly contaminated by a whopping 8.1% inflation rate. Higher Consumer Price Index (CPI) has driven the economic data vigorously. Apart from that, the rate hike of 1% by the Bank of Canada (BOC) indicates that the inflation situation is beyond the control of the administration for now.
Meanwhile, the oil prices have rebounded firmly on a weaker DXY. The black gold has picked bids around $92.60, however, the overall structure is still bearish as the US economy may report an increment in employment generation at a minimal rate. Google has halted its recruitment process for the past two weeks and Ford is planning for retrenchment of 8k jobs ahead.
Foreign secretary Liz Truss will promise on Tuesday to bring in "tough and decisive action" to limit strike action by trade unions if she becomes Britain's next prime minister, the latest salvo in a divisive fight to lead the Conservative Party, per Reuters. The news conveyed comments from a statement as the UK PM race intensifies.
Key comments
We need tough and decisive action to limit trade unions’ ability to paralyze our economy.
I will do everything in my power to make sure that militant action from trade unions can no longer cripple the vital services that hard-working people rely on.
GBP/USD bulls take a breather
GBP/USD grinds higher around 1.2050, after refreshing the monthly peak with 1.2086 the previous day.
“US Treasury officials said on Monday overall income and jobs figures suggested the economy was in good health and not in a recession, even if data due this week shows gross domestic product falling for a second consecutive quarter,” reported Reuters.
Key quotes
Ben Harris, Treasury assistant secretary for economic policy and Neil Mehrotra, deputy assistant secretary for macroeconomics, wrote that gross domestic income (GDI), which measures aggregate income -- wages, business profits, rental and interest income -- continued to rise in the first quarter at a 1.8% annual pace, while GDP fell.
They said while second quarter GDI data will not be available until the end of August, some GDI components, including employee compensation, proprietors income and rental income, show increases for the quarter. Tax receipts also suggest strong corporate income growth, the officials added.
Their comments came a day after U.S. Treasury Secretary Janet Yellen said a second quarter GDP contraction would not signal recession because of underlying job market strength, demand and other indicators of economic health.
FX implications
EUR/USD remains unfazed by the news as it takes rounds to 1.0220 after a sluggish start to the week.
- Inventory distribution near monthly highs indicates aussie bulls are gearing up for more highs.
- Ascending 50- and 200- EMAs add to the upside filters.
- A violation of 60.00 by the RSI (14) will strengthen the aussie bulls.
The AUD/USD pair has carry-forwarded its back and forth move structure in the Tokyo session after remaining lackluster in New York. The asset is oscillating in a narrow range of 0.6950-0.6963 and is likely to give a decisive break ahead.
After correcting from its monthly high of 0.6977, the major has rebounded sharply and is forming an inventory distribution structure. A formation of an above-mentioned structure near monthly highs indicates initiation of longs by the market participants who prefer to enter into an auction after the establishment of a bias.
The 50-and 200-period Exponential Moving Averages (EMAs) at 0.6952 and 0.6926 are advancing sharply, which indicates that the long-term trend is bullish.
Meanwhile, the Relative Strength Index (RSI) (14) has sifted in a 40.00-60.00 range, which signals a consolidation ahead. Also, the asset is looking for a potential trigger for a decisive move.
A decisive move above Monday’s high at 0.6965 will drive the asset towards the psychological resistance at 0.7000. A breach of the latter will infuse fresh blood and the asset may record a high of June 16 high at 0.7069.
On the flip side, a steep fall below the round-level support of 0.6800 will strengthen the greenback bulls. This may decline the pair towards July 13 low at 0.6724, followed by July 14 low at 0.6680.
AUD/USD hourly chart
-637943830958543091.png)
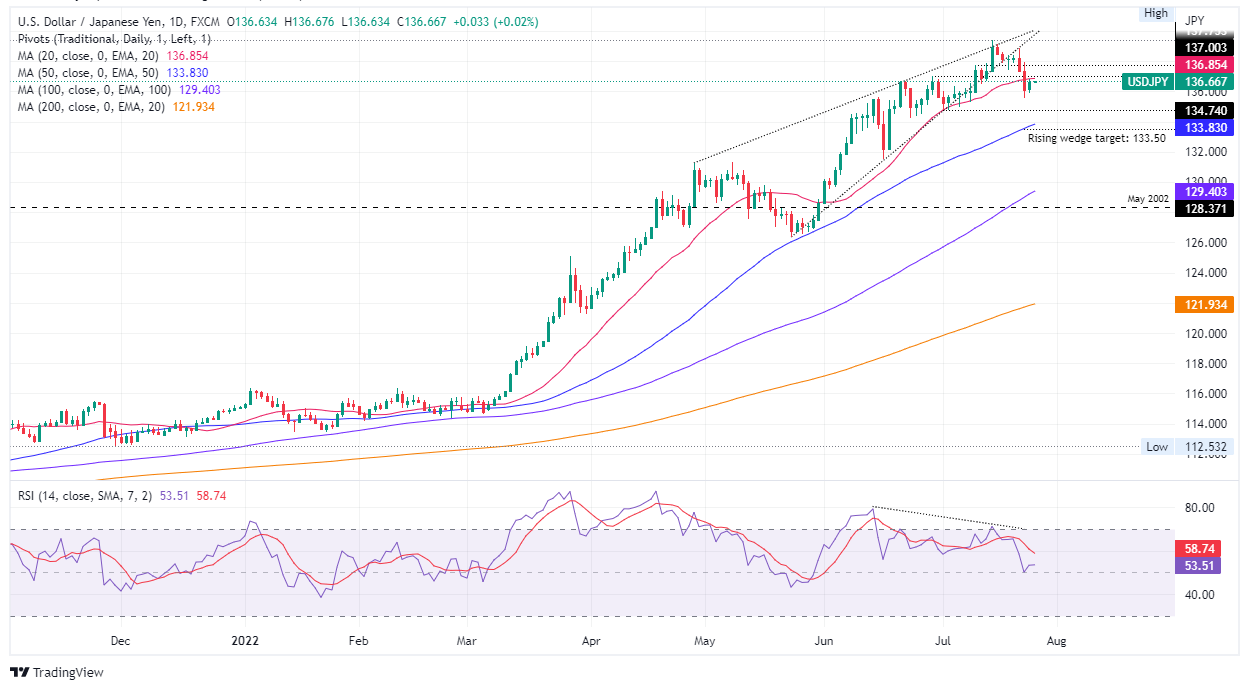
- USD/JPY rises 0.02% for the second straight day as the Asian session begins.
- Russia’s Gazprom reducing natural gas flows to Europe, alongside the FOMC meeting looming, shifted sentiment sour.
- USD/JPY Price Analysis: Neutral biased, but a break below 134.74 to tumble the pair lower; otherwise, buyers eyeing 137.00.
The USD/JPY trims some of last Friday’s losses and edges up 0.42% as the New York session winds down. At the time of writing, the USD/JPY is trading at 136.65, below the 20-day EMA, as the Asian session takes over amidst a negative market sentiment.
USD/JPY rose on bad US data and mood
Investors’ mood dampened on news that Russia’s Gazprom halted one engine at the Nord Stream 1 pipeline, declining gas flows to 20%. The USD/JPY might remain choppy trading ahead of the US Federal Reserve Open Market Committee monetary policy meeting, where Powell & co. are expected to hike 75 bps the Federal funds rate (FFR).
Money market futures STIRs have fully priced in a 0.75% increase. Regarding a whole 1% hike, odds are at a 10% chance. Nevertheless, traders would lean onto the US 10-year Treasury yield reaction due to its close correlation with the USD/JPY.
On Monday, US economic data led by the Chicago National Activity Index further reinforced a recessionary scenario, tumbling for a second straight month to -0.9. Additionally, the Dallas Fed Manufacturing Index for July plunged -22.6 from -17.7 in June.
On the Japanese side, the Bank of Japan (BoJ) welcomed two new members, Takata and Tamure. In his first speech as a BoJ member, Takata said that the bank can keep monetary policy easy but is facing new challenges such as dwindling bank margins and the impact on market functions. In the meantime, Tamura said that Japan might soon see a positive cycle with wages increasing alongside inflation. He added that if that occurred, we would begin discussing an exit to easy policies.
What to watch
On Tuesday, the Japanese calendar will reveal the Bank of Japan's last monetary policy minutes. On the US front, the docket will feature US Consumer Confidence and New Home Sales.
USD/JPY Price Analysis: Technical outlook
The USD/JPY daily chart depicts the pair is upward-to-neutral biased, despite sliding below the 20-day EMA at 136.85. To shift the bias to neutral, or neutral-to-bearish, USD/JPY sellers need to reclaim the July 1 low at 134.74. Once cleared, the major would drop towards the 50-day EMA at 133.83.
- NZD/USD bulls stay in charge ahead of a busy week.
- The Fed is the showdown event among a number of key data.
In a slow start to the week, NZD/USD is up towards the end of the New York session, higher by 0.27% on the day after rising from a low of 0.6214 to a high of 0.6279. The US dollar was pressured vs. a basket of rival and major currencies on Monday as investors moved to the sidelines.
The Fed is widely expected to raise interest rates by 75 basis points at the conclusion of its policy meeting on Wednesday. However, the concerns are stemming from recent data that is showing that the world's largest economic power could be headed for a recession. On Friday, data showed that the US Composite PMI Output Index fell far more than expected to 47.5 this month from a final reading of 52.3 in June.
''The Kiwi gained overnight in uneven market conditions,'' analysts at ANZ Bank said. ''Data over the rest of the week may prove to be pivotal for medium-term levels for the NZD,'' the analysts advise. ''How hawkish the FOMC is, along with US data on wages and inflation, may set the tone for DXY. And domestically, ANZBO is likely to be very important for getting a read on how the Reserve Bank of New Zealand’s hikes are feeding into price pressures and activity.''
In the US, traders will be paying attention to the advance reading for second-quarter Gross Domestic Product, for one. If this were to show negative growth, the US will be showing a traditional definition of recession. We then have the Fed's preferred inflation measure which will be released in the form of Personal Consumption Expenditures, PCE.
- AUD/JPY begins the week on the right foot and rises almost 1%.
- Investors’ mood turned sour late in the New York session due to US corporate earnings and Gazprom reducing gas flows in NS 1.
- AUD/JPY Price Analysis: Break below 95.00 would tumble the pair to 93.80s; otherwise, a challenge at 97.00 is on the cards.
AUD/JPY erases last Friday’s losses due to a risk-sensitive appetite in the FX space and edges up by 0.90%. The cross-currency pair began trading around 94.20 and dived to its daily low at 93.89 before rallying sharply above the 95.00 figure. At the time of writing, the AUD/JPY is trading at 95.07.
Sentiment deteriorated, and US equities finished with losses. Gazprom reduced NatGas flows through the Nord Stream 1 pipeline to 20%, painting a complex picture in the EU and fueling recession worries in the block area. The US Federal Reserve Interest Rate decision would keep traders’ moods fragile as the US central bank prepares to raise rates by 75 bps on Wednesday.
AUD/JPY Price Analysis: Technical outlook
From the daily chart perspective, the AUD/JPY is upward-to-neutral biased. Failure to record a fresh daily high above 96.88 keeps the cross with its current bias but is also subject to selling pressure, as sellers stepped in around the 95.30 area. Failure to reclaim a daily close above the latter would leave the pair vulnerable to selling pressure. Otherwise, an AUD/JPY rally towards the YTD high of around 97.00 is on the cards.
AUD/JPY 1-hour chart
During the last hour, the AUD/JPY consolidated around the R1 daily pivot, unable to break above 95.20. The AUD/JPY hit a daily high at 95.18 in a goodish momentum bounce provided by the Relative Strength Index (RSI). However, the rally appears to be losing steam, as the RSI’s shifted horizontally around 63 and slid below RSI’s 7-hour SMA as buying interest fades.
Therefore, the AUD/JPY is neutral biased. But as mentioned above, failure at 95.00 would be gladly welcomed by sellers. Hence, the AUD/JPY first support would be the 100-hour EMA at 95.04. Break below will expose the confluence of the 20 and 50-hour EMA around 94.70-77, followed by the 200-hour EMA at 94.48. Once cleared, the next support would be the July 25 low at 93.89.

AUD/JPY Key Technical Levels
- Gold price is headed into a key area of support on a busy week ahead.
- It is a huge week for financial markets and gold will be sure to be in the spotlight around the key events.
- A 50% mean reversion level of around $1,780 could be in the offing if bulls commit through this critical week.
The gold price is down on the day by some 0.58% and falls from a high of $1,736.30 to a low of $1,714.80 despite a softer greenback. Meanwhile, traders are bracing for the showdown this week that will come in the form of the Federal Reserve ahead of some key US data points, such as the Fed's preferred inflation measure and fresh growth data towards the end of a very busy week.
All eyes are on the Fed
The Fed is expected to end its two-day meeting with another 75bps hike for the second-straight time. Expectations for a hike of 75 basis points from the Fed stand at about 75%, according to CME's Fedwatch tool with a 25% chance of a 100 basis point hike. Analysts at Brown Brothers Harriman said WIRP suggests only around 10% odds of a 100 bp move, noting that updated macro forecasts and Dot Plots won’t come until the September meeting.
''Another 75 bp hike on September 21 is only about 45% priced in, with a 50 bp move favoured then. A 25 bp hike is priced in for November 2 but after that, one last 25 bp hike is only partially priced in. The swaps market paints a similar picture, with 175 of tightening priced in over the next 6 months that would see the policy rate peak near 3.5%. Then, an easing cycle is priced in for the subsequent 6 months.''
Gold has been pressured in this environment as the yellow metal offers no yield. Nevertheless, analysts at TD Securities are of the mind that a CTA whipsaw would be the most obvious driver for additional short covering in the yellow metal.
The analysts say that prices would need to close north of $1,775 to spark a buying program. ''Ultimately, a behemoth position held by prop traders remains nearly twice its typical size, suggesting a substantial amount of pain will reverberate across gold markets if prices revert lower. We have yet to see capitulation in gold, suggesting the recent rally will ultimately fade when faced with a wall of offers.''
However, rising bond yields ahead of the Fed are contributing to a gap between the 2- and 10-year Treasury notes which observers would argue signal a looming recession in the US. Gold's allure as a safe haven asset could see higher prices, especially if the Fed were to start to dial back its hawkish rate hike path for the fear of crashing the economy.
Recent data has shown signs of an economic slowdown while inflation remains stubbornly high, with claims for jobless benefits rising to their highest in eight months. Moreover, on Friday, data showed that the US Composite PMI Output Index fell far more than expected to 47.5 this month from a final reading of 52.3 in June. This is showing that the world's largest economic power could be headed for a recession.
However, the greenback found some support from safe-haven flows late on Friday while investors' stepped aside from stocks on the back of some weak earnings reports. Meanwhile, to start the week, pre-Fed jitters are keeping the greenback off its highs. This makes the end of the week's data highly critical for the path of both the greenback and gold.
Key data ahead
Investors will eye the advance reading for second-quarter Gross Domestic Product, for one. If this were to show negative growth, the US will be showing a traditional definition of recession. We then have the Fed's preferred inflation measure which will be released in the form of Personal Consumption Expenditures, PCE.
Gold technical analysis
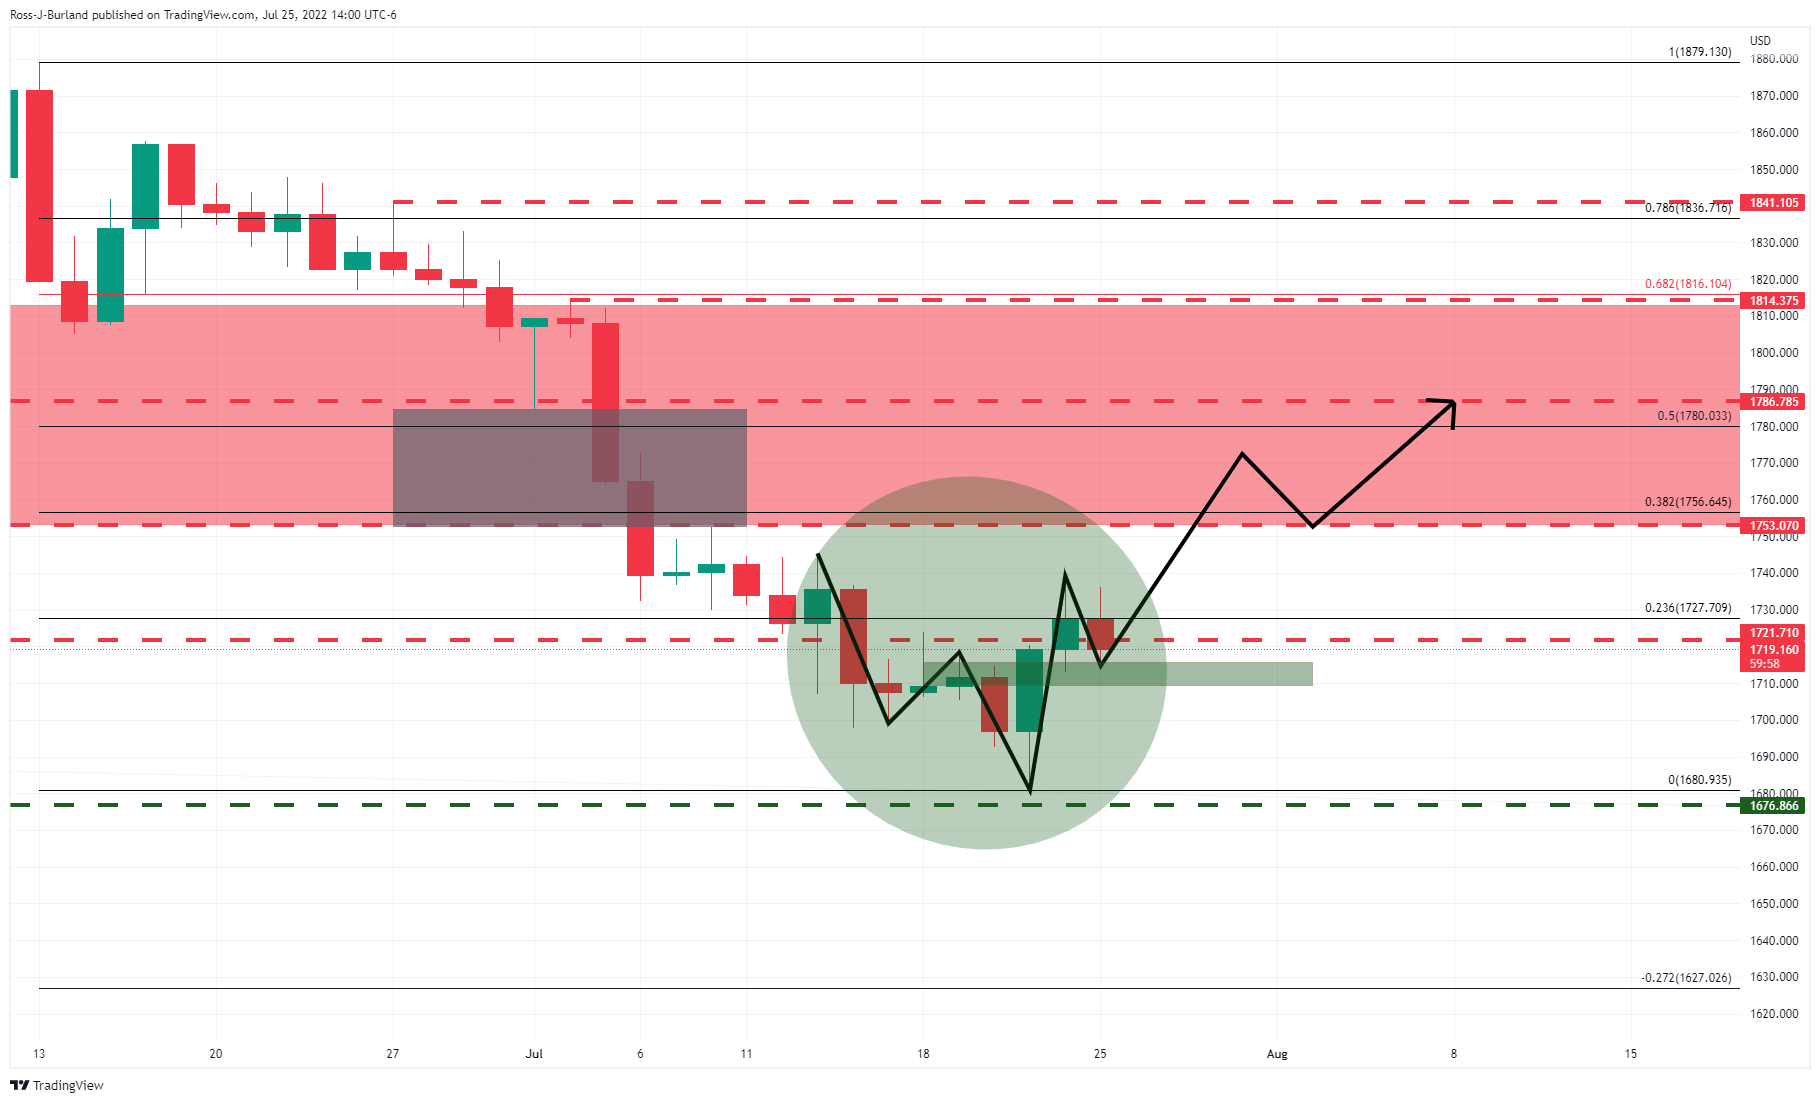
Meanwhile, the daily chart's W-formation has been pulling the gold price towards the neckline for a restest of the bull's commitments near $1,700 prior to what could turn out to be a full-on drive higher in the coming days. The greyed area on the chart above is a price imbalance that could be mitigated in the process and exposes the 50% mean reversion level around $1,780.
What you need to take care of on Tuesday, July 26:
The week started in risk-off mode, although the better performance of equities weighed on the greenback since the mid-European session. Earnings reports and hopes that the US Federal Reserve will refrain from innovating on monetary policy partially offset concerns about a global recession.
The EUR was among the worst performers, as tepid European data weighed on the shared currency. The latter also suffered from persistent tensions with Russia. The Nord Stream 1 pipeline is flowing at around 20% of its full capacity, and Europe will not have enough natural gas to make it throughout the winter. The pair trades around 1.0220, little changed for a second consecutive day.
The lack of news were good news for high-yielding currencies. The GBP/USD pair trades at around 1.2050, while AUD/USD nears July high at 0.6977. On the other hand, the USD/CAD pair is down to 1.2840.
The dollar advanced modestly against safe-haven rivals. USD/CHF stands at 0.9640 while USD/JPY trades around 136.60.
Gold price eased now, trading at around $1,717 a troy ounce. Crude oil prices were marginally higher, with WTI now trading at $96.60 a barrel.
The macroeconomic calendar had little to offer until next Wednesday. The US Federal Reserve monetary policy decision will top the first-tier event list, but preliminary GDPs and inflation figures for different economies will also be out.
LUNA prepares for a 20% move as lawsuits against Do Kwon and associates pile
Like this article? Help us with some feedback by answering this survey:
- The US crude oil benchmark snaps three days of consecutive losses and rises despite US data showing the US economy is slowing.
- A US recession and subsequent China’s Covid-19 lockdowns might weigh sharply on WTI price.
- Libya would increase its oil output from 860K to 1.2 million BPD amidst political turmoil.
Western Texas Intermediate (WTI) rises 1.40% on Monday as US equities gain, portraying an upbeat market mood, despite weaker than expected US economic data paints a gloomy scenario for the economy, reigniting recession fears. At the time of writing, WTI is exchanging hands at $96.65 per barrel.
Traders’ mood is positive, despite dismal US economic data flashing recession
Sentiment remains positive as investors await US corporate earnings reports. The Fed Chicago National Activity Index contracted for the second straight month. At the same time, the Dallas Fed Manufacturing Index also plunged, indicating that the US economy is in worse conditions than estimated. Consequently, as shown by the US Dollar Index, the greenback weakened, dropping 0.09%, a tailwind for WTI.
Fundamentally speaking, the narrative has not changed. Energy prices remain high, a US recession looms, and the Ukraine-Russia conflict extends for five months. US Monday’s data further increased traders’ worries regarding a recession and might cut fuel demand, a headwind for WTI prices.
Additionally to US factors, China’s Covid-19 zero-tolerance restrictions have taken their toll on oil prices. The second-largest economy narrowly missed a contraction in Q2 and grew by 0.4% YoY.
In the meantime, financial analysts remain skeptical about Libya’s output as the country deals with political uncertainty. Nevertheless, Libya’s National Oil Corporation said it would like to bring back 1.2 million BPD in two weeks from 860K. That, alongside EU countries imposing a cap on Russian oil, would keep the black gold prices volatile in the week ahead.
What to watch
In the week ahead, the US economic docket will feature the API Crude Oil Stock Change for July 22, on Tuesday, with the previous reading standing at 1.86M. On Wednesday, the EIA would unveil its gasoline and crude oil inventories alongside the US Federal Reserve monetary policy decision.
WTI Key Technical Levels
- EUR/USD holds in familiar territory ahead of the showdown event this week in the Fed.
- IFO German business sentiment is at its lowest in more than two years.
At 1.0223, EUR/USD is sideways at the start of the week ahead of the Federal Reserve interest rate decision on Wednesday. The US dollar, however, has been on the back foot for the main while traders weigh the implications of a rate hike and second guess what this will mean for the US economy that, according to recent data, could be on the cusp of a recession.
As recent as last Friday, data showed that the US Composite PMI Output Index fell far more than expected to 47.5 this month from a final reading of 52.3 in June. This is showing that the world's largest economic power could be headed for a recession. However, the greenback found some support from safe-haven flows late on Friday while investors' stepped aside from stocks on the back of some weak earnings reports. Meanwhile, to start the week, pre-Fed jitters are keeping the greenback off its highs.
The Fed is widely expected to raise interest rates by 75 basis points, but the worries are that a rate hike will close out pandemic-era support for the economy and with claims for jobless benefits rising to their highest in eight months, investors are treading cautiously in the build-up to the event. The Fed decision will be accompanied by the latest growth figures later in the week as well as the Fed's preferred inflation measure.
Meanwhile, the recent 50 basis point rate hike by the European Central Bank lifted the euro vs the greenback at the same time equities on Wall Street were on the front foot during solid earnings. However, the effect was shortened on the back of the latest earnings that were not so encouraging. Investors are eyeing the earnings season for signs of a worsening economy as well as the impact of a strong greenback on profits. Nevertheless, Martins Kazaks, who is the Latvian central bank governor who was speaking with Bloomberg News said that the ECB may not be done with big rate hikes, and this has dented the greenback today while US equities were modestly lower to start the week.
In domestic data on Monday, the IFO business sentiment survey showed on Monday that business morale in Germany has sunk more than expected in July to its lowest in more than two years. ''The collapse in the Ifo business climate (88.6 after 92.2) primarily reflects German companies' fear of a gas crisis,'' Commerzbank analysts said. ''Sooner or later, Putin might reduce gas deliveries again to make voters and politicians nervous so that they do not continue to support Ukraine militarily. Like the purchasing managers' index, the Ifo business climate now clearly points to a downturn in the German economy. How bad things end up is, unfortunately, primarily in Putin's hands.''
- GBP/USD bulls move in as traders get set for the Fed this week.
- UK politics are a potential weight for the pound going forward.
GBP/USD is higher in the midday New York session by some 0.37% after rallying from a low of 1.1960 to a high of 1.2086 on the day so far. The US dollar is down vs. a basket of rivals to start the week while traders get set for this week's showdown in the Federal Reserve interest rate decision.
The expectations of 75 basis points this Wednesday are throwing into question whether the US economy is able to sustain continued rate hikes at such a pace. A hike of that magnitude would effectively close out pandemic-era support for the economy and data of late has not been encouraging.
On Friday, the US Composite PMI Output Index fell far more than expected to 47.5 this month from a final reading of 52.3 in June indicating the US could be headed for a recession. However, the greenback found some support from safe-haven flows late on Friday while investors' stepped aside from stocks on the back of some weak earnings reports. Meanwhile, to start the week, pre-Fed jitters are keeping the greenback off its highs.
Domestically, net short GBP positions edged lower last week as per the latest positioning data shows as the pound finds itself caught up in political turmoil again. The UK will have a lame duck PM until September when a new leader will be announced and the uncertainty of a farm cloud over the currency and pound-denominated investments.
As analysts at Rabobank explained, ''it remains to be seen if the UK government, under new leadership can address the concerns that have been dogging GBP investors in terms of opportunity and growth for post-Brexit Britain. Presented with a worsening in the cost-of-living crisis, it is far from certain that a new PM in the UK will be able to substantially alter the gloomy tone that has been weighing on GBP all year.''
''Given our expectation that USD strength is likely to persist for around 6 months or so in view of risks to global growth, we foresee the potential for further sharp drops in the value of the pound,'' the analysts argued. ''We have revised lower our target for cable from 1.18 and see the potential for a dip to levels as low as 1.12 on a 1-to-3-month view.''
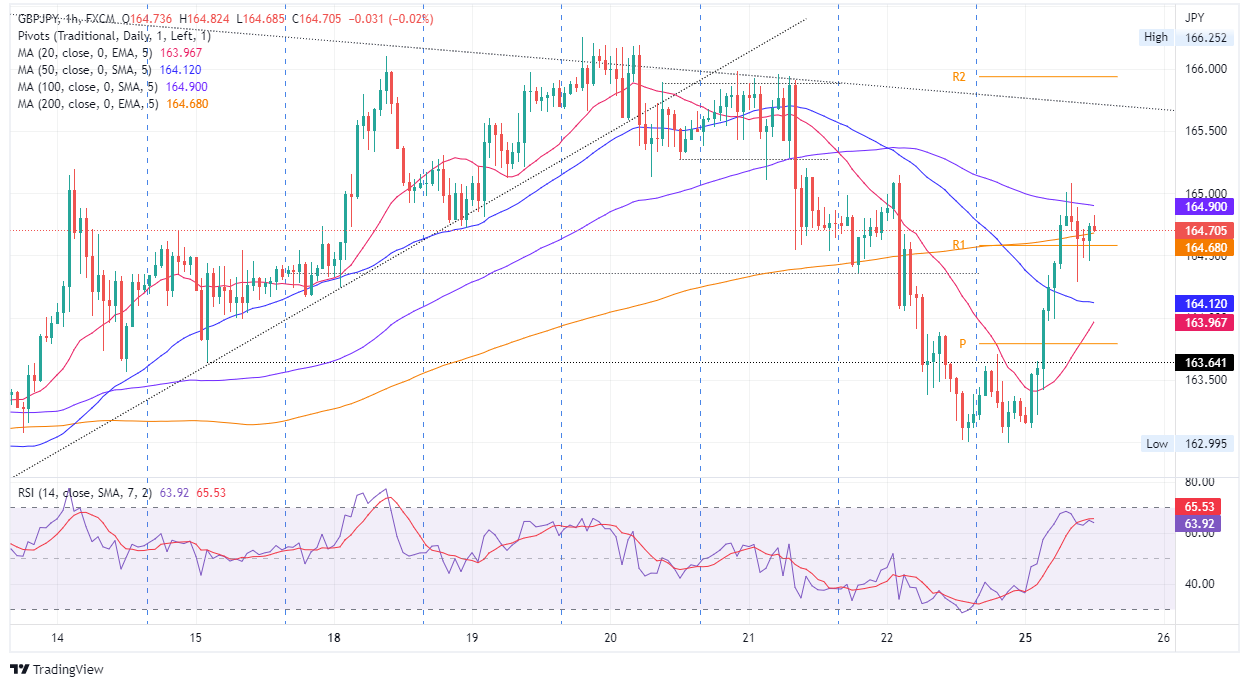
- GBP/JPY rallied 200 pips and hit a daily high at 165.08.
- The British pound got bolstered by an upbeat market mood, despite soft US data reigniting recession fears.
- GBP/JPY Price Analysis: To remain range-bound after fulfilling a double-bottom price target at 164.50.
The GBP/JPY erases last Friday’s losses and is gaining close to 1% on Monday, amidst an improved market mood with US equities rising, ahead of US mega-tech companies reporting earnings after US data further reinforces a recessionary scenario. At the time of writing, the GBP/JPY is trading at 164.70.
GBP/JPY Price Analysis: Technical outlook
From a daily chart perspective, the GBP/JPY is still upward biased due to sellers being unable to keep prices below the 50-day EMA at 163.62. it is also worth noting that the Relative Strength Index (RSI) spiked from negative territory, and it’s about to break above the RSI’s 7-day SMA, around 52.41, which would exacerbate and open a move towards the July 21 high at 165.98. However, the GBP/JPY would be vulnerable to selling pressure unless the latter is achieved.
GBP/JPY 1-hour chart
The GBP/JPY 1-hour chart depicts the pair formed a double-bottom around the 163.00 area, bolstering the cross, which rallied close to 200-pips. On its way north, the GBP/JPY pierced the 100-hour EMA at 164.90 before retreating above the 200-hour EMA at 164.68. However, due to RSI about to enter overbought conditions and price action lacking the strength to pierce the 165.00 late in the New York session, it would keep the pair range bound.
The GBP/JPY’s first resistance would be the July 25 high at 165.08. Break above will expose the confluence of the July 21 high and the R2 pivot around 166.00. On the flip side, the GBP/JPY first support would be the R1 daily pivot point at 164.58. Once cleared, the next support would be the 163.97-164.12 area, followed by the daily pivot point at 163.79.
GBP/JPY Key Technical Levels
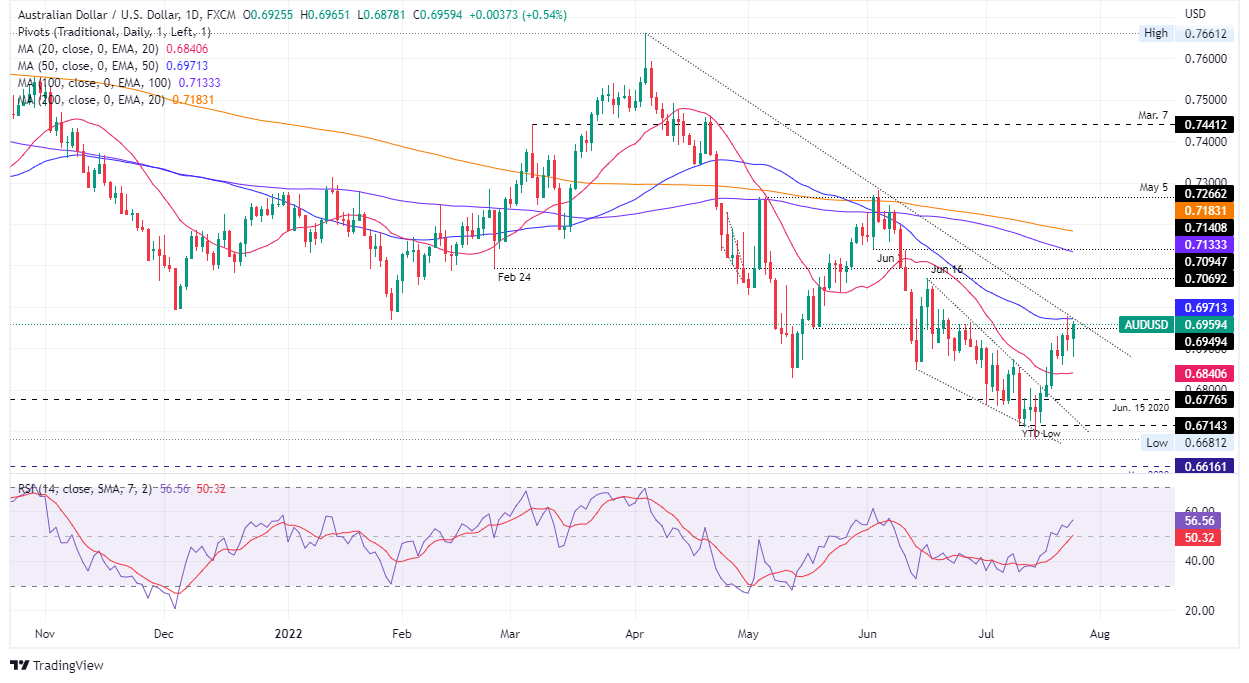
- The AUD/USD advances towards solid resistance around the 0.6970-90 area.
- Weak US economic activity and manufacturing data reported on Monday increase the chances of a US recession.
- AUD/USD Price Analysis: Downward biased, but if buyers reclaim 0.6970, a test of 0.7000 is on the cards.
The AUD/USD climbs during the North American session but faces solid resistance around the 50-day EMA around 0.6971, amidst an upbeat market mood, with US equities rising, except for the Nasdaq, down 0.44%. Softer US economic data further reinforces the recession scenario as the Fed tries to tame 40-year high inflation by hiking rates aggressively and is widely expected to lift the Federal funds rate (FFR) to 2.50% on Wednesday.
The AUD/USD is trading at 0.6959 after opening near the 0.6920 area. During the Asian session, the major tumbled to the daily low of 0.6878, but buying pressure overcame sellers and lifted the pair to the daily high around 0.6965, also shy of the confluence of the R1 pivot point and the 50-day EMA.
Dismal US data increased the likelihood of a recession
Earlier in the New York session, the Chicago Fed revealed its National Activity Index for June, which tumbled to -0.19 MoM, unchanged from the May reading. However, it’s worth noticing that the 3-month moving average shifted negatively for the first time, indicating deterioration. Late during the day, the Dallas Fed Manufacturing Index plummeted to -22.6 from -12.5 estimated in July.
Meanwhile, an absent Australian economic docket left traders adrift to market sentiment and US economic data. Nevertheless, throughout the week, AUD/USD traders will get some cues from Australia’s Q2 inflation report, which is expected to rise by 6.3%, to its highest since 1990. That would ramp up rate hike expectations by the Reserve Bank of Australia (RBA), with money market futures already pricing in a 75 bps rate hike.
What to watch
On Tuesday, the US economic docket will feature CB Consumer Confidence, New Home Sales, and the beginning of the two-day US FOMC monetary policy meeting.
AUD/USD Price Analysis: Technical outlook
Despite the ongoing correction, the AUD/USD is still downward biased, facing solid resistance on the confluence of the 50-day EMA and a four-month-old downslope trendline, around the 0.6971-85 area. Nevertheless, it’s worth noting that the Relative Strength Index (RSI) at 56.38 aims higher, opening the door for a potential test of 0.7000. But sellers remain in charge unless buyers step in and break resistance around 0.6970-85.
If the latter scenario plays out, the AUD/USD first resistance would be 0.7000. Break above will expose the 100-day EMA at 0.7133, followed by the 200-day EMA at 0.7153. On the other hand, the AUD/USD first support would be the 0.6900 figure. A breach of the latter will send the major sliding towards the 20-day EMA at 0.6840, followed by the 0.6800 mark.
Analysts at MUFG Bank forecast the USD/JPY pair to end the third quarter at 135 and the year at 131.00. However, in the short-term they see the pair likely to rise to 140.
Key Quotes:
“The dollar strengthened across the board as the Fed turned hawkish in response to an unexpected pickup in inflation, while the yen weakened due the divergence in monetary policy in Japan and other countries. The USD/JPY rose to touch 137, with 140 now in view given the Fed's unwaveringly hawkish stance should keep the dollar strong in the near term. However, the possibility of recession in the US could constrain a further widening of the interest rate differential between Japan and the US, which has been driving the USD/JPY's rise. We expect the USD/JPY's current rise to peak in Jul–Sep due to a slowdown in the US economy.”
“The interest rate differential in the intermediate sector, which tends to reflect the near-term outlook for monetary policy, has driven the USD/JPY higher since last year. The current level already looks strained, but we expect a narrowing of interest rate differentials would weigh on the USD/JPY if expectations of a decline US interest rates in anticipation of changes in the US economy becomes the mainstream view.”
“We expect the possibility of government intervention in the forex market to stop the yen from weakening will come into view if the USD/JPY passes 140. The last time Japanese authorities conducted yen-buying intervention was in June 1998, when the USD/JPY was above 140. The USD/JPY has been driven higher by the interest rate differential between Japan and the US. Now that this driver has started to lose momentum, we think growing concerns about intervention should act as an automatic brake on upside when the USD/JPY passes 140.”
- Gold turns negative as market sentiment deteriorates.
- XAU/USD slides below $1720, rejected again from above $1730.
- US Dollar recovers momentum, erases losses.
Gold prices failed to hold to gains on Monday, hit after Gazprom’s announcement that will slow flows on the Nord Stream 1 pipeline, triggering a decline in equity prices. XAUUSD printed a fresh daily low at $1714 during the American session.
Earlier on Monday, gold peaked at $1736, slightly below last week high and then lost momentum. It failed to hold above $1730 and then accelerated the decline after the US Dollar gained strength.
Gazprom’s announcement weighed in stocks and pushed energy prices to the upside. The dollar erased losses and turned positive. The DXY rose back above 106.50.
Market participants await the outcome of the FOMC meeting that will start on Tuesday. “We expect the FOMC to follow up June's large 75bp rate increase with a similar move in July, lifting the target range for the Fed Funds rate to 2.25%-2.50%. In doing so, the Committee would bring the policy stance to its estimate of the longer-run neutral level. We also look for Chair Powell to retain optionality by leaving the door open to additional 75bp rate increases”, explained an analyst at TD Securities.
Gold finds resistance
Last week, gold prices posted the first weekly gains after falling during five in a row. The rebound from the critical support area of 1675$ (2021 lows) found resistance at $1740.
From a very short-term perspective, XAUUSD is correcting lower and is testing the $1715 area. A break lower could open the doors to $1700. If it rises back above $1725, another test of $1740 could take place. The key resistance above is at $1750.
Technical levels
- Silver price begins the week heavy, creeps towards $18.40 ahead of the FOMC meeting.
- Weaker than expected data flagging further deterioration of the US economy underpins US Treasury yields.
- Silver Price Forecast (XAGUSD): Downward biased, to restest the $18.00 mark in the near term.
Silver price is retracing from daily highs near the $18.70 region towards the $18.40 area. A mixed market mood, spurred by the Federal Reserve Open Market Committee meeting looming, alongside US corporate earnings and US GDP preliminary readings, expected to expand but at the brink of confirming a technical recession in the US, keep Silver prices heavy.
XAGUSD began the week trading around $18.60, climbed steadily near the R1 daily pivot at $18.84, but dived below the S1 daily pivot and hit the daily low at $18.30, but had recovered some ground, meandering around the S1 pivot point at $18.40.
Despite weaker US data, safe-haven flows move towards the greenback
Late newswires confirmed that Gazprom has reduced the Natural Gas flows to 20% in the Nord Stream 1 pipeline, which triggered a jump in the UD Dollar Index to 106.420. In the meantime, US economic data further shows deterioration in the economy, as the US Dallas Fed Manufacturing Index collapsed -22.6 vs. -12.5 in July. That, alongside the US Chicago Fed National ACtivivity Indeed tumbling to -0.19 in June, keep recession fears lingering around investors’ minds. With the US Federal Reserve expected to hike 75 bps on Wednesday, the white metal is expected to accelerate its losses as higher US Treasury yields boost the appetite for the greenback.
Regarding the money market futures, expectations for a 75 bps interest rate rise by the Fed lie at a 75% chance, while estimations for a 100 bps increase are at 25%.
Talking about US Treasury yields, the 10-year benchmark note coupon edges up two and a half basis points, yielding 2.807%, while the US 2s-10s yield curve remains inverted for the sixteenth straight day, at -0.207%.
What to watch
On Tuesday, the US economic docket will feature CB Consumer Confidence, New Home Sales, and the beginning of the two-day US FOMC monetary policy meeting.
Silver Price Forecast (XAGUSD): Technical outlook
Silver price shows signs that the downtrend that accelerated since mid-April is losing steam, unable to crack the $18.00 barrier, which once cleared, would open the door for further losses, towards the June lows around $16.95. XAGUSD traders should notice that the Relative Strength Index (RSI) exited from oversold levels but is aiming lower, about to cross under the RSI’s 7-day SMA, opening the door for further downwards action.
Therefore, the XAGUSD’s first support would be the YTD low at $18.14. XAGUSD break below will expose $18.00, followed by a challenge of the $17.00, before refreshing 2-year lows around June 2020 lows at $16.95.
Russia’s Gazprom announced on Monday it will slow flows on the Nord Stream 1. The company is halting another turbine in the pipeline to Germany that is currently at 40%. On Wednesday the supply will fall to 33 million cubic meters per day, about half of the current.
European gas prices jumped following the announcement. The DAX turned negative and it was falling by 0.49%.
- Dallas Fed Manufacturing Index fell sharply again in July.
- US Dollar Index trims daily losses, rises to 106.50.
The headline General Business Activity Index of the Federal Reserve Bank of Dallas’s Manufacturing Survey plunged to -22.6 in July from -17.7 in June. This print missed the market expectation of -12.5 by a wide margin.
The New Orders sub-index dropped to -9.2 from -7.3, the Prices Paid for Raw Materials component fell to 38.4 from 57.5 and the Employment sub-index rose to 17.9 from 15.2.
Market reaction
The US Dollar continued to trim losses across the board after the report. The US Dollar Index was last seen posting small daily losses around 106.50.
Also read: Polestar (PSNY) stock falls sharply as news flow dries up
- The USD/CHF got a bid ahead of the FOMC meeting on mixed sentiment.
- From a medium-term perspective, the USD/CHF is upward biased; it could retest 0.9900.
- USD/CHF Price Analysis: A bearish flag emerged, which, once broken, would send the pair sliding towards 0.9580.
The USD/CHF stages a rebound from last week’s low and the 100-day moving average (DMA) at 0.9600 and edges higher on a mixed sentiment with US equities fluctuating as traders brace for the Federal Reserve monetary policy decision on Wednesday. At the time of writing, the USD/CHF is trading at 0.9652, slightly gaining 0.37%.
USD/CHF Price Analysis: Technical outlook
From a daily chart perspective, the USD/CHF is still upward biased, as buyers stepped in around 0.9600 and lifted the exchange rate towards Monday’s daily high at 0.9660. Nevertheless, since June, the USD/CHF has been range-bound within the 0.9500-0.9900 area, so a break above the 50-DMA at 0.9698 would put in play a move towards the July 18 high at 0.9789 before challenging the 0.9900 mark.
USD/CHF 1-hour chart
The USD/CHF is still neutral-to-downward biased, with the hourly SMAs residing above the exchange rate. Oscillators, although showing positive readings, the RSI is about to cross under its 7-period SMA, which would open the door for further losses. USD/CHF traders should be aware that a bearish-flag formed, which once broken to the downside, would pave the way for a break below 0.9600.
If that scenario is about to play out, the USD/CHF first support would be the daily pivot at 0.9640. A breach of the latter would immediately expose the bottom trendline of the bearish flag. Once cleared, the next support would be 0.9600. A decisive break would expose the bearish-flag target around the 0.9575-80 area.
USD/CHF Key Technical Levels
- A combination of factors weighed on the JPY and assisted USD/JPY to gain traction on Monday.
- The widening US-Japan yield differential, the risk-on impulse undermined the safe-haven JPY.
- The USD languished near a two-week low and capped gains as the focus remains on the FOMC.
The USD/JPY pair attracted some buying near the 136.00 mark on the first day of a new week and reversed a part of Friday's losses to a two-week low. The pair, for now, seems to have snapped a two-day losing streak, though the intraday uptick lacked bullish conviction.
A goodish recovery in the global risk sentiment - as depicted by an intraday rally in the equity markets - undermined the safe-haven Japanese yen. The risk-on flow pushed the US Treasury bond yields higher and widened the US-Japan rate differential. This was seen as another factor that weighed on the JPY and extended some support to the USD/JPY pair.
That said, the emergence of fresh US dollar selling held back bulls from placing aggressive bets and kept a lid on any meaningful gains for the USD/JPY pair. The USD struggled to capitalize/preserve its modest intraday gains and languished near its lowest level since July 5, which, in turn, was seen as a key factor that acted as a headwind for spot prices.
The USD downfall, however, remained limited, at least for the time being, amid bets that the Fed would hike interest rates by another 75 bps at the end of a two-day meeting on Wednesday. In contrast, the Bank of Japan stuck to its ultra-easy policy settings last week and reiterated its commitment to continue buying the Japanese Government Bonds (JGB).
The big divergence in the monetary policy stance adopted by the two major central banks favours bullish trades and supports prospects for a further near-term appreciating move for the USD/JPY pair. Hence, any meaningful pullback might still be seen as a buying opportunity and is more likely to be short-lived ahead of the key central bank event risk.
Technical levels to watch
- EUR/USD reverses the initial pullback to 1.0180.
- ECB’s Kazaks favoured a “significant” hike in September.
- Germany’s Business Climate surprised to the downside in July.
The single currency regains composure and pushes EUR/USD back to the upper end of the familiar range near 1.0260 on Monday.
EUR/USD bid on USD-selling
EUR/USD extends the choppy performance so far at the beginning of the week amidst the continuation of the corrective downside in the greenback, which prompts the US Dollar Index (DXY) to retreat for the third session in a row.
The upbeat mood in the pair looks also underpinned by comments from ECB’s Board member Kazaks, who seemed to share the view of 150 bps rate hikes by June, at the time when he also advocated for a “significant” hike at the September event.
No reaction in the FX space after the German Business Climate measured by the IFO Institute grinded lower to 88.6 in July. In addition, IFO officials said the German economy remains close to a recession, a view fueled by high energy prices and potential shortages of gas in the next months. The same source added that companies see further deterioration in the index in the upcoming months.
In the US calendar, the Chicago Fed National Activity Index stayed unchanged at -0.19 in June, while the Dallas Fed Manufacturing Index is due later.
What to look for around EUR
EUR/USD managed to put further distance from sub-parity levels seen earlier in the month and approached the 1.0300 neighbourhood during last week.
The pair now looks side-lined as market participants continue to gauge the latest ECB announcements and appear cautious ahead of the upcoming FOMC event on Wednesday.
In the meantime, the price action around the European currency closely follows increasing speculation of a probable recession in the euro area, dollar dynamics, geopolitical concerns, fragmentation worries and the Fed-ECB divergence.
Key events in the euro area this week: Germany IFO Business Climate (Monday) – Germany GfK Consumer Confidence (Wednesday) – EMU Final Consumer Confidence, Economic Sentiment, Germany Flash Inflation Rate (Thursday) – Germany Unemployment Change, Unemployment Rate, Flash Q2 GDP, EMU Flash Inflation Rate, Advanced Q2 GDP (Friday).
Eminent issues on the back boiler: Continuation of the ECB hiking cycle. Effervescence around Italian politics following Draghi’s exit. Fragmentation risks amidst the ECB’s normalization of monetary conditions. Performance of the economic recovery post-pandemic in the region. Impact of the war in Ukraine on the region’s growth prospects and inflation.
EUR/USD levels to watch
So far, spot is gaining 0.25% at 1.0239 and a breakout of 1.0278 (weekly high July 21) would target 1.0452 (55-day SMA) en route to 1.0615 (weekly high June 27). On the flip side, immediate contention emerges at 1.0129 (low July 22) seconded by 0.9952 (2022 low July 14) and finally 0.9859 (low December 2002).
- USD/TRY starts the week on a positive note and approaches 18.00.
- Lack of investors’ confidence and rampant inflation weigh on the lira.
- Türkiye Capacity Utilization improved to 78.2% in July.
The selling pressure continues to hurt the Turkish lira and lifts USD/TRY to fresh 2022 highs around 17/85, an area last visited in December 2021.
USD/TRY now targets 18.00 and above
USD/TRY advances for the sixth consecutive session on Monday and gradually approaches the 18.00 neighbourhood, as market participants remain biased towards selling the lira in the current context of elevated inflation and the utter absence of any reaction from both the government and the Turkish central bank (CBRT).
The central bank once again left the One-Week Repo Rate unchanged at 14.00% at its meeting last week despite consumer prices rose nearly 80% in the year to June. Furthermore, the CBRT refrained from acting on rates since it cut the policy rate to 14% at the December 2021 meeting.
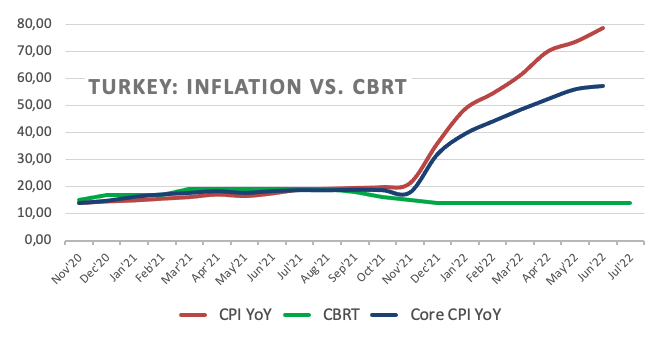
In the domestic calendar, Capacity Utilization ticked higher to 78.2% in July (from 77.6%) and Manufacturing Confidence eased to 103.7 also in July (from 106.4).
What to look for around TRY
The upside bias in USD/TRY remains unchanged and stays on course to revisit the key 18.00 zone. It is worth noting that the pair closed with gains in all the months so far this year.
In the meantime, the lira’s price action is expected to keep gyrating around the performance of energy prices, which appear directly correlated to developments from the war in Ukraine, the broad risk appetite trends and the Fed’s rate path in the next months.
Extra risks facing the Turkish currency also come from the domestic backyard, as inflation gives no signs of abating, real interest rates remain entrenched in negative figures and the political pressure to keep the CBRT biased towards low interest rates remain omnipresent. In addition, there seems to be no Plan B to attract foreign currency in a context where the country’s FX reserves dwindle by the day.
Key events in Türkiye this week: Capacity Utilization, Manufacturing Confidence (Monday) – Economic Confidence Index (Thursday) – Trade Balance (Friday).
Eminent issues on the back boiler: FX intervention by the CBRT. Progress (or lack of it) of the government’s new scheme oriented to support the lira via protected time deposits. Constant government pressure on the CBRT vs. bank’s credibility/independence. Bouts of geopolitical concerns. Structural reforms. Presidential/Parliamentary elections in June 23.
USD/TRY key levels
So far, the pair is gaining 0.73% at 17.8395 and faces the immediate target at 17.8436 (2022 high July 25) seconded by 18.2582 (all-time high December 20) and then 19.00 (round level). On the other hand, a breach of 17.1903 (weekly low July 15) would pave the way for 16.7486 (55-day SMA) and finally 16.0365 (monthly low June 27).
“The collapse in the Ifo business climate (88.6 after 92.2) primarily reflects German companies' fear of a gas crisis. Like the purchasing managers' index, the Ifo business climate now clearly points to a downturn in the German economy”, notes Dr. Jörg Krämer, Chief Economist at Commerzbank Research in the latest Economic Briefing published on Monday.
Key Quotes:
“After Nord Stream 1 maintenance, Russia has resumed deliveries at 40% of the maximum pipeline volume. But Putin might reduce gas deliveries again sooner or later. Because that way he could make voters and politicians nervous so that they stop supporting Ukraine militarily and it becomes less difficult for Russia to prevail militarily.”
“Beyond all the uncertainty, massively increased energy prices are already a reality for German companies. According to a survey by the DIHK business association, 16% of the manufacturing companies surveyed said they were responding to higher energy prices by scaling back their production or partially abandoning business segments.”
“Due to the extensive interest rate hikes in the USA, we expect the US economy to fall into recession in the first half of next year. If the economy of this important German trading partner shrinks, this will have a negative impact on companies in this country.”
“All in all, the German economy is probably already in a downturn. Unfortunately, how bad things end up is primarily in Putin's hands. If there were a complete halt to gas supplies, a deep recession would be inevitable.”
- A combination of factors prompted aggressive intraday selling around USD/CAD on Monday.
- Rebounding crude oil prices underpinned the loonie and exerted pressure amid a weaker USD.
- Recession fears could cap oil prices and limit the USD losses ahead of the key FOMC decision.
The USD/CAD pair witnessed an intraday turnaround from a multi-day high touched earlier this Monday and has now retreated nearly 100 pips from the vicinity of mid-1.2900s. The pair maintained its offered tone heading into the North American session and was last seen flirting with the 50-day SMA, around the 1.2855-1.2850 region.
A goodish recovery in the global risk sentiment - as depicted by a strong intraday rally in the equity markets - weighed on the safe-haven US dollar. In fact, the USD Index languished near its lowest level since July 5 touched on Friday, which, in turn, was seen as another factor that acted as a headwind for the USD/CAD pair on Monday.
A weaker USD, along with a positive tone, assisted crude oil prices to rebound over 4% from a one-week low touched earlier this Monday. This, in turn, underpinned the commodity-linked loonie and exerted additional downward pressure on the USD/CAD pair. That said, a combination of factors could help limit losses for spot prices.
Investors remain worried that a more aggressive tightening by major central banks could limit economic activity and pose challenges to global growth. This, along with the imposition of strict COVID-19 controls in China, has raised concerns about the fuel demand outlook and should cap gains for the black liquid.
Traders might also refrain from placing aggressive directional bets and prefer to wait on the sidelines ahead of the crucial FOMC monetary policy decision, scheduled to be announced on Wednesday. The Fed is widely expected to hike interest rates by 75 bps and hence, the focus would be on fresh clues about the future policy tightening path.
Market participants this week will also keep a close eye on important US macro data. A rather busy week kicks off with the release of the Conference Board's US Consumer Confidence Index on Tuesday. This, along with the Advance US Q2 GDP report on Thursday, will influence the USD and help determine the near-term trajectory for the USD/JPY pair.
Technical levels to watch
- GBP/USD jumped to a fresh multi-week high amid the emergence of fresh USD selling.
- A positive intraday turnaround in the risk sentiment weighed on the safe-haven buck.
- Brexit woes might cap gains for the British pound ahead of the crucial FOMC decision.
The GBP/USD pair attracted some dip-buying near the 1.1960 area on Monday and shot to a nearly three-week peak during the mid-European session. The pair was last seen trading around the 1.2065-1.2070 region, up over 0.50% for the day.
Friday's better-than-expected flash UK PMI prints reaffirmed market bets for a 50 bps rate hike by the Bank of England in August and continued acting as a tailwind for the British pound. On the other hand, a positive turnaround in the global risk sentiment - as depicted by a strong intraday rally in the equity markets - weighed on the safe-haven US dollar. In fact, the USD Index languished near its lowest level since July 5 touched on Friday, which, in turn, was seen as another factor that provided a goodish lift to the GBP/USD pair.
That said, growing concerns about a global economic downturn could keep a lid on any optimistic move in the markets. Apart from this, a goodish rebound in the US Treasury bond yields could offer support to the safe-haven greenback. Investors also remain worried that the UK government's controversial Northern Ireland Protocol Bill could trigger a trade war with the European Union amid the ongoing cost-of-living crisis. This could act as a headwind for sterling and further contribute to capping any meaningful upside for the GBP/USD pair.
Investors might also be reluctant to place directional bets and prefer to wait for the outcome of the crucial FOMC monetary policy meeting on Wednesday. The Fed is widely expected to hike interest rates by 75 bps, though recession fears could force the US central bank to slow the pace of its aggressive policy tightening path. This, in turn, suggests that the Fed's policy outlook would now play a key role in influencing the USD price dynamics and help investors to determine the near-term trajectory for the GBP/USD pair.
In the meantime, the broader market risk sentiment and the US bond yields would drive the USD demand amid absent relevant market moving economic releases from the US on Monday. Hence, it remains to be seen if the GBP/USD pair is able to capitalize on the positive move or meets with a fresh supply at higher levels. Nevertheless, acceptance above the 1.2045 horizontal resistance could be seen as a trigger for intraday traders and might have already set the stage for a further near-term appreciating move.
Technical levels to watch
- EUR/USD remains within a consolidative mood near 1.0250.
- Extra side-lined trade appears favoured in the near term.
EUR/USD fades the initial pessimism and refocuses on the upper end of the recent range near 1.0260.
The current consolidative mood carries the potential to extend further, at least until the FOMC meeting due later in the week. The upside should remain limited by the weekly high around 1.0280, while the low-1.0100s are expected to hold the downside for the time being.
In the meantime, the pair is expected to remain under downside pressure while below the 5-month support line around 1.0490.
In the longer run, the pair’s bearish view is expected to prevail as long as it trades below the 200-day SMA at 1.0991.
EUR/USD daily chart
- DXY remains under pressure in the lower end of the range.
- Further weakness could see the post-FOMC top at 105.80 retested.
DXY extends the bearish mood and revisits the low-106.00s, where some initial support appears to have turned up so far on Monday.
Considering the ongoing price action, a break below the 106.00 zone should not be ruled out in the short-term horizon. Against that, the index carries the potential to drop further and retest the post-FOMC peak at 105.78 (June 15).
Despite the ongoing downside, the near-term outlook for DXY is seen constructive while above the 5-month support line near 103.60.
In addition, the broader bullish view remains in place while above the 200-day SMA at 99.18.
DXY daily chart
- EUR/JPY reverses three daily pullbacks and approaches 140.00.
- The 4-month resistance line in the mid-141.00s caps the upside.
EUR/JPY manages to regain some poise and flirts with the 140.00 region following three daily sessions with losses.
While below the 4-month resistance line near 141.50, further losses should remain in the pipeline and another drop to the July low at 136.85 (July 8) should not be ruled out.
In the longer run, the constructive stance in the cross remains well underpinned by the 200-day SMA at 133.56.
EUR/JPY daily chart
- AUD/USD reverses an intraday dip on Monday and climbs back closer to a one-month high.
- A positive risk tone undermines the safe-haven USD and benefits the risk-sensitive aussie.
- Traders might refrain from placing aggressive bets ahead of this week’s key data/event risks.
The AUD/USD pair attracts dip-buying near the 0.6880-0.6875 region on Monday and gains traction through the first half of the European session. The momentum lifts spot prices to the 0.6955 region in the last hour, back closer to a one-month high touched on Friday.
The US dollar struggles to preserve/capitalize on the modest intraday gains and is last seen hovering just above its lowest level since July 5. A positive turnaround in the risk sentiment undermines the safe-haven USD and offers some support to the risk-sensitive aussie.
That said, any meaningful upside still seems elusive amid worries about a global economic downturn, which should keep a lid on any optimistic moves in the markets. Investors might also refrain from placing aggressive bets and prefer to wait for this week's key data/event risk.
A rather busy week kicks off with the release of the Conference Board's US Consumer Confidence Index on Tuesday. This will be followed by Australian quarterly inflation figures on Wednesday. The focus, however, will remain on the outcome of a two-day FOMC monetary policy meeting.
The Fed is scheduled to announce its interest rate decision during the US session on Wednesday and is universally expected to hike benchmark interest rates by 75 bps. Investors, however, will look for fresh clues about the central bank's near-term policy outlook, which could play a key role in influencing the USD.
Apart from this, the Advance US Q2 GDP report on Thursday will provide a fresh impetus to the AUD/USD pair and help determine the next leg of a directional move. In the meantime, the broader market risk sentiment will be looked upon for short-term trading opportunities.
Technical levels to watch
“Rapid forex volatility is undesirable and forex must move stably reflecting fundamentals,” the Bank of Japan (BOJ) new board member Naoki Tamura said on Monday.
Further comments
He believes prices move on various factors, not just in response to monetary policy.
Negative rate policy has exerted a certain effect on the economy but there are questions on how much marginal effect the policy still has.
Japan's economy is on a recovery course but various risks exist such as covid, Ukraine war and overseas slowdown.
FX volatility affects economy, markets so BOJ could respond comprehensively, such as supporting economy with QQE, enhancing sustainability of YCC.
-
BOJ’s Tamura: Rapid FX volatility undesirable, FX must move stably reflecting fundamentals
The Bank of Japan (BOJ) newly appointed board member Hajime Takata said on Monday, the central bank will be able to keep the easy monetary policy but there are challenges.
Additional quotes
Dwindling bank margins, impact on market function are among the challenges.
Yield curve control has various impact on the economy and prices.
Need to take those into account as well when managing policy.
Current yield curve control is sustainable.
If there is a positive cycle, then easy policy exit will become focus of discussion.
Following the release of the German IFO Business Survey, the institute’s Economist Klaus Wohlrabe said that “companies expect significant deterioration in business in coming months.”
Additional quotes
High energy prices and gas shortages weigh on the economy.
Germany is on brink of recession.
In services sector, business climate has deteriorated significantly.
In the manufacturing sector, index fell sharply; pessimism about months ahead has reached its highest level since April 2020.
German economy is facing uncomfortable times.
Uncertainty among companies has increased significantly; they find it difficult to assess the future.
-
EUR/USD Weekly Forecast: All eyes on the Fed´s upcoming decision
- German IFO Business Climate Index came in at 88.6 in July.
- IFO Current Economic Assessment for Germany dropped to 97.7 this month.
- July German IFO Expectations Index arrived at 80.3, missing estimates.
The headline German IFO Business Climate Index plunged to 88.6 in July versus last month's 92.2 and the consensus estimates of 90.5.
Meanwhile, the Current Economic Assessment dropped to 97.7 points in the reported month as compared to June's 99.4 and 98.2 anticipated.
The IFO Expectations Index – indicating firms’ projections for the next six months, fell sharply to 80.3 in July from the previous month’s 85.5 reading and the market forecast of 83.0.
Market reaction
EUR/USD remains unfazed by the downbeat German IFO survey. At the time of writing, the pair is trading at 1.0194, down 0.14% on the day.
About German IFO
The headline IFO business climate index was rebased and recalibrated in April after the IFO research Institute changed series from the base year of 2000 to the base year of 2005 as of May 2011 and then changed series to include services as of April 2018. The survey now includes 9,000 monthly survey responses from firms in the manufacturing, service sector, trade and construction.
- GBP/USD bulls are yielding into bearish control below 1.2000.
- UK political jitters and recession fears weigh down on the spot.
- The US dollar holds the bounce ahead of the Fed event risk.
- The pair needs a daily close above 21 DMA to confirm a bearish reversal.
GBP/USD is trading on the back foot below 1.2000, despite the latest bounce from the 1.1960 area. The US dollar has entered into a consolidative mode after staging a decent turnaround from two-week lows.
Markets remain in a risk-off mood amid looming recession fears while the UK leadership uncertainty also keeps the GBP bulls on the defensive. British PM candidate Liz Truss set out investment plans while another candidate Rishi Sunak said on Friday that he would put the government on a crisis footing from "day one" of taking office.
Although buyers continue to find support from rising expectations of a 50 bps BOE rate hike in August, especially after the S&P Global UK Preliminary Services and Manufacturing PMIs beat expectations in July.
The focus this week, however, remains the Fed rate hike decision this week. Ahead of that, traders will look forward to the UK political news and the US Durable Goods Orders data for fresh trading impetus.
Looking at cable’s daily chart, the bearish 21-Daily Moving Average (DMA) 1.2006 offers stiff resistance, recalling sellers this Monday.
Only a daily closing above the latter will confirm a bearish reversal, opening doors for a fresh recovery towards Friday’s high of 1.2064.
Further up, bulls will keep their sight on the 1.2100 round figure.
GBP/USD: Daily chart
The 14-day Relative Strength Index (RSI) is turning lower while below the midline, suggesting that bears are likely to retain control.
The immediate support is now seen at the 1.1950 level, below which Friday’s low of 1.1915 could be put to test again.
The last line of defense for GBP buyers is pegged at 1.1900, the critical demand area.
GBP/USD: Additional technical levels
- EUR/USD adds to Friday’s losses and revisits 1.0180.
- German 10y Bund yields attempt a mild bounce on Monday.
- Germany’s Business Climate next of relevance in the docket.
The single currency remains on the defensive and drags EUR/USD to the 1.0180 region at the beginning of the week.
EUR/USD looks to data
EUR/USD so far recedes for the second session in a row following the better mood surrounding the greenback. Despite the daily retracement, the pair keeps the range bound theme well and sound around the 1.0200 region for the time being.
Monday’s offered stance in the euro comes in line with a mild attempt of rebound in the German 10y Bund yields, all following recent multi-week lows, and marginal losses in European stocks following the opening bell on Monday.
It is expected to be an interesting week for the pair, as the FOMC gathering is due on Wednesday seconded by the flash US Q2 GDP and the publication of the PCE figures towards the end of the week. Closer to home, German and EMU advanced inflation figures and preliminary Q2 GDP readings as well as the German labour market report will also keep investors entertained.
In addition, the German Business Climate gauged by the IFO Institute is due later in the morning.
What to look for around EUR
EUR/USD managed to put further distance from sub-parity levels seen earlier in the month and approached the 1.0300 neighbourhood during last week.
The pair now looks side-lined as market participants continue to gauge the latest ECB announcements and appear cautious ahead of the upcoming FOMC event on Wednesday.
In the meantime, the price action around the European currency closely follows increasing speculation of a probable recession in the euro area, dollar dynamics, geopolitical concerns, fragmentation worries and the Fed-ECB divergence.
Key events in the euro area this week: Germany IFO Business Climate (Monday) – Germany GfK Consumer Confidence (Wednesday) – EMU Final Consumer Confidence, Economic Sentiment, Germany Flash Inflation Rate (Thursday) – Germany Unemployment Change, Unemployment Rate, Flash Q2 GDP, EMU Flash Inflation Rate, Advanced Q2 GDP (Friday).
Eminent issues on the back boiler: Continuation of the ECB hiking cycle. Effervescence around Italian politics following Draghi’s exit. Fragmentation risks amidst the ECB’s normalization of monetary conditions. Performance of the economic recovery post-pandemic in the region. Impact of the war in Ukraine on the region’s growth prospects and inflation.
EUR/USD levels to watch
So far, spot is down 0.14% at 1.0200 and faces immediate contention at 1.0129 (low July 22) seconded by 0.9952 (2022 low July 14) and finally 0.9859 (low December 2002). On the upside, a breakout of 1.0278 (weekly high July 21) would target 1.0452 (55-day SMA) en route to 1.0615 (weekly high June 27).
European Central Bank (ECB) policymaker Martins Kazaks backs the case for bigger rate hikes in his appearance on Monday.
Key quotes
September rate hike needs to be quite significant.
Big rate hikes may not be over yet
Should be open to discussion on bigger rate hikes.
Market reaction
At the time of writing, EUR/USD is keeping its range around 1.0200, lower by 0.07% on the day.
- Gold edged lower on Monday amid modest USD strength and an uptick in the US bond yields.
- Recession fears weighed on investors’ sentiment and offered some support to the XAU/USD.
- The focus remains glued to the FOMC decision and this week’s important US economic data.
Gold kicked off the new week on a softer note and moved further away from over a one-week high, around the $1,739 region touched on Friday. The XAU/USD, however, managed to recover a bit from the daily low and was last seen trading with modest intraday losses, just above the $1,725 level.
The prospects for a more aggressive policy tightening by major central banks failed to assist gold to capitalize on last week's bounce from the $1,680 region, or its lowest level since March 2021. Apart from this, an uptick in the US Treasury bond yields helped revive the US dollar demand and exerted some downward pressure on the dollar-denominated commodity.
The downside, however, remains cushioned amid the prevalent risk-off environment, which tends to underpin the safe-haven gold. The market sentiment remains fragile amid worries about a global economic downturn. The concerns were fueled by the disappointing release of the flash PMI prints from the Eurozone and the US on Friday, which tempered investors' confidence.
Furthermore, investors now expect that a US recession would force the Fed to slow its aggressive policy tightening path. This was evident from the recent sharp decline in n the US Treasury bond yields, which further offered some support to the non-yielding gold. Hence, the focus would remain on the outcome of a two-day FOMC meeting, scheduled to be announced on Wednesday.
Traders will further take cues from this week's important US macro data, starting with the release of the Conference Board's US Consumer Confidence Index on Tuesday. This would be followed by the Advance US Q2 GDP report on Thursday. This, along with the Fed's policy outlook, should influence the near-term USD price dynamics and provide a fresh directional impetus to gold.
In the meantime, the US bond yields would play a key role in driving the USD demand and provide some impetus to the XAU/USD amid absent relevant market-moving US economic releases on Monday. Apart from this, the broader market risk sentiment could provide some impetus and allow traders to grab short-term opportunities around gold.
Technical levels to watch
- DXY reverses the recent weakness and approaches 107.00.
- US yields advance marginally across the curve on Monday.
- The Chicago Fed National Activity Index will take centre stage later.
The greenback, in terms of the US Dollar Index (DXY), manages to reclaim some ground lost and trades close to the 107.00 region at the beginning of the week.
US Dollar Index focuses on FOMC, data
The index trades with decent gains after two consecutive daily pullbacks on Monday and approach the key 107.00 barrier on the back of some correction in the risk-associated universe.
In the US money markets, the recent strong appetite for bonds appears somewhat mitigated ahead of the opening bell in the old continent, lending in return some support to yields across the curve.
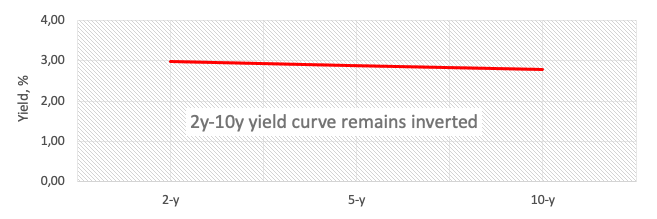
Investors, in the meantime, are expected to keep the cautious tone well and sound ahead of the FOMC event on Thursday as well as flash Q2 GDP figures and inflation tracked by the PCE, both due in the second half of the week.
Furthermore, and according to CME Group’s FedWatch Tool, the probability of a 75 bps rate hike on Wednesday is now close to 80% and just above 21% when it comes to a full point raise.
In the US data space, the Chicago Fed National Activity Index will be in the limelight later in the NA session seconded by the Dallas Fed Manufacturing Index.
What to look for around USD
The index came under downside pressure following nearly 20-year highs north of the 109.00 mark in mid-July, although it seems to have met some decent support near 106.00 for the time being.
So far, the dollar remains underpinned by the Fed’s divergence vs. most of its G10 peers (especially the ECB) in combination with bouts of geopolitical effervescence and the re-emergence of the risk aversion among investors.
On the flip side, market chatter of a potential US recession could temporarily undermine the uptrend trajectory of the dollar somewhat.
Key events in the US this week: Chicago Fed National Activity Index (Monday) – House Price Index, CB Consumer Confidence, New Home Sales (Tuesday) – MBA. Mortgage Applications, Durable Goods Orders, Advanced Goods Trade Balance, Pending Home Sales, Fed Interest Rate Decision, Powell Press Conference (Wednesday) – Flash Q2 GDP, Initial Claims (Thursday) – PCE Price Index, Personal Income, Personal Spending, Final Michigan Consumer Sentiment (Friday).
Eminent issues on the back boiler: Hard/soft/softish? landing of the US economy. Escalating geopolitical effervescence vs. Russia and China. Fed’s more aggressive rate path this year and 2023. US-China trade conflict. Future of Biden’s Build Back Better plan.
US Dollar Index relevant levels
Now, the index is up 0.14% at 106.69 and a break above 109.29 (2022 high July 15) would expose 109.77 (monthly high September 2002) and then 110.00 (round level). On the downside, the initial support comes at 106.11 (weekly low July 22) followed by 103.67 (weekly low June 27) and finally 103.41 (weekly low June 16).
FX option expiries for July 25 NY cut at 10:00 Eastern Time, via DTCC, can be found below.
- EUR/USD: EUR amounts
- 1.0075 467m
- 1.0135 333m
- 1.0200 646m
- 1.0250 1.9b
- 1.0300 406m
- GBP/USD: GBP amounts
- 1.2010 575m
- 1.2055 332m
- USD/JPY: USD amounts
- 134.20 550m
- USD/CHF: USD amounts
- 0.9605 256m
- AUD/USD: AUD amounts
- 0.6750 1.1b
- 0.6900 585m
- 0.6925 453m
- 0.6950 609m
- 0.7000 1.1b
- USD/CAD: USD amounts
- 1.3010 700m
- 1.3100 553m
- NZD/USD: NZD amounts
- 0.6100 653m
- 0.6300 476m
- EUR/GBP: EUR amounts
- 0.8550 431m
- A combination of factors assisted USD/CAD to gain traction for the second straight day.
- Weaker oil prices undermined the loonie and offered support amid a modest USD uptick.
- Traders keenly await the FOMC decision on Wednesday before placing directional bets.
The USD/CAD pair built on Friday's goodish rebound from the 1.2820 area, or a nearly four-week low and gained traction for the second successive day on Monday. The momentum pushed spot prices to a multi-day high, closer to mid-1.2900s during the first half of trading and was sponsored by a combination of factors.
Investors remain worried that a more aggressive tightening by major central banks could limit economic activity and pose challenges to global growth. This, along with the imposition of strict COVID-19 controls in China, has raised concerns about the fuel demand outlook and continued weighing on crude oil prices. This, in turn, undermined the commodity-linked loonie and acted as a tailwind for the USD/CAD pair amid the emergence of some US dollar buying.
Growing recession fears tempered investors' appetite for perceived riskier assets, which was evident from a generally weaker tone around the equity markets. Apart from this, a modest uptick in the US Treasury bond yields benefitted the safe-haven greenback. That said, expectations that an economic downturn in the US would force the Fed to slow its aggressive policy tightening path might keep a lid on any further gains for the buck and the USD/CAD pair.
Investors might also be reluctant to place aggressive bets ahead of this week's key event risk - the outcome of a two-day FOMC monetary policy meeting. The Fed is scheduled to announce its decision on Wednesday, which will be followed by the release of the Advance US Q2 GDP report on Thursday. This would play a key role in influencing the near-term USD demand and help investors to determine the next leg of a directional move for the USD/CAD pair.
In the meantime, the USD remains at the mercy of the US bond yields and the broader market risk sentiment amid absent relevant market-moving economic releases from the US on Monday. Apart from this, traders will take cues from oil price dynamics to grab short-term opportunities around the USD/CAD pair. Nevertheless, the fundamental backdrop favours bullish traders and supports prospects for some meaningful upside for spot prices.
Technical levels to watch
Here is what you need to know on Monday, July 25:
Risk-off flows extend at the start of the week this Monday, as investors remain cautious amid persisting fears over a probable recession worldwide. Traders prefer to stay on the defensive, as the Fed is set to hike rates by 75 bps on Wednesday, in its strong response to fighting inflation. US Treasury Secretary Janet Yellen warned of a slowdown in the US economy over the weekend but said that recession is not inevitable.
Worries over economic slowdown intensified after the S&P Global preliminary business PMIs from Eurozone and Germany recorded a contraction in July. The S&P Global US services PMI fell into contraction territory for the first time since June 2020.
China ramped up covid mass testing in Shanghai and Tianjin, which underscored the risk that fresh outbreaks could trigger new and economically costly lockdowns. Record number of covid-hit Australians in hospital as Omicron surged, sapping investors’ confidence.
Meanwhile, China issued stark private warnings to the Biden administration about a possible trip to Taiwan in August by US House of Representatives Speaker Nancy Pelosi, the Financial Times (FT) reported on Saturday. Citing sources, Reuters reported that Beijing plans to set up a real estate fund worth up to $44 billion despite the looming Evergrande restructuring concerns.
Amidst a slew of discouraging news flow in Asia, the regional stock indices drop, partly tracking Friday’s Wall Street sell-off. The US S&P 500 futures are down 0.22% on the day, reflecting the dour mood. Investors also remain wary ahead of earnings from American tech titans - Google’s Alphabet Inc. and technology titan Apple Inc.
Within the G10 currencies, the US dollar is staging a modest comeback from over two-week lows amid safe-haven flows.
EUR/USD is trading on the back foot near 1.0200, having stalled the rebound. ECB President Christine Lagarde said early Saturday that “we will keep raising rates for as long as necessary to bring inflation down to our target over the medium term.” Meanwhile, the ECB hawk Robert Holzmann noted, "we will see in the autumn what the economic situation is. Then we can probably decide if we do another 0.5% or less." Monday’s German IFO survey will shed more light on the eurozone’s economic outlook.
GBP/USD is dropping towards 1.1950, unable to find acceptance above 1.2000 yet again. The UK political uncertainty offsets expectations of a 50 bps BOE rate hike in August. British PM candidate Liz Truss set out investment plans while another candidate Rishi Sunak said on Friday that he would put the government on a crisis footing from "day one" of taking office.
USD/JPY is recovering ground above 136.00, as the US Treasury yields stabilize, pausing their last week’s sell-off. The pair ignores the news that the Bank of Japan (BOJ) is reshuffling its board members to bring in two new hawkish members.
Gold has stalled its recovery, consolidating around $1,730, with all eyes on the US top-tier data and Fed event in the week ahead.
Bitcoin drops back below the $22,000 mark amid pre-Fed anxiety while Ethereum attacks $1,500, losing nearly 4.50% on the day.
Considering advanced prints from CME Group for natural gas futures markets, open interest rose by around 11.2K contracts on Friday, reversing the previous daily pullback. On the other hand, volume shrank for the second straight session, this time by around 25.2K contracts.
Natural Gas: The hunt for $9.60
Friday’s strong advance in prices of natural gas was on the back of rising open interest and hints at the idea that extra gains appear likely in the very near term. Against that, the commodity could now be headed towards the 2022 high past $9.60 mark per MMBtu (June 8).
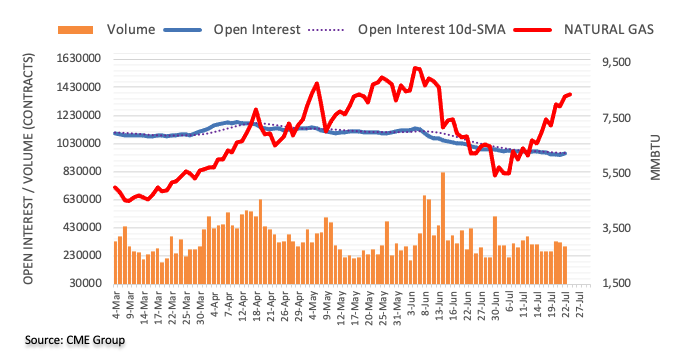
CME Group’s flash data for crude oil futures markets noted traders added nearly 11K contracts to their open interest positions at the end of last week, reaching the third consecutive daily build. Volume, instead, went down for the third session in a row, this time by around 19.5K contracts.
WTI faces the next support at $90.58
Prices of the WTI extended the leg lower on Friday amidst rising open interest, which is indicative that further losses remain in store for the commodity. That said, the next support of note now emerges at the July low at $90.58 per barrel (July 14).
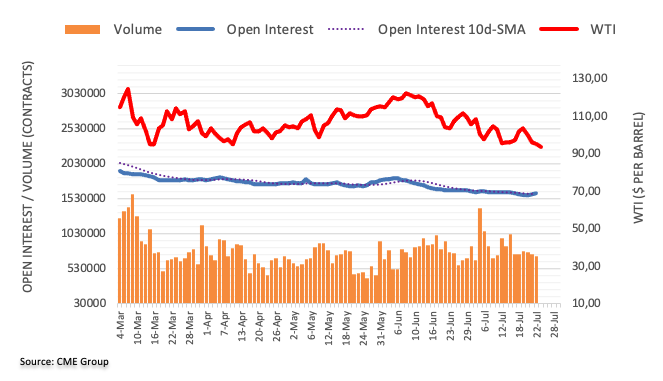
- USD/JPY edged higher on Monday amid the emergence of some USD buying.
- Recession fears underpinned the safe-haven JPY and capped gains for the pair.
- The downside seems limited as the focus remains on the key FOMC decision.
The USD/JPY pair attracted some buying near the 136.00 mark during the Asian session on Monday, though struggled to capitalize on the move. The pair has now retreated a few pips from the daily low and was last seen trading with only modest intraday gains, around the 136.30-136.35 region.
The US dollar edged higher on the first day of a new week amid a modest uptick in the US Treasury bond yields. This, in turn, offered some support to the USD/JPY pair, though a combination of factors held back bulls from placing aggressive bets and kept a lid on any meaningful upside.
The market worries about a global economic downturn were further fueled by the disappointing release of the flash PMI prints from the Eurozone and the US on Friday. This continued weighing on investors' sentiment, which underpinned the safe-haven Japanese yen and capped the USD/JPY pair.
The global flight to safety, along with expectations that a US recession might force the Fed to slow its policy tightening, has led to the recent sharp fall in the US Treasury bond yields. This resulted in the narrowing of the US-Japan rate differential and further benefitted the JPY.
The US central bank, however, is universally expected to hike interest rates by another 75 bps, which might continue to act as a tailwind for the USD. Hence, the market focus will remain glued to the outcome of a two-day FOMC policy meeting, scheduled to be announced on Wednesday.
In the meantime, the divergent Fed-Bank of Japan policy stance should limit the downside for the USD/JPY pair. In fact, the BoJ stuck to its ultra-easy policy settings last week and committed to continue buying the Japanese Government Bonds (JGB) at an annual pace of around ¥80 trillion.
Heading into the key event risk, the US bond yields will play a key role in influencing the USD price dynamics amid absent relevant market-moving economic releases. Apart from this, the broader market risk sentiment could provide some trading impetus to the USD/JPY pair.
Technical levels to watch
Economist at UOB Group Enrico Tanuwidjaja comments on the latest interest rate decision by the Bank Indonesia (BI).
Key Takeaways
“Bank Indonesia (BI) kept its benchmark rate (7-Day Reverse Repo) unchanged at 3.50% at its Jul MPC meeting.”
“BI continue to opt for liquidity normalisation of Rupiah Reserve Requirement (RR) hike to reach 9.0% starting on 1 September 2022 as monetary normalization mechanism.”
“We keep our view for BI to start hiking in 3Q22 (Aug and Sep), with two 25bps hikes in 3Q 2022 to 4.00%, followed by another two 25bps hikes in 4Q, taking its benchmark rate to 4.5% by the end of 2022.”
- AUD/USD remains pressured amid growing recession fears.
- Expectations of a 75 bps RBA rate hike could rise on hotter Australian inflation.
- The aussie remains capped between 21 and 50 DMAs, as Fed remains in focus.
AUD/USD is consolidating the rebound from near the 0.6880 region, although remains under pressure amid broad risk-aversion.
Investors fret over a probable recession worldwide, as major central banks pledge to bring inflation under control by delivering bigger rate hikes.
Growing economic slowdown concerns offset 75 bps RBA rate hike expectations that could be ramped up should this week’s Australian inflation data come in hotter than expected.
Traders also await the much-awaited Fed rate hike decision for fresh dollar valuations. In the meantime, the aussie digest the comments from Prime Minister Anthony Albanese, as he requested China to remove its trade sanctions against Australia, in an effort to repair the fractured relationship.
From a short-term technical perspective, AUD/USD is retreating from monthly highs after running into a major 50-Daily Moving Averages (DMA) resistance at 0.6975 last Friday.
Bears now target the horizontal 21 DMA at 0.6845 should the daily low of 0.6879 give way.
The 14-day Relative Strength Index (RSI) is turning south to attack the midline, justifying the renewed downside.
AUD/USD: Daily chart
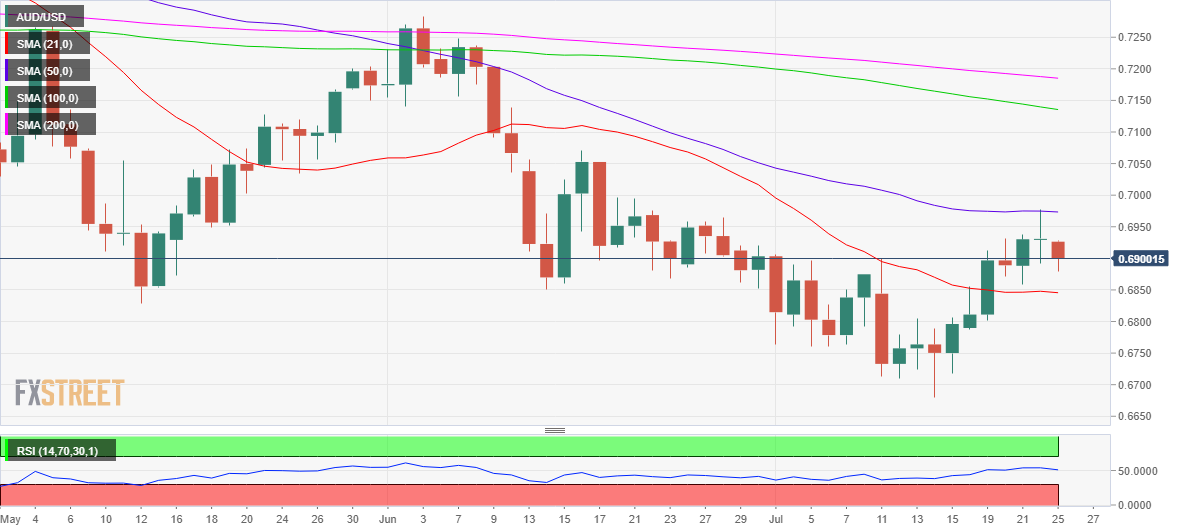
If the 21 DMA is taken out on a sustained basis, then a drop towards 0.6800 cannot be ruled out.
Further south, the July 18 low of 0.6787 will be put to test by AUD sellers.
AUD/USD: Additional levels to consider
- EURUSD price is holding the bounce above 1.0200 amid a cautious mood.
- ECB’s Lagarde pledges to continue rate hikes until inflation falls back to 2%.
- The US dollar stalls the bounce, focus now shifts to the German IFO survey.
EURUSD price is struggling to extend the renewed upside above 1.0200, as investors assess global recession risks ahead of the all-important Fed rate hike decision this week.
The US dollar returns to the red after the early march higher, offering some support to the main currency pair. Worries over a global economic slowdown sapped investors’ confidence and fuelled risk-off flows in the opening trades of the week, which helped the safe-haven buck recover ground from over two-week lows reached against its main competitors on Friday.
Traders remain cautious ahead of the earnings reports from the US tech giants, limiting the upside in the spot. Further, stabilizing US Treasury yields and expectations of a 75 bps Fed rate hike this week also act as a headwind to the EURUSD rebound.
Markets also digest the latest comments from ECB President Christine Lagarde, as she said that the central bank will raise its interest rates until inflation falls back to its 2% target. Meanwhile, the ECB hawk Robert Holzmann said over the weekend that "we will see in the autumn what the economic situation is. Then we can probably decide if we do another 0.5% or less."
The immediate focus now shifts towards the German IFO Economic Sentiment data due for release later this Monday. This sentiment data will be key to watch after Friday’s Eurozone and German Preliminary S&P Global business PMIs showed contraction in July, reviving fears over an imminent recession in the bloc. The Italian political turmoil will also likely remain a risk to the shared currency.
EURUSD price technical levels to consider
- GBP/USD is eying to surpass 1.2000 as DXY turns weaker on expectations of a slowdown in the US.
- The Fed is likely to announce a consecutive rate hike by 75 bps this week.
- Lower UK Retail Sales data may result in slippage in sterling.
The GBP/USD pair has recovered half of its intraday losses and is aiming to recapture the psychological resistance of 1.2000. The cable has shifted into a correction phase after hitting a high of 1.2064 on Friday. On a broader note, the asset is displaying topsy-turvy moves as the US dollar index (DXY) has displayed a sideways movement in the past week.
Over the past few months, the upside march in the DXY was backed by expectations of higher interest rates and upbeat economic data. The option of a 1% rate hike by the Federal Reserve (Fed) is out of the picture for now. However, investors are still placing bets on 75 basis points (bps) rate hikes on Wednesday.
While the US economic data is expecting a bumpy ride. Wall Street is reporting soft earnings on a broader note. Apart from that, Google has halted its recruitment process and Ford is looking to lay off 8k employees. This might result in a slump in the employment generation process and eventually in the overall labor market, which may not be firm enough to support the Fed for rate hikes unhesitatingly.
On the UK front, the pound bulls weakened after the release of the downbeat Retail Sales data. The economic data landed at -5.8% lower than the consensus of -5.3% and the prior release of 4.7%. It is worth noting that soaring energy bills are already pushing Retail Sales higher. Runaway inflation should have elevated the estimate for Retail Sales. However, lower consensus indicates that the overall demand is so much low that even the price pressures are unable to lift them above their prior release.
- Gold price finds renewed demand as the critical Fed week kicks in.
- The US dollar fades its rebound, Treasury yields remain vulnerable.
- XAUUSD sees additional recovery, with eyes on the $1,750 barrier.
Gold price is fluctuating between losses and gains so far this Monday, as investors remain on a cautious footing ahead of this week’s Fed rate hike decision and the US Q2 GDP release. Recession fears are rife after the euro area and the US preliminary S&P Global business PMIs disappointed last Friday. The US bond markets were on a roll higher, which boosted the bullion at the expense of the Treasury yields. Gold traders also remain unnerved, with a slew of earnings reports from the US tech titans, such as Apple Inc. and Alphabet Inc, due on the cards. Investors also look forward to the US Durable Goods data while the Fed is set to hike rates by 75 bps on Wednesday.
Also read: Gold Price Forecast: Will XAUUSD sustain the recovery above $1,700?
Gold Price: Key levels to watch
The Technical Confluence Detector shows that the gold price is eyeing a sustained move above the Fibonacci 38.2% one-day at $1,730.
The next upside target is seen at the Fibonacci 23.6% one-day at $1,733. The previous day’s high of $1,739 could then cap the XAUSUD recovery.
Further up, bulls will challenge the pivot point one-day R1 at $1,741 on their way to $1,750 – a psychological barrier.
Alternatively, buyers remain hopeful so long as the Fibonacci 23.6% one-week support of $1,726 is defended.
Bears will then attack the critical Fibonacci 61.8% one-day cushion at $1722.
The confluence of the Fibonacci 38.2% one-week and SMA10 one-day at $1,718 will come to buyers’ rescue.
Friday’s low and the SMA5 one-day at $1,713 will be the level to beat for XAU sellers.
Here is how it looks on the tool
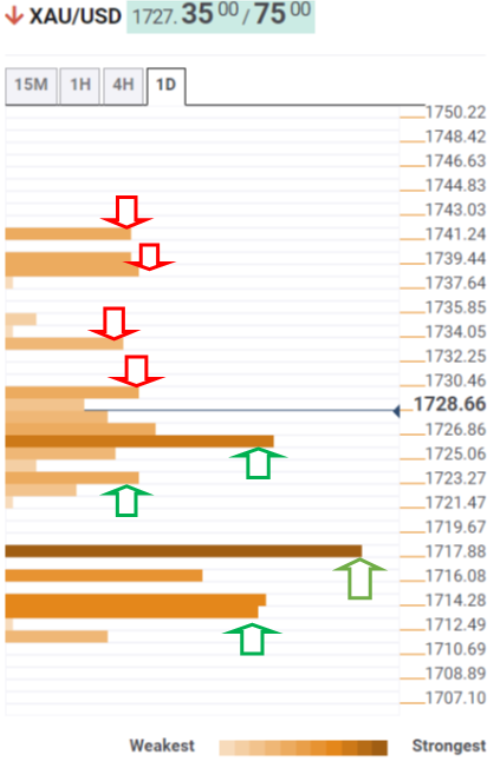
About Technical Confluences Detector
The TCD (Technical Confluences Detector) is a tool to locate and point out those price levels where there is a congestion of indicators, moving averages, Fibonacci levels, Pivot Points, etc. If you are a short-term trader, you will find entry points for counter-trend strategies and hunt a few points at a time. If you are a medium-to-long-term trader, this tool will allow you to know in advance the price levels where a medium-to-long-term trend may stop and rest, where to unwind positions, or where to increase your position size.
- USD/CHF is likely to display more weakness as the Fed is expected to stick to a 75 bps rate hike.
- US Durable Goods orders are seen lower at -0.2%, which may slip core CPI further.
- Apart from Fed policy and US Durable Goods, Swiss Real Retail Sales will be of utmost importance.
The USD/CHF pair has faced barricades of around 0.9640 in the Asian session after a firmer upside in the initial hours of the trading session. The asset has remained in the grip of bears for the past week and is expected to slide further as the US dollar index (DXY) has remained vulnerable after the display of the long-run inflation expectations.
The release of the inflation expectations at 2.8% vs. the prior release of 3.1% has trimmed the expectations of 100 basis points (bps) interest rate hike by the Federal Reserve (Fed). However, expectations of more policy tightening measures are solid and a rate hike by 75 bps looks imminent. The leading indicators of inflation such as the overall inflation rate and core Consumer Price Index (CPI) have no signs of exhaustion yet.
Apart from that, the release of the US Durable Goods on Wednesday will be of utmost importance. The economic data is seen as significantly lower at -0.2%, significantly lower than the prior release of 0.8%.
On the Swiss franc front, the release of Real Retail Sales will hog the limelight. Earlier, the economic data landed at -1.6%. The economic catalyst is expected to remain higher as soaring energy bills and prices of food products will elevate Real Retail Sales. However, a slippage in the economic data will indicate a major slump in the overall demand. This may weaken the Swiss franc bulls ahead.
| Raw materials | Closed | Change, % |
|---|---|---|
| Silver | 18.613 | -1.11 |
| Gold | 1726.92 | 0.51 |
| Palladium | 2002.14 | 5.79 |
Commenting on the US Federal Reserve (Fed) policy path, former Treasury Secretary Lawrence Summers noted that the Fed policymakers need to take strong action to quell soaring inflation.
Also read: US week ahead: Fed rate hike decision and Q2 GDP in focus – Moody’s
Key quotes
“We do need strong action from our central bank.”
He cast doubt on the likelihood of a soft landing for the US economy, saying it’s “very unlikely.”
“There’s a very high likelihood of recession when we’ve been in this kind of situation before.”
“Recession has essentially always followed when inflation has been high and our employment has been low.”
“There’s a lot we can do to contain or control inflation.”
“But if we continue with the kind of ostrich policies we had in 2021, there’s going to be much, much more pain later.”
Moody’s Investors Services provides a detailed preview of the much-awaited Fed rate hike decision and the US advance Q2 GDP due on the cards later this week.
Key quotes
“Among key data coming will be second-quarter GDP, which our high-frequency GDP model shows is on track to fall 1% at an annualized rate. Before the advance estimate, some additional source data will be released, but it remains likely that GDP fell for a second consecutive quarter.”
“The GDP's weakness so far this year has been attributable to volatile and often mean-reverting components—net trade and inventories—while domestic final sales and gross domestic income have held up noticeably better. Also, GDP is only one of many variables that the National Bureau of Economic Research, the de facto arbiter of U.S. recessions, uses to define a recession as a "significant decline in economic activity spread across the economy, lasting more than a few months, normally visible in production, employment, real income and other indicators."
“Also, this week, the Federal Reserve's Federal Open Market Committee (FOMC) meets, the statement is due at 1800 GMT on Wednesday 26 July at 1800 GMT, with Fed Chair Powell speaking at his news conference at 1830 GMT. “
“On monetary policy, the Federal Reserve is likely going to increase the target range for the fed funds rate by 75 basis points. There isn’t any data released ahead of the meeting of the Federal Open Market Committee that’s likely to push to the committee to hike by 100 basis points.”
- NZD/USD bears move in to test the commitment of the bulls.
- The daily W-formation is a reversion pattern that exposes 0.6150.
NZD/USD was on the front foot vs. the greenback at the end of the week despite the risk-off flows into the greenback. It was down for the day but it had the most positive week since May 23. With that being said, this leaves scope for a significant correction in the days ahead as we move toward this week's FOMC meeting.
Another 75bp Fed funds rate hike is fully priced by markets so that does give room for the kiwi to recover but the following daily chart's features are compelling:
NZD/USD daily chart
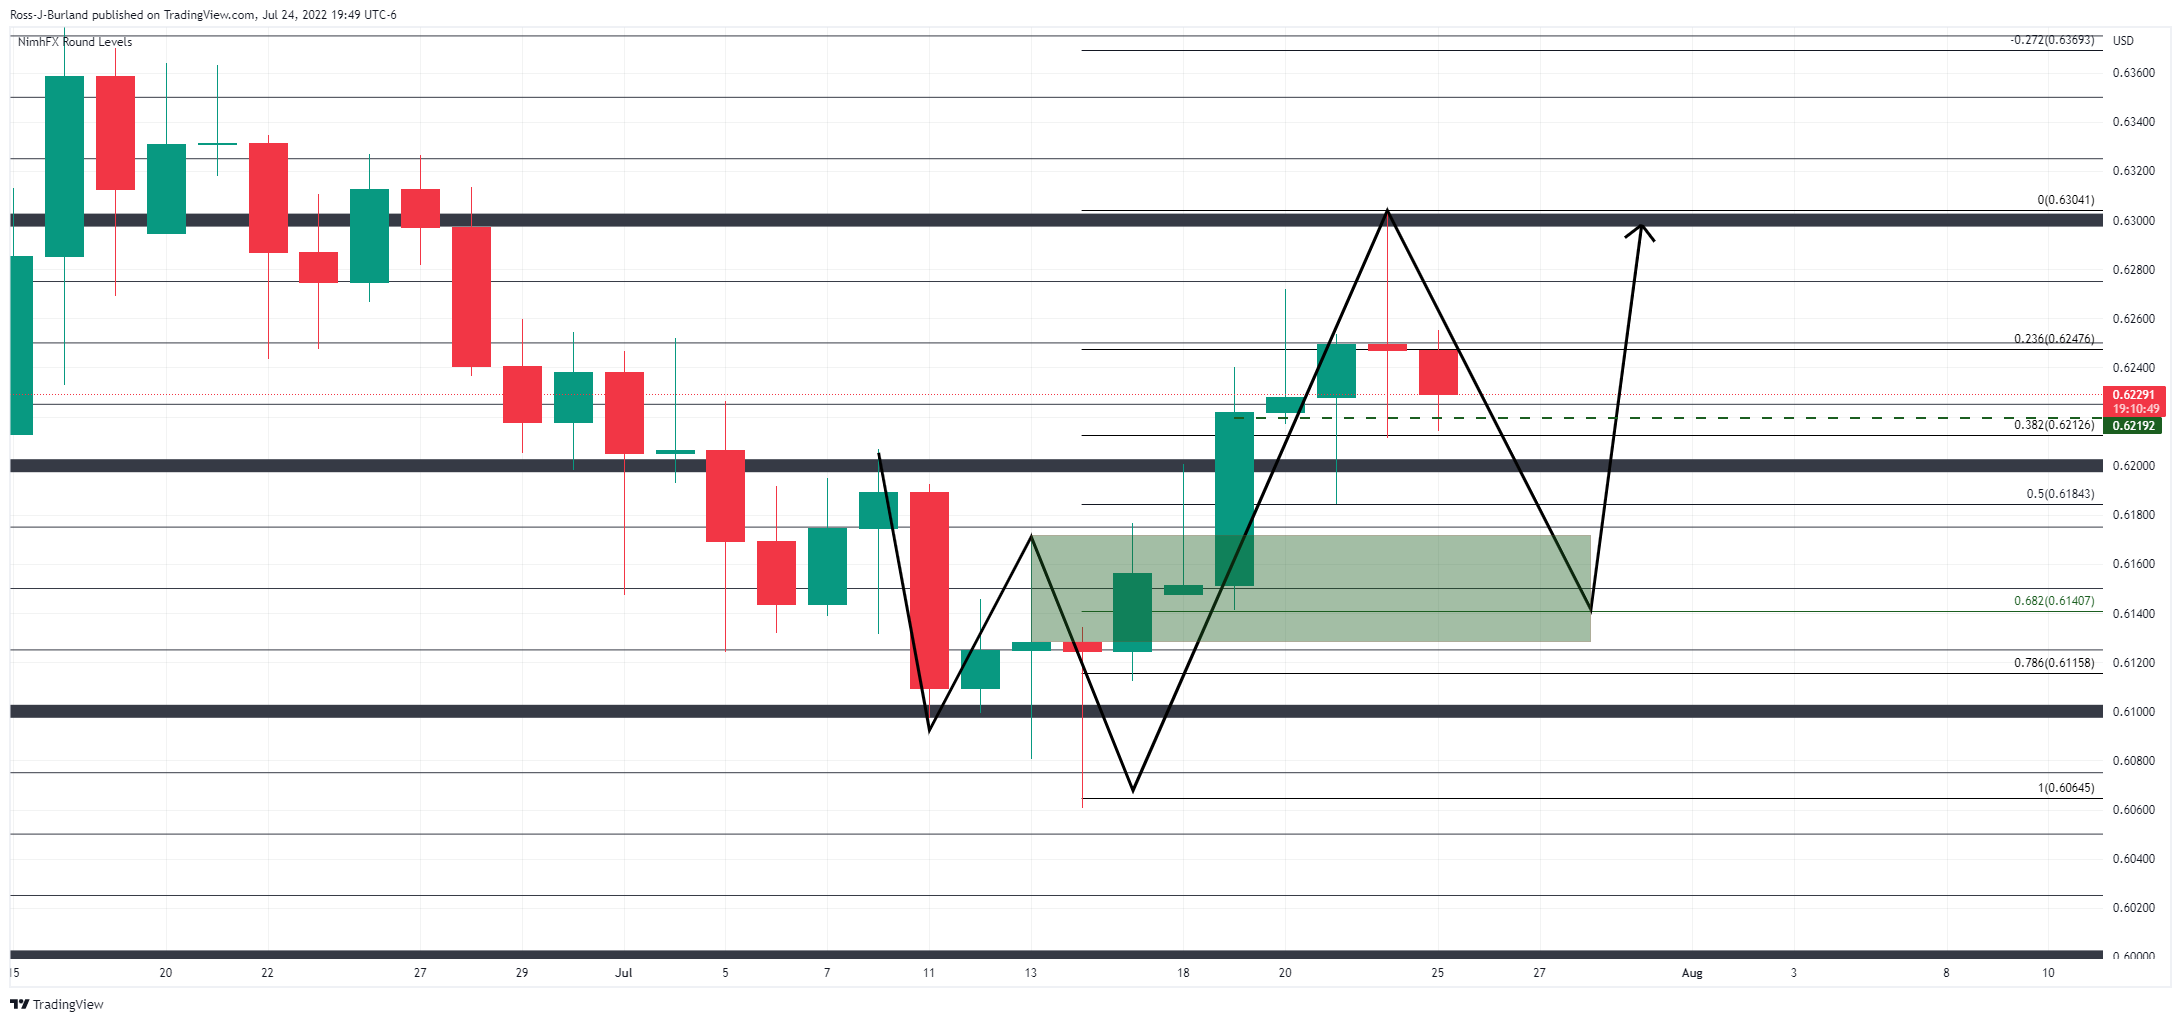
The price has left a W-formation which is a reversion pattern. The rejection from the round 0.63 figure was firm followed by today's bearish candle. Bears will be looking to see if this does indeed finish as an engulfment for a further conviction that the price is headed back into test 0.6150 and below.
- The formation of inventory distribution involves the initiation of longs by the market participants.
- Overlapping of 20- and 50 EMAs to the price dictates a consolidation ahead.
- A volatility expansion after a squeeze will result in volumes and wide-range ticks.
The EUR/USD pair is looking for a cushion around 1.0180 after a steep correction in the early Tokyo session. On Friday, the asset witnessed a steep fall after sensing exhaustion while sustaining above 1.0250, which dragged the major swiftly.
An inventory distribution formation after a juggernaut rally has stretched further on an hourly scale. This generally indicates the unavailability of a potential trigger, which can deliver a firmer move, most probably on the upside. The inventory distribution has formed in a range of 1.0131-1.0282 range.
It is worth noting that the 20- and 50-period Exponential Moving Averages (EMAs) around 1.0200 are overlapping with the asset price, which signals a consolidation ahead.
Also, the Relative Strength Index (RSI) (14) is oscillating in the 40.00-60.00 range, which signals a volatility contraction but is followed by a breakout in the same.
A breach of Thursday’s high at 1.0278 will drive the asset towards the round-level resistance at 1.0300, followed by July 1 low at 1.0366.
Alternatively, the greenback bulls could gain control if the asset drops below Monday’s low at 1.0081. An occurrence of the same will drag the asset towards the psychological support at 1.0000. A breach of the psychological support will expose the greenback bulls to recapture its two-year low at 0.9952.
EUR/USD hourly chart
-637943101139289641.png)
In recent trade today, the People’s Bank of China (PBOC) set the yuan (CNY) at 6.7543 vs. the last close of 6.7518.
About the fix
China maintains strict control of the yuan’s rate on the mainland.
The onshore yuan (CNY) differs from the offshore one (CNH) in trading restrictions, this last one is not as tightly controlled.
Each morning, the People’s Bank of China (PBOC) sets a so-called daily midpoint fix, based on the yuan’s previous day's closing level and quotations taken from the inter-bank dealer.
- AUD/JPY has tumbled below 94.00 as higher Japan’s core CPI continues to strengthen yen bulls.
- The BOJ needs to focus on accelerating its wage rates to keep price pressures above desired levels.
- A preliminary estimate for the overall Australian CPI is 6.3% vs. 5.1% reported in the first quarter.
The AUD/JPY pair has slipped firmly below 94.00 after facing barricades around 94.40 in the Asian session. The risk barometer remained in the grip of bears on Friday after giving a downside break of 94.86-95.60 range as the Japanese agency released higher core Consumer Price Index (CPI) data. The asset has carry-forwarded the bearish sentiment recorded on Friday and more downside looks likely as the asset has violated the cushion of 94.00 swiftly.
The Statistics Bureau of Japan reported the National CPI trimmed to 2.4% vs. 2.5% reported earlier. While the core CPI climbed to 1% from the prior release of 0.8%. The BOJ remained worried as oil and food prices were keeping the inflation rate above 2% earlier. Now, a recovery in demand for durable goods is going to delight the BOJ policymakers as core CPI has escalated.
In order to keep the core CPI elevated above the desired levels, the BOJ needs to focus on improving wage rates in the labor market. Higher paychecks are significant to pay for products and services and to keep consumption and saving patterns stable.
On the aussie front, investors are keeping an eye on inflation data, which is due this week. The data will support the Reserve Bank of Australia (RBA) to decide on the extent of the interest rate hike to be announced in the first week of August. As per the market consensus, the overall CPI for the second quarter of CY2022 is 6.3%, much higher than the prior release of 5.1%. This will definitely force the RBA to step up Its Official Cash Rate (OCR) further.
- Gold is under pressure in the open as the US dollar continues to catch a bid.
- The Federal Reserve is coming up this week which will be critical for gold.
Gold is trading offered at the start of the week as the US dollar firms despite data that showed on Friday US business activity shrunk for the first time in nearly two years in July as a services slowdown outweighed manufacturing growth. At the time of writing, XAU/USD is trading at $1,722.30 within a range of between $1,719.98 and $1,727.66
On Friday, the US Composite PMI Output Index tumbled far more than expected to 47.5 this month from a final reading of 52.3 in June indicating the US could be headed for a recession. However, the greenback found some support from safe-haven flows late on Friday while investors' stepped aside from stocks on the back of some weak earnings reports.
Nevertheless, as per the prior analysis, Gold price could be on the verge of a significant correction, Fed meeting will be decisive, the gold price has mitigated a significant price imbalance on the weekly chart ahead of a critical event in this week's Federal Open Market Committee meeting.
All about the Fed
The Fed is expected to follow up June's large 75bp rate increase with a similar move in July, lifting the target range for the Fed Funds rate to 2.25%-2.50%. ''In doing so, the Committee would bring the policy stance to its estimate of the longer-run neutral level. We also look for Chair Powell to retain optionality by leaving the door open to additional 75bp rate increases,'' analysts at TD Securities said.
While there is potential for some upside in the price of gold, the analysts at TD Securities argue that from a positioning lens, the behemoth position held by the average prop-trader is still nearly twice its typical size, suggesting a substantial amount of pain will reverberate across gold markets as prices revert lower. ''We have yet to see capitulation in gold, suggesting the recent rally will ultimately fade faced with a wall of offers.''
Gold daily chart
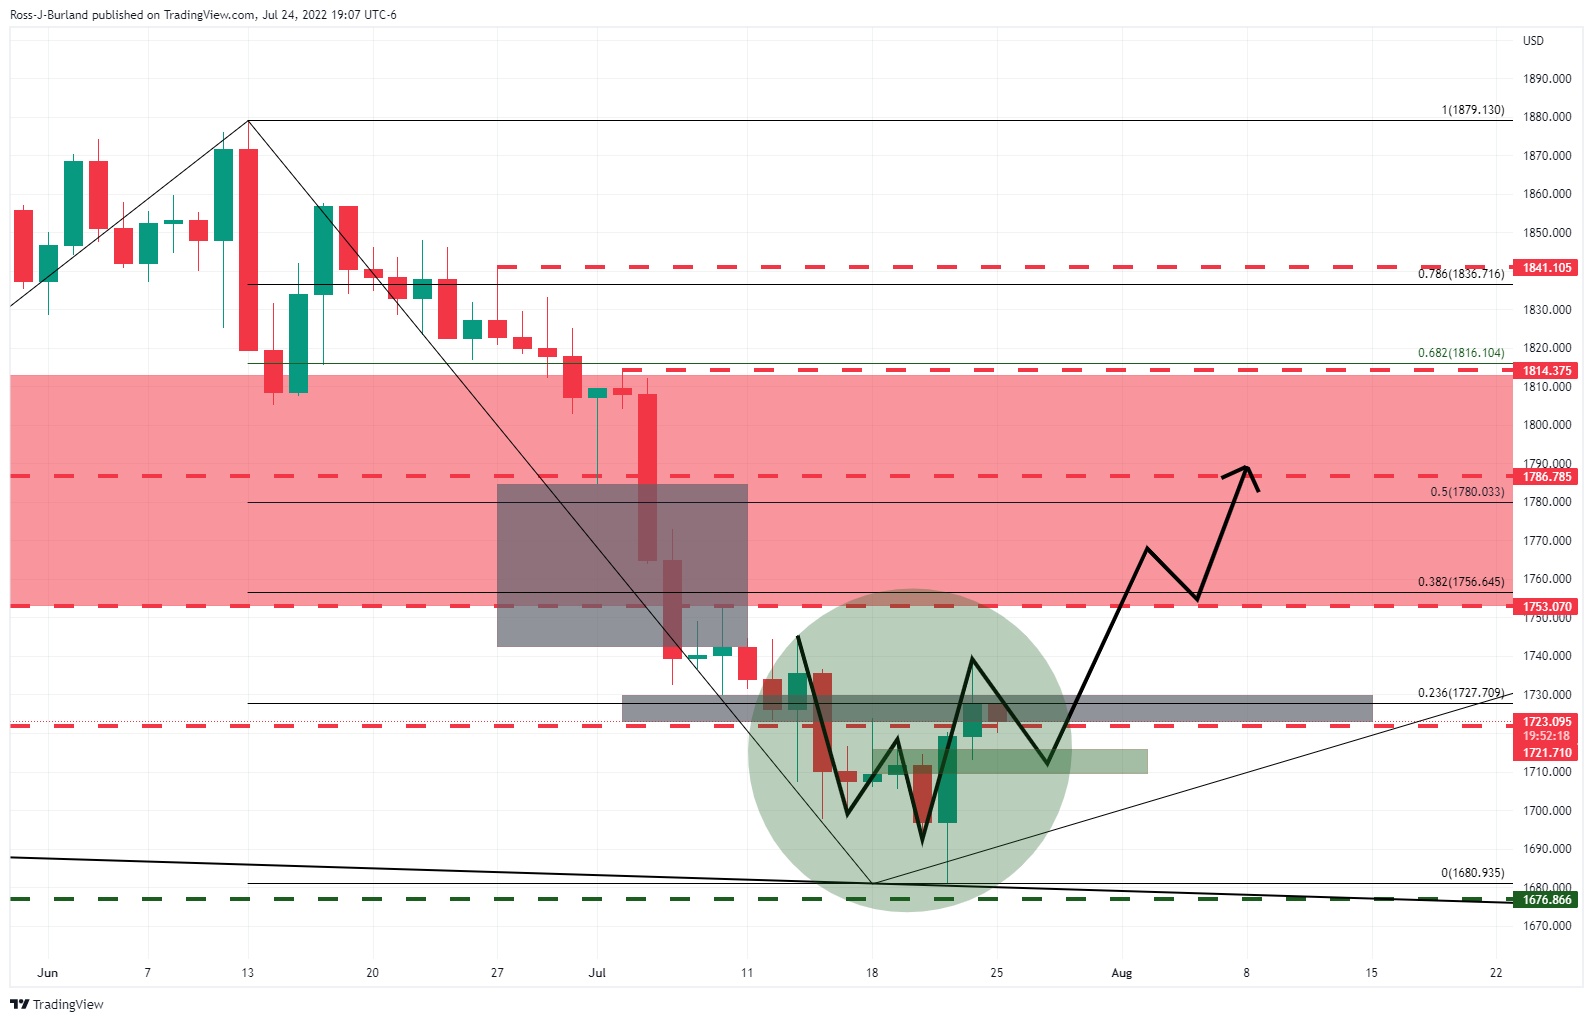
Meanwhile, the daily chart's W-formation is pulling the gold price towards the neckline for a restest of the bull's commitments near $1,700 prior to a full-on drive higher in the coming days.
- Aussie bulls are aiming to sustain above 38.2% Fibo retracement around 0.6920.
- Advancing 20-and 50-period EMAs add to the upside filters.
- The RSI (14) has shifted into the 40.00-60.00 range after a mild correction.
The AUD/USD pair is attempting to hold itself above the crucial support of 0.6900 after a sharp decline in the initial hours of the Tokyo session. A rebound move by the aussie bulls seems firmer and many get strengthened further after overstepping 0.6920.
On a four-hour scale, the asset is focusing on surpassing 38.2% Fibonacci retracement (which is plotted from June 3 high at 0.7283 to July 14 low at 0.6680) at 0.6920. Earlier, the major failed to kiss the 50% Fibo retracement, which is placed at 0.6984.
The greenback bulls have attacked the 20-period Exponential Moving Average (EMA) near 0.6900. While the 50-EMA at 0.6867 is untouched from the past week. Advancing short-term EMAs add to the upside filters.
Meanwhile, the Relative Strength Index (RSI) (14) has slipped into a 40.00-60.00 range from the bullish range of 60.00-80.00. This doesn’t warrant a bearish reversal, however, the asset is facing a minor correction after printing a monthly high of 0.6977.
Should the asset overstep 38.2% Fbo retracement at 0.6920 firmly, aussie bull will regain its mojo and will drive the asset towards June 28 high at 0.6965. A breach of the latter will send the major towards the psychological resistance at 0.7000.
On the flip side, a steep fall below the round-level support of 0.6800 will strengthen the greenback bulls. This may decline the pair towards July 13 low at 0.6724, followed by July 14 low at 0.6680.
AUD/USD four-hour chart
-637943062342571960.png)
| Index | Change, points | Closed | Change, % |
|---|---|---|---|
| NIKKEI 225 | 111.66 | 27914.66 | 0.4 |
| Hang Seng | 34.51 | 20609.14 | 0.17 |
| KOSPI | -16.02 | 2393.14 | -0.66 |
| ASX 200 | -2.8 | 6791.5 | -0.04 |
| FTSE 100 | 5.9 | 7276.4 | 0.08 |
| DAX | 7.04 | 13253.68 | 0.05 |
| CAC 40 | 15.71 | 6216.82 | 0.25 |
| Dow Jones | -137.61 | 31899.29 | -0.43 |
| S&P 500 | -37.32 | 3961.63 | -0.93 |
| NASDAQ Composite | -225.5 | 11834.11 | -1.87 |
- GBP/USD bears are showing up at the start of the week.
- The sellers could be sitting on dry powder with eyes on 1.1900.
GBP/USD is under pressure in the open as the US dollar picks up a bid to start the week. The following illustrates the structure of the hourly market as per round numbers, the broadening formation and a price imbalance.
GBP/USD H1 chart
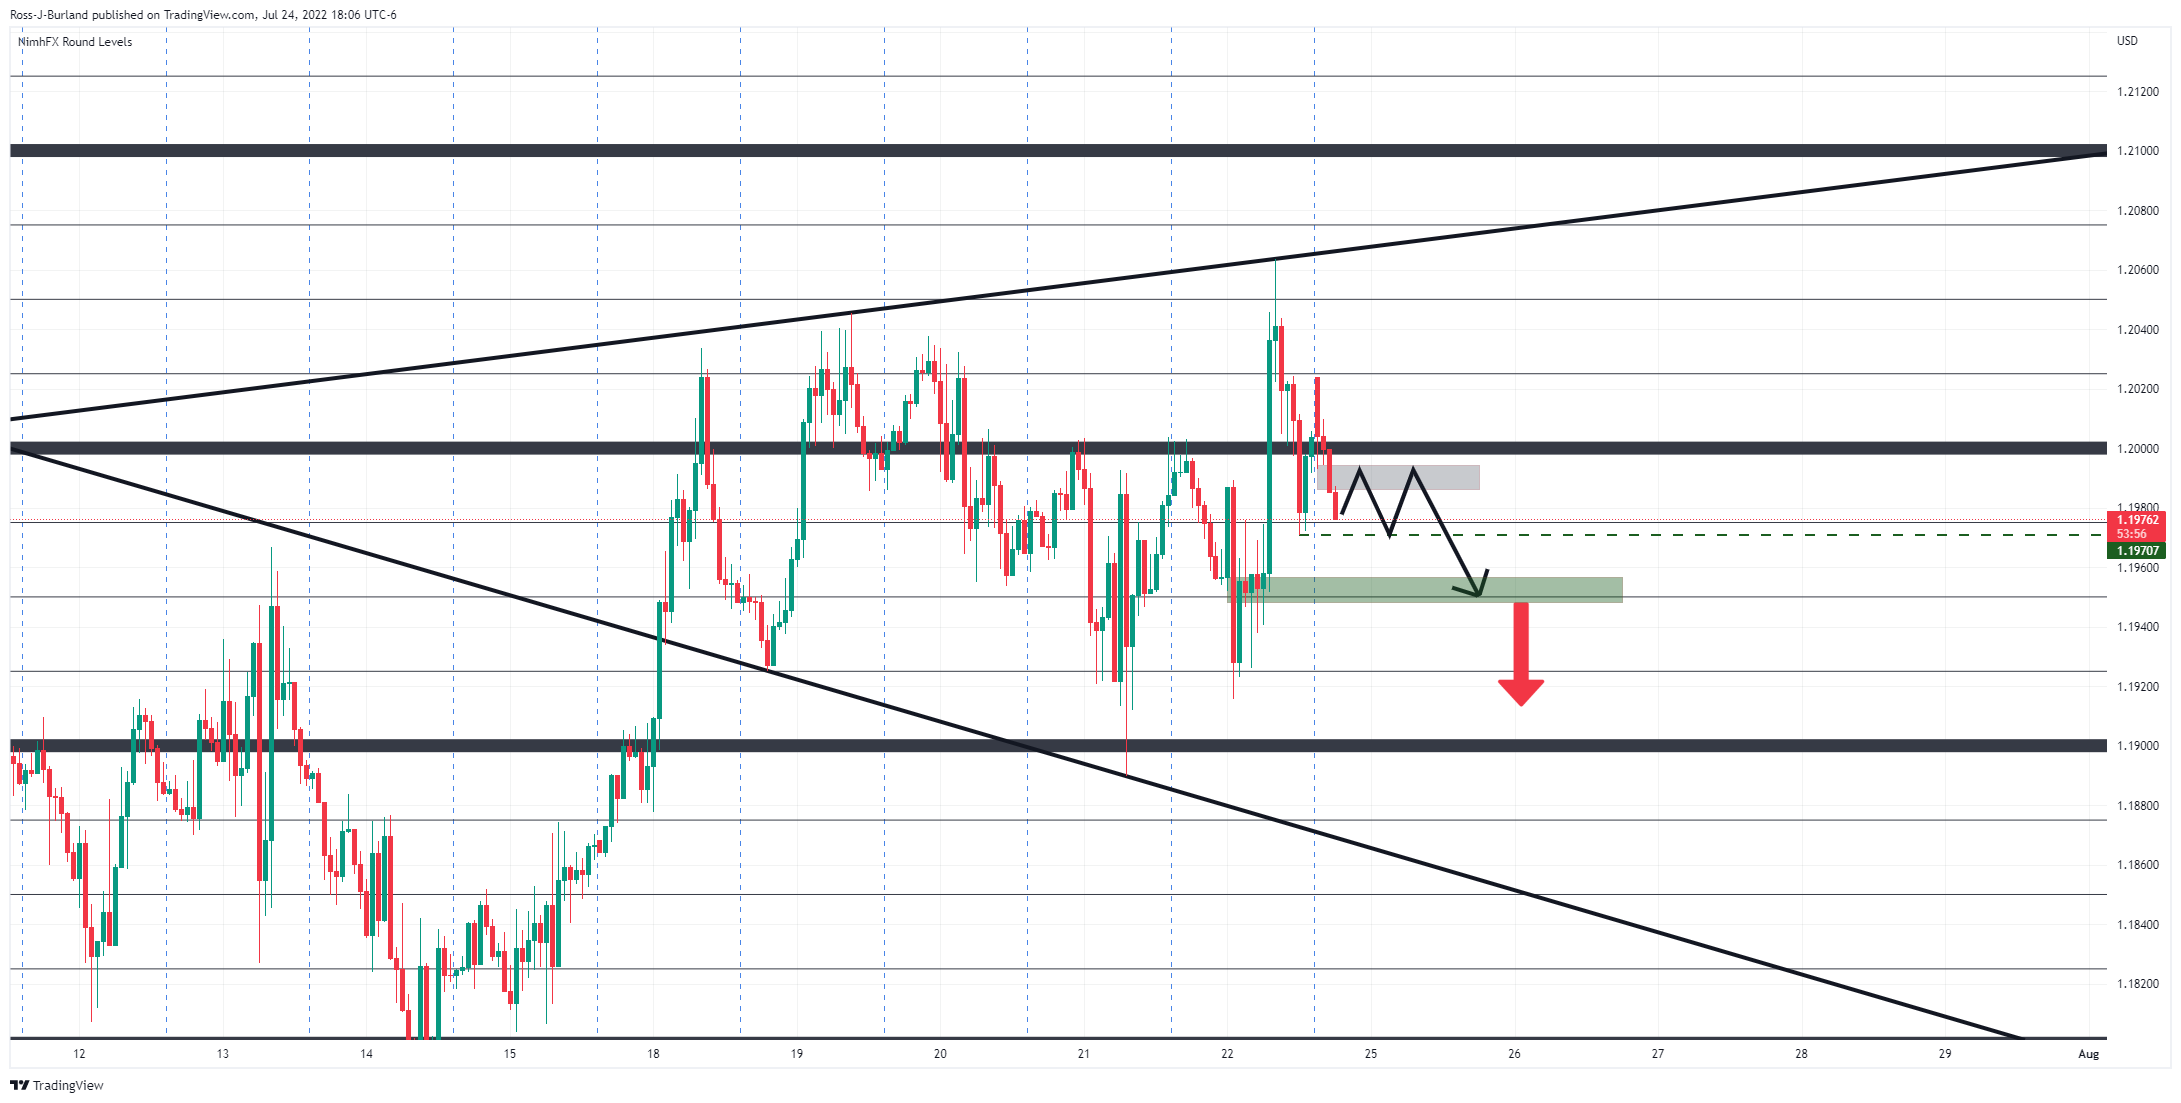
The price imbalance is the greyed area on the chart above the price where the bulls have yet to turn up at the start of the week. A retracement to fill the void would be expected in due course. The scenario above presumes that the price will be pulled towards liquidity prior to the next significant move lower below prior lows and support.
GBP/USD daily chart
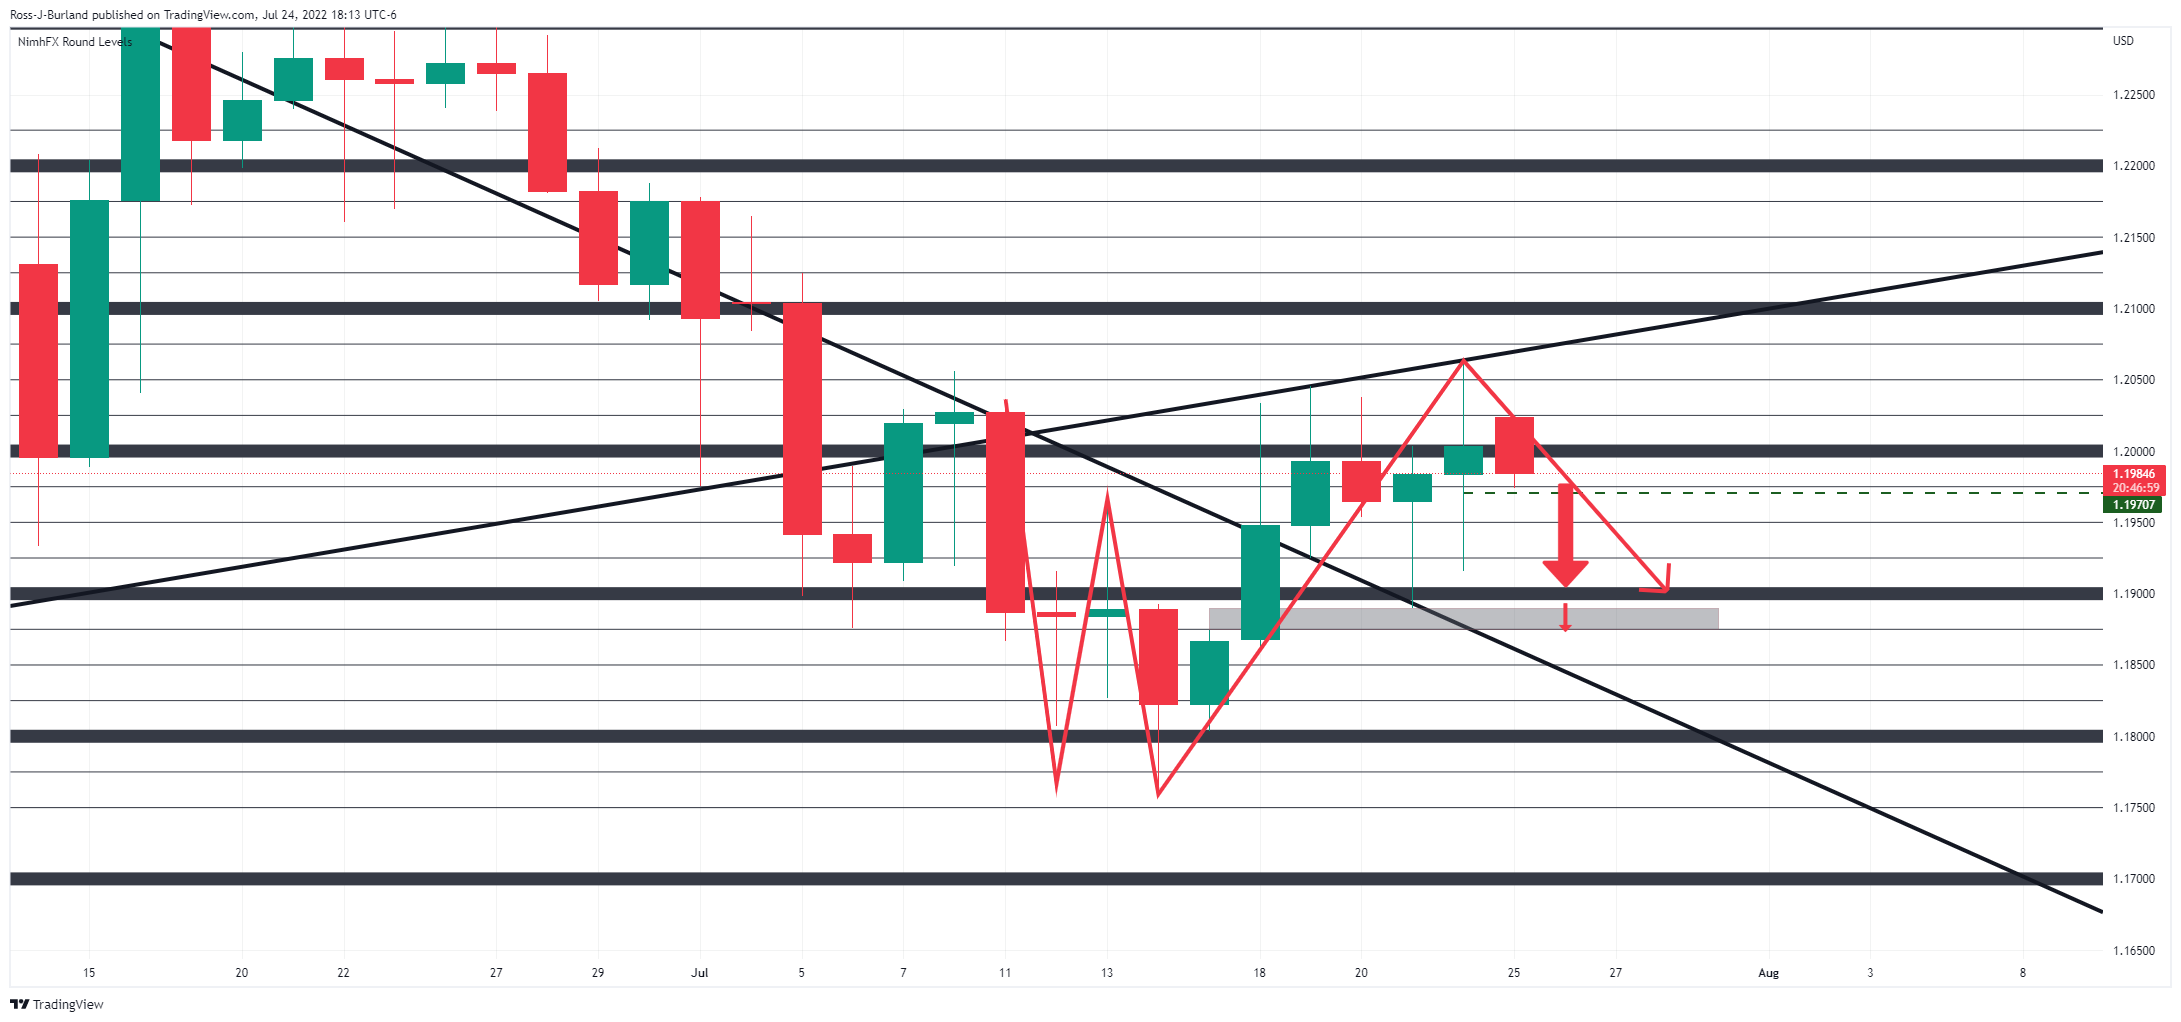
The daily chart shows that the price has already retraced to the W-formation's neckline although there could still be plenty of sellers on the sidelines according to the wicks and a fuller retest of the neckline near 1.1900 could be in order.
| Pare | Closed | Change, % |
|---|---|---|
| AUDUSD | 0.69251 | -0.13 |
| EURJPY | 138.943 | -1.11 |
| EURUSD | 1.02107 | -0.15 |
| GBPJPY | 163.338 | -0.88 |
| GBPUSD | 1.20053 | 0.09 |
| NZDUSD | 0.6253 | 0.02 |
| USDCAD | 1.29143 | 0.35 |
| USDCHF | 0.9611 | -0.56 |
| USDJPY | 136.069 | -0.97 |
- USD/JPY is advancing towards 137.00 on expectations of widening Fed-BOJ policy divergence.
- A downward shift in inflation estimates and dismal Wall Street earnings have trimmed 1% rate hike odds.
- A minor improvement in Japan’s core CPI displays a recovery in the demand for Durable Goods.
The USD/JPY pair is marching towards 137.00 as investors are betting over the widening Federal Reserve (Fed)-Bank of Japan (BOJ) policy divergence on Wednesday. The asst is gradually moving towards the critical hurdle of 137.00 after a modest rebound at around 136.00 on Friday.
On Wednesday, the interest rate decision by the Fed is expected to elevate its interest rates to 2.5%. A rate hike announcement by 75 basis points (bps) by Fed chair Jerome Powell to combat the inflation monster may support the greenback. Earlier, expectations were soaring for a 1% rate hike as inventors saw price pressures reaching a double-digit figure. However, a downward shift in long-run inflation expectations to 2.8% vs. June print of 3.1% and a dismal second-quarter earnings show on Wall Street have forced the Fed not to pick up a galloping pace.
Meanwhile, the yen bulls remained upbeat last week after the release of Japan’s Consumer Price Index (CPI). The National CPI was trimmed to 2.4% vs. 2.5% reported earlier. While the core CPI climbed to 1% from the prior release of 0.8%. The BOJ remained worried as oil and food prices were keeping the inflation rate above 2%. Now, a recovery in demand for durable goods is going to delight the BOJ policymakers amid an overall recovery.
In spite of higher core CPI in Japan, expectations of a hawkish commentary from BOJ Governor Haruhiko Kuroda have no relevance. The BOJ will continue with its dovish commentary and will keep flushing money into the economy.


© 2000-2026. All rights reserved.
This site is managed by Teletrade D.J. LLC 2351 LLC 2022 (Euro House, Richmond Hill Road, Kingstown, VC0100, St. Vincent and the Grenadines).
The information on this website is for informational purposes only and does not constitute any investment advice.
The company does not serve or provide services to customers who are residents of the US, Canada, Iran, The Democratic People's Republic of Korea, Yemen and FATF blacklisted countries.
Making transactions on financial markets with marginal financial instruments opens up wide possibilities and allows investors who are willing to take risks to earn high profits, carrying a potentially high risk of losses at the same time. Therefore you should responsibly approach the issue of choosing the appropriate investment strategy, taking the available resources into account, before starting trading.
Use of the information: full or partial use of materials from this website must always be referenced to TeleTrade as the source of information. Use of the materials on the Internet must be accompanied by a hyperlink to teletrade.org. Automatic import of materials and information from this website is prohibited.
Please contact our PR department if you have any questions or need assistance at pr@teletrade.global.
transfers