- Analytics
- News and Tools
- Market News
CFD Markets News and Forecasts — 28-07-2022
- DXY struggles to overcome recent losses at multi-day low ahead of the key data.
- “Technical recession” in the US, inflation expectations make data interesting to watch.
- Fed’s preferred inflation gauge for July, second-tier activity numbers will be crucial for intraday direction.
US Dollar Index (DXY) licks its wounds near the 1.5-month low during Friday’s Asian session. That said, the greenback’s gauge versus the six major currencies dropped during the last two days before recently taking rounds to 106.20.
Easing fears of the Fed’s aggressive rate hike, backed by the US Q2 Gross Domestic Product (GDP) release, appear to drown the US dollar of late. On the same line are the US central bank’s neutral rate chatters and Fed Chairman Jerome Powell’s hopes of recovery.
After witnessing challenges for further rate hikes, as signaled by Fed’s Powell, the DXY players should have traced the Flash readings of the US Q2 GDP that marked the “technical recession” by declining for the second consecutive time to weigh on the greenback. That said, the first estimations of the US Q2 GDP printed -0.9% Annualized figure versus 0.5% expected and -1.6% prior. Further, the US Initial Jobless Claims also rose more than expected by 253K, with 256K during the week ended on July 22.
Elsewhere, US policymakers, including Fed’s Powell and Treasury Secretary Janet Yellen, tried to shrug off the “technical recession” after the US Q2 GDP dropped for the second consecutive time and teased the concept. The same probes the central bankers pushing for more rate hikes to tame inflation. Furthermore, talks between US President Joe Biden and his Chinese Counterpart Xi Jinping also went mostly okay and exerted downside pressure on the DXY.
Above all, heavy gains of the Wall Street benchmarks and the downside of the Treasury yields seemed to have drowned the US Dollar Index.
On the contrary, inflation expectations data, as per the 10-year breakeven inflation rate per the St. Louis Federal Reserve (FRED), refreshed the monthly high to 2.48% and renewed fears of higher Fed rates during the late Thursday, which in turn teased DXY buyers.
Hence, the Fed’s preferred inflation gauge, namely the Core Personal Consumption Expenditure (PCE) Price Index, expected 0.5% MoM for July versus 0.3% prior, will be important to watch for fresh impulse.
Technical analysis
A daily closing below the two-month-old ascending trend line, around 106.55 by the press time, directs DXY bears towards June’s peak of 105.79.
- AUD/USD bulls tale control and have the 0.7000s clocked.
- There is a bullish bias on the time frames with 0.7005 eyed for the session ahead.
As per the prior analyses, AUD/USD Price Analysis: Bulls eye a break of 0.6980 or face a move lower, and, AUD/USD bulls cheer a less hawkish outcome at the Fed, the bulls stay in control.
AUD/USD, daily & H4 chart, prior analyses
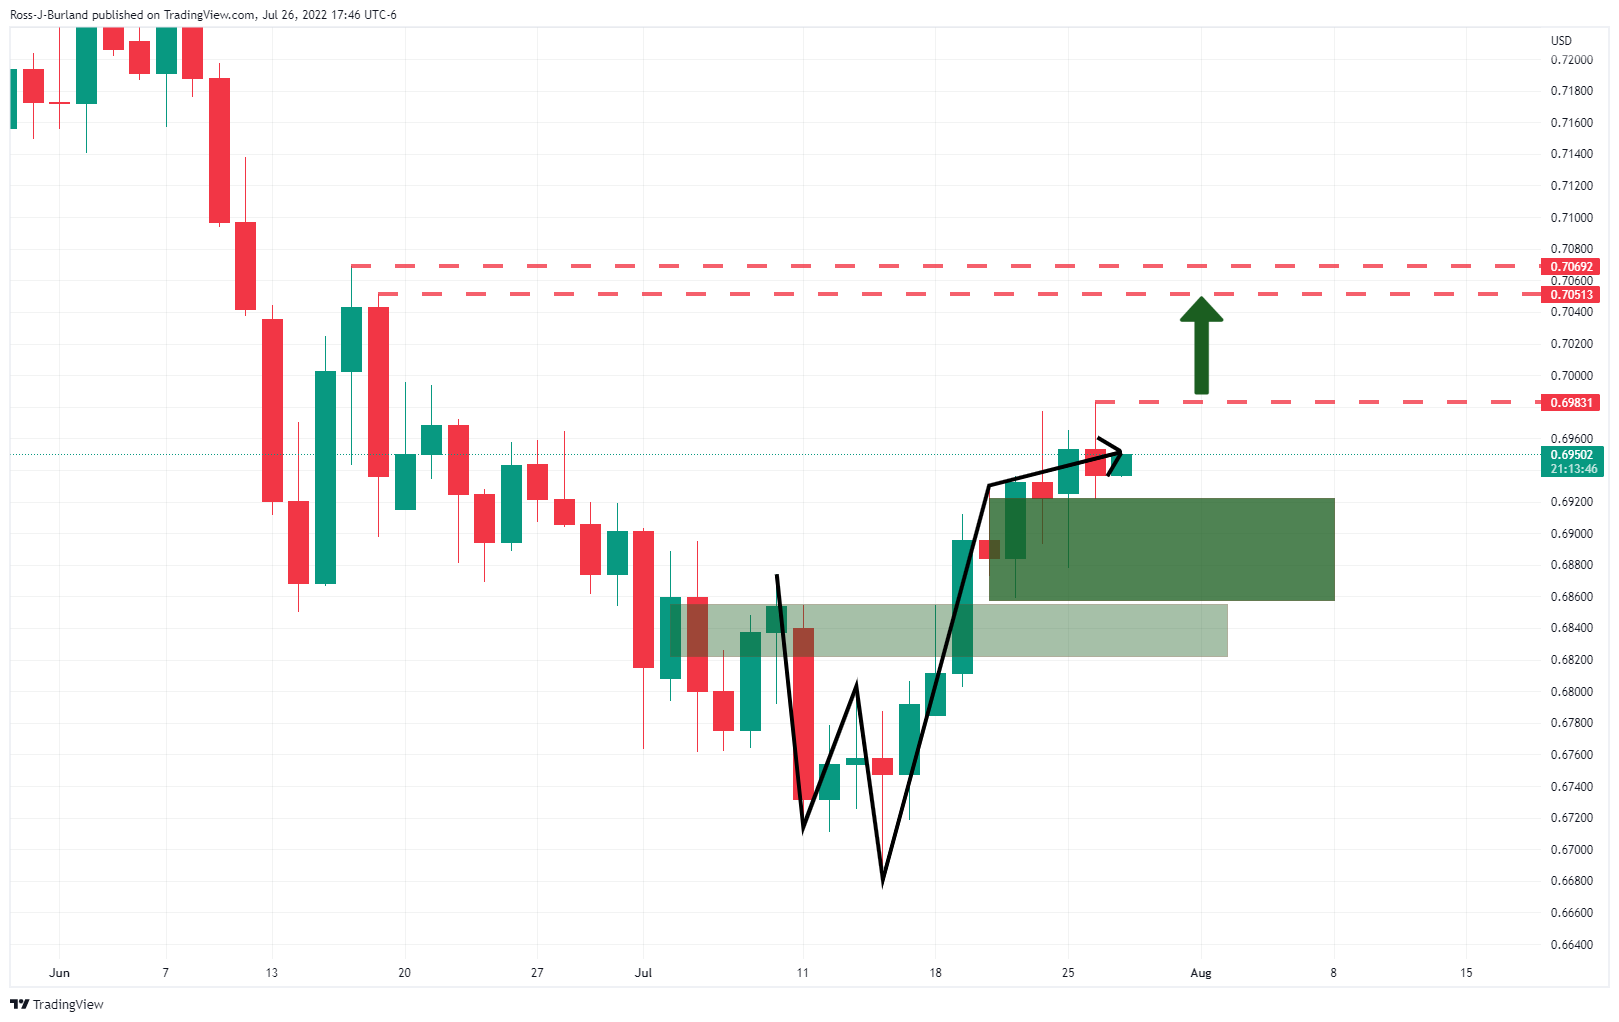
From a 4-hour perspective, below, the price had almost completely mitigated the price imbalance between 0.7003 and 0.7013 which left the scope for a bearish correction, prior to the next bullish impulse.
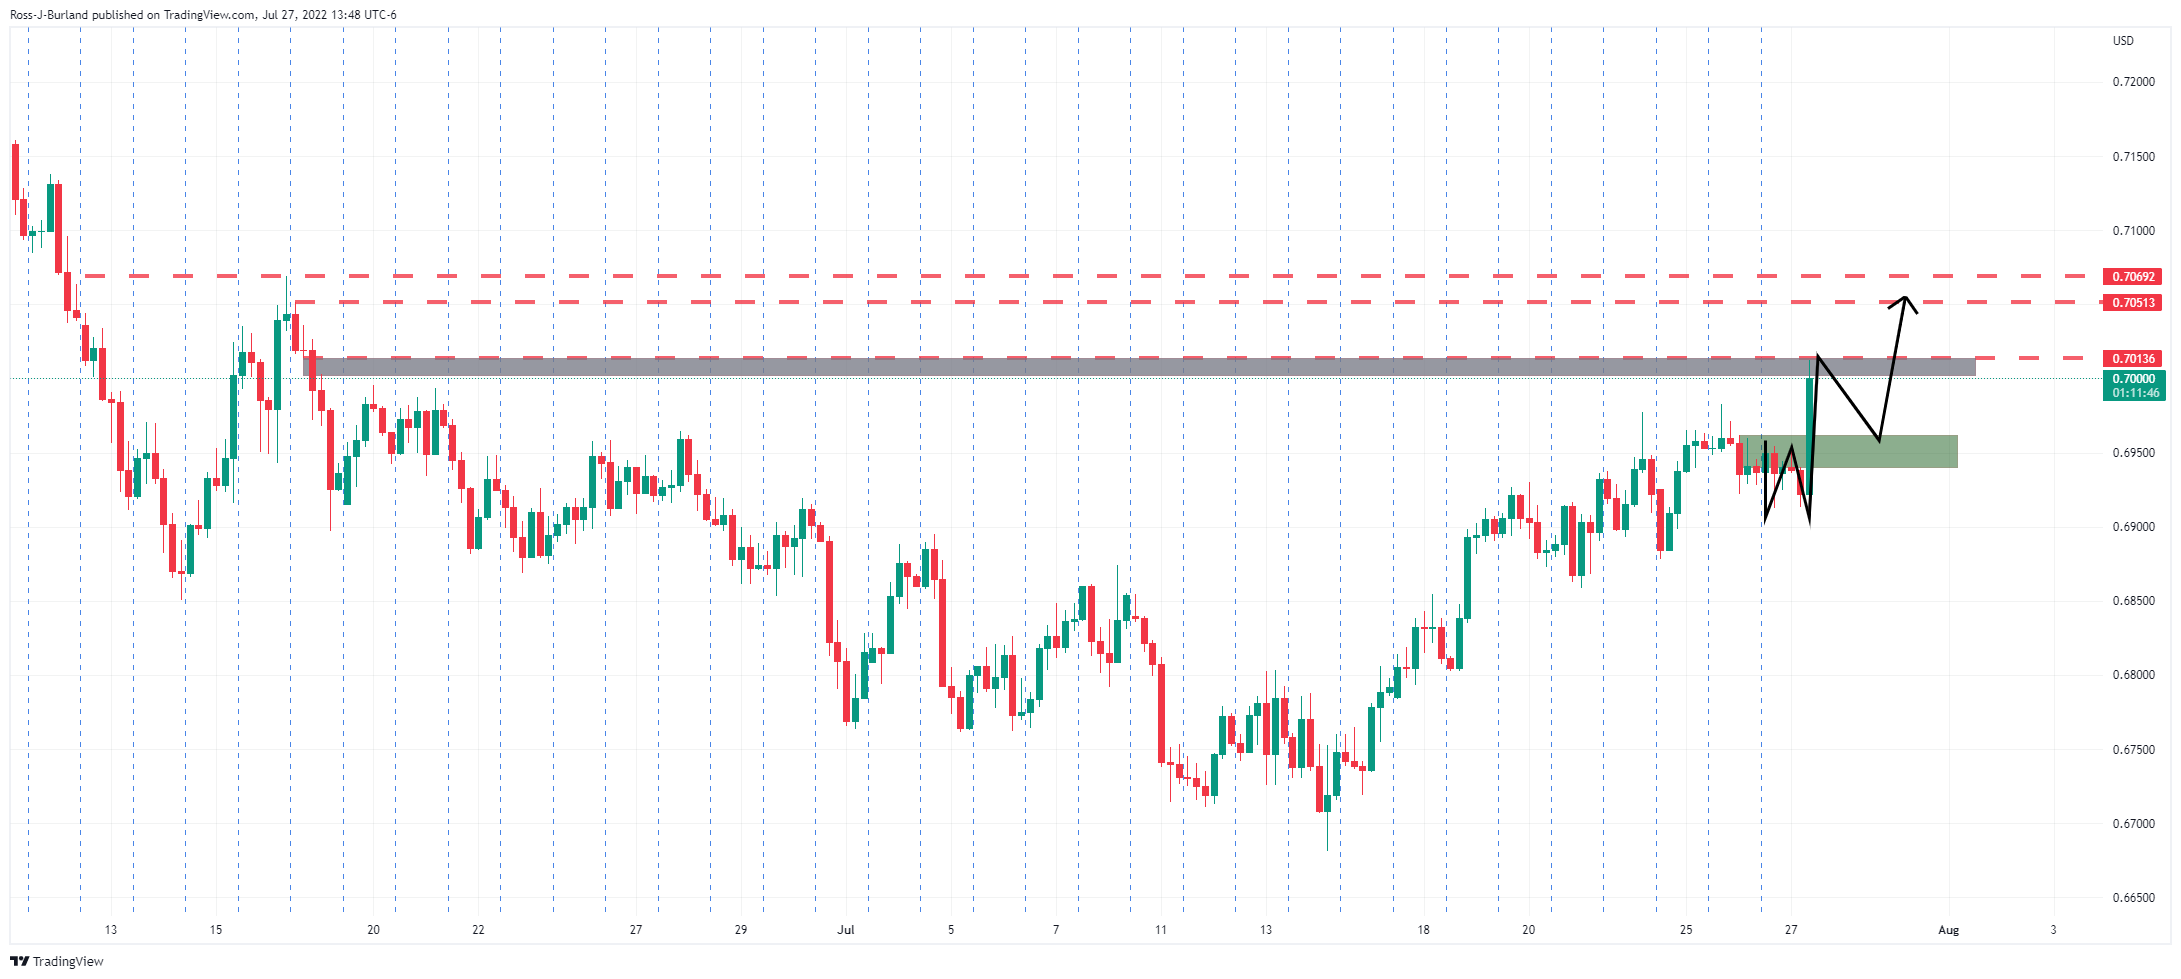
AUD/USD live market
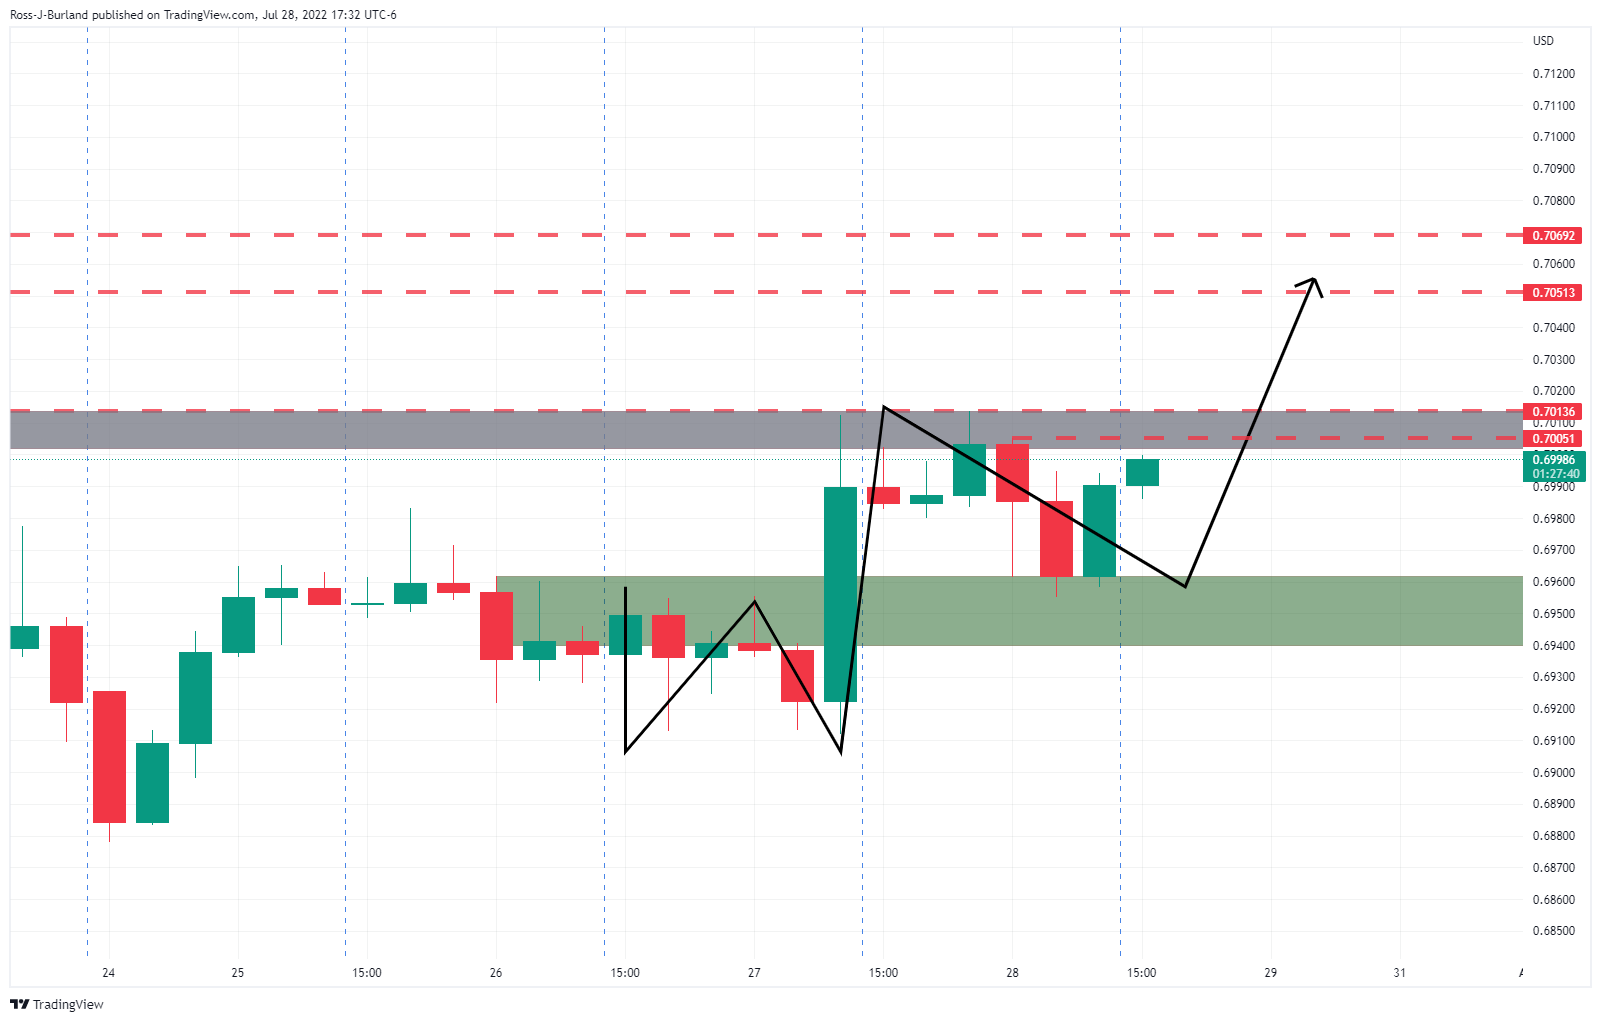
The price is playing out according to the above analysis as per the 4-hour chart above. If 0.7005 gives, then 0.7013 and the 0.7050s will be eyed.
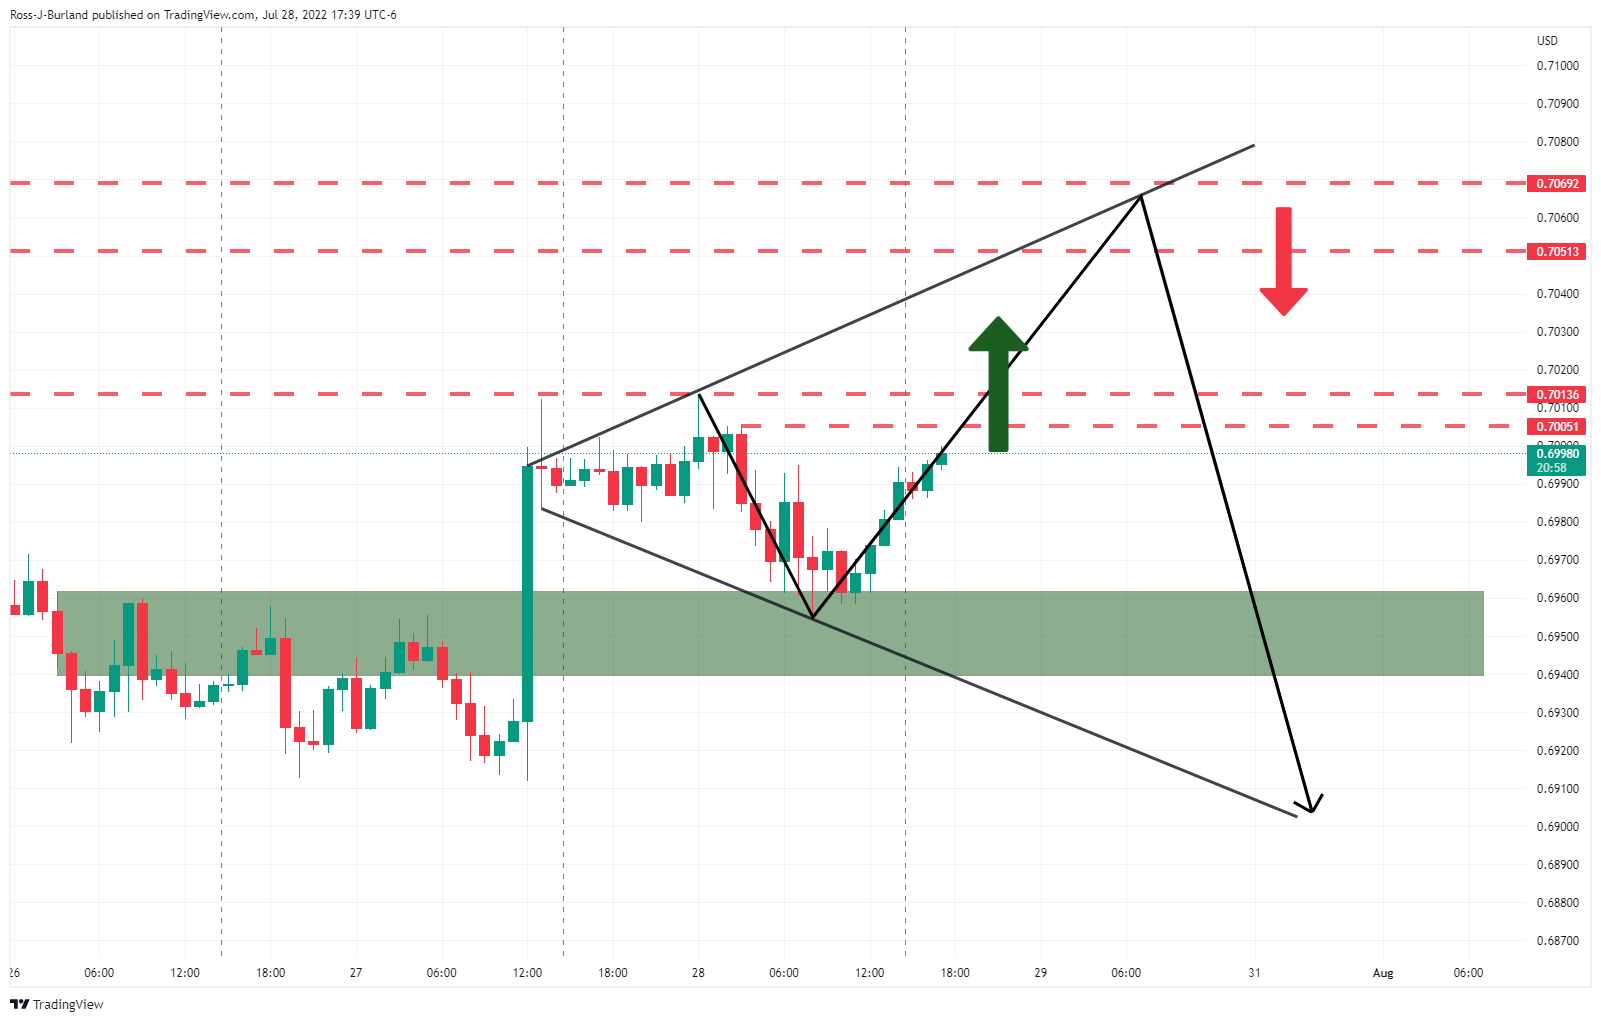
From an hourly perspective, as per the chart above, the broadening formation is worth acknowledging and currently favours the upside.
- WTI picks up bids to reverse pullback from weekly high.
- Convergence of 21-DMA, three-week-old triangle’s upper line challenges buyers.
- Sellers should wait for a sustained break of 1.5-month-old support line.
WTI crude oil prices pare recent losses around $96.50 during Friday’s Asian session. In doing so, the black gold again tried to cross a three-week-long symmetrical triangle after the previous day’s failed attempt.
Also keeping the commodity buyers hopeful is the quote’s sustained trading beyond the descending trend line from June 14, as well as the bullish MACD signals and firmer RSI (14).
Even so, the WTI buyers need a daily closing beyond the $98.00 comprising the stated triangle’s upper line and the 21-DMA, to keep reins.
Following that, a run-up towards the highs marked during July 19 and 08, respectively near $100.70 and $102.80, will be in focus.
It should be noted that the month-start low of $103.11 could act as the last defense for WTI bears.
Meanwhile, pullback moves need to break the previous resistance line from mid-June, near $95.80 to tease sellers.
Even so, the triangle’s bottom around $94.80 and multiple supports near $91.60 could test the commodity’s further downside before directing it to the recent low near $88.35.
WTI: Daily chart
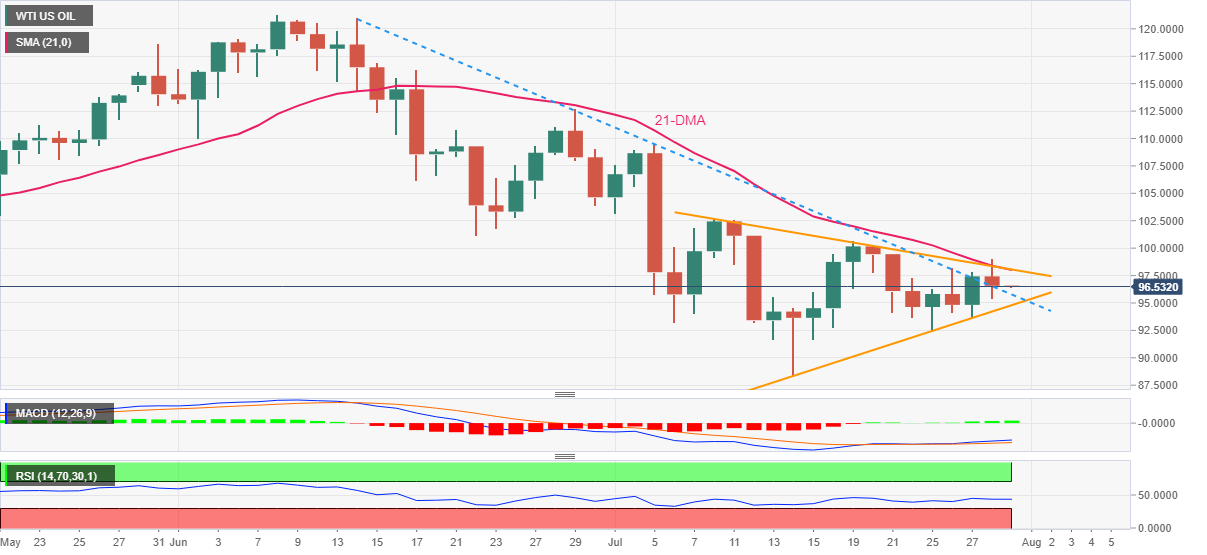
Trend: Further recovery expected
- USD/JPY has found offers around 134.50 as the DXY is expecting more downside ahead of US PCE.
- Yen bulls have been infused fresh blood on higher consensus for employment data.
- Fed’s preferred inflation tool may elevate to 6.7% vs. 6.3% recorded earlier.
The USD/JPY pair has faced strong hurdles around 134.50 after attempting a mild recovery from a monthly low of around 134.20. The asset extended its downside move on Thursday after violating the critical support of the July 22 low at 135.57. A sheer downside move in the asset is backed by broader weakness in the US dollar index (DXY) and higher consensus for Japanese employment data, which is due on Friday.
Japan’s unemployment rate may trim to 2.5% vs. the prior release of 2.6%. Also, the Jobs/Applicants ratio is expected to increase to 1.25 from the former figure of 1.24. An occurrence of the same will strengthen Tokyo further.
The release of the downbeat US Gross Domestic Product (GDP) data has resulted in a laborious job for Federal Reserve (Fed) policymakers. The deadly combination of a solid labor market and upbeat economic data were major drivers of confident Fed policymakers.
The strength of economic catalysts was empowering the Fed for tightening monetary policy unhesitatingly. Now, less-than-expected hawkish guidance by the Fed and vulnerable US economic data are responsible for the vulnerable performance of the DXY. The DXY has tumbled to near 106.00 and is likely to surrender the cushion sooner rather than later.
In today’s session, the release of the US Personal Consumption Expenditure (PCE) data will be the show-stopper event. Fed’s preferred inflation indicator to judge the extent of price pressures in the economy is seen at 6.7%, higher than the former figure of 6.3%. This will keep the need for more policy tightening measures at elevated levels.
- GBP/USD buyers struggle to keep reins around one-month high.
- UK politics gain major attention as the first Conservative Party hustings favor Truss.
- US fell into a “technical recession” and pushed back the Fed hawks, exerting downside pressure on the USD.
- US Core PCE Price Index eyed for fresh impulse amid firmer inflation expectations.
GBP/USD seesaws near the one-month high as bulls and bears jostle ahead of the key US data, as well as due to the mixed signals, during Friday’s Asian session.
That said, the Cable pair rose during the last two consecutive days on broad US dollar weakness. It’s worth noting that the political jitters in the UK and Brexit woes, as well as the US dollar’s consolidation ahead of the key US inflation data, are likely weighing on the GBP/USD prices.
The market’s expectations of no more aggressive rate hikes from the Fed, backed by the US Q2 Gross Domestic Product (GDP) release, appear to favor the US dollar weakness. On the same line are the US central bank’s neutral rate chatters and Fed Chairman Jerome Powell’s hopes of recovery.
It should be noted that the Flash readings of the US Q2 GDP printed -0.9% Annualized figure versus 0.5% expected and -1.6% prior. With the second consecutive negative GDP print, the US fall into a “technical recession”, which in turn probes the Fed hawks and exerts downside pressure on the US dollar.
However, inflation expectations data, as per the 10-year breakeven inflation rate per the St. Louis Federal Reserve (FRED), refreshed the monthly high to 2.48% and renewed fears of higher Fed rates during the late Thursday, which in turn weighed on the GBP/USD prices.
At home, the first of 12 political hustings for Conservative Party leadership didn’t go well in favor of Rishi Sunak as policymakers accused him of stabbing Boris Johnson. On the other hand, Liz Truss gets an uncomfortable question on the monarchy, per Sky News. Furthermore, a survey from the British Chambers of Commerce (BCC) mentioned that a survey found that quarter of 2600 exporters had suffered a fall in exports and another 46% reported no change, reported The Guardian.
Against this backdrop, the Wall Street benchmarks closed positive but the Treasury yields slumped and the US Dollar Index (DXY) refreshed its multi-day low while extending the post-Fed losses.
Moving on, the Fed’s preferred inflation gauge, namely the Core Personal Consumption Expenditure (PCE) Price Index, expected 0.5% MoM for July versus 0.3% prior, will be important to watch for fresh impulse.
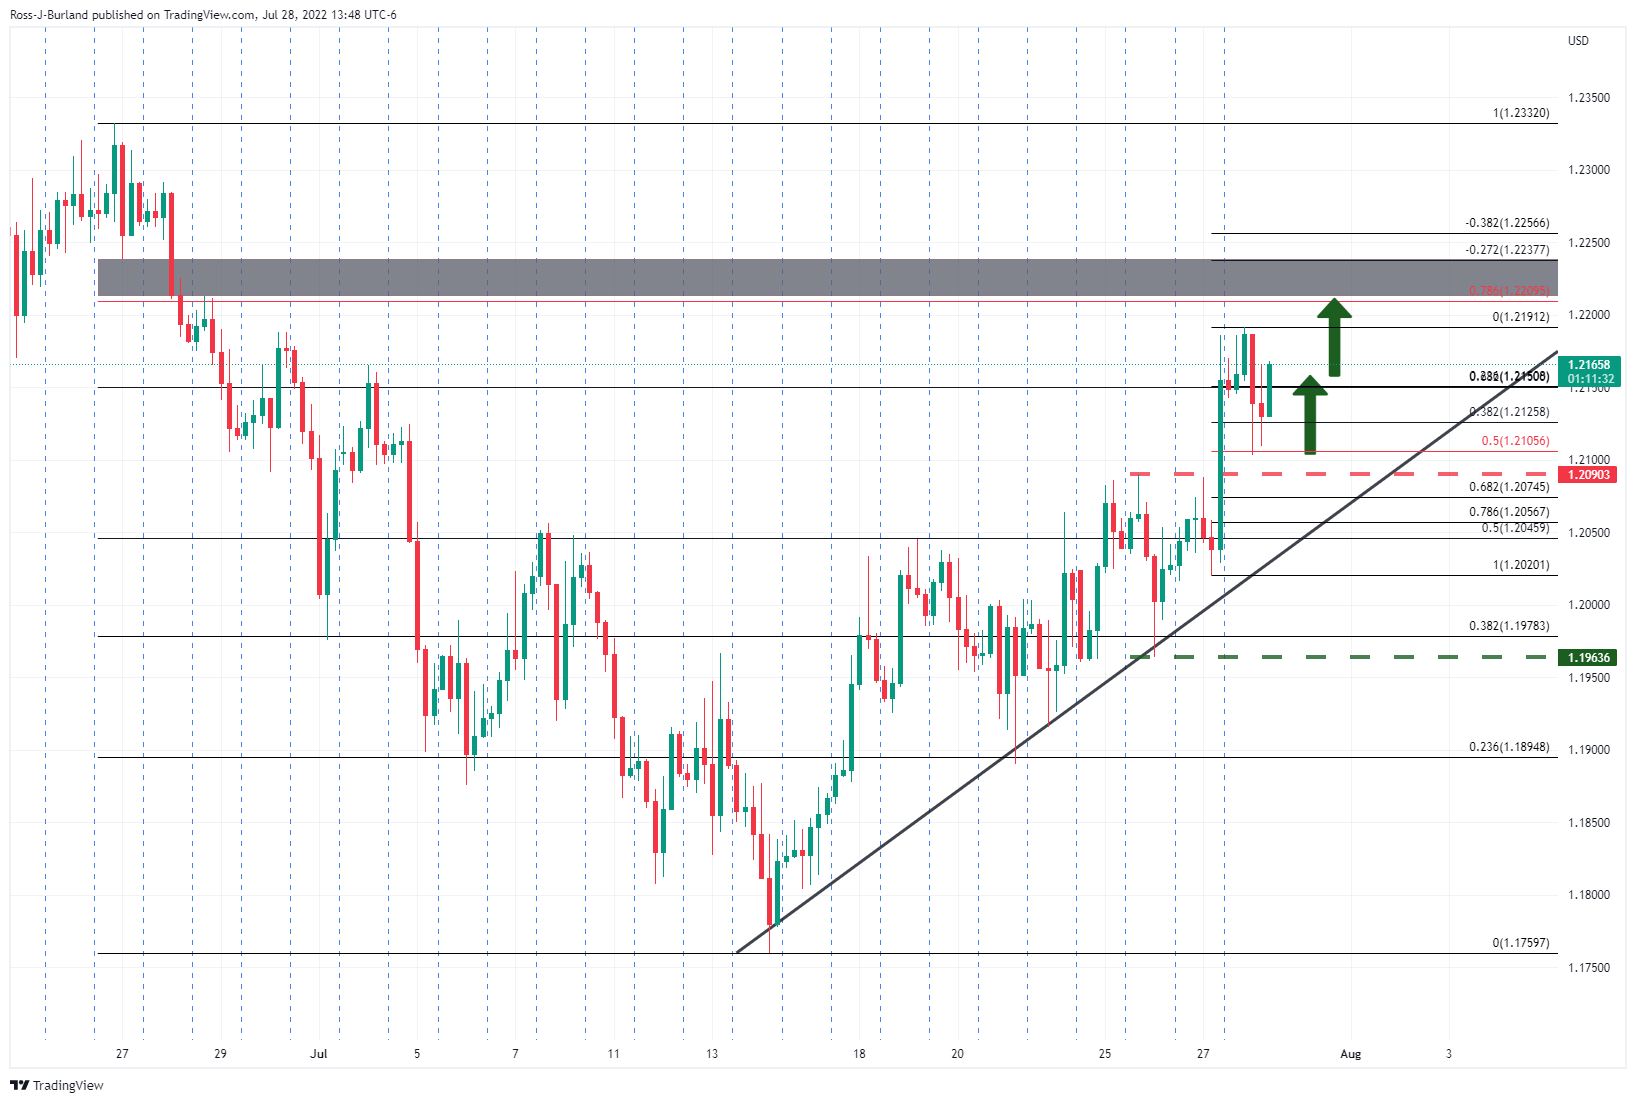
Technical analysis
A clear upside break of the 1.5-month-old descending trend line, now support around 1.2075, favors the GBP/USD buyers to aim for the 50-DMA hurdle surrounding 1.2225.
- NZD/USD is moving higher into the next critical US data.
- The US dollar has been bleeding out following poor US data and the Fed.
NZD/USD is trading at 0.6291 and a touch higher in early Asia ahead of the Tokyo equities open. The pair has benefitted from a friendlier environment in the commodities and equities space following the Federal Reserve meeting on Wednesday and a statement that left the futures markets tied to Fed policy expectations tilted towards a more moderate increase for the next meeting.
The Fed has led to a softer US dollar which is now treading water around the lower quarter of the 106 area as per DXY, an index that measures the greenback vs. a basket of major currencies. Markets were also digesting the weaker US growth data following on from the Fed chairman's relatively dovish comments the prior day. On Thursday, the US Gross Domestic Product was reported to have fallen at a 0.9% annualized rate last quarter, the Commerce Department said in its advance estimate of GDP. Economists polled by Reuters had forecast GDP rebounding at a 0.5% rate.
For the end of the week, US inflation and wages data will be pivotal, analysts at ANZ Bank say – ''any signs of weakness will likely only exacerbate the recent rally in rates and top out DXY.''
Domestically, the second quarter labour market data are released next Wednesday (3 August). The analysts at ANZ Bank said that they anticipate that the data will confirm the ongoing labour market tightening seen in timely indicators, survey data, and anecdotes.
''We expect unemployment declined to 2.8% in Q2 (vs. 3.2% in Q1). And while we can’t discount that typical HLFS volatility could see unemployment come in above our expectation, risks are skewed towards a still-lower number.''
They explained that the tight labour market is turning into an increasingly intense headache for the Reserve Bank of New Zealand.
''The gaping chasm between labour demand and supply is likely to be a key driver of persistently too-high domestic inflation pressure over the next year. We expect ongoing 50bp hikes will bring the OCR to 4% by year-end. That’s consistent with market pricing, but a stronger-than-expected jobs report could see a market reaction nonetheless.''
- Silver price extends its weekly rally after bottoming around $18.00.
- XAGUSD soars on falling US Treasury yields which undermine the greenback.
- The US economy taps into recessionary territory as GDP shrank by 0.9%.
Silver price rallied for three consecutive days, gaining almost 9% in the week courtesy of traders’ upbeat mood, on the perception of a Fed “dovish” tilt, spurring lower US treasury yields and weakening the US dollar. Alongside the previously mentioned, a dismal US GDP reading for the second quarter decreased bets that the US Federal Reserve would keep tightening at its current pace as the stagflationary scenario worsens. At the time of writing, XAGUSD is trading at $19.91.
XAGUSD soars on falling US Treasury yields which undermine the greenback
US equity futures rise on the back of positive US corporate earnings. In the meantime, falling US Treasury yields, led by the 10-year note rate slashing 12 bps, yielding just 2.671%, bolstered the appetite for the white metal.
On Thursday, the US Department of Commerce revealed that US GDP for Q2 shrank at a 0.9% YoY pace after declining 1.6% in the first quarter, meaning that the US is in a technical recession. At the same time, the US Department of Labor reported that Initial Jobless Claims for the week ending on July 23 rose by 256K, higher than forecasts but lower than the previous week’s 261K.
During the day, the greenback weakened, undermined by falling US bond yields. The US Dollar Index is losing 0.24% and sits at 106.206 after hitting a daily high at 106.975.
On Wednesday, the Federal Reserve hiked 75 bps the Federal funds rate (FFR). In the monetary policy statement, the Fed acknowledged that the economy is slowing, but it also emphasized its commitment to bringing inflation down to its 2% target. Nevertheless, money market futures pared back further rate hikes by the Fed, as they are pricing in less than 100 bps of tightening, foreseeing the FFR to finish around 3.25%.
Also read: Gold Price Forecast: XAUUSD conquers $1,750 as US Q2 GDP shrinks, flashing a recession
What to watch
The US economic docket will feature the Personal Consumption Expenditures (PCE) on its headline and core readings. Later, the University of Michigan (UoM) Consumer Sentiment for July’s final reading will be revealed.
Silver (XAGUSD) Key Technical Levels
- AUD/JPY has moved to 94.00 as yen bulls lose momentum ahead of employment data.
- Japan’s jobless rate may trim to 2.5% vs. 2.6% reported earlier.
- The downbeat aussie Retail Sales data may keep the antipodean on the back foot.
The AUD/JPY pair has witnessed a firmer recovery after printing a low of 93.57 on Thursday. The risk barometer has rebounded after sensing a loss of momentum. The downside move in the cross exhausted as investors turned cautious ahead of the Japanese employment data.
On Thursday, the commentary from Bank of Japan (BOJ) Deputy Governor Masayoshi Amamiya strengthened the Japanese yen. BOJ policymaker supported the monetary policy easing and its continuation to support the wage rates as the catalyst will remain a key driver to keep inflation rate above 2%.
It is worth noting that the Japanese economy has failed to return to the pre-pandemic growth levels led by lower demand and inflation rates. To accelerate the same, the BOJ is keep buying the Japan Government Bonds (JGBs) and is focused to deploy helicopter money in the economy.
Apart from that, higher consensus for Japanese employment data also strengthened the yen bulls. The jobless rate may trim to 2.5% vs. the prior release of 2.6%. Also, the Jobs/Applicants ratio is expected to increase to 1.25 from the former figure of 1.24.
Meanwhile, the aussie bulls are likely to remain in the hangover of the downbeat Retail Sales for a little longer. The Australian Retail Sales data landed at 0.2%, significantly lower than the expectations of 0.5% and the prior release of 0.9%. The economic data was highly likely to remain upbeat as a higher inflation rate is resulting in more payouts by the households.
Although the US economy fell into “technical recession” the previous day, inflation expectations data, as per the 10-year breakeven inflation rate per the St. Louis Federal Reserve (FRED), refreshed the monthly high by the end of Thursday’s North American session.
That said, the inflation gauge recently jumped to the 2.48% mark during the three-day uptrend while refreshing the monthly peak.
It should be noted that the Flash readings of the US Q2 GDP printed -0.9% Annualized figure versus 0.5% expected and -1.6% prior. With the second consecutive negative GDP print, the US fall into a “technical recession”, which in turn probes the Fed hawks and exerts downside pressure on the US dollar.
However, the recent jump in the US inflation expectations ahead of the Fed’s preferred inflation gauge, namely the Core Personal Consumption Expenditure (PCE) Price Index, for July, could underpin the US dollar’s rebound from a 1.5-month low.
Also read: Forex Today: Technical recession is not a recession?
- USD/CAD remains pressured around 1.5-month low, bears approach descending support line from mid-June.
- Bearish MACD signals, downbeat RSI joins daily closing below 100-day EMA to favor sellers.
- Buyers need validation from monthly horizontal resistance, sellers could aim for 200-day EMA.
USD/CAD stays depressed around a seven-week low near 1.2800 during Friday’s Asian session. In doing so, the Loonie pair sellers keep reins around the short-term key support line.
It’s worth noting, however, that the quote’s first daily closing below the 100-day EMA since early June joins the downbeat RSI (14), not oversold, as well as bearish MACD signals, to hint at the pair’s further declines.
Hence, the USD/CAD bears await a clear downside break of the descending support line from June 14, at 1.2790 by the press time, to excel.
Following that, the 200-day EMA level near 1.2750 and the 61.8% Fibonacci retracement of April-July upside, near 1.2715, will be in focus before directing the sellers towards a three-month-long support line, near 1.2615 at the latest.
On the contrary, a confluence of the 100-day EMA and 50% Fibonacci retracement level guards the quote’s recovery moves around 1.2815.
Also acting as a strong upside hurdle for the USD/CAD buyers is a horizontal area established from June 30, close to 1.2940.
USD/CAD: Daily chart
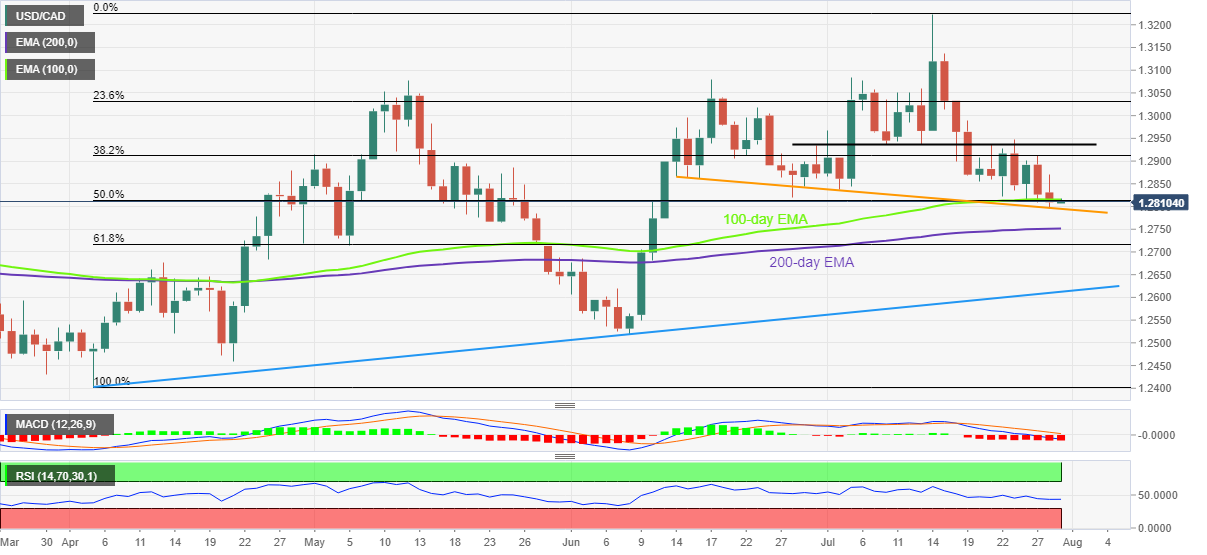
Trend: Further weakness expected
- USD/CHF is aiming to recapture monthly lows around 0.9500 as poor US GDP data has weakened DXY.
- A slump in economic activities and retail demand mark as the beginning of a recession in an economy.
- In today’s session, the US PCE and Swiss Real Retail Sales data will remain in limelight.
The USD/CHF pair has displayed a less-confident reversal after hitting a low of 0.9540 in the late New York session. The further downside remains warranted as the asset is likely to carry forward its three-day losing streak after a downbeat US Gross Domestic Product (GDP) data, released on Thursday. A downside move would drag the asset towards its monthly low at 0.9504.
The US Bureau of Economic Analysis reported the annualized GDP for the second quarter at -0.9%, which has been improved from the prior release of -1.6% but remained lower than the consensus of 0.5%. Back-to-back downbeat performance on the retail demand and productivity front in the US economy is raising concerns for the Federal Reserve (Fed).
A slump in economic activities and retail demand marks the beginning of a recession in an economy. The resurgence of recession and a picture-clear interest rate extent by the Fed till the end of 2022 has weakened the US dollar index (DXY).
In today’s session, the US Personal Consumption Expenditure (PCE) inflation data carries utmost importance. The economic data is likely to release at 6.7%, higher than the former figure of 6.3%. This indicates that the price pressures are not going to find a peak in the nearest future and the Fed will be blamed further for their higher responsive action towards the soaring interest rates.
However, the Swiss franc economy will report the annual Real Retail Sales data. Earlier, the economic data landed at -1.6% and this time the economic catalyst is expected to remain higher as soaring energy bills and prices of food products will elevate the end figure. However, a slippage in the economic data will indicate a major slump in the overall demand. This may weaken the Swiss franc bulls ahead.
- EUR/USD fails to overcome recent losses and remains sidelined around 21-day EMA hurdle.
- US dollar stays pressured near three-week low as “technical recession” push back Fed hawks.
- Germany’s inflation data, European gas crisis probe pair buyers.
- German/Eurozone GDP, Eurozone CPI precede US Core PCE Inflation to direct short-term moves.
EUR/USD dribbles around 1.0200, after paring most of the daily losses, as traders await the key data from Eurozone and the US. Even so, the bulls remain pressured during Friday’s initial Asian session amid recession fears, following the negative daily close of the previous day.
The major currency pair’s latest rebound could be attributed to the US dollar’s slump amid the market’s expectations of no more aggressive rate hikes from the Fed. The US Q2 Gross Domestic Product (GDP) release could be linked to the same, in addition to the US central bank’s neutral rate chatters and Chairman Powell’s hopes of recovery.
On Thursday, the Flash readings of the US Q2 GDP printed -0.9% Annualized figure versus 0.5% expected and -1.6% prior. Further, the US Initial Jobless Claims also rose more than expected by 253K, with 256K during the week ended on July 22.
It’s worth noting that the various US policymakers, including Fed’s Powell and Treasury Secretary Janet Yellen, tried to shrug off the “technical recession” after the US Q2 GDP dropped for the second consecutive time and teased the concept. The same probes the central bankers pushing for more rate hikes to tame inflation.
On the contrary, Germany’s inflation data flashed mixed signals as the Consumer Price Index (CPI) dropped to 7.5% YoY versus 7.6% prior but the Harmonised Index of Consumer Prices (HICP) climbed to 8.5% yearly, versus 8.2% prior in July. Additionally, the European Commission reported, "In July 2022, the Economic Sentiment Indicator (ESI) plummeted in both the EU (-4.2 points to 97.6) and the euro area (-4.5 points to 99.0), falling below its long-term average.”
Other than the data, fears of economic slowdown in the old continent, due to the gas crisis, also probed the EUR/USD bulls.
Amid these plays, the Wall Street benchmarks closed positive but the Treasury yields slumped and the US Dollar Index (DXY) refreshed its multi-day low while extending the post-Fed losses.
Moving on, the initial readings of German and Eurozone GDP for the second quarter (Q2) of 2022, as well as Eurozone Consumer Price Index (CPI) for July, will be important ahead of the Fed’s preferred inflation gauge, namely the Core Personal Consumption Expenditure (PCE) Price Index, for July.
Also read: Eurozone Inflation Preview: Signs of peak inflation, not yet
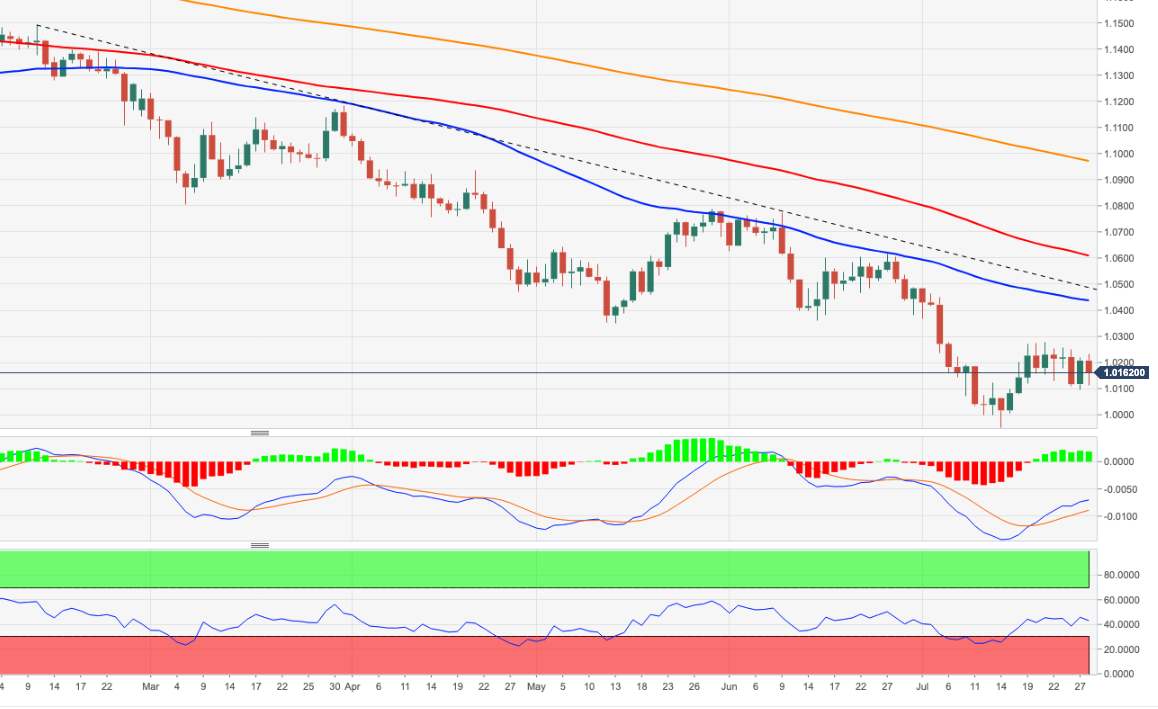
Technical analysis
21-day EMA around 1.0230 keeps restricting short-term EUR/USD up-moves but the gradual firming of the RSI (14) line hints at the quote’s further upside. That said, two-week-old horizontal support near 1.0120 challenges sellers.
- Safe-haven peers rallied vs. most G8 currencies, including the euro.
- EUR/JPY plunged more than 200 pips on Thursday and lost 1.70%.
- EUR/JPY Price Analysis: It might aim towards 135.30 once sellers reclaim 136.85.
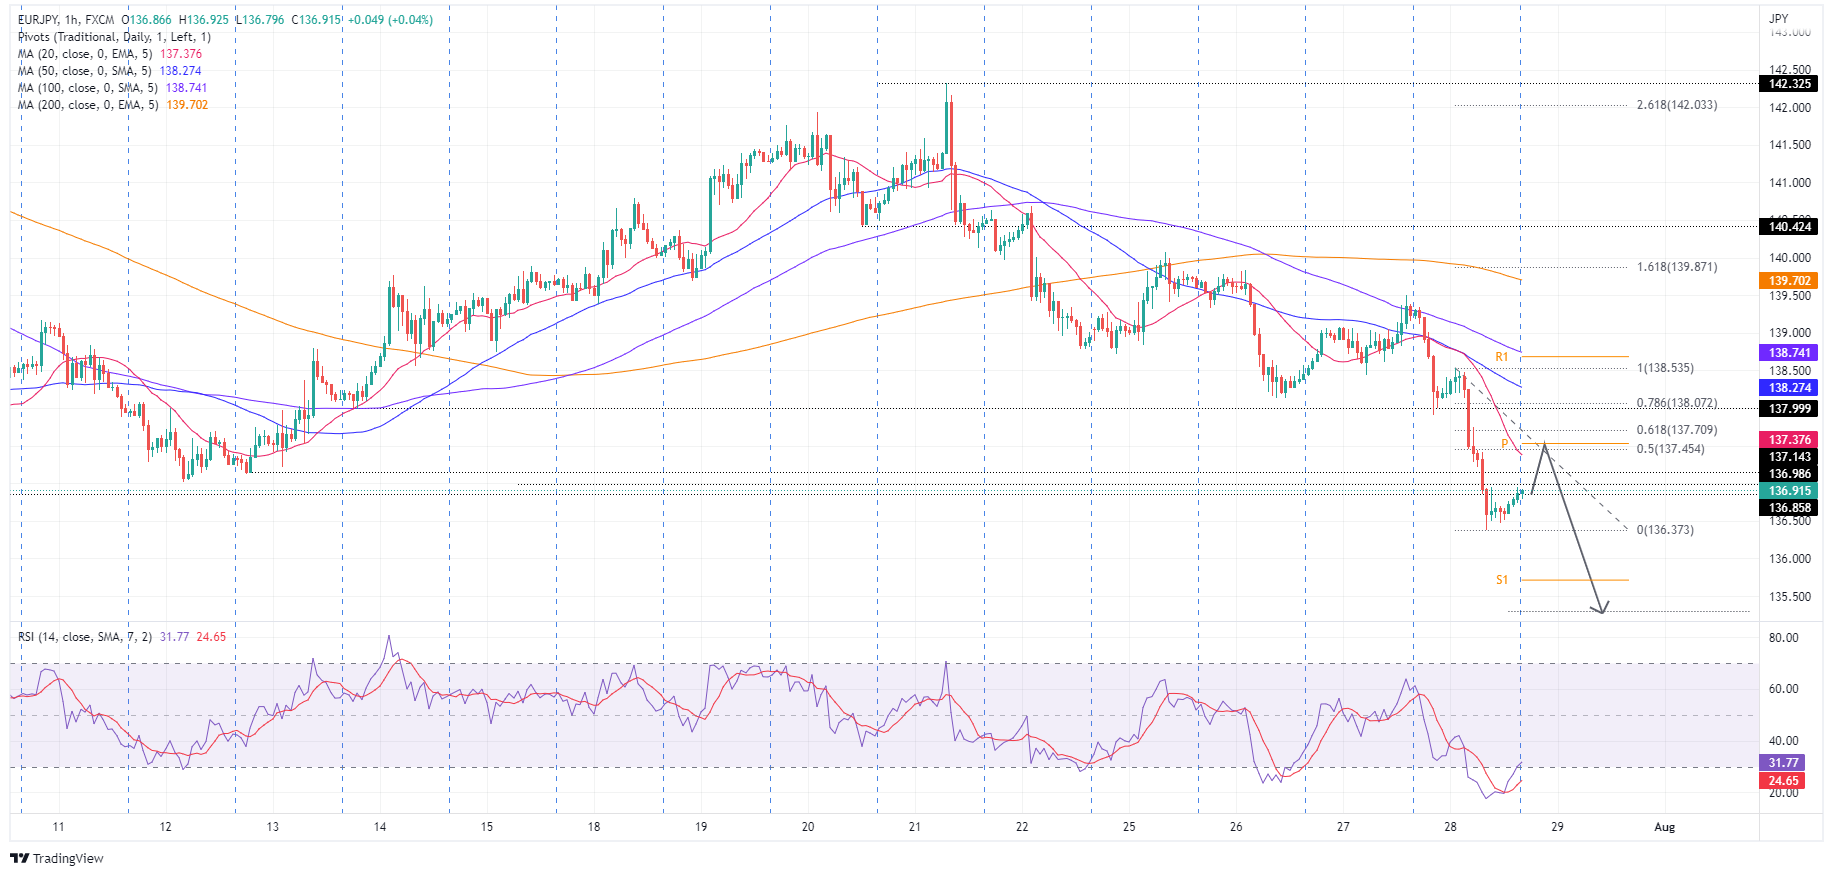
EUR/JPY nosedived below the 100-day EMA on Thursday, spurred by dismal US economic data, reporting that Q2 GDP shrank for the second straight month, tapping the economy into a “technical recession.” Traders in the equity markets ignored the news, but in the FX space, safe-haven peers flourished. The EUR/JPY is trading at 136.91, slightly up 0.02% as the Asian session begins.
EUR/JPY Price Analysis: Technical outlook
From a daily chart perspective, the EUR/JPY shifted to neutral-downward biased. Even though the EUR/JPY 200-day EMA sits at 133.67 below the exchange rate, the break of the 100-day is significant. Nevertheless, EUR/JPY sellers need to reclaim the July 8 daily low at 136.85, which might be achieved as the Relative Strength Index (RSI) is in bearish territory, with enough room before reaching oversold levels. Once that level is cleared, it would pave the way for a EUR/JPY move towards 136.00.
EUR/JPY 1-hour chart
The EUR/JPY hourly chart depicts sellers losing steam, as the Relative Strength Index (RSI) is in oversold conditions. The cross-currency bottomed around 163.37, which would be the first support level, as EUR sellers take a breather. EUR/JPY traders should be aware that the pair might print a leg-up towards the confluence of the daily pivot and the 50% Fibonacci retracement around the 137.45-55 area before resuming downwards towards the EUR/JPY sellers’ target at 135.30.
EUR/JPY Key Technical Levels
- AUD/USD is scaling towards 0.7000 firmly as the DXY is likely to surrender the cushion of 106.00.
- A downbeat performance on the US GDP front has weakened the DXY further.
- Investors will keep an eye on the US PCE inflation measure for further guidance.
The AUD/USD pair is marching towards the psychological resistance of 0.7000 swiftly after concluding the corrective move to near 0.6960 in the late New York session. The asset attempted to establish above 0.7000 on Thursday, however, the downbeat Australian Retail Sales data weakened the aussie bulls and dragged the asset.
The Australian Retail Sales data landed at 0.2%, significantly lower than the expectations of 0.5% and the prior release of 0.9%. Investors should be aware of the fact that the inflation rate has remained firmer in the Australian economy. The Australian Bureau of Statistics, on Wednesday, reported the inflation rate for Q2CY22 at 6.1%. The investing community is aware of the fact that higher energy bills and costly food products have resulted in higher payouts for households.
Therefore, the Retail Sales data should have soared dramatically but a vulnerable performance from the economic data indicates that the overall demand from the retail participants has remained extremely lower. An occurrence of the same pushed aussie on the back foot.
On the dollar front, the US dollar index (DXY) is likely to renew its monthly print as poor US Gross Domestic Product (GDP) has acted as the last nail in the coffin. The annualized GDP for the second quarter improved to -0.9% from the prior release of -1.6% but remained lower than the consensus of 0.5%. The DXY is likely to surrender the cushion of 106.00 as poor GDP data has hurt DXY buyers’ sentiment.
Going forward, investors will focus on the Federal Reserve (Fed)’s preferred Personal Consumption Expenditure (PCE) Price Index inflation indicator to judge the extent of price pressures in the economy. The economic data is seen at 6.7%, higher than the former figure of 6.3%.
- Gold is firm into the close of the US forex session as the US dollar sheds some points.
- US yields are under pressure following the Fed and gold bulls are back in play.
At $1,756.64, gold prices continue to rise on Thursday even as the US dollar attempted a comeback. However, bond yields remain on the backfoot following the Federal Reserve's dovish tilt on Wednesday. At the time of writing, XAU/USD is 1.25% higher after climbing from a low of $1,734.18 to reach $1,757.06 the high of the day.
Bad news was good news for US stocks on Thursday stocks, which have extended their bullish recovery following disappointing US growth data that has added to the dovish sentiment surrounding the path of rate hike expectations from the Fed. US second quarter Gross Domestic Product came in weaker than expected, declining 0.9% in SAAR terms (exp: +0.4%, prev: -1.6%). However, while technically, this meets the two-quarters of negative growth definition of a recession, analysts at ANZ bank argue that the details were a little stronger than the headline number suggests.
''A lot of the weakness came from inventories which subtracted 2%pts from the headline figure. Personal consumption growth was positive, rising 1%, but still underwhelming expectations (exp: 1.2%, prev: 1.8%). Private fixed investment was weak, declining 3.9%.'' However, ''all up'', the analysts say, ''it was still a disappointing report, even when accounting for the outsized influence of the inventories number (which the Fed may be inclined to disregard as noise). This will only fuel the current concern markets have about a slowdown in US economic activity.''
Meanwhile, the analysts noted that ''Initial Claims were weaker than expected, at 256k. But that came as last week’s number was revised higher. Overall, claims are still at levels that are too low to suggest a deterioration in the labour market is imminent – a key ingredient for a fundamental recession in the US.''
The US dollar was higher following the data, although the bears moved in later in the session and the DXY is currently trading at the lows of the day. DXY has fallen from a high of 106.975 to a low of 106.059. Nevertheless, bond yields dropped, bullish for gold since it offers no interest. The US 10-year note was last seen paying as low as 2.649%, down by over 3.8%.
Meanwhile, the bar for CTA short covering in gold is declining, analysts at TD Securities argued. ''Given the slowing trend in data, Chair Powell's forward guidance tying another "unusually large" 75bp hike to data placed a high bar for another jumbo-sized hike, which gave a green light for a short squeeze in risk assets associated with pervasively negative sentiment.''
The analysts agued that ''as a short covering rally ensues across global markets, the likelihood for a CTA buying program in gold has risen, given that prices need only close north of $1780/oz to spark a change in trend signals.''
However, the analysts continue to caution that gold markets are faced with a massive amount of complacent length held by prop traders, which still hold the title as the dominant speculative force in gold.
''We have yet to see capitulation in gold, suggesting the pain trade is still to the downside and that the recent rally will ultimately fade when faced with a wall of offers.''
Gold technical analysis
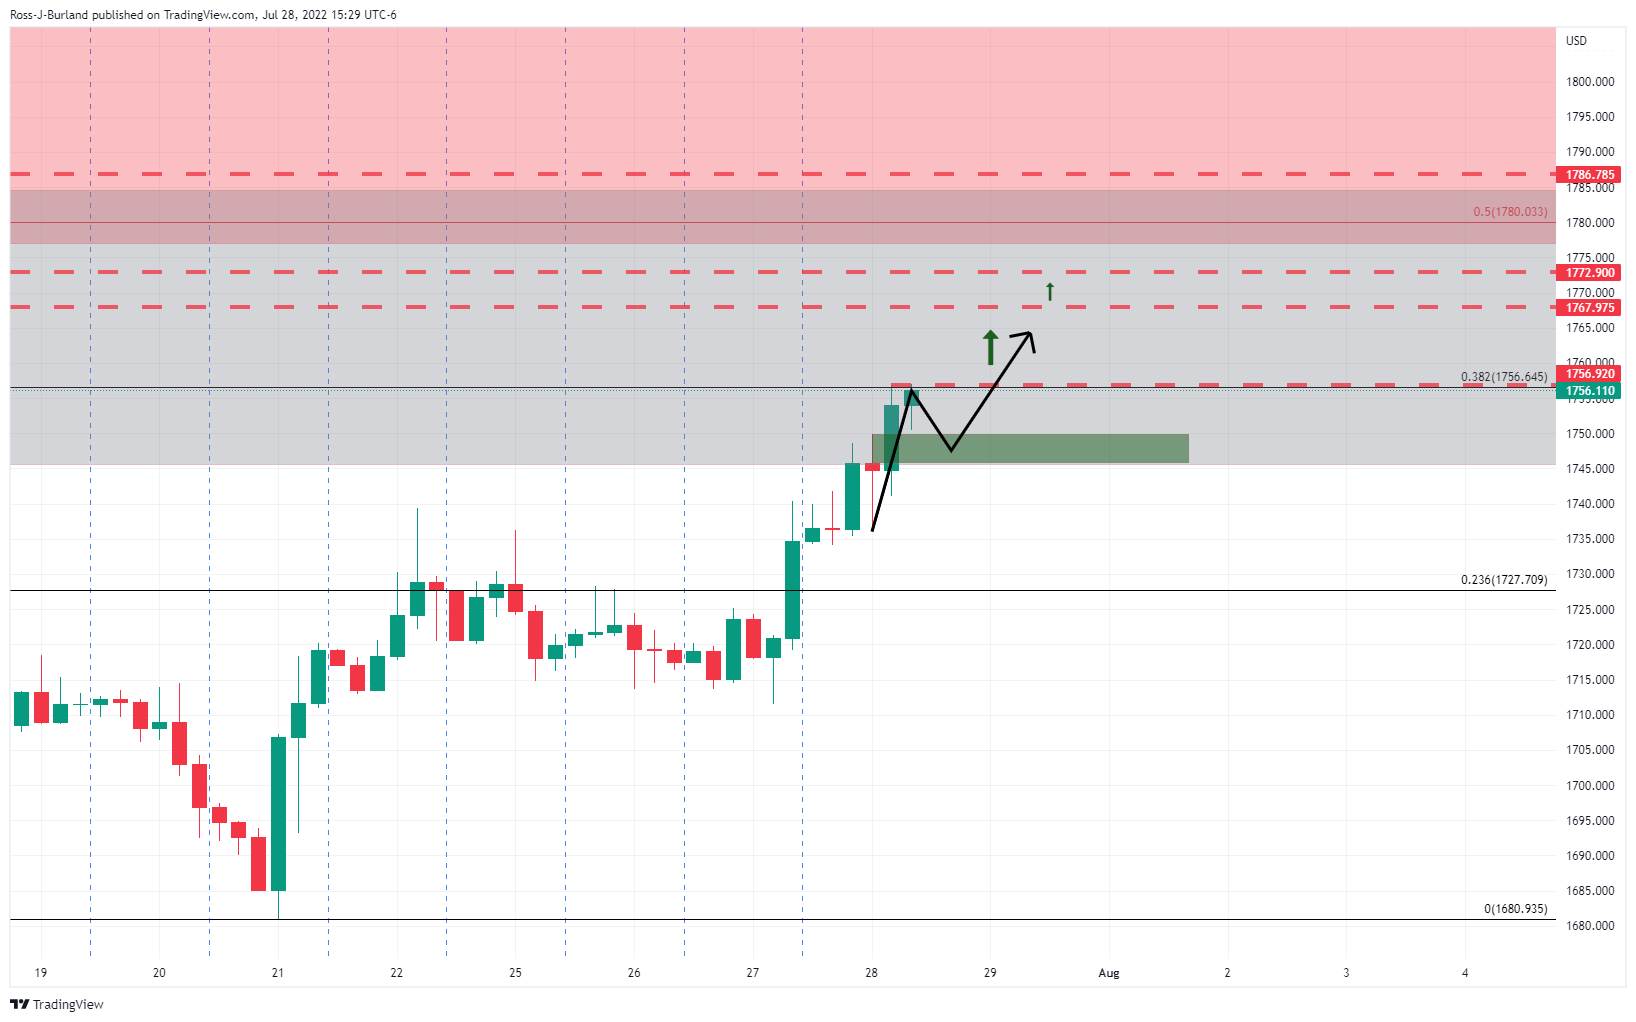
As per the pre-Fed analysis, the price of gold is running higher:
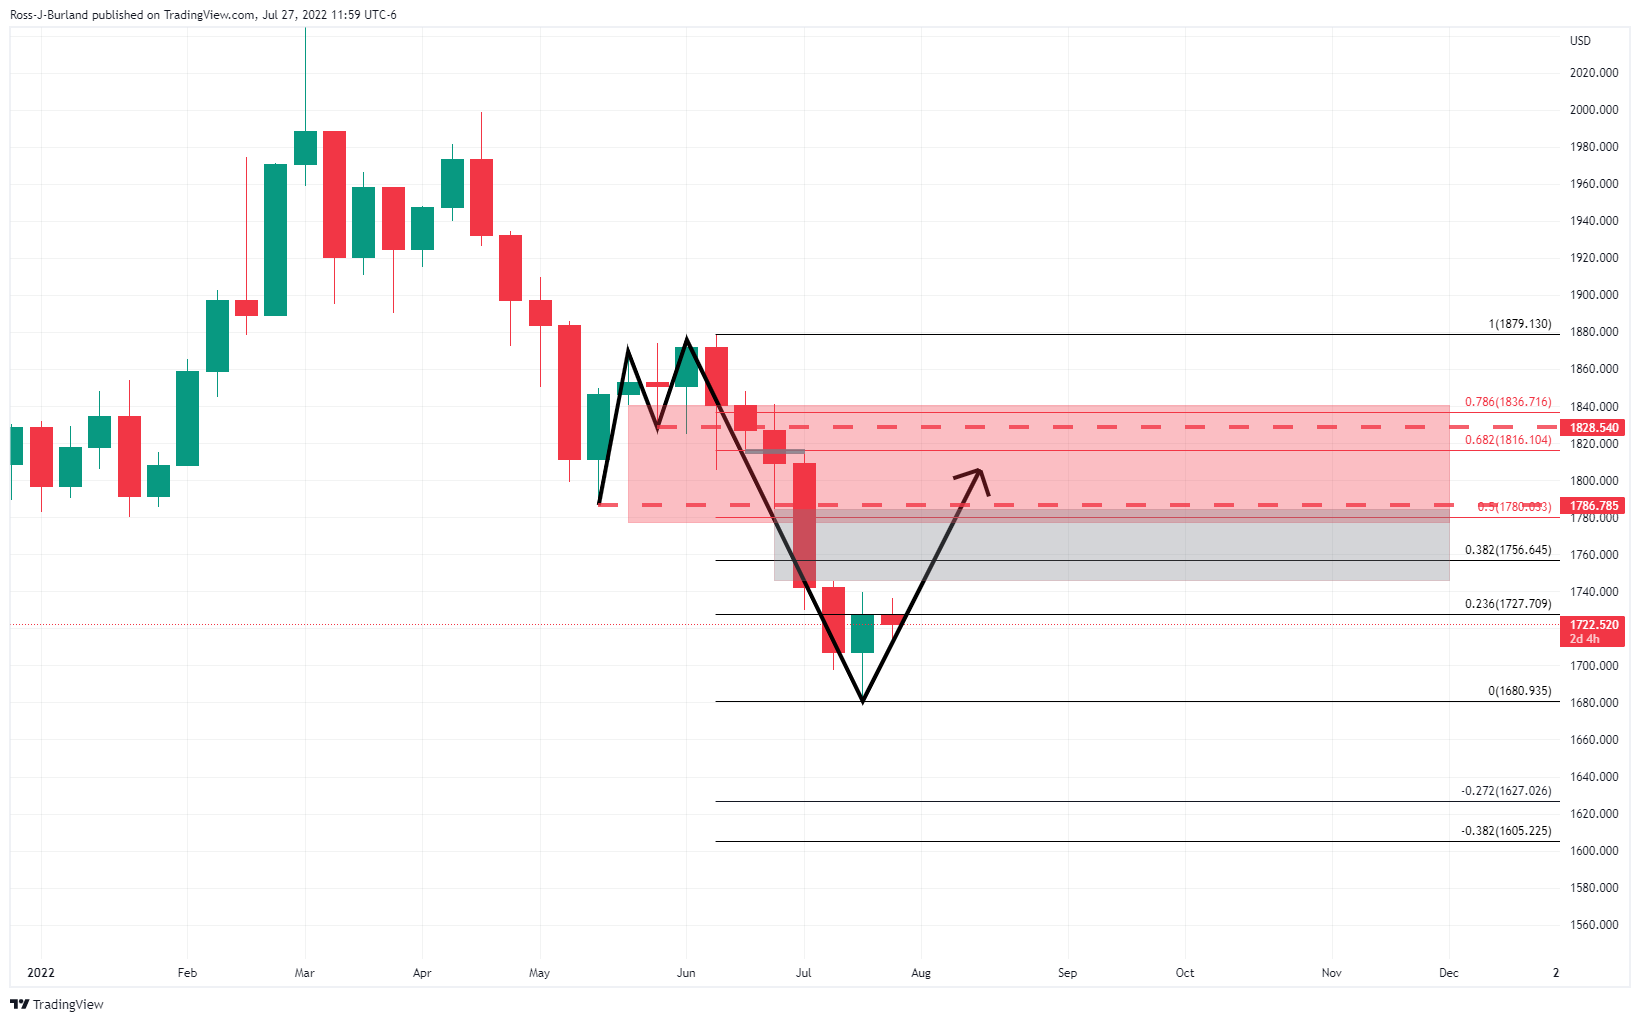
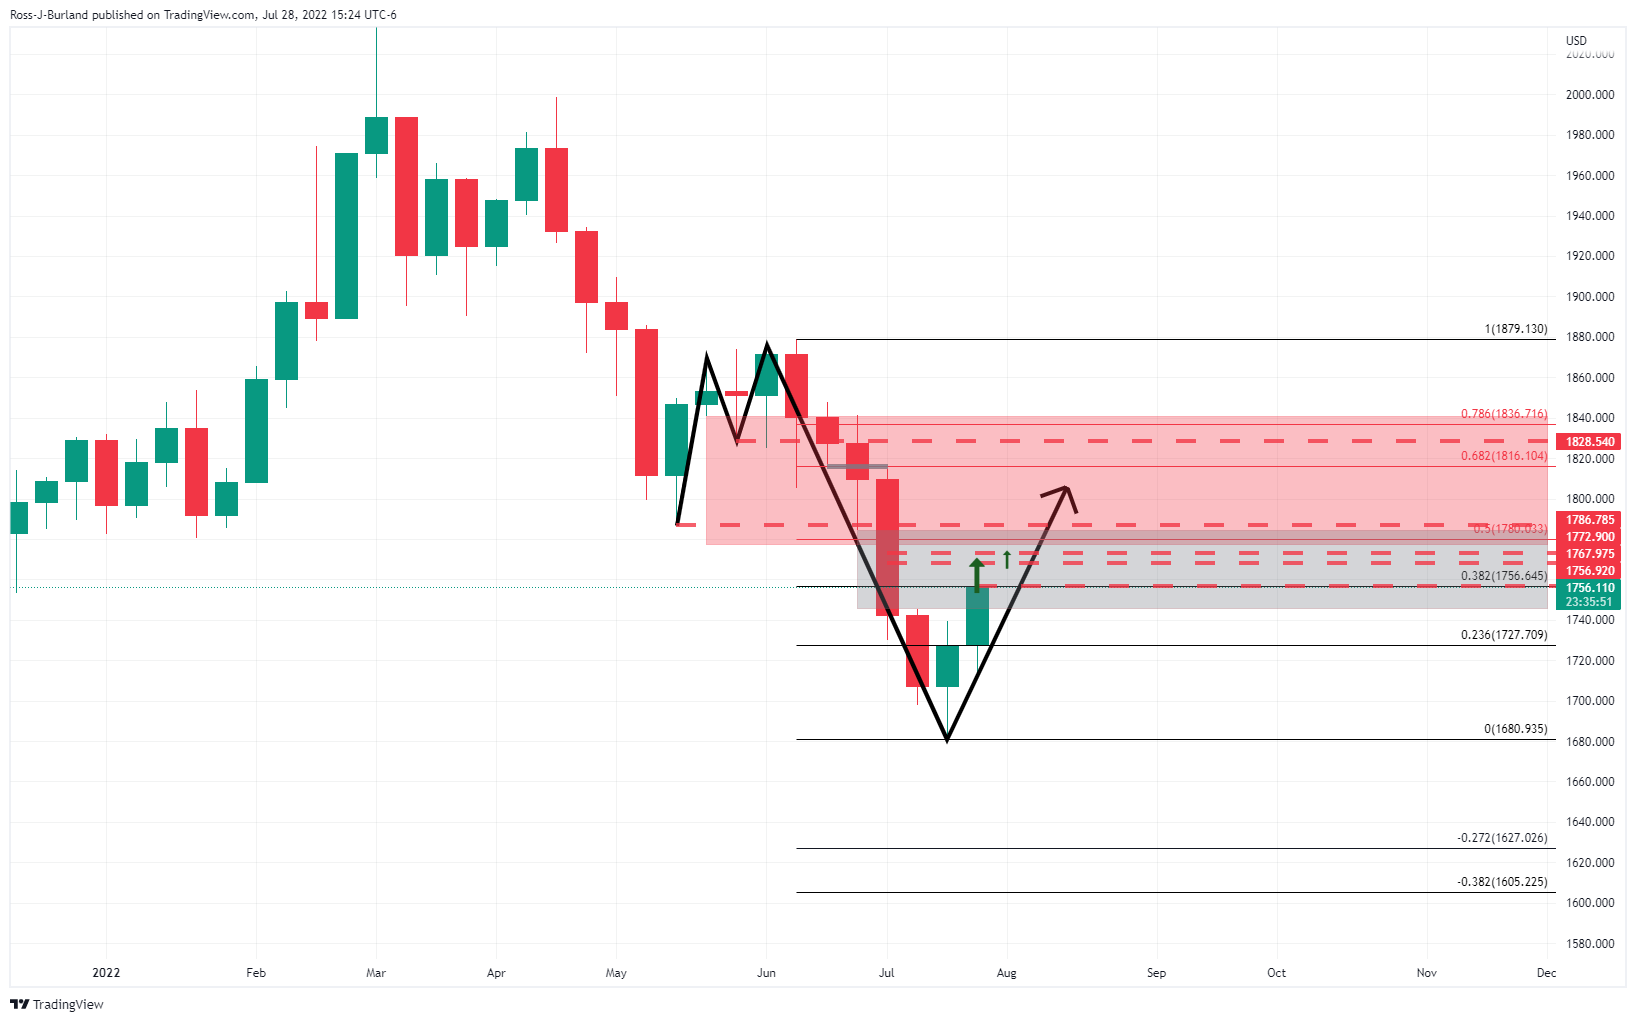
From a 4-hour perspective, the price needs to break above $1,756 for a run to $1,768 and beyond:
- GBP/JPY sank close to 250 pips on Thursday, erasing Wednesday’s gains.
- The GBP/JPY daily chart is neutral-biased, but a double-top tilts the bias downwards.
- GBP/JPY Price Analysis: If sellers reclaim 163.00, a dive towards 161.00 is on the cards.
The GBP/JPY erases Wednesday’s gains and tanks more than 250 pips as traders assess the US Federal Reserve commentary, but also due to the US Advanced GDP for the Q2 contracting, meaning that the country is in a “technical recession.” In the FX space, investors flew towards safe-haven assets, with the Japanese yen being the best performer, appreciating the most vs. the greenback since March 2020. At the time of writing, the GBP/JPY is trading at 163.50.
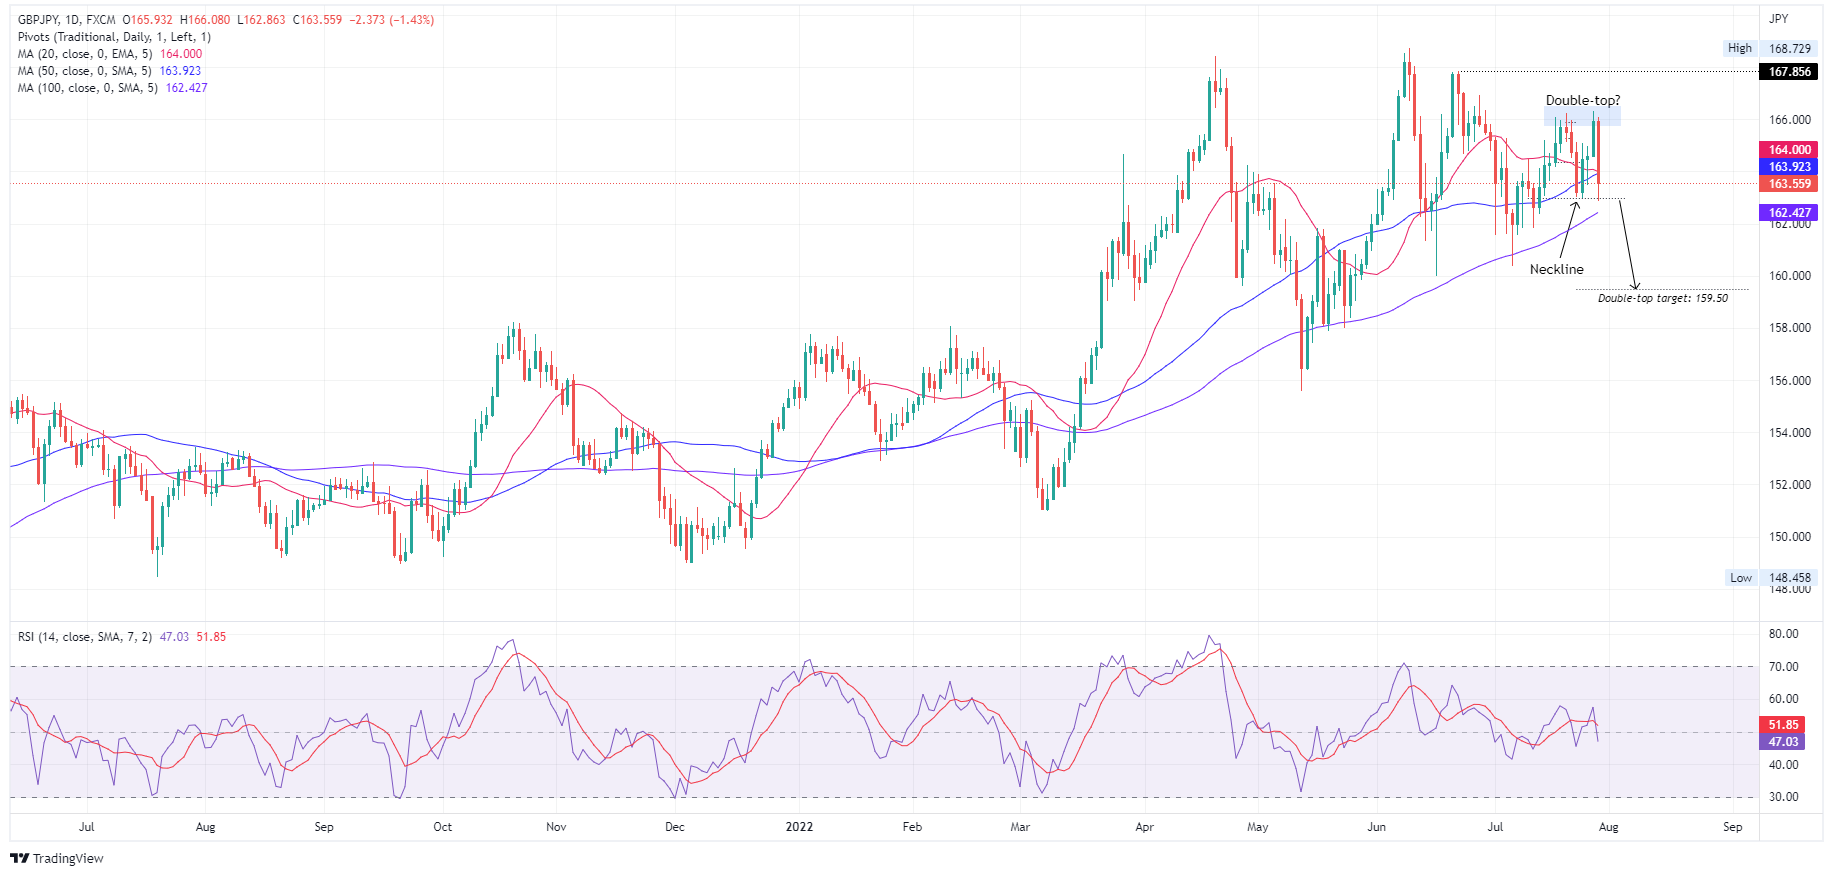
GBP/JPY Price Analysis: Technical outlook
The GBP/JPY daily chart depicts the pair as neutral biased, once it cleared on its way south, the 20 and 50-day EMAs. Additionally, a double-top formed, and even though Thursday’s low broke below the neckline, sellers lost steam, giving way to some buying pressure. However, if GBP/JPY sellers reclaim 163.00, they will challenge the July 12 low at 161.82, followed by the double-top target at 159.50.
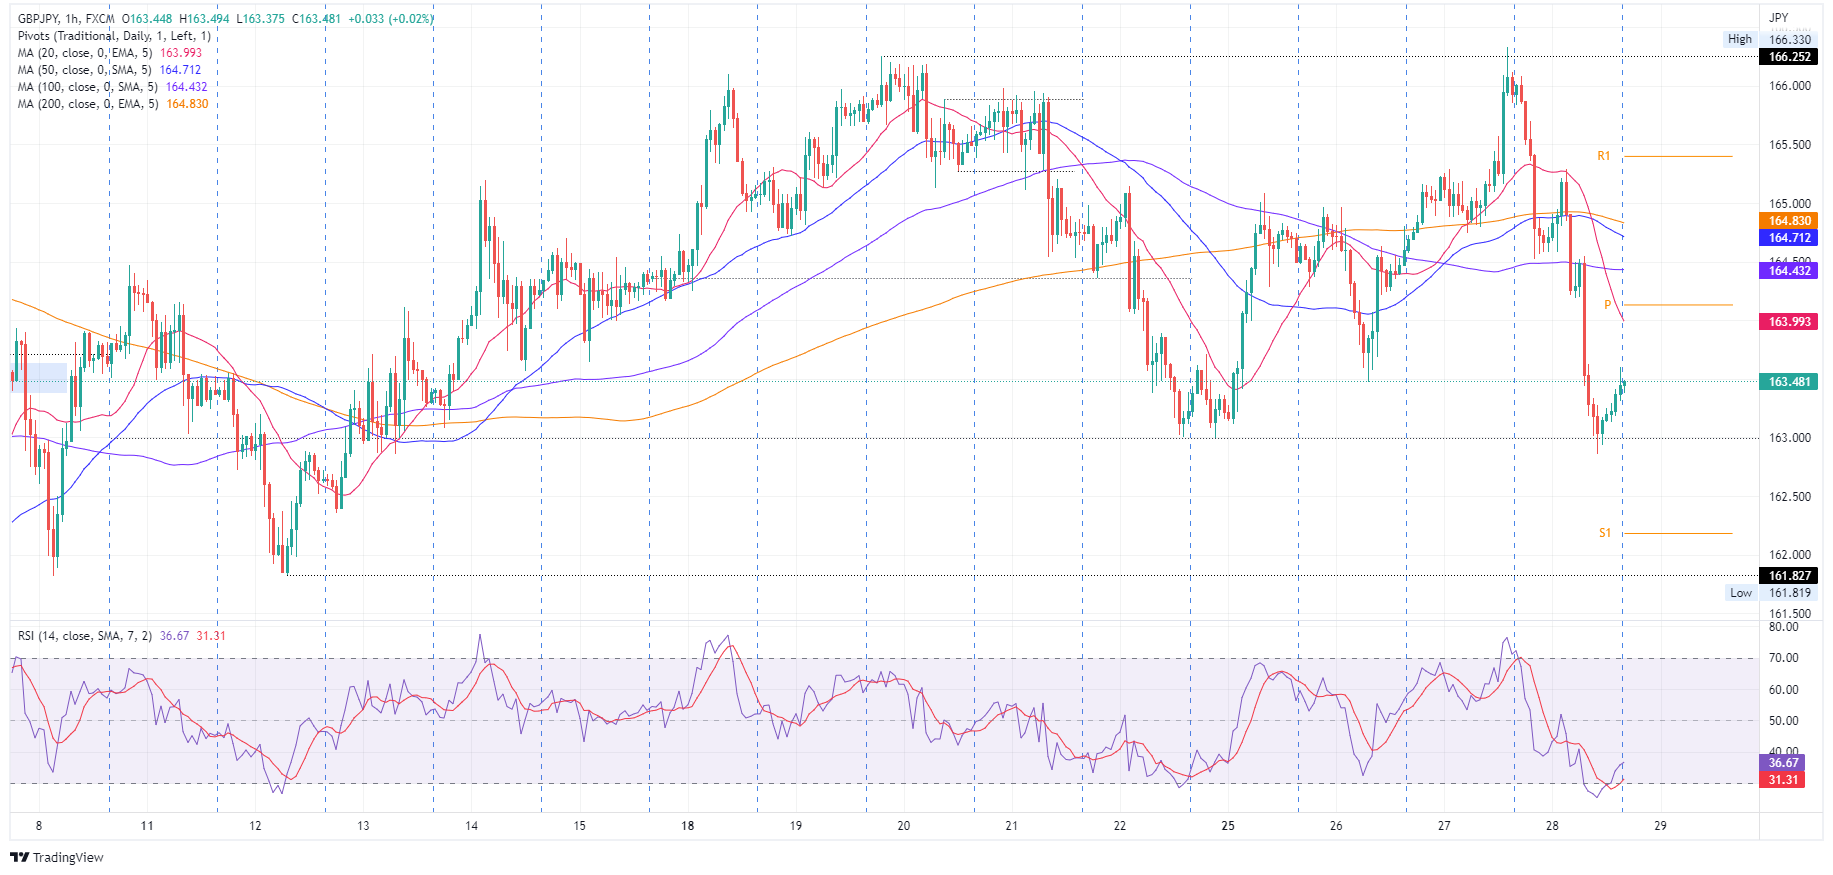
GBP/JPY 1-hour chart
The GBP/JPY further cemented the neutral bias, with price action stuck between the 163.00-166.00 range. However, Thursday’s price action tilted the tendency downwards, as the GBP/JPY exchange rate tumbled below all the hourly EMAs. Therefore, the GBP/JPY is neutral-to-downward biased.
That said the GBP/JPY first support would be the 163.00 figure. The break below will expose the S1 daily pivot at 162.17, followed by the S2 pivot point at 160.92.
GBP/JPY Key Technical Levels
What you need to take care of on Friday, July 29:
Thursday was another volatile day, with financial markets struggling for direction. The dollar remained under pressure during Asian trading hours, resurged during the European session and came again under pressure in the American afternoon.
The greenback’s intraday advance could be attributed to renewed recession-related fears following the release of tepid European data. The EUR/USD pair traded between 1.0113 and 1.0233 to finally settle at 1.0180.
The US published the second quarter Gross Domestic Product, which showed that the economy entered a technical recession after contracting by 0.9% in the three months to June and following a 1.6% contraction in Q1. However, stock markets ignored the news. US indexes soared and reached fresh multi-week highs, where they stand early in the Asian session.
Different US authorities diminished the relevance of the negative figure. Federal Reserve chief Jerome Powell anticipated it on Wednesday, saying that a disappointing GDP figure should be taken with a pinch of salt. US Treasury Secretary Janet Yellen said on Thursday that the Q2 contraction demonstrates the economy's move to more sustainable growth. Finally, President Joe Biden noted that Chair Powell and several other high-level banking executives claim that the US is not in a recession.
Also, Biden spoke with Chinese President Xi Jinping as part of US efforts to deepen lines of communication, responsibly manage differences, and address issues of mutual interest. There was no mention of tariff reduction.
Safe-haven assets were the best performers against the greenback. USD/CHF plunged to 0.944, while USD/JPY bottomed at 134.19, both trading nearby. Gold soared and now changes hands at $1,755 a troy ounce.
The GBP/USD pair maintained the bullish momentum and reached 1.2190, now hovering around 1.2165. Commodity-linked currencies posted modest intraday losses, helped by soaring equities. AUD/USD quotes at 0.6980 while USD/CAD is at 1.2820.
Crude oil prices eased, and WTI settled at $97 a barrel.
Cardano Price Prediction: Was ADA's post-FOMC euphoric rally a bull trap?
Like this article? Help us with some feedback by answering this survey:
- GBP/USD bulls moving back in for another attempt at the 1.22 area.
- The US dollar remains pinned to the floor following the dialled-down Fed monetary policy pricing in markets.
GBP/USD is trading at 1.2160 and around flat on the day following a surge after the Federal Reserve meeting on Wednesday and a statement that left the futures markets tied to Fed policy expectations tilted towards a more moderate increase for the next meeting. This resulted in the softer US dollar which is now treading water around the lower quarter of the 106 area as per DXY, an index that measures the greenback vs. a basket of major currencies.
Domestically, there has been no UK data but investors are second-guessing the Bank of England's next move. The Old Lady meets on August 4. and markets are pricing the central bank to continue its tightening cycle with the possibility of a larger 50-bp increase. Nevertheless, dosued in political and economic woes, sterling has been one of the laggard this year despite The Old Lady being out of the traps with policy tightening relatively early. Relative to other G10 currencies, GBP is holding in the middle of the pack in terms of its performance in the year to date, improving only as the euro sinks towards the bottom of the pack.
''GBP has been trading under a cloud of negative sentiment for large swaths of this year,'' analysts at Rabobank noted. ''It was notable in May that the BoE’s (as expected) rate hike failed to stop the pound from falling as the market latched on to the Bank’s downside growth revision.''
''Around this time the OECD forecast that the UK would see no growth in 2023, a little worse than our house forecast of 0.2%. The BoE, like most other central banks, it committed to reigning in inflation, even at the cost of growth. However, the absence of the latter has provided a strong headwind for the pound.''
Meanwhile, the US dollar has been pushed and pulled this week in the build-up to the Fed outcome, juggled between the bears and bulls depending on risk sentiment. The weakness in the euro has benefitted the US dollar due to the gas woes in Europe and poor business sentiment from Germany on Monday. Additionally, an overall gloomy outlook for world growth as forecasted by the International Monetary fund has helped to buoy the greenback for its safe haven allure.
However, it has been all about the Fed since Wednesday and the DXY has been trading on the backfoot since since the US central bank raised interest rates by 75 basis points, as was widely anticipated, while comments from Fed Chair Jerome Powell spurred hopes for a slower hiking path.
On Thursday, the US Gross Domestic Product was reported to have fallen at a 0.9% annualized rate last quarter, the Commerce Department said in its advance estimate of GDP. Economists polled by Reuters had forecast GDP rebounding at a 0.5% rate.
GBP/USD technical analysis
The pound is attempting to claim the 1.22 area following a pullback to the 50% mean reversion of the 4-hour bullish impulse. There is a weekly price imbalance (greyed area on the chart above) that has a confluence with the 78.6% Fibonacci retracement level that could captivate the bulls in the near future.
The US president Joe Biden spoke following today's early reading that showed the US economy contracted for the two quarters through June and yesterday's Federal Reserve interest rate decision and statement that has resulted in futures markets tied to Fed policy expectations tilting towards a more moderate increase for the next meeting.
Biden, says that Fed Powell and many significant banking personnel say we are not in a recession and that strong data, that prospect for passing the chips bill and other factors don't 'sound like a recession'. However, he acknowledged that growth is expected to be slower compared to last year.
Gross Domestic Product fell at a 0.9% annualized rate last quarter, the Commerce Department said in its advance estimate of GDP on Thursday. Economists polled by Reuters had forecast GDP rebounding at a 0.5% rate.
While Biden and others say the US is not in a recession, the second straight quarterly decline in GDP meets the standard definition of a recession. However, the Dow Jones Transport Average index viewed as a bellwether for health of the economy, was up 2.7%. This suggests that investors are taking a nuanced view about whether the US economy is headed for a significant downturn.
Meanwhile, the greenback has fallen since the Fed raised interest rates by 75 basis points on Wednesday, as was widely anticipated, while comments from Fed Chair Jerome Powell spurred hopes for a slower hiking path.
- EUR/USD falls due to weaker than expected EU economic data, facing strong headwinds with the energy crisis, and slower economic growth.
- US GDP in the second quarter showed signs of contraction, meaning the US is in a “technical recession.”
- Inflation in Germany tops around 8.6% YoY, while the EU’s economic sentiment plunges.
The EUR/USD drops from daily highs above 1.0200, trimming some of Wednesday’s gains. On Wednesday, the market perceived a slightly “dovish” tilt of Fed Chair Jerome Powell as that, so most G8 currencies rallied vs. the greenback. Additionally, the US economy getting into a “technical recession,” as the US Department of Commerce reported, would keep the greenback pressured.
The EUR/USD is trading at 1.0170 after hitting a daily high at 1.0234, but tumbled on worst-than-expected EU Economic sentiment & Consumer confidence figures, plunging towards the daily low of 1.0114, before bouncing on dismal US economic data.
EUR/USD, unable to capitalize on a soft US Dollar, could fall further
Sentiment remains positive and would likely end in that way. Data from the US Department of Commerce showed that US GDP in the second quarter shrank 0.9%, less than the forecasted 0.4% growth. That said, alongside money market futures pricing a less “hawkish” Fed than previously estimated, with odds of a 75 bps rate hike in September at 78%.
At the same time, the US Department of Labor reported that the US Initial Jobless Claims for the week ending on July 23 increased by 256K, more than the 253K estimated. Nevertheless, fell compared to the week ending on July 16, which printed 261K.
Elsewhere, the US Dollar Index is almost flat at 106.473 after reaching a daily high at 106.975. US Treasury yields are also down, led by the US 10-year benchmark note coupon diving ten bps, sitting at 2.680%.
In the Europe session, inflation in Germany rose unexpectedly in June, with the HICP increasing by 8.5%, higher than estimations and smashing the previous figure of 8.3%. In non-harmonized estimations, inflation in Germany fell slightly to 7.5%, from the prior reading of 7.6%.
Earlier, the EU Economic sentiment plunged to 99 in July, lower than estimations of 102. In the same tone, the EU Consumer confidence tumbled -27.0 vs. -23.8 in June.
What to watch
On Friday, the EU economic docket will feature Eurozone, France, Italy, and Spain’s GDP Growth and inflation readings. That is alongside Germany’s employment data and GDP Growth. On the US front, the calendar will feature the core and headline PCE Price Index for June, the Chicago PMI, and the University of Michigan Consumer Sentiment for July.
EUR/USD Key Technical Levels
- NZD/USD climbed almost 0.20% on Thursday after Fed’s hike and dismal US GDP data.
- Money market futures expectations of a Fed’s 75 bps rate hike in September lie at a 78% chance.
- NZD/USD Price Analysis: Buyers reclaiming 0.6308 would pave the way for further gains; otherwise, a move towards 0.6200 is on the cards.
The NZD/USD rises after the release of mediocre US GDP data that shows the US economy is in a technical recession after the Federal Reserve increased rates by 75 bps on Wednesday. Market players speculate that the Fed tilted “dovish,” which appears premature, as Fed Chair Powell reiterated that they are committed to bringing inflation down to 2%.
Nevertheless, the NZD/USD is trading at 0.6272 after diving in the early Asian session and hitting the daily low at 0.6250, but buyers stepping in lifted the pair just shy of reaching 0.6300.
NZD/USD advances due to upbeat sentiment on bad US GDP print
Investors’ moods shifted positively in the last couple of hours. The US Bureau of Economic Analysis reported that GDP for the second quarter in its Advance estimate contracted by 0.9%, missing estimations of a 0.4% growth. That said, money market futures have scaled back Fed tightening, and odds of a 75 bps rate hike in September lie at 78%.
In the meantime, the US Dollar Index is almost flat at 106.481 after reaching a daily high at 106.975. US Treasury yields are also down, led by the US 10-year benchmark note coupon diving ten bps, sitting at 2.680%. These aforementioned factors are a tailwind for the New Zealand dollar, though it has barely blinked, as some analysts see the current reaction as a “misreading” of what the Fed is doing and will do.
Analysts at BBH said that the Fed “… noted that spending and production are softer while job gains remain robust. Lastly, the statement noted that balance sheet reduction is proceeding at its announced pace. All of this was pretty much as expected. There was no hint of a pause or that the Fed is even thinking about a pause.”
They added, “The initial market response was that the Fed had pivoted. We wholeheartedly disagree.”
Aside from this, US Initial Jobless Claims for the week ending on July 23 increased by 256K, higher than estimations but lower than the previous week’s 261K.
What to watch
The New Zealand economic docket will feature the ANZ Consumer Confidence for July, foreseen at 79. On the US front, the calendar will feature the core and headline PCE Price Index for June, the Chicago PMI, and the University of Michigan Consumer Sentiment for July.
NZD/USD Price Analysis: Technical outlook
The NZD/USD remains neutral-to-downward biased, despite jumping in two-volatile trading sessions, namely Wednesday and Thursday. If NZD/USD buyers break above the 50-day EMA at 0.6307, the next resistance would be the June 16 daily high at 0.6395. Otherwise, the NZD/USD first support would be 0.6200, which, once cleared, would open the door for a test of the 20-day EMA at 0.6192.
The US economy contracted at a 0.9% annualized rate in the second quarter, according to official data released on Thursday. Analysts at Wells Fargo point out it is undeniable that the economy is cooling. They believe broad activity is not yet consistent with a contraction that is typically thought of as a recession.
Key Quotes:
“We are forecasting recession, but we do not have it starting until early next year. The strength of the labor market today is the best argument against those saying we are already in recession.”
“Even if skeptics can be convinced that in this particular instance, back-to-back quarters of negative GDP growth does not constitute a recession, it is undeniable that the economy is cooling. Based on the available data, we believe broad activity is not yet consistent with a contraction that is typically thought of as recession.”
“We expect tight monetary policy alongside still-high inflation to tip the U.S. economy into a mild recession by Q1-2023. Our latest July forecast pulled forward the timing of that downturn, and if conditions continue to deteriorate, it may warrant further reconsideration. Another potential consideration in the context of today's report is that an argument could be made that tighter monetary policy is already having a demonstrable slowing effect on growth; if that succeeds in cooling inflation, it might make the Federal Reserve's job a little easier.”
- USD/CHF faced solid resistance around the 100-day EMA and plummeted 70 pips from its highs.
- The USD/CHF might fall towards 0.9500 unless buyers reclaim the 200-hour EMA at 0.9665.
The USD/CHF extends its weekly losses and falls for the third consecutive day, tumbling below the 100-day EMA and beneath 0.9600, on worst than estimated US GDP figures that showed the US economy is in a technical recession. At the time of writing, the USD/CHF is trading at 0.9576.
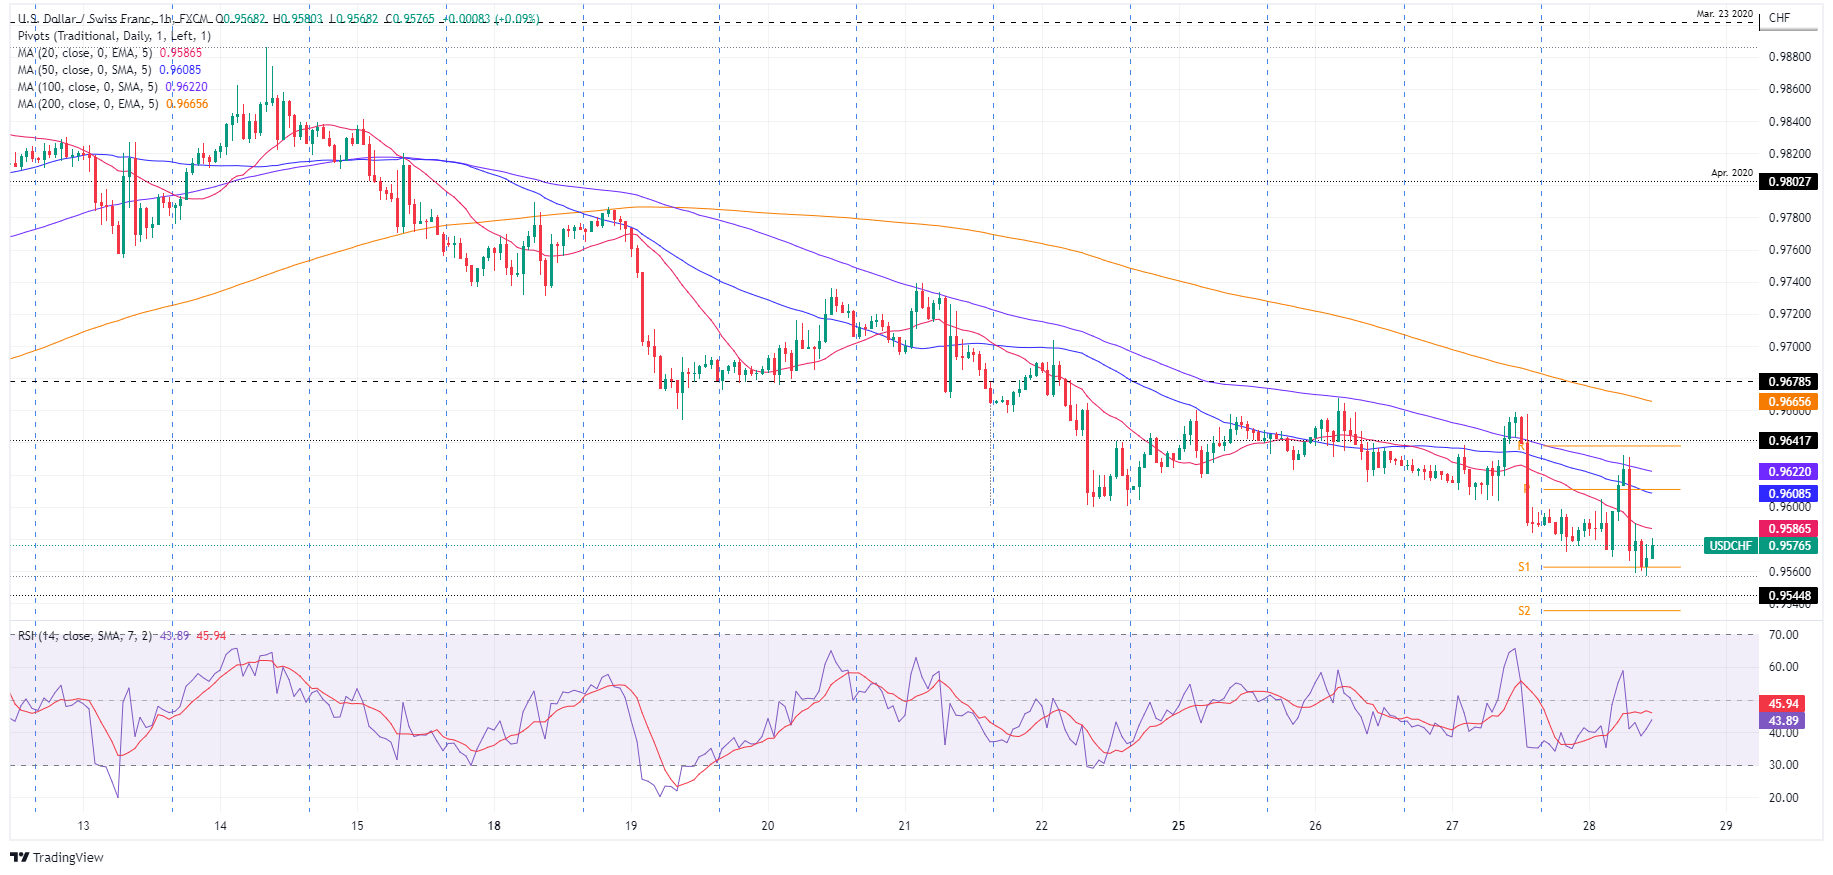
USD/CHF Price Analysis: Technical outlook
The USD/CHF price action on Wednesday sent the pair sliding under the 100-day EMA at 0.9610 and recorded a daily close below 0.9600. However, USD/CHF buyers lifted the pair as sentiment shifted sour. Nevertheless, solid resistance above, like the 61.8% Fibonacci retracement at 0.9644 and the 100-day EMA, were difficult ceiling levels to overcome, and sellers outweighed buyers. Hence, the USD/CHF plunged 70 pips from its daily highs.
USD/CHF 1-hour chart
The USD/CHF hourly chart depicts the pair as downward biased. The major tumbled below the 100, 50, and 20-hour EMAs, but the fall was capped around the S1 daily pivot, around 0.9562. If USD/CHF buyers want to regain control, they will need a decisive break above the 200-hour EMA at 0.9665; otherwise, sellers are in charge.
Therefore, the USD/CHF first support will be the S1 pivot point at 0.9562. A breach of the latter will expose the S2 daily pivot at 0.9536, which, once cleared, will leave the major vulnerable to fall towards 0.9500.
USD/CHF Key Technical Levels
On Wednesday, the Federal Reserve raised the key interest rate by 75 basis points, as expected. Analysts at the Research Department at BBVA stick with our forecast that the Fed will take the fed funds rate to a 3.25-3.50% by the end of this year, shifting to a 50 bps hike in September, followed by two consecutive 25 bps hikes in November and December.
Key Quotes:
“We stick with our forecast that the Fed will take the fed funds rate to a 3.25-3.50% target range by the end of this year, which will imply a shift to slow the pace of rate increases to a 50 bps hike in September, followed by two consecutive 25 bps hikes in November and December.”
“We continue to expect the fed funds rate to peak at 3.75-4.00% in 1H23 as we anticipate that core inflation will still show signs of stickiness by then. Yet, the path for monetary policy in 2023 and beyond is becoming much more uncertain as risks to the outlook will likely become more two-sided. Increased odds of a recession in 2023 will make the Fed's job more challenging. Uncertainty around the Fed steps in 2023 will rise, but for the time being, the most likely scenario is still that the Fed will have the need to stick to the series of additional rate hikes that seem more plausible for the median of Fed officials in the latest update of the Summary of Economic Projections (SEP).”
- USD/MXN is falling for the fifth consecutive day.
- Losses seem limited while above 20.30; dollar to strengthen above 20.55.
The USD/MXN is falling for the fifth consecutive day. The decline found support again around the 20.30 area that also capped the downside earlier in July. The mentioned zone is the key support and a consolidation below would clear the way for the 55-day Simple Moving Average at 20.15. The next support stands at 20.00.
The 20.30 area also contains an uptrend line from the June low, reinforcing the importance of this crucial area.
Technical indicators offer no clear signs. Momentum and the RSI are flatting. Price remains below the 20-day Simple Moving Average (20.54) that is still heading north. The bearish bias still prevails in the short term but shows a lack of strength.
A recovery above 20.55 should improve the outlook for the greenback. The next key resistance is seen at 20.70, that last defense to a new test of 20.90. A daily close above the last one would expose 21.00.
USD/MXN Daily chart
-637946222722358294.png)
Chinese President Xi Jinping told US President Joe Biden on Thursday that they firmly oppose Taiwan's independence and the interference of external forces, Chinese state media reported.
"Those who play with fire will only get burnt," Xi told his American counterpart during the phone call, as per Reuters. "Hope the US side can see this clearly."
Market reaction
This headline doesn't seem to be having a significant impact on risk perception. As of writing, the US Dollar Index was up 0.15% on the day at 106.62 and Wall Street's main indexes were rising between 0.15% and 0.55%.
- USD/CAD hit a six-week low at 1.2794 but recovered some ground, eyeing a break above 1.2850.
- The US BEA revealed that the GDP for the second quarter contracted less than the first quarterfinal reading.
- USD/CAD remains positive due to a solid US dollar and falling oil prices.
The USD/CAD bounces from weekly highs and rises towards the 50-day EMA at 1.2853 after dismal US economic data flashes that the US is in a “technical” recession after the Fed hiked 75 bps its interest rate on Wednesday and conceded that production and spending are “softening.”
The USD/CAD is trading at 1.2833 after refreshing six-week lows at 1.2794 but rebounded and hit a daily high just above the 100-hour EMA at 1.2869 before reaching current exchange rate levels.
USD/CAD advances despite worst than expected US data
Sentiment remains mixed but fragile and could turn sour during the day, meaning upside action for the USD/CAD lies ahead. Shrinking US Q2 GDP data keeps US equities fluctuating from gaining to losing throughout the day. The US Department of Commerce reported that GDP dropped by 0.9% annually after declining 1.6% in the first quarter, meaning that the US is in a technical recession.
In the meantime, the US Department of Labor revealed that unemployment claims for the week ending on July 23 rose by 256K, higher than forecasts but lower than the previous week’s 261K.
Aside from this, the greenback’s rise and falling US crude oil prices keep the USD/CAD risks skewed to the upside. The US Dollar Index, a gauge of the greenback’s value vs. a basket of peers, climbs 0.04% to 106.504, while WTI exchanges hands at $97.99 BPD, down 0.02%.
What to watch on Friday
The Canadian economic docket will feature the GDP for May and June’s GDP preliminary reading. The US calendar will feature the core and headline PCE Price Index for June, alongside the Chicago PMI and the University of Michigan Consumer Sentiment for July, on its final release.
USD/CAD Key Technical Levels
US President Joe Biden will deliver his remarks on the Inflation Reduction of 2022.
Earlier in the day, the data published by the US Bureau of Economic Analysis (BEA) showed that the US economy contracted at an annualized rate of 0.9% in the second quarter. The US Dolar Index, which recovered toward 107.00 earlier in the day, retreated toward 106.50 during the American trading hours.
On Friday, the BEA will release the Personal Consumption Expenditures (PCE) Price Index data, the Fed's preferred gauge of inflation.
- Australian dollar pulls back versus greenback, still above FOMC levels.
- US dollar hit by lower US yields after economic data.
- AUD/USD retreats from 0.7000, and holds a bullish bias.
The AUD/USD printed a fresh daily low during the American session at 0.6954. It is attempting to recover momentum supported by an improvement in market sentiment and on the back of a weaker US dollar.
Between a weak dollar and… risk aversion?
Data released on Thursday showed the US economy contracted during the second quarter at an annualized rate of 0.9%, against expectations of a 0.5% expansion. It is the quarterly contraction in a row, so it points to the US economy falling into a technical recession.
“Insisting upon the precise definition of recession will be an even more fraught task in light of the unequivocal deterioration in economic activity reflected in today's 0.9% contraction in Q2 real GDP. Yet real consumer spending continued to forge ahead and the job market still has legs. It is too early call the end of this expansion, but the hour is fast approaching”, said analysts at Wells Fargo. The numbers triggered a rally in Treasuries and weighed on the US dollar. The US 10-year yield is at 2.66%, the lowest level since April.
After a negative opening, equity prices are up again in Wall Street, adding to yesterday’s strong gains. Initially, risk aversion gave some support to the dollar but later faded.
The AUD/USD still shows a bullish bias. A test of 0.7000 seems likely over the next session if it remains above 0.6950. Below the next support stands at 0.6910. A break lower would weaken the outlook suggesting a deeper correction ahead.
Technical levels
- Gold price advances more than 1%, recording back-to-back gains for the first time since July 21-22.
- The US Q2 GDP, on its preliminary reading, contracted, meaning the US is in a technical recession.
- The US economic calendar on Friday will update the Fed’s favorite inflation gauge, alongside the UoM Consumer Sentiment.
Gold Price breaks above the top of the $1700-$1720 range and rallies towards the $1750 area, where the non-yielding metal will face solid resistance, led by the July 8 daily high at $1752.46. At the time of writing, the XAUUSD is trading at $1753.62.
Gold rises on mixed sentiment and falling US bond yields
Global equities are mixed, though US stocks are trimming some of Wednesday’s gains, courtesy of the Federal Reserve’s slightly “dovish” tilt. Although the US Fed Chair Jerome Powell acknowledged that production and spending were slowing down, he reiterated that the Fed would continue hiking rates, opening the door for another “exceptionally” increase. After that, the US central bank would become data-dependent and could slow the pace of tightening.
Gold price reaction to that climbed from $1718.60 to $1738.28 and finished trading around $1733.10. On Thursday, the XAUUSD is gaining almost $20 and is up 1%.
In the meantime, the US Advance GDP for Q2 showed signs that the economy is further deteriorating. The US Department of Commerce revealed that GDP shrank at a 0.9% YoY pace after declining 1.6% in the first quarter, meaning that the US is in a technical recession. The report shows decreases in private inventory investment, residential fixed investment, and federal government spending. The positive is that, albeit contracting, it jumped from Q1’s -1.6% YoY print, helped by increases in exports and personal consumption expenditures (PCE).
At the same time, the US Department of Labor reported that Initial Jobless Claims for the week ending on July 23 rose by 256K, higher than forecasts but lower than the previous week’s 261K.
That said, gold regained some bullishness as a stagflation scenario in the US economy looms. However, XAUUSD traders should be aware of US Treasury yields and the US dollar reaction to forwarding data. At the time of writing, the US Dollar Index is rising 0.12%, at 106.598, while the US 10-year Treasury yield collapsed almost ten bps, at 2.685%, a tailwind for the yellow metal.
What to watch
On Friday, the US economic docket will feature the Fed’s favorite inflation gauge, the Personal Consumption Expenditures (PCE), on its headline and core readings. Also, investors need to be aware of the Employment Cost Index, which would shed some clues regarding the stickiness of inflation. Later in the day, the University of Michigan (UoM) Consumer Sentiment for July on its final reading will be revealed.
Gold (XAUUSD) Key Technical Levels
Citing eight sources familiar with the matter, Reuters reported on Thursday that the Organization of the Petroleum Exporting Countries (OPEC) and allies, collectively known as OPEC+, were planning to leave the oil output unchanged for September.
Sources also acknowledged that a modest output increase could be discussed amid calls from the United States for additional supply.
The group is scheduled to meet next Thursday, August 4.
Market reaction
Crude oil prices continue to fall after this report with the barrel of West Texas Intermediate losing 1.6% on the day at $96.50.
- The index regains the upside following GDP figures.
- The US economy is seen contracting 0.9% QoQ in Q2.
- Weekly Claims rose more than expected by 256K.
The greenback comes under pressure following the release of the flash Q2 GDP figures, although it manages well to keep the trade in the 106.50/60 band so far when tracked by the US Dollar Index (DXY).
US Dollar Index capped by 107.00
The greenback keeps the positive bias well in place following the post-GDP knee-jerk, as market participants continue to re-assess the recent interest rate hike by the Fed and comments from Chief Powell.
Indeed, the US economy is now seen contracting 0.9% in the April-June period, charting a second consecutive quarter in the contraction territory, and thus slipping back into a technical recession.
Additional data saw Initial Claims rise by 256K in the week to July 23
What to look for around USD
The index comes under downside pressure in the wake of the Fed meeting on Wednesday and now flirts with the 106.00 region.
Despite the knee-jerk, the constructive view in the dollar appears bolstered by the Fed’s divergence vs. most of its G10 peers (especially the ECB) in combination with bouts of geopolitical effervescence and occasional re-emergence of risk aversion.
On the flip side, market chatter of a potential US recession could temporarily undermine the uptrend trajectory of the dollar somewhat.
Key events in the US this week: Flash Q2 GDP, Initial Claims (Thursday) – PCE Price Index, Personal Income, Personal Spending, Final Michigan Consumer Sentiment (Friday).
Eminent issues on the back boiler: Hard/soft/softish? landing of the US economy. Escalating geopolitical effervescence vs. Russia and China. Fed’s more aggressive rate path this year and 2023. US-China trade conflict. Future of Biden’s Build Back Better plan.
US Dollar Index relevant levels
Now, the index is up 0.19% at 106.66 and a break above 107.42 (weekly high post-FOMC July 27) would expose 109.29 (2022 high July 15) and then 109.77 (monthly high September 2002). On the other hand, initial support emerges at 106.05 (weekly low July 28) followed by 103.67 (weekly low June 27) and finally 103.41 (weekly low June 16).
Analysts at TD Securities (TDS) offered a brief preview of the monthly Canadian GDP report, which is expected to show that economy contracted by 0.2% in May. The backwards-looking data is scheduled for release on Friday and might fail to exert any meaningful pressure on the Canadian dollar.
Key Quotes:
“We look for industry-level GDP to decline by 0.1% in May, slightly above flash estimates, due to one-off headwinds to the goods-producing sector from auto retooling and construction. Services should fare much better, helped by the ongoing recovery for the travel sector, and we also expect flash estimates to confirm a moderate rebound (~0.3%) for activity in June.”
“Unless data surprises significantly to the downside, CAD is more deferent to broad USD and risk sentiment rather than lagging data. 1.2780/00 key support for USDCAD.”
“Canada is grinding out outperformance vs the US in a very consistent manner. We feel the 30y auction today may restore the supply-demand imbalance Canada currently finds itself in (relative to the US). Our bias for Canada to outperform the US is due for a pause here after solid gains on the trade. Canada is trading fairly in line with the US post that GDP print this morning, and we will see if that holds after our GDP release and the 30y auction.”
- USD/JPY remains under intense selling pressure on Thursday and slides to a one-month low.
- The selling bias picks up pace after the US Q2 GDP report confirmed a technical recession.
- Bearish traders now await a break below the 61.8% Fibo. level support, around mid-134.00s.
The USD/JPY pair witnessed heavy selling on Thursday and extends the previous day's post-FOMC decline from the 137.45 region. This marks the second successive day of a negative move and drags spot prices to a one-month low, around mid-134.00s during the early North American session.
The latest leg down follows the disappointing release of the Advance US GDP report, which showed that the world's largest economy contracted by 0.9% annualized pace during the second quarter. This comes after the 1.6% decline during the January-March period and confirms a technical recession.
The data adds to worries about an economic downturn and reaffirms expectations that the Fed could slow the pace of rate hikes. This is evident from a fresh leg down in the US Treasury bond yields, which results in the narrowing of the US-Japan rate differential and is benefitting the Japanese yen.
On the other hand, the US dollar surrenders a major part of its intraday gains in reaction to the weaker data. This is seen as another factor contributing to the heavily offered tone surrounding the USD/JPY pair, taking along some short-term trading stops near the 135.00 psychological mark.
From a technical perspective, the overnight sustained weakness below the 200-period SMA on the 4-hour chart was seen as a fresh trigger for bears. A subsequent fall below the 50% Fibonacci retracement level of the 131.50-139.39 strong move up on Thursday validates the negative outlook.
That said, bearish traders might now wait for some follow-through selling below the 134.50 region, or the 61.8% Fibo. level support, before placing fresh bets. A convincing break below should pave the way for an extension of the recent corrective slide from the 24-year high.
On the flip side, any meaningful recovery attempt might now confront resistance near the 135.00 mark. This is followed by the 50% Fibo. level, around the 135.45 region, above which a bout of short-covering has the potential to lift the USD/JPY pair back towards the 135.90-136.00 area.
The latter is closely followed by the 200-period SMA on the 4-hour chart, around the 136.15 region, and mid-136.00s (38.2% Fibo. level). Some follow-through buying would suggest that the downfall has run its course and shift the bias back in favour of bullish traders.
USD/JPY 4-hour chart
-637946127004783488.png)
Key levels to watch
European Central Bank (ECB) Governing Council member Ignazio Visco said on Thursday that the weak data give them the responsibility to act in a prudent way while progressively normalizing the policy stance, as reported by Reuters.
"We have to avoid strong measures," Visco added and noted that they don't have to worry about the exchange rate for the time being.
Market reaction
These comments don't seem to be having a significant impact on the shared currency's performance against its rivals. As of writing, the EUR/USD pair was down 0.4% on the day at 1.0160.
Economist at UOB Group Ho Woei Chen, CFA, assesses the recently published GDP figures in South Korea.
Key Takeaways
“South Korea’s GDP rose sequentially for the 8th consecutive quarter with the momentum picking up to 0.7% q/q from 0.6% in 1Q22 as stronger private consumption and government expenditure offset weaker exports and facilities investment.”
“Export and investment could continue to underperform in 2H22 due to factors including weaker global growth, elevated energy prices and accelerated rate hikes to temper runaway inflation. The Bank of Korea (BoK) is expected to continue raising its interest rate for the rest of this year.”
“As such, the strong consumption recovery in 2Q22 could be short-lived with COVID resurgence risks also adding to the growth headwinds. Government spending may also moderate as the new administration plans a tightening in fiscal rules.”
“South Korea’s economy expanded by 2.9% y/y in 1H22. Taking into consideration of the stronger than expected 2Q22 GDP and increased downside risks, we are maintaining our full-year GDP growth forecast for South Korea at 2.7%, with an expected slowdown to 2.8% y/y in 3Q and 2.1% in 4Q.”
- EUR/USD gives away post-FOMC gains and falters near 1.0230.
- There is a tough up barrier around the weekly high at 1.0280 so far.
EUR/USD could not sustain the earlier bull run and retreated to the area well below the 1.0200 support on Thursday.
For the pair to gather a more serious rebound, it needs to leave behind the recent highs around 1.0280 to allow for extra gains to test, initially, the interim hurdle at the 55-day SMA at 1.0435.
In the meantime, the pair is expected to remain under downside pressure while below the 5-month support line around 1.0470.
In the longer run, the pair’s bearish view is expected to prevail as long as it trades below the 200-day SMA at 1.0969.
EUR/USD daily chart
- Initial Jobless Claims fell by 5,000 in the week ending July 16.
- US Dollar Index struggles to preserve its bullish momentum.
There were 256,000 initial jobless claims in the week ending July 23, the weekly data published by the US Department of Labor (DOL) showed on Thursday. This print followed the previous week's print of 261,000 and came in worse than the market expectation of 253,000.
Further details of the publication revealed that the advance seasonally adjusted insured unemployment rate was 1% and the 4-week moving average was 249,250, an increase of 6,250 from the previous week's revised average.
"The advance number for seasonally adjusted insured unemployment during the week ending July 16 was 1,359,000, a decrease of 25,000 from the previous week's unrevised level of 1,384,000," the DOL added.
Market reaction
The US Dollar Index continues to edge lower from daily highs and was last seen posting small gains at 106.55.
- GBP/USD defends the 1.2100 mark and stalls its intraday pullback from a nearly one-month low.
- A technical recession in the US forces the USD to trim a part of its gains and offers some support.
- The UK political/Brexit uncertainty warrants some caution before placing aggressive bullish bets.
The GBP/USD pair finds some support near the 1.2100 mark and stalls its intraday retracement slide from the 1.2200 neighbourhood, or a nearly one-month high touched earlier this Thursday. Spot prices recover a few pips during the early North American session following the release of the Advance US GDP report
According to the first estimate released by the US Bureau of Economic Analysis, the world's largest economy contracted by 0.9% annualized pace during the April-June period. The reading turns out to be worse than the 0.4% growth estimated and follows a 1.6% contraction in the previous quarter, confirming a technical recession. The US dollar is trimming a part of intraday recovery gains, which, in turn, assists the GBP/USD pair to bounce back closer to the mid-1.2100s.
The data, however, adds to growing market worries about a global economic downturn and continues to weigh on investors' sentiment. This is evident from a generally weaker tone around the US equity futures, which, along with an uptick in the US Treasury bond yields, could offer support to the safe-haven buck. Hence, it would be prudent to wait for sustained strength beyond the 1.2200 mark before positioning for any further appreciating move for the GBP/USD pair.
The downside, meanwhile, is likely to remain cushioned, at least for the time being, in the wake of rising bets for a 50 bps rate hike by the Bank of England at its upcoming policy meeting in August. The mixed fundamental backdrop further warrants some caution for aggressive traders amid the UK political uncertainty and Brexit woes.
Technical levels to watch
The US economy contracted at an annualized rate of 0.9% in the second quarter, the US Bureau of Economic Analysis' (BEA) first estimate showed on Thursday. This reading came in much worse than the market expectation for an expansion of 0.5%.
"The decrease in real GDP reflected decreases in private inventory investment, residential fixed investment, federal government spending, state and local government spending, and nonresidential fixed investment that were partly offset by increases in exports and personal consumption expenditures (PCE)," the BEA explained in its publication. "Imports, which are a subtraction in the calculation of GDP, increased."
Market reaction
With the initial reaction, the US Dollar Index lost its traction and erased a large portion of its daily recovery gains. As of writing, the index was up 0.15% on the day at 106.60.
Senior Economist at UOB Group Alvin Liew reviews the lates publication of inflation results in Singapore.
Key Takeaways
“Singapore’s headline CPI rose much faster than expected, at 1.0% m/m, 6.7% y/y in Jun (from 1.0% m/m, 5.6% y/y in May), fastest y/y print since Sep 2008. Core inflation (which excludes accommodation and private road transport) also rose at a faster clip, up by 4.4% y/y (from 3.6% in May), fastest since Nov 2008.”
“The sources of price pressures for core inflation were again broad-based including almost all the major categories. As for the headline CPI inflation, other than upside to the core CPI, both the accommodation costs and private transport costs were also the key drivers of overall price increases. Transport component continued to lead, contributing an outsized 3.4ppts to the 6.7% inflation print, followed by housing & utilities (1.3ppt) and food (1.2ppt). Communication cost was the only major component of CPI which saw a fall in prices, but its ‘contribution’ was fairly insignificant.”
“In its outlook, the MAS projected core inflation to peak in 3Q and ease towards end-2022, but the warnings on inflation developments remain on the upside, both on the external (‘upward pressure on Singapore’s import prices are expected to persist’) and domestic fronts (tight labour market conditions and businesses to pass higher costs to consumer prices here).”
“We now expect headline inflation to average 6.0% (up from previous forecast of 5.0%) and core inflation at 4.2% (up from previous forecast of 4.0%) in 2022. Our latest forecasts are at the top end of the official outlook for headline CPI (5.0-6.0%) but still exceeds the revised official core inflation forecast range (3.0-4.0%), and with the risks still tilted to the upside, as the MAS rightly highlighted the ‘risks to inflation from fresh shocks to global commodity prices, as well as domestic wage pressures’.”
- DXY fades the post-FOMC sharp pullback and approaches 107.00.
- Extra range bound seems probable for the time being.
DXY bounces off the 106.00 neighbourhood and manages to reverse Wednesday’s strong retracement on Thursday.
So far, the prevailing side-lined trading looks well contained by the 106.00 neighbourhood. If the index breaks above this pattern it could then attempt a move to the 2022 high near 109.40 (July 14). Bouts of extra weakness in the dollar carries the potential to drag the index to the 55-day SMA at 104.71.
The near-term outlook for DXY is seen constructive while above the 5-month support line near 103.90.
In addition, the broader bullish view remains in place while above the 200-day SMA at 99.38.
DXY daily chart
- EUR/GBP remains under heavy selling pressure for the fifth successive day on Thursday.
- The European gas crisis turns out to be a key factor weighing heavily on the shared currency.
- Resurgent USD demand exerts pressure on sterling, which might lend support to the cross.
The EUR/GBP cross is prolonging its recent sharp pullback from the 0.8585 region and losing ground for the fifth successive day on Thursday. The downward trajectory remains uninterrupted through the mid-European session and has now dragged spot prices to over a three-month low, around the 0.8345 region.
The shared currency's relative underperformance comes amid renewed worries over a halt of gas flows from Russia, which could trigger an energy crisis in the Eurozone. In fact, Russian energy group Gazprom said that flows through its main Nord Stream 1 pipeline to Germany had been cut to 20% of their normal levels from Wednesday because of maintenance. Though seems temporary, the supply reduction could drag the region's economy faster and deeper into recession.
On the economic data front, Destatis reported this Thursday that inflation in Germany, as measured by the Consumer Price Index (CPI), edged lower to 7.5% YoY in July from the 7.6% previous. The Harmonised Index of Consumer Prices (HICP), the European Central Bank's preferred gauge of inflation, meanwhile, climbed to 8.5% in the same period from 8.2% as against 8.1% expected. This, however, fails to impress the euro bulls or offer any support to the EUR/GBP cross.
Apart from this, political instability in Italy - ahead of elections in September - adds to concerns about the regions economic outlook and could further weigh on the euro. This supports prospects for a further near-term depreciating move for the EUR/GBP cross. The British pound, on the other hand, is pressured by resurgent US dollar demand and could help limit deeper losses. Nevertheless, the fundamental backdrop seems tilted firmly in favour of bearish traders.
Technical levels to watch
- Annual HICP in Germany jumped to 8.5% in July.
- EUR/USD stays under bearish pressures, closes in on 1.0100.
Inflation in Germany, as measured by the Consumer Price Index (CPI), declined to 7.5% on a yearly basis in July from 7.6% in June, Germany's Destatis reported on Thursday. This reading came in slightly higher than the market expectation of 7.4%.
The Harmonised Index of Consumer Prices (HICP), the European Central Bank's preferred gauge of inflation, climbed to 8.5% in the same period from 8.2%, compared to the market expectation of 8.1%.
Market reaction
The shared currency struggles to find demand after this report and the EUR/USD pair was last seen losing 0.85% on the day at 1.0117.
UOB Group’s Senior Economist Julia Goh and Economist Loke Siew Ting assess the latest inflation figures in the Malaysian economy.
Key Takeaways
“Headline inflation breached the 3% level for the first time this year at 3.4% y/y in Jun (from 2.8% in May). It came in higher than ours and Bloomberg consensus of 3.2%. Price pressures broadened with more consumer price index (CPI) components recording larger price increases last month compared to the preceding month, led by food and transport components.”
“We expect CPI growth to jump above 4.0% in 2H22 after averaging 2.5% in 1H22. Our 2H22 inflation outlook largely rests on high commodity prices, year-ago low base effects, persistent currency weakness, changes in some staple food prices (i.e. chicken, eggs and cooking oil), and recovering domestic demand. The new targeted fuel subsidy mechanism, which is currently under pilot testing, will pose upside risks to our inflation outlook should it be implemented over the next few months. As such, our current full-year inflation forecast of 3.0% is subject to upward revision next month when the Jul CPI reading is released (vs. 2.5% in 2021, BNM est: 2.2%-3.2%).”
“The combination of factors including broadening second-round effects on inflation, firmer domestic economic recovery, and diminishing real interest rate gap with US continue to suggest a need for further policy normalisation. We expect Bank Negara Malaysia to deliver another 25bps rate hike at the next MPC meeting on 7-8 Sep, taking the Overnight Policy Rate (OPR) to 2.50%.”
US Q2 GDP Overview
Thursday's economic docket highlights the release of the Advance second-quarter US GDP report, at 12:30 GMT. Having contracted by 1.6% in the previous quarter, the world's largest economy is expected to return to growth and narrowly avoided a so-called 'technical' recession. GDP likely grew at a meagre 0.3% annualized pace during the April-June period, though some economists anticipate a drop in activity for the second successive quarter.
According to Valeria Bednarik, Chief Analyst at FXStreet, “Macroeconomic data points to heightened downward risks for the economy, particularly figures linked to the last half of the quarter, as spending retreated sharply.”
How Could it Affect EUR/USD?
Ahead of the key release, the US dollar stages a goodish rebound from its lowest level since July 6 touched earlier this Thursday. A stronger GDP print would be enough to reinforce expectations that the Fed would still hike 50 bps at each meeting in the remainder of this year. This would be enough to provide a fresh lift to the greenback and force the EUR/USD pair to prolong its intraday retracement slide from the 1.0235 region.
Conversely, a weaker reading would add to growing market worries about an economic downturn. This might continue to weigh on investors' sentiment and offer support to the safe-haven greenback. Apart from this, concerns about an energy crisis in the Eurozone suggest that the path of least resistance for the EUR/USD pair is to the downside.
Eren Sengezer, Editor FXStreet, outlined important technical levels to trade the EUR/USD pair: “The Fibonacci 38.2% retracement level of the latest downtrend forms strong resistance at 1.0230, which is also the upper limit of the 10-day-old trading range. With a four-hour close above that level, the pair could target 1.0300 (psychological level, Fibonacci 50% retracement) and 1.0320 (200-period SMA on the four-hour chart).”
“On the downside, 1.0200 (50-period SMA, psychological level) aligns as initial support before 1.0150 (Fibonacci 23.6% retracement, 100-period SMA) and 1.0100 (psychological level, static level),” Eren added further.
Key Notes
• US Gross Domestic Product Preview: Would the US avoid a technical recession?
• US GDP Preview: Win-win for the dollar? Economy's flirt with recession to boost the buck
• EUR/USD Forecast: Euro needs to clear 1.0230 to attract buyers
About US GDP
The Gross Domestic Product Annualized released by the US Bureau of Economic Analysis shows the monetary value of all the goods, services and structures produced within a country in a given period of time. GDP Annualized is a gross measure of market activity because it indicates the pace at which a country's economy is growing or decreasing. Generally speaking, a high reading or a better than expected number is seen as positive for the USD, while a low reading is negative.
- EUR/JPY accelerates the decline below 138.00 on Thursday.
- Immediately to the downside now emerges the July low at 136.85.
EUR/JPY rapidly retreats to 2-week lows south of the 138.00 yardstick on Thursday.
The cross remains under pressure and is vulnerable to further decline while below the weekly high at 142.32 (July 21). Against that, the next support of note aligns at the July low at 136.85 (July 8). If breach on a sustainable fashion, then the cross could attempt a move to the critical 200-day SMA, today at 133.65.
In the longer run, the constructive stance in the cross remains well underpinned by the 200-day SMA at 133.65.
EUR/JPY daily chart
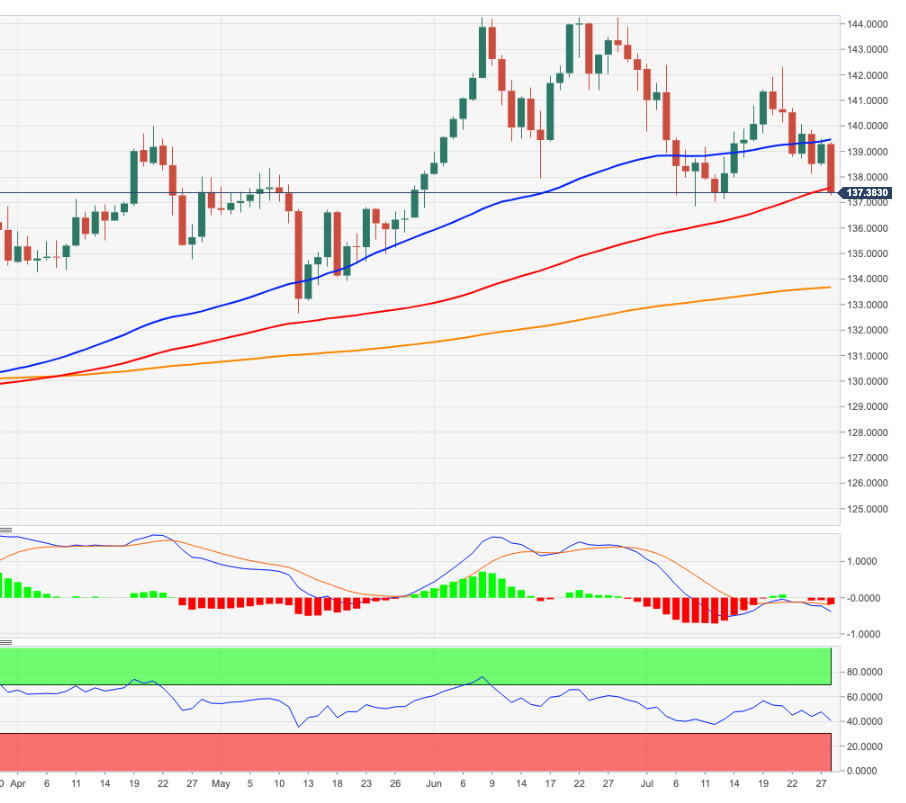
FX Strategists at UOB Group Lee Sue Ann and Quek Ser Leang expect USD/CNH to extend the 6.7280-6.7800 range for the time being.
Key Quotes
24-hour view: “Yesterday, USD traded in a choppy manner between 6.7393 and 6.7703 before closing at 6.7449 (-0.33%). The price actions have resulted in a mixed outlook and USD could continue to trade in a choppy manner, expected to be within a range of 6.7380/6.7680.”
Next 1-3 weeks: “USD traded mostly sideways for the past few days and the movement is likely part of a consolidation phase. Further sideway-trading seems likely, expected to be between 6.7280 and 6.7800.”
- USD/CHF reverses an intraday dip to the lowest level since July 4 amid resurgent USD demand.
- A goodish pickup in the US Treasury bond yields helps the USD to stall the post-FOMC decline.
- Recession fears could underpin the safe-haven CHF and cap the pair ahead of the US GDP print.
The USD/CHF pair drops to a three-and-half-week low during the first half of the European session on Thursday, though manages to find some support at lower levels. Spot prices have now bounced back to the 0.9600 neighbourhood, though the attempted recovery lacked bullish conviction.
As investors look past a less hawkish FOMC, the US dollar is staging a solid rebound from its lowest level since July 6 touched earlier this Thursday amid a goodish pickup in the US Treasury bond yields. This is turning out to be a key factor that offers some support to the USD/CHF pair.
Fed Chair Jerome Powell on Wednesday eased fears about more aggressive policy tightening. The markets, however, seem convinced that the Fed would have to hike 50 bps at each meeting in the remainder of this year, which, in turn, is acting as a tailwind for the US bond yields.
The overnight optimistic move in the US equity markets, meanwhile, seems to be fading rather quickly amid growing worries about a global economic downturn. This offers some support to the safe-haven Swiss franc and might keep a lid on any meaningful upside for the USD/CHF pair.
Moving forward, the focus now shifts to the release of the Advance US Q2 GDP report later during the early North American session. The world's largest economy is anticipated to have grown by a 0.4% annualized pace during the April-June period, avoiding a technical recession.
A surprisingly stronger reading would be enough to spark a fresh USD rally and prompt aggressive short-covering around the USD/CHF pair. This, in turn, would suggest that spot prices have formed a near-term bottom and pave the way for some meaningful appreciating move.
Technical levels to watch
- Silver extends the weekly ascent and climbs to over a three-week high on Thursday.
- Bulls now await a sustained move beyond the $19.50 area before placing fresh bets.
- The $19.00 mark seems to protect the immediate downside ahead of the mid-$18.00s.
Silver gains traction for the third successive day on Thursday and climbs to a three-and-half-week high during the first half of the European session. The white metal, however, seemed to struggle to find bullish acceptance above the $19.50 horizontal resistance.
From a technical perspective, the overnight post-FOMC move beyond the $19.00 mark was seen as a fresh trigger for bulls. That said, oscillators on the daily chart - though have been recovering from the negative territory - are yet to gain any meaningful traction. This makes it prudent to wait for some follow-through buying beyond the aforementioned barrier before positioning for any further appreciating move.
The XAG/USD could then aim to conquer the $20.00 psychological mark. The said handle coincides with the 200-hour SMA on the 4-hour chart, which if cleared decisively would set the stage for additional gains. The subsequent short-covering move has the potential to lift spot prices to the next relevant hurdle near the $20.60-$20.65 horizontal zone. The momentum could further get extended towards the $21.00 round figure.
On the flip side, any meaningful pullback now seems to find decent support near the $19.00 level. Sustained weakness below would expose the $18.50 intermediate support. A convincing break below the latter would negate any near-term positive bias and make the XAG/USD vulnerable to retesting the YTD low, around the $18.15 region. Some follow-through selling below the $18.00 mark should pave the way for further losses.
The XAG/USD could then accelerate the downfall towards the $17.45-$17.40 support en-route to the $17.00 round-figure mark. The downward trajectory could further get extended and spot prices could eventually drop to test the next relevant support near the $16.70-$16.60 region.
Silver 4-hour chart
-637945967721145213.png)
Key levels to watch
Further downside pressure carries the potential to drag USD/JPY to the 135.00 area in the short-term horizon, note FX Strategists at UOB Group Lee Sue Ann and Quek Ser Leang.
Key Quotes
24-hour view: “USD closed at 136.55 before breaching the 136.00 support during early Asian hours. The boost in downward momentum suggests USD could break the major support at 135.55. The next support at 135.00 is likely out of reach for now. Resistance is at 136.25 followed by 136.55.”
Next 1-3 weeks: “USD dropped sharply during early Asian hours. Shorter-term downward momentum has improved rapidly and the risk for USD is tilted to the downside towards 135.00. The downside risk is intact as long as USD does not move above the current ‘strong resistance’ level at 137.00.”
- EUR/USD keeps the post-Fed upside well in place above 1.0200.
- Final EMU Consumer Confidence came at -27.0 in July.
- German Flash CPI, US Advanced Q2 GDP next of relevance.
The buying interest around the European currency remains well in place and motivates EUR/USD to return to the 1.0230 region on Thursday.
EUR/USD now looks to German data
EUR/USD advances for the second session in a row following the FOMC event on Wednesday, where the Fed raised rates by 75 bps as widely expected.
However, Powell’s press conference unexpectedly showed a not-so-hawkish tone, particularly after signaling that the current fast pace of the normalization process could slow down at some point.
The current uptick in the pair comes in tandem with further recovery in the German 10y Bunds yields, which approach the key 2.00% level in the European morning.
In the euro docket, final figures saw the Consumer Confidence in the euro area at -27.0 in July, the Economic Sentiment at 99 (from 103.5) and the Industrial Sentiment at 3.5 (from 7). Later in the session, Germany’s flash inflation figures for the current month are due.
Across the Atlantic, all the attention will be on the release of the advanced Q2 GDP seconded by weekly Initial Claims.
What to look for around EUR
Euro bulls regain the upper hand and push EUR/USD further north of the 1.0200 hurdle in response to renewed upside traction following the FOMC event on Wednesday.
Price action around the European currency, in the meantime, is expected to closely follow dollar dynamics, geopolitical concerns, fragmentation worries and the Fed-ECB divergence.
On the negatives for the single currency emerges the so far increasing speculation of a potential recession in the region, which looks somewhat propped up by lower sentiment readings and the renewed downtrend in some fundamentals.
Key events in the euro area this week: EMU Final Consumer Confidence, Economic Sentiment, Germany Flash Inflation Rate (Thursday) – Germany Unemployment Change, Unemployment Rate, Flash Q2 GDP, EMU Flash Inflation Rate, Advanced Q2 GDP (Friday).
Eminent issues on the back boiler: Continuation of the ECB hiking cycle. Italian elections in late September. Fragmentation risks amidst the ECB’s normalization of monetary conditions. Performance of the economic recovery post-pandemic in the region. Impact of the war in Ukraine on the region’s growth prospects and inflation.
EUR/USD levels to watch
So far, spot is gaining 0.10% at 1.0201 and a breakout of 1.0278 (weekly high July 21) would target 1.0435 (55-day SMA) en route to 1.0615 (weekly high June 27). On the other hand, initial contention emerges at 1.0107 (weekly low July 26) seconded by 1.0000 (psychological level) and finally 0.9952 (2022 low July 14).
- Economic sentiment continued to weaken in the euro area.
- EUR/USD lost its traction, turned flat on the day near 1.0200.
"In July 2022, the Economic Sentiment Indicator (ESI) plummeted in both the EU (-4.2 points to 97.6) and the euro area (-4.5 points to 99.0), falling below its long-term average," the European Commission reported on Thursday.
Further details of the publication revealed the Industrial Confidence Index dropped to 3.5 in July from 7 in June and the Services Confidence Index declined to 10.7 from 14.1. Finally, the Consumer Confidence Index fell to -27 from -23.8, matching the market expectation.
Market reaction
The EUR/USD pair edged lower with the initial reaction to the disappointing sentiment data and was last seen trading flat on the day near 1.0200.
In the opinion of FX Strategists at UOB Group Lee Sue Ann and Quek Ser Leang, NZD/USD could revisit the area north of the 0.6300 yardstick in the next weeks.
Key Quotes
24-hour view: “NZD dropped to 0.6192 before rising to a high of 0.6261 during NY session. Upward momentum has improved slightly and NZD could advance further. That said, a break of the major resistance at 0.6305 is unlikely (there is another resistance at 0.6275). Support is at 0.6235 but only a breach of 0.6220 would indicate that the current mild upward pressure has eased.”
Next 1-3 weeks: “Shorter-term upward momentum has improved slightly and NZD could rise towards 0.6305 from here. As upward momentum is not strong, a sustained rise above 0.6305 appears unlikely for now. The current mild upward pressure is intact as long as NZD does not move below the ‘strong support’ level at 0.6195.”
- AUD/USD is seen consolidating near a multi-week high set earlier this Thursday.
- The post-FOMC USD selling bias continued lending some support to spot prices.
- Recession fears hold back bulls from placing fresh bets ahead of the US Q2 GDP.
The AUD/USD pair is extending its sideways consolidative price moves and remains confined in a range around the 0.7000 psychological mark through the early European session.
The US dollar extends the previous day's downfall led by less hawkish remarks by Fed Chair Jerome Powell and slides to its lowest level since July 6. Powell signalled that another large adjustment could be coming at the next policy meeting in September, but it would be dependent on the incoming data.
Furthermore, the Fed officials also acknowledged that economic indicators have softened and noted signs of a slowdown. This suggests that the US central bank would slow the pace of its interest rate hikes, which continued weighing on the greenback and is seen as a key factor lending some support to the AUD/USD pair.
Investors, however, remain concerned about the possibility of an economic downturn and have refrained from taking an aggressive risk. This seems to hold back traders from placing fresh bullish bets around the risk-sensitive aussie and capping gains for the AUD/USD pair, which, remains below a six-week high touched earlier this Thursday.
Moving forward, Thursday's focus will remain on the release of the Advance US Q2 GDP report, due later during the early North American session. The data would play a key role in influencing the USD price dynamics. This, along with the broader market risk sentiment, should provide a fresh impetus to the AUD/USD pair.
Technical levels to watch
- The index adds to Wednesday’s losses near the 106.00 area.
- US yields attempt a mild rebound following the FOMC event.
- Advanced Q2 GDP, Initial Claims come next in the docket.
The greenback, in terms of the US Dollar Index (DXY), extends the bearish note to the 106.00 neighbourhood on Thursday, where a decent contention seems to have emerged.
US Dollar Index now looks to GDP
The index is down for the second session in a row as market participants continue to digest the somewhat unexpected dovish tone from the FOMC gathering on Wednesday.
It is worth recalling that the Federal Reserve raised the Fed Funds Target Range by 75 bps to 2.25%-2.50%, as broadly anticipated, although Chief Powell dialed down the probability of further large hikes later at his press conference.
Later in the session, flash Q2 GDP figures will take centre stage seconded by usual weekly Claims.
What to look for around USD
The index comes under downside pressure in the wake of the Fed meeting on Wednesday and now flirts with the 106.00 region.
Despite the knee-jerk, the constructive view in the dollar appears bolstered by the Fed’s divergence vs. most of its G10 peers (especially the ECB) in combination with bouts of geopolitical effervescence and occasional re-emergence of risk aversion.
On the flip side, market chatter of a potential US recession could temporarily undermine the uptrend trajectory of the dollar somewhat.
Key events in the US this week: Flash Q2 GDP, Initial Claims (Thursday) – PCE Price Index, Personal Income, Personal Spending, Final Michigan Consumer Sentiment (Friday).
Eminent issues on the back boiler: Hard/soft/softish? landing of the US economy. Escalating geopolitical effervescence vs. Russia and China. Fed’s more aggressive rate path this year and 2023. US-China trade conflict. Future of Biden’s Build Back Better plan.
US Dollar Index relevant levels
Now, the index is down 0.16% at 106.29 and faces initial support at 106.05 (weekly low July 28) followed by 103.67 (weekly low June 27) and finally 103.41 (weekly low June 16). On the other hand, a break above 107.42 (weekly high post-FOMC July 27) would expose 109.29 (2022 high July 15) and then 109.77 (monthly high September 2002).
- GBP/USD firming up amid less hawkish Fed outcome.
- Rallying yields trigger a fresh rebound in the US dollar.
- GBP bulls aim for the 50 DMA ahead of the US Q2 GDP.
GBP/USD is trading modestly higher while defending the 1.2150 level, having retreated from a fresh monthly high of 1.2186 reached earlier in the Asian session.
The decent rebound in the US dollar across the board, driven by the rally in the Treasury yields, is capping the recovery gains in cable. As the dust settles over the less hawkish Fed outcome, the US rates are recovering ground, as risk flows dominate and weigh negatively on the safe-haven American government bonds.
The Fed on Wednesday raised the policy rates by the anticipated 75 bps but adopted the meeting-by-meeting approach to guide the interest rates, paying attention to the slowdown in the economic activity while continuing its fight with inflation. The Fed’s abandoning its guidance and confirming net neutrality sparked the dollar sell-off.
On the other hand, GBP bulls are shrugging off the UK political developments, although fears over a potential recession in the country’s real-estate sector are boding ill for the domestic currency. Looking ahead, markets await the US Q2 advance GDP release for fresh signs on the health of the economy and the potential policy action by the Fed in the upcoming meetings.
As observed in the cable’s daily chart, the pair has found a solid foothold above the flattening 21-Daily Moving Average (DMA), now at 1.1998, where the rising trendline support coincides.
It will take a lot for bears to take out the latter, as it will enact a powerful downside barrier.
Further, the 14-day Relative Strength Index (RSI) is holding fort above the midline, adding credence to the bullish potential.
Bulls need a sustained move above the 1.2186 supply zone to accelerate the recovery momentum, with eyes set on the bearish 50 DMA at 1.2229.
Acceptance above the 50 DMA is critical to confirm a bullish reversal in the spot.
On the flip side, a daily closing below 21 DMA is needed to trigger a fresh downswing towards the 1.1900 mark.
GBP/USD: Daily chart
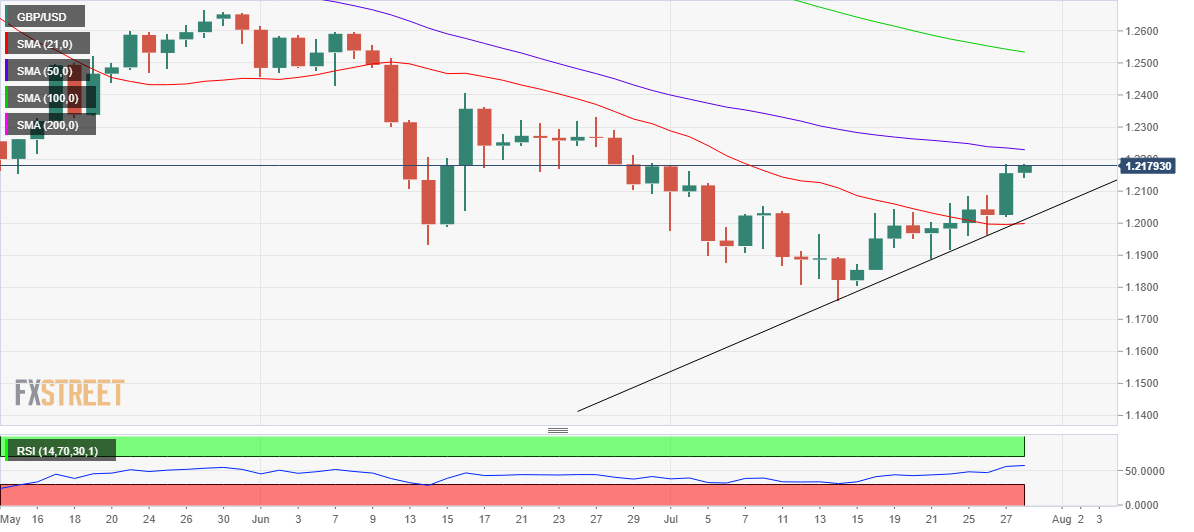
GBP/USD: Additional technical levels
“The FOMC is now fully data dependent and doesn’t want to pre-commit, opening the door wide for further volatility in the front end of the curve,” analysts at Rabobank explain.
Additional Quotes:
“There are eight weeks until the meeting in September, with lots of economic data releases (e.g. two jobs reports, two CPI reports, lots of other activity data) and potentially numerous geopolitical updates in between. Chair Powell did however say that June’s Summary of Economic Projections (SEP) is still the best guide to the Fed’s rate path.”
“We still have some way to go to the SEP’s 3.40%: about 100 bps in total in September, November and December. Given that Powell wants to slow down at some point, this suggests that the FOMC may be thinking of 50 bps in September, followed by 25 bps in the remaining two meetings. This corresponds, in aggregate, with market pricing of 58 bps in September, 30 bps in November and 11 bps in December. We think the Fed underestimates the persistence of US inflation and will have to go faster, hiking 50 bps at each meeting in the remainder of this year.”
Here is what you need to know on Thursday, July 28:
The dollar came under heavy selling pressure late Wednesday and the US Dollar Index (DXY) erased all of Tuesday's gains. The DXY stays on the back foot and trades below 106.50 early Thursday as investors reassess the Federal Reserve's policy outlook. Later in the session, the US Bureau of Economic Analysis will release its first estimate of the second quarter of Gross Domestic Product (GDP) growth. The US Department of Labor's weekly Initial Jobless Claims will also be looked upon for fresh impetus. The European docket will feature German inflation figures and the business sentiment data for the eurozone.
The Fed announced on Wednesday that it hiked the policy rate by 75 basis points to the range of 2.25-2.5%. During the press conference, Chairman Jerome Powell said that they will not be providing any rate guidance from now on. Regarding the policy outlook "our thinking is that we want to get to a moderately restrictive level by end of this year," Powell noted. "That means 3% to 3.5%."
Fed Quick Analysis: Powell abandons guidance, market cheer may prove short-lived
The Nasdaq Composite Index gained more than 4% on Wednesday and the S&P 500 Index gained 2.6%. Nevertheless, US stock index futures are trading in negative territory in the European morning, suggesting that investors are turning cautious ahead of the US GDP data.
US Gross Domestic Product Preview: Would the US avoid a technical recession?
EUR/USD climbed to a daily high of 1.0235 in the early European session on Thursday. With the negative shift witnessed in risk sentiment helping the dollar limit its losses, however, the pair retreated below 1.0200.
GBP/USD climbed to its highest level in four weeks at 1.2188 but went into a consolidation phase early Thursday. The pair trades in a relatively tight channel above 1.2170 in the European morning.
Gold capitalized on falling yields on Wednesday and advanced to a fresh two-week high above $1,740. The benchmark 10-year US Treasury bond yield is up 1% so far on Thursday, not allowing XAU/USD to gather further bullish momentum.
USD/JPY closed in negative territory on Wednesday and continues to push lower toward 135.50 on Thursday. On Friday, Tokyo CPI, Industrial Production and Unemployment data from Japan will be watched closely by market participants.
Bitcoin gained 8% on Wednesday but lost its momentum near $23,000. Ethereum touched its highest level since June 10 at $1,676 earlier in the day before retreating toward $1,600.
- USD/CAD stages a modest bounce from a six-week low touched earlier this Thursday.
- The post-FOMC USD selling, bullish crude oil prices could cap any attempted recovery.
- Investors look forward to the Advance US Q2 GDP report for some meaningful impetus.
The USD/CAD pair reverses an early European session dip to sub-1.2800 levels, or its lowest level since June 13 and for now, has managed to defend the 100-day SMA support. The pair is now seen trading in the neutral territory, around the 1.2815 region, though any meaningful recovery seems elusive.
Fed Chair Jerome Powell's less hawkish remarks on Wednesday drags the US dollar to its lowest level since July 6, which could act as a headwind for the USD/CAD pair. In the post-meeting press conference, Powell signalled that another large adjustment could be coming at the next policy meeting in September, but it would be dependent on the incoming data.
Furthermore, the Fed officials also acknowledged that economic indicators have softened and noted signs of a slowdown. This suggests that the US central bank would slow the pace of its interest rate hikes, which remains supportive of a generally positive tone around the equity markets. The risk-on impulse is seen as another factor weighed on the safe-haven USD.
Crude oil prices, meanwhile, climbed to a one-week high and drew support from the bullish supply data from the US Energy Information Administration on Wednesday. This, along with the prospects for another supersized 100 rate hike move by the Bank of Canada, should underpin the commodity-linked and also contribute to capping gains for the USD/CAD pair.
The fundamental backdrop seems tilted in favour of bearish traders and supports prospects for an extension of the recent pullback from the YTD low, around the 1.3225 area touched earlier this month. Market participants now look forward to the release of the Advance US Q2 GDP report, which would influence the USD and provide a fresh impetus to the USD/CAD pair.
Technical levels to watch
- Gold scales higher for the second successive day and climbed to over a two-week high.
- The post-FOMC USD selling bias remains unabated and is offering support to the metal.
- Rebounding US bond yields, the risk-on impulse could cap gains ahead of the US Q2 GDP.
Gold builds on the overnight goodish rebound from the $1,711 area, or a multi-day low, and gains some follow-through traction for the second successive day on Thursday. The positive move lifts the XAU/USD to over a two-week high during the early European session, with bulls now awaiting sustained strength beyond the $1,745-$1,750 strong resistance zone.
The US dollar prolongs the previous day's less hawkish FOMC-inspired decline and slips to its lowest level since July 6. This, in turn, is offering some support to the dollar-denominated gold. During the post-meeting press conference, Fed Chair Jerome Powell signalled that another large adjustment could be coming at the next policy meeting in September, but it would be dependent on the incoming data.
Furthermore, the Fed officials also acknowledged that economic indicators have softened and noted signs of a slowdown. This suggests that the US central bank would slow the pace of its interest rate hikes, which continued weighing on the greenback. That said, a goodish rebound in the US Treasury bond yields is acting as a tailwind for the buck and might keep a lid on the non-yielding gold, at least for the time being.
Apart from this, the risk-on impulse - as depicted by a generally positive tone around the equity markets - could further contribute to capping gains for gold. Even from a technical perspective, the $1,745-$1,750 region has been acting as a stiff resistance since the early part of July. This further makes it prudent to wait for strong follow-through buying before positioning for any further near-term appreciating move.
Market participants now look forward to the US economic docket, highlighting the release of the Advance Q2 GDP report later during the early North American session. The world's largest economy is expected to have grown by 0.4% annualized pace during the April-June period and avoid a technical recession. This would validate the Fed's view that the US economy isn't currently in a recession and provide a modest lift to the USD.
This, along with the US bond yields, would influence the USD price dynamics and drive the XAU/USD. Traders will further take cues from the broader market risk sentiment to grab short-term opportunities around gold.
Technical levels to watch
- WTI buyers keep reins during two-day uptrend amid mixed concerns.
- Fed-inspired USD weakness favor oil buyers but recession fears challenge upside moves.
- Headlines suggesting Russia, US oil reserve release could entertain traders ahead of US Q2 GDP.
WTI crude oil prices remain firmer around $98.00 during early Thursday morning in Europe.
In doing so, the black gold rises for the second consecutive day while cheering the softer US dollar. However, fears of an economic slowdown appear to challenge the commodity bulls.
That said, the US Dollar Index (DXY) drops to the lowest levels since July 05 while taking offers near 106.05, down 0.30% intraday at the latest. The greenback’s gauge declined the most in six weeks the previous day after the US Federal Reserve (Fed) disappointed USD bulls.
The Fed matched market forecasts by announcing a 75-bps rate increase. The underlying reason for the pair’s weakness could be attributed to Fed Chairman Jerome Powell’s speech as it signaled that the hawks are running out of fuel. Key comments from the Fed’s Powell were that the rates had reached neutrality, so there won't be any more forward guidance, as well as rates will be decided meeting by meeting.
It’s worth observing that the US Treasury yield curve inversion eased just after the Fed but keeps signaling fears of the economic slowdown of late. The US 10-year Treasury yields dropped nearly four basis points (bps) to 2.78% while the 2-year bond coupons slumped by 2.58% to 2.98% after the Fed’s 0.75% rate hike. Even so, the gap between the key US bond coupons remains the widest since 2000 and in turn hints at the US recession woes. It should be noted that the US 10-year Treasury yield pares recent losses around 2.80% and also remains pressured around 3.00% by the press time.
Elsewhere, a fall in the US crude oil inventories joined fears of further reduction in the Russian energy exports to Europe to favor the commodity buyers.
“US crude oil stockpiles dropped 4.5 million barrels last week as exports surged to an all-time high due to U.S. crude's big discount to international benchmark Brent, the Energy Information Administration said,” per Reuters.
On Wednesday, Gas flows through the Nord Stream 1 pipeline fell to a fifth of the pipeline's capacity while Italy's Eni said it will receive lower volumes from Russia's Gazprom, report Reuters.
Moving on, updates from the virtual meeting between US President Joe Biden and his Chinese counterpart Xi Jinping will join the recession fears to entertain intraday AUD/USD traders. However, major attention will be given to the flash readings of the US second quarter (Q2) Gross Domestic Product (GDP) amid recession woes.
Technical analysis
A downward sloping resistance line from July 08 joins 21-DMA to restrict short-term WTI upside around $98.50. Pullback moves, however, remain elusive until the quote stays above a fortnight-old rising trend line, at $94.30 by the press time.
Open interest in natural gas futures markets rose for the fourth consecutive session on Wednesday, this time by almost 5K contracts according to preliminary readings from CME Group. Volume extended the erratic performance and declined by around 101K contracts.
Natural Gas keeps targeting $10.00
Wednesday’s downtick in prices of natural gas was amidst increasing open interest, which supports the prospects for further correction in the very near term. In the meantime, the bullish stance in the commodity continues to target a move to the key $10.00 mark per MMBtu once the 2022 peak at $9.752 (July 26) is cleared.
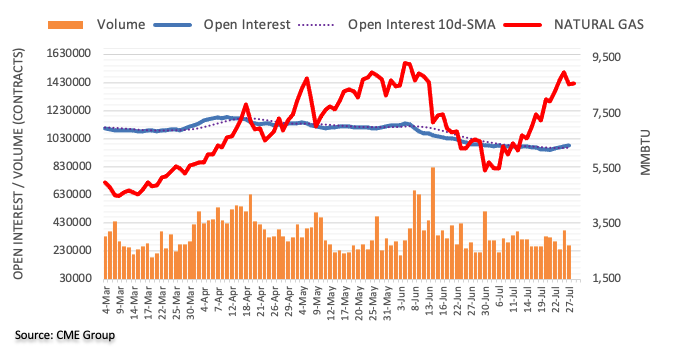
According to the latest Reuters poll of analysts and fund managers, the bearish outlook on most Asian currencies has eased but short positions remain at around multi-month highs.
Key findings
“Short bets on the Thai baht were the highest since January 2018, having steadily built up since early March.”
“Sentiment for the Philippine peso improved over the past two weeks after the Bangko Sentral ng Pilipinas in mid-July raised its key interest rates by 75 bps in an off-cycle move.”
“Chinese yuan seen as a safer bet among Asian currencies, was the second-least shorted currency in the region, while short positions on the Indian rupee, Indonesian rupiah and the Malaysian ringgit moderated slightly but remained firm.”
-
USD/INR Price Analysis: Indian rupee buyers need validation from 79.70
In light of the recent price action, AUD/USD could now revisit the 0.7040 region in the next weeks, comment FX Strategists at UOB Group Lee Sue Ann and Quek Ser Leang.
Key Quotes
24-hour view: “The strong surge in AUD to 0.7012 during NY session appears to be overdone and AUD is unlikely to strengthen much further. For today, AUD is more likely to trade between 0.6965 and 0.7020.”
Next 1-3 weeks: “Despite the relatively strong advance in AUD yesterday, upward momentum has not improved by much. That said, there is scope for AUD to advance further to 0.7040. At this stage, the odds for AUD to rise to the next resistance at 0.7070 are not high. On the downside, a breach of 0.6935 (‘strong support’ level) would indicate that the current upward pressure has eased.”
Analysts at Australia and New Zealand (ANZ) banking group offer their take on the Australian Retail Sales data for June and its implications on the Reserve Bank of Australia’s (RBA) policy path.
Key quotes
“Retail sales increased by 0.2% m/m in June. This was the weakest result this year, but not weak enough to derail the RBA from a 50bp increase in the cash rate next week.”
“It isn’t clear yet whether this result is due to high inflation, rate hikes and low consumer confidence, or the strong uptake of overseas travel, which would shift some household spending away from the Australian retail sector.“
“The ABS’s provisional estimates for overseas travel show the gap between departures and arrivals widened in June, with 20% more departures than arrivals in June vs 1% more departures in May.”
“ANZ-observed spending in June and July showed no cliff in spending, so it is still too early to call an inflation and interest rate led slowdown.”
Considering advanced prints from CME Group for crude oil futures markets, traders trimmed their open interest positions by nearly 5K contracts on Wednesday, reaching the second daily drop in a row. Volume, on the other hand, rose for the second consecutive session, now by more than 61K contracts.
WTI looks capped by $100.00
WTI prices charted decent gains on Wednesday. The uptick, however, faltered ahead of the key $100.00 mark and was accompanied by shrinking open interest, hinting at the idea that a potential corrective move could be shaping up in the near term. That said, a convincing breach of the 200-day SMA at $94.95 could spark a deeper decline to the July low at $90.58 (July 14).
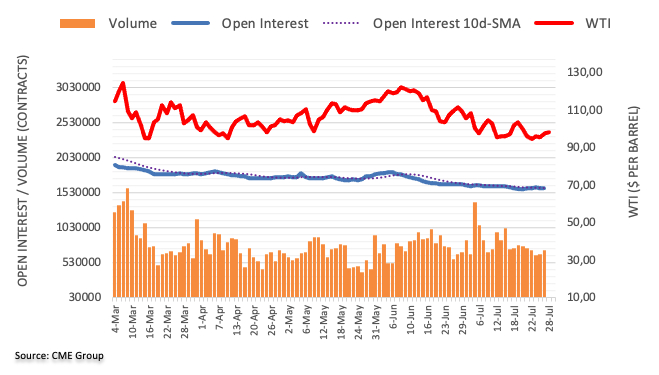
- USD/JPY remains pressured around three-week low, fades corrective pullback of late.
- Clear downside break of monthly trend line, downbeat RSI favor sellers.
- 50-DMA lures sellers, bulls stay cautious below 138.40.
USD/JPY bears keep reins around 135.30 as they cheer the downside break of an ascending trend line from June 23 heading into Thursday’s Asian session.
In doing so, the yen pair also justifies the previous day’s U-turn from a fortnight-old horizontal resistance, around 137.40. Furthermore, downward sloping RSI (14), not oversold, also keeps USD/JPY bears hopeful.
That said, the quote presently drops towards the 38.2% Fibonacci retracement of the May-July upside, near 134.35.
Following that, the 50-DMA level near 134.15 could challenge the USD/JPY bears before directing them to the mid-June swing low of 131.50.
Alternatively, the support-turned-resistance line, at 135.90 by the press time, precedes the 136.00 threshold to restrict short-term USD/JPY recovery.
Even if the pair rises past 136.00, a horizontal area comprising multiple levels marked since July 11 and a downward sloping resistance line from July 14, respectively near 137.40 and 138.40, will be tough nuts to crack for the pair buyers before gaining control.
Overall, USD/JPY is on the way to 134.15 until the quote stays below 138.40.
USD/JPY: Daily chart
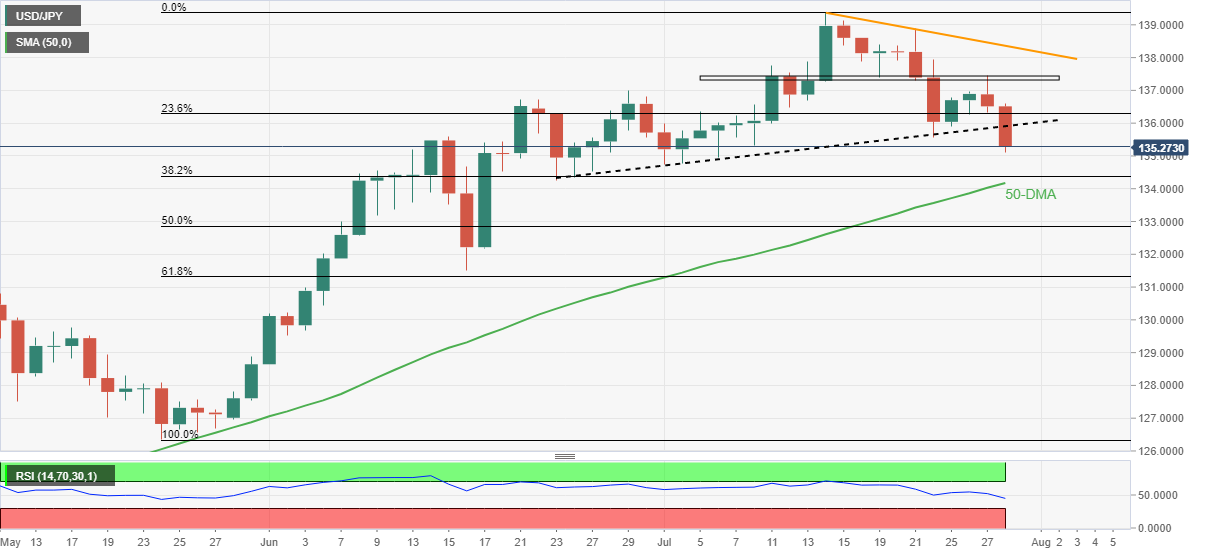
Trend: Further weakness expected
FX option expiries for July 28 NY cut at 10:00 Eastern Time, via DTCC, can be found below.
- EUR/USD: EUR amounts
- 1.0050 444m
- 1.0200 844m
- 1.0250 620m
- 1.0300 1.7b
- USD/JPY: USD amounts
- 134.00 400m
- 136.25 1.7b
- USD/CHF: USD amounts
- 0.9910 250m
- AUD/USD: AUD amounts
- 0.7000 325m
- 0.7020 333m
- 0.7140 415m
- USD/CAD: USD amounts
- 1.2810 810m
- 1.2850 902m
- 1.2915 540m
- NZD/USD: NZD amounts
- 0.6000 857m
- 0.6075 495m
- Copper prices have remained shy of $3.50 but are likely to surpass the crucial hurdle.
- A highlight of softer retail demand by the Fed has dragged the DXY.
- The accelerating demand for copper in China has strengthened copper prices.
Copper prices, as per the COMEX Futures, have displayed a juggernaut rally as the US dollar index (DXY) has shifted into a negative trajectory. The base metal has remained shy of the crucial resistance of $3.50, however, the asset is expected to overstep the same swiftly.
The DXY witnessed a steep fall on Wednesday after the Federal Reserve (Fed) passed a less expected hawkish commentary in its monetary policy meeting. Fed chair Jerome Powell announced a consecutive rate hike by 75 basis points (bps) and presented a target for interest rates near 3.5% by the end of 2022. After the rate hike announcement by 75 bps, the interest rates have escalated to 2.25-2.50%.
In his commentary, Fed highlighted an observed slump in retail demand, which forced the market participants to dump the DXY. However, the job market is rock solid and is delighting the Fed.
On the supply front, the suspended copper production by Chinese miner MMG Ltd due to a long protest at its Las Bambas mine in Peru, as reported by Reuters has supported copper prices. In times, when monsoon seems over in the major provinces of China and other nations in Asia, a halt in copper production is sufficient to accelerate base metal principally. Lower supply will cater to the higher demand only at premium prices.
Also, the growth rate of Covid-19 in China is stable now, which has trimmed the odds of a severe lockdown. Stagnancy in the growth rate of Covid-19 indicates that the pandemic will be at its peak sooner and there is will no restrictions on economic activities.
Further upside could now see GBP/USD advancing to the 1.2240 region in the near term, suggest FX Strategists at UOB Group Lee Sue Ann and Quek Ser Leang.
Key Quotes
24-hour view: “GBP jumped to a high of 1.2187 before closing on a strong note at 1.2158 (+1.06%). The rapid rise has room to extend but in view of the overbought conditions, the major resistance at 1.2240 is unlikely to come into the picture for now (there is another resistance at 1.2200). On the downside, a breach of 1.2110 (minor support is at 1.2135) would indicate that the current upward pressure has eased.”
Next 1-3 weeks: “GBP surged by 1.06% (NY close of 1.2158), its biggest 1-day gain in 6 weeks. The boost in upward momentum suggests GBP is likely to trade with an upward bias towards 1.2240. The upside risk is intact as long as GBP does not move below 1.2065 (‘strong support’ level) within these few days.”
“Fed's policy decision could affect forex, asset market moves so watching developments carefully,” said Bank of Japan (BOJ) Deputy Governor Masayoshi Amamiya on Thursday.
Also read: BOJ’s Amamiya: Central bank must support economy with monetary easing as recovery not solid
Additional comments
Hope Fed curbs inflation while achieving stable US growth.
That is important not just for US but for global economy.
Fed policy decision won't directly affect BOJ policy moves.
But could have impact on Japan's economy, prices in the short-term.
Recent yen declines may see more Japanese firms shift production back home.
USD/JPY retreats
Following the announcements, USD/JPY fades the corrective pullback from a three-week low marked earlier in the day. That said, the yen pair was last seen retreating to 135.30.
- USD/TRY snaps eight-day uptrend around yearly high as US dollar keeps post-Fed losses.
- Fed’s Powell drowned greenback by teasing rate neutrality.
- FOMC matched market forecasts by announcing 0.75% rate hike.
- Flash readings of US Q2 GDP, Turkish Economic Confidence Index should also be eyed for clear directions.
USD/TRY picks up bids to pare early Asian session losses, staying unchanged on a day around 18.00 ahead of Thursday’s European session.
The Turkish lira (TRY) pair’s latest inaction around the yearly top could be linked to the market’s fears of recession, as well as cautious mood ahead of the flash readings of the US Q2 Gross Domestic Product (GDP) Annualized, expected 0.4% versus -1.6% prior. Also restricting the immediate USD/TRY up-moves could be the aftershocks of the Fed’s disappointment.
At home, anxiety ahead of the Central Bank of the Republic of Türkiye’s (CBRT) Quarterly Inflation Report also restricts immediate USD/TRY advances. “Central Bank Governor Sahap Kavcioglu will hold a briefing to present the bank's latest quarterly inflation report, with the inflation forecasts for end-2022 and end-2023 expected to be ratcheted up after annual CPI neared 80% last month,” per Reuters.
On Wednesday, the US Federal Reserve (Fed) matched market forecasts by announcing a 75-bps rate increase. The underlying reason for the pair’s weakness could be attributed to Fed Chairman Jerome Powell’s speech as it signaled that the hawks are running out of fuel. Key comments from the Fed’s Powell were that the rates had reached neutrality, so there won't be any more forward guidance, as well as rates will be decided meeting by meeting.
It should be noted that the wider gap between the short-range bond coupons and the longer-term Treasury yields hints at economic pessimism. The US 10-year Treasury yields dropped nearly four basis points (bps) to 2.78% while the 2-year bond coupons slumped by 2.58% to 2.98% after the Fed’s 0.75% rate hike. Even so, the gap between the key US bond coupons remains the widest since 2000 and in turn hints at the US recession woes. It should be noted that the US 10-year Treasury yield pares recent losses around 2.80% and also remains pressured around 3.00% by the press time.
Moving on, Turkish Economic Confidence for July, prior 93.6, precedes the CBRT’s quarterly inflation report to direct short-term USD/TRY moves. Given the record high inflation in Turkey, as well as CBRT’s refrain from rate hikes, the pair prices may rise further in case the report cites escalating price pressure.
Technical analysis
A two-week-old bullish channel restricts short-term USD/TRY moves between 18.05 and 17.75. That said, overbought RSI hints at the pair’s pullback.
CME Group’s flash data for gold futures markets noted open interest shrank for the fifth consecutive session on Wednesday, this time by around 5.5K contracts. Volume, instead, increased for the second straight session, now by around 36.5K contracts.
Gold looks capped by $1,740
Gold prices edged higher on Wednesday in the wake of the FOMC event and reached the key $1,740 level. The move, however, was amidst shrinking open interest and leaves the prospects for further upside somewhat limited for the time being.
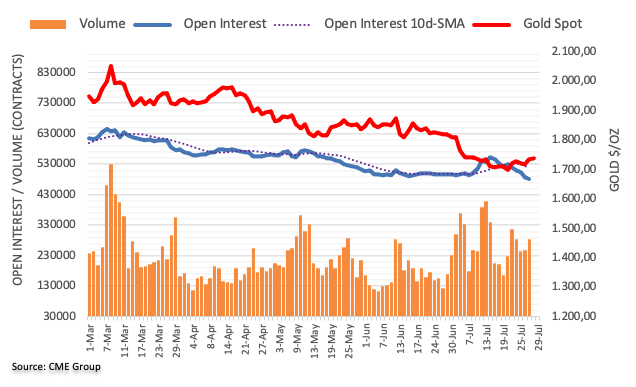
- EUR/GBP has picked offers around 0.8400 and has shifted back inside the woods.
- Lower consensus for eurozone GDP has weakened the shared currency bulls.
- The inflation rate in the UK may accelerate to a two-digit figure swiftly.
The EUR/GBP pair is trading in a charted territory of 0.8379-0.8400 range in the early European session. The asset has remained in the negative trajectory for the past week after failing to tap the crucial resistance of 0.8600. Escalating odds of an energy crisis in eurozone has weakened the shared currency bulls.
The eurozone caters more than 25% of its energy demand from Russia. After Russia invaded Ukraine, the European Union (EU) levied an embargo on oil and energy imports from Russia. For some unwarranted reasons, Russia has cut off the gas supply to Europe from its main pipeline which has featured the expectations of an energy crisis. Investors are betting that energy prices will soar as Winter is coming and demand will escalate tremendously.
Should the eurozone hit an energy crisis, the jobless rate will accelerate meaningfully and a recession situation could get real.
Going forward, the release of the eurozone Gross Domestic Product (GDP) will hog the limelight. The economic data is expected to release lower to 3.4% vs. 5.4% reported in the previous quarter. An occurrence of the same will weaken the shared currency bulls further.
On the UK front, the market participants are expecting more policy tightening measures by the Bank of England (BOE) as the price pressures are likely to kiss the two-digit figure, considering the ongoing momentum and the unavailability of exhaustion signs. Also, the political dilemma is impacting the sentiment of the market.
- EUR/USD struggles to extend post- Fed gains as short-term key EMA tests buyers.
- Bullish MACD signals, sustained trading beyond fortnight-old support hint at further advances.
- Parity level, descending resistance line from June act as additional trading filters.
EUR/USD seesaws inside the key EMA envelope as it pokes 1.0200 heading into Thursday’s European session. That said, the 21-day EMA restricts the major currency pair’s immediate upside while the 10-day EMA restricts the bear’s entry.
That said, the quote’s successful trading beyond two-week-long horizontal support joins bullish MACD signals to keep buyers hopeful.
However, a clear upside break of the 21-day EMA, around 1.0230, appears necessary for the bulls.
Following that, a seven-week-long resistance line, close to 1.0310 at the latest, will challenge the EUR/USD bulls before giving them control.
Alternatively, the 10-day EMA level near 1.0185 precedes the aforementioned horizontal area near 1.0120 to restrict the EUR/USD pair’s short-term downside.
Also acting as the downside filter is the 1.0100 threshold and the 1.0000 mark known as the parity level.
Should the EUR/USD pair remains bearish past 1.000, the recent low near 0.9950 and December 2002 low near 0.9860 will be in focus.
EUR/USD: Daily chart
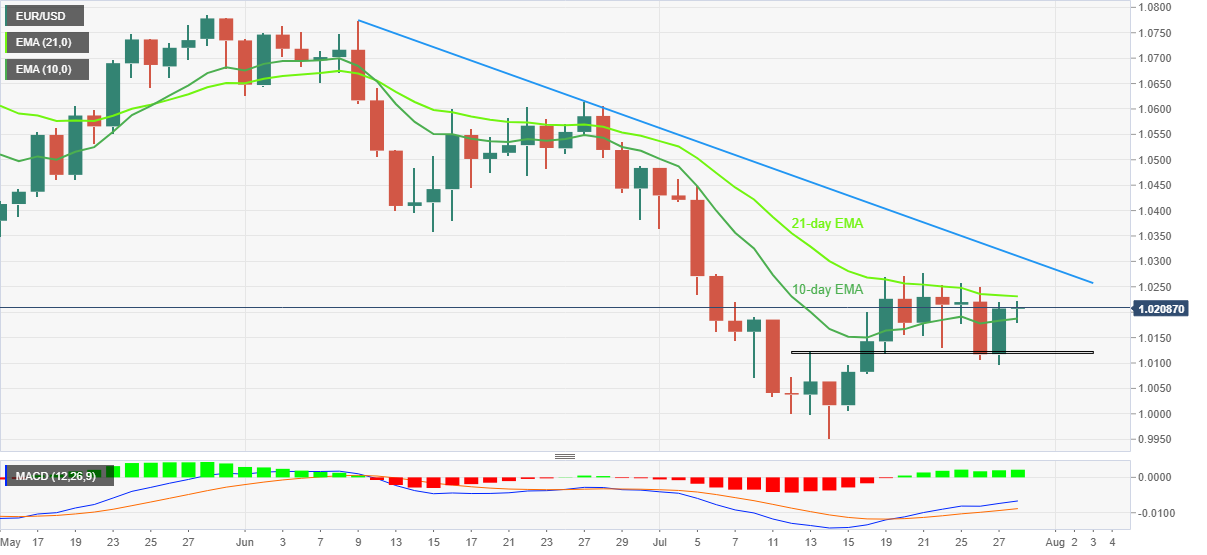
Trend: Further upside expected
FX Strategists at UOB Group Lee Sue Ann and Quek Ser Leang see EUR/USD navigating within the 1.0100-1.0285 range in the next few weeks.
Key Quotes
24-hour view: “Yesterday, EUR dipped to a low of 1.0095 before surging quickly to a high of 1.0220 during NY session. While the rapid rise appears to be overdone, there is scope for EUR to advance further. That said, a sustained rise above 1.0250 appears unlikely (next resistance is at 1.0285). Support is at 1.0170 followed by 1.0140.”
Next 1-3 weeks: “EUR slipped to a low of 1.0095 yesterday before rebounding to close at 1.0202 (+0.87%). Upward momentum has improved somewhat but the current movement appears to be part of a consolidation phase. EUR is likely to trade between 1.0100 and 1.0285 for now.”
- Aussie bulls are aiming for a rising channel breakout for further upside.
- Advancing 50-and 200-EMAs add to the upside filters.
- The RSI (14) has shifted into the bullish range of 60.00-80.00 swiftly.
The AUD/USD pair has turned sideways after printing a fresh monthly high of 0.7013 on Wednesday. The asset is oscillating in a 0.6979-0.7003 range in the early European session and is likely to extend gains after an upside break of the charted territory.
After a thorough observation of the hourly timeframe, it is not early to say that the asset is ripe to deliver an upside break of the rising channel. The upper and lower portion of the above-mentioned chart pattern is plotted from July 22 high and July 21 low at 0.6978 and 0.6858 respectively.
The 50-and 200-period Exponential Moving Averages (EMAs) at 0.6959 and 0.6911 respectively are scaling higher, which adds to the upside filters.
Also, the Relative Strength Index (RSI) (14) has shifted into the bullish range of 60.00-80.00, which advocates a sheer upside momentum ahead.
A confident break above Wednesday’s low at 0.7013 will drive the asset towards June 16 high at 0.7069, followed by the round-level resistance at 0.7100.
Alternatively, aussie bulls could lose their grip if the asset drops below July 25 low at 0.6880. This may drag the pair towards the round-level support at 0.6800. A downside move below 0.6800 will open the door for more downside towards July 13 low at 0.6724.
AUD/USD hourly chart
-637945821664144093.png)
- EUR/JPY remains depressed around two-week low, jostles with short-term key support.
- Nine-day-old support line restricts immediate downside, 50-SMA guards recovery.
- Sluggish RSI hints at further grinding of prices towards the south.
EUR/JPY struggles to keep bears happy as it dribbles around 138.20 heading into Thursday’s European session. In doing so, the cross-currency pair flirts with short-term support lines amid sluggish market.
That said, the nearly oversold RSI and the pair’s repeated bounces off adjacent trend line supports challenge the bears.
However, buyers are less likely to take entries until the quote stays below the 50-SMA level surrounding 139.86, as well as the 140.00 threshold.
It’s worth noting that the EUR/JPY upside past 140.00 could direct the bulls towards the previous weekly peak near 142.35. During the run-up, 140.50 may offer an intermediate halt.
Alternatively, a three-week-old support line clutches the pair sellers near 138.20 before the weekly trend line support of 137.80.
Following that, the lows marked during early July, near 137.20 and 136.85, should gain the bear’s attention.
In a case where EUR/JPY prices remain weak past 136.85, a gradual south-run towards May’s low near 132.65 can’t be ruled out.
EUR/JPY: Four-hour chart
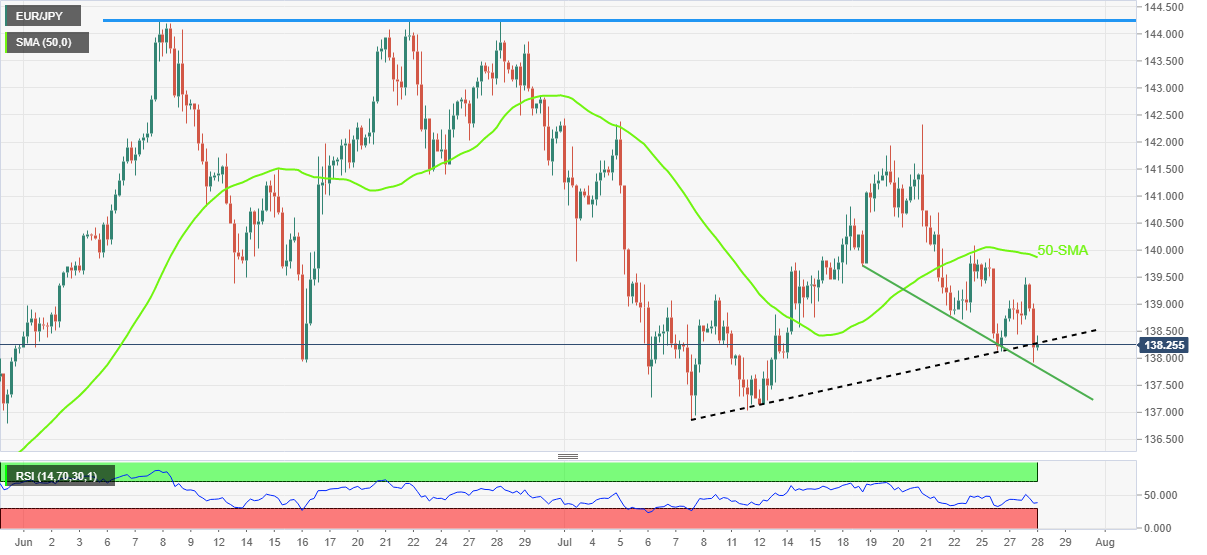
Trend: Limited downside expected
The Financial Times (FT) quotes a Bloomberg survey of economists to raise expectations that the US may avert technical recession during its flash readings of the Q2 Gross Domestic Product (GDP) Annualized, expected 0.4% versus -1.6% prior, scheduled for Thursday.
“The US is expected to report weak second-quarter growth on Thursday following a contraction in the first three months of the year, avoiding a so-called technical recession but still reflecting a slowdown in the economy,” said FT.
The analytical piece also mentioned that a technical recession is defined as two consecutive quarters of GDP contraction. However, the US does not use this definition and instead relies on a determination by a group of researchers at the National Bureau of Economic Research, based on a broader range of factors.
Key quotes
Weak GDP data is unlikely to change the Fed’s calculus for now, economists say. In his press conference after Wednesday’s policy meeting, chair Jay Powell said he did not believe the US was in a recession and pointed to strength in the economy, including in the labor market.
Despite the consensus forecast of 0.5 percent, several big banks including Barclays, Bank of America and UBS are betting the economy will have shrunk for a second consecutive quarter.
The Atlanta Fed’s GDPNow forecast, a dynamic estimate of real GDP growth based on the most current economic data, shows a contraction of 1.2 percent.
Also read: US GDP Preview: Win-win for the dollar? Economy's flirt with recession to boost the buck
- Asian indices are slightly bullish as the DXY has extended its losses after Fed’s monetary policy.
- Softening retail demand has trimmed the Fed’s less hawkish guidance optimism.
- Oil prices are likely to extend gains as EIA has reported a fall in oil stockpiles.
Markets in the Asian domain are displaying a modest strength as a risk-on mood has improved the risk appetite of investors. The announcement of an interest rate hike by the Federal Reserve (Fed) along with less-than-expected hawkish guidance has dragged the US dollar index (DXY) significantly.
At the press time, Japan’s Nikkei225 added 0.20%, China A50 gained 0.65%, Nifty50 jumped 0.69% while Hang Seng eased 0.37%.
It is worth noting that the extent of weakness in the DXY from Tuesday is extremely higher than the strength displayed by Asian equities. Apart from the Fed’s less hawkish guidance, the reason behind plummeting DXY is the accelerating odds of a recession in the US economy.
Fed chair Jerome Powell in his commentary highlighted the softening retail demand. A slump in overall demand led by soaring price pressures will result in less business for the Asian markets and therefore lower corporate earnings for exporting businesses.
Meanwhile, the DXY is likely to establish below 106.00 as it is tapping the immediate support around the same with severe pressure. Also, a downbeat release of the US Gross Domestic Product (GDP) on Thursday will trigger a fresh bearish impulsive wave.
On the oil front, oil prices have witnessed a mild correction after attempting a break above the immediate hurdle of 98.00. On a broader note, the black gold is advancing towards the critical figure of $100.00 as oil stockpiles have dropped in the US along with an increase in demand for gasoline. The Energy Information Administration (EIA) reported a fall in oil inventories by 4.5 million barrels last week.
- NZD/USD grinds higher following the biggest run-up in a week.
- New Zealand’s ANZ data came in mixed, recession fears test Kiwi pair buyers.
- Fed’s Powell triggered net neutrality chatters, drowned USD despite 0.75% rate hike.
- Flash readings of the US Q2 GDP, risk catalysts will be important to watch.
NZD/USD remains sidelined around 0.6260-70 heading into Thursday‘s European session, after rising the most in a week.
Alike other currency major pairs, the Kiwi pair also cheered the Fed-inspired USD weakness before the fears of recession and pre-data anxiety challenges the bulls. Additionally, mixed sentiment data from New Zealand also played a role to restrict the pair’s latest moves.
That said, New Zealand ANZ Activity Outlook for July improved to -8.7% versus -9.1% prior but the Business Confidence dropped below -55 expected to -56.7, versus -62.6 prior. “ANZ said in a note that businesses were well aware the Reserve Bank is on a mission to reduce customer demand to curb inflation so it was no surprise they were feeling apprehensive,” reported Reuters following the data release.
Elsewhere, the market’s reassessments of Fed Chairman Jerome Powell’s signals for net neutrality and an intact inversion of the US 2-year and 10-year Treasury yields, which in turn suggest recession, seem to have weighed on the risk appetite and the NZD/USD prices. Further, the cautious mood ahead of the virtual meeting between US President Joe Biden and China President Xi Jinping, as well as the flash readings of the US Q2 Gross Domestic Product (GDP) Annualized, expected 0.4% versus -1.6% prior, challenge NZD/USD buyers.
However, the US dollar’s downbeat performance due to the Fed’s hints of a slowdown in the rate hike cycle, as well as chatters surrounding the US economic weakness, appeared to have kept the NZD/USD buyers hopeful.
Also read: US GDP Preview: Win-win for the dollar? Economy's flirt with recession to boost the buck
Technical analysis
A 110-pip area between the 50-DMA and 21-DMA, respectively around 0.6310 and 0.6200, restricts short-term NZD/USD moves.
- USD/CAD struggles to extend post-Fed losses, stays sidelined around six-week low.
- 200-HMA restricts upside, one-week-old support line tests bears.
- Descending trend line from July 18 adds to the upside filters.
USD/CAD treats water around 1.2820-30 during Thursday morning in Europe, after refreshing the monthly low the previous day. In doing so, the Loonie pair dribbles inside a 90-pip trading area between the 200-HMA and the weekly support line.
That said, the downbeat RSI and impending bulls cross on the MACD hints at the further corrective pullback of the USD/CAD prices.
It’s worth noting that the pair’s upside break of the 200-HMA level near 1.2900 will need validation from an eight-day-old descending resistance line, at 1.2915 by the press time, to convince the bulls.
Following that, a run-up towards the weekly high surrounding 1.2950 and the 1.3000 psychological magnet can’t be ruled out.
Meanwhile, a downside break of the aforementioned support line, close to 1.2805 at the latest, should also successfully break the 1.2800 threshold to lure the USD/CAD bears.
In that case, the 61.8% Fibonacci retracement level of the pair’s April-July upside, near 1.2715, will be in focus.
Overall, USD/CAD bears seem to run out of fuel but the corrective pullback appears to have limited upside room.
USD/CAD: Hourly chart
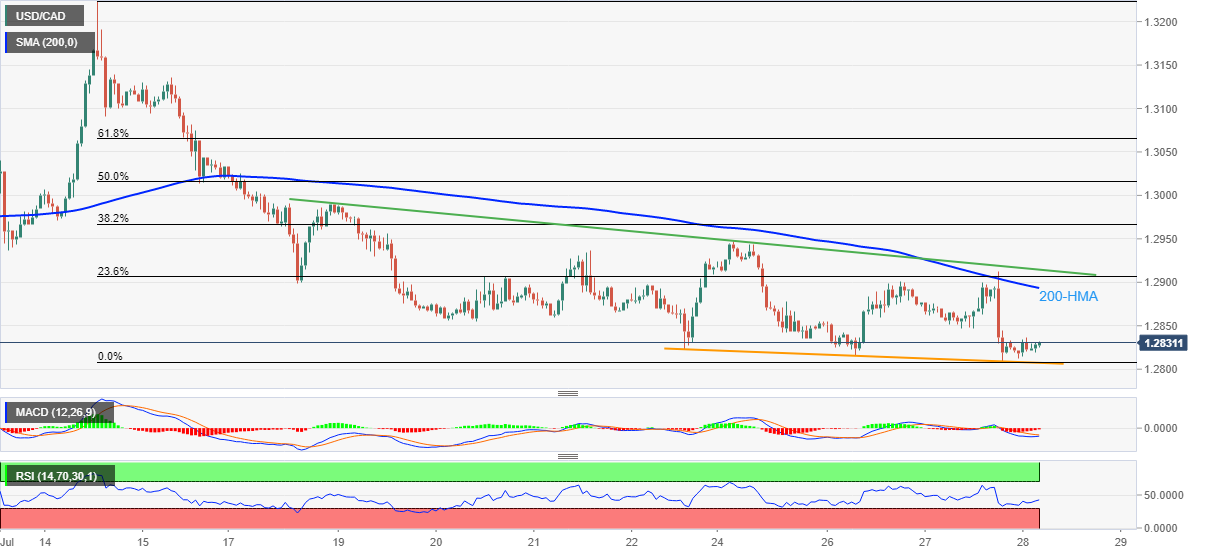
Trend: Further recovery expected
- Gold price is hovering below $1,740.00 as investors await US GDP.
- Less-than-expected hawkish commentary from the Fed has infused fresh blood into the gold bulls.
- The DXY has witnessed an extreme sell-off as the Fed has confirmed a slump in retail demand.
Gold price (XAU/USD) is displaying topsy-turvy moves in a minute range of $1,734.19-1,741.78 in the Asian session. The precious metal is auctioning in a charted territory after a sheer upside move from a low of $1,711.56 on Wednesday. Usually, a vertical upside move is followed by a sideways action as investors initiate more longs through the inventory distribution structure.
A mild hawkish commentary from the Federal Reserve (Fed) in the monetary policy meeting on Wednesday has infused fresh blood into the gold bulls. The Fed is seeing the interest rates at 3.5% by the end of 2022. This indicates that there is less room for bumper rate hikes now and September’s monetary policy will see normalcy in the rate hike extent.
Meanwhile, the US dollar index (DXY) is expected to perform vulnerable as Fed chair Jerome Powell has highlighted a slump in retail demand. Going forward, the US Gross Domestic Product (GDP) numbers will remain in focus. As per the market consensus, the US GDP data will shift lower to 8% against the prior release of 8.3% on a quarterly basis. While the annualized figure will significantly improve to 0.4% vs. -1.6% in the prior release.
Gold technical analysis
On an hourly scale, the gold price is gearing up for an upside break of the supply zone placed in a narrow range of $1,739.63-1,745.03. A golden cross, represented by the 50-and 200-period Exponential Moving Averages (EMAs) at $1,720.00 has bolstered the odds of a bullish reversal.
Adding to that, the Relative Strength Index (RSI) has shifted into the bullish range of 60.00-80.00, which signals more gains ahead.
Gold hourly chart
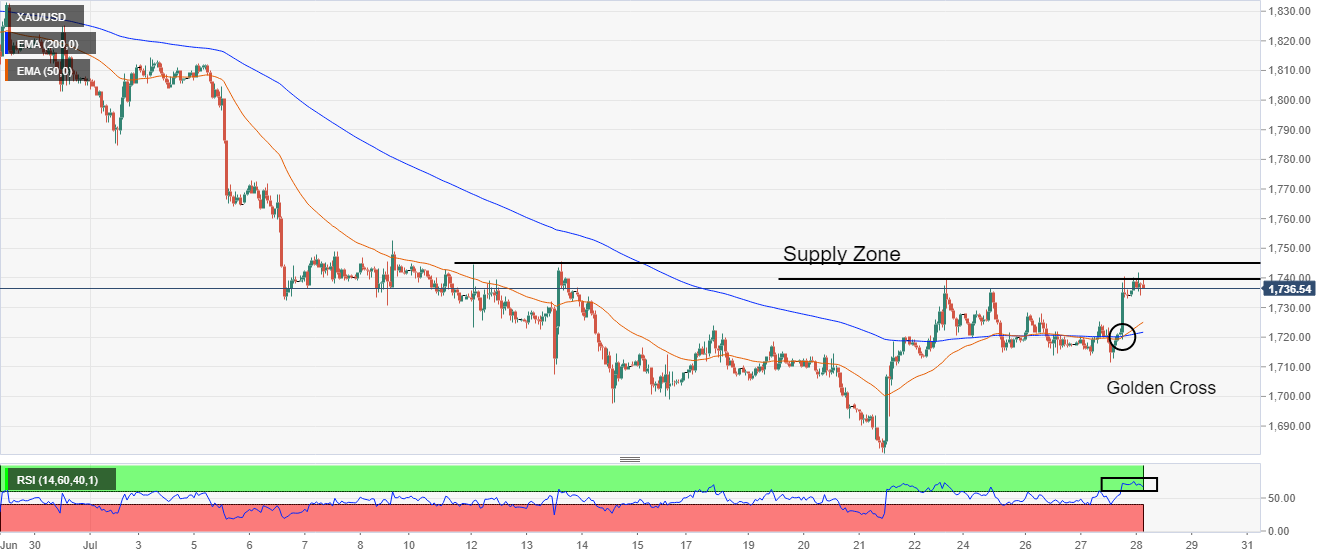
- GBP/USD remains sidelined around monthly high, recently easing from the top.
- US dollar slumped after Fed’s 0.75% rate hike as Chairman Powell teased net neutrality.
- Downbeat British car production, fears of UK real-estate recession and political jitters probe Pound buyers.
- Flash readings of US Q2 GDP, Xi-Biden meeting and political headlines from London will be the key.
GBP/USD changes hands around the monthly high of 1.2186, recently easing to 1.2165, as bulls and bears jostle amid the market’s indecision during early Thursday morning in Europe. The cable pair’s latest inaction could be linked to the market’s wait for the key data/events, as well as fears of recession and political jitters in the UK. That said, the quote rallied the most in six weeks the previous day as the US Federal Reserve (Fed) failed to impress markets despite announcing a 75 basis points of rate hike.
Also challenging the GBP/USD buyers are the recent headlines concerning Britain. “British car production rose 5.6% in June from a year earlier, as supply chain snags began to ease and zero-emission vehicles saw a record month, an industry body said on Thursday,” said Reuters. Additionally, The UK Times came out with the news suggesting fears of a slowdown in the real estate markets. “The rising cost of debt and a looming recession have caused a “cautious tone across the commercial property market”, said the Royal Institution of Chartered Surveyors in its latest market survey,” per the news.
Elsewhere, the US Treasury yield curve inversion and cautious mood ahead of a meeting between US President Joe Biden and China President Xi Jinping, as well as the US data, also weigh on the Cable pair.
It should be noted that a wider gap between the short-range bond coupons and the longer-term Treasury yields hints at economic pessimism. The US 10-year Treasury yields dropped nearly four basis points (bps) to 2.78% while the 2-year bond coupons slumped by 2.58% to 2.98% after the Fed’s 0.75% rate hike. Even so, the gap between the key US bond coupons remains the widest since 2000 and in turn hints at the US recession woes. It should be noted that the US 10-year Treasury yield pares recent losses around 2.78% and also remains pressured around 2.98% by the press time.
Furthermore, the UK Times conveys a report suggesting the UK-China tussles as British Foreign Minister, as well as the contestant for the next Prime Minister, Liz Truss, mentioned that she is advocating for increased Commonwealth trade.
On Wednesday, the Fed matched market forecasts by announcing a 75-bps rate increase. The underlying reason for the pair’s weakness could be attributed to Fed Chairman Jerome Powell’s speech as it signaled that the hawks are running out of fuel. Key comments from the Fed’s Powell were that the rates had reached neutrality, so there won't be any more forward guidance, as well as rates will be decided meeting by meeting.
Moving on, GBP/USD traders should pay attention to the first readings of the US Q2 Gross Domestic Product (GDP) Annualized, expected 0.4% versus -1.6% prior, for fresh impulse. Also important will be the US Price Consumption Expenditure data from the US, as well as the updates from the Xi-Biden meeting.
Technical analysis
GBP/USD buyers keep the reins as it holds onto the previous day’s upside break of the key resistance line from April, now supporting around 1.2070. Also favoring the bulls is the pair’s sustained trading above 21-DMA and a two-week-old support line, around 1.2100, as well as firmer signals from the MACD.
That said, the 50-DMA level near 1.2230 guards the quote’s immediate upside ahead of a descending resistance line from late March, close to 1.2410 at the latest.
- USD/INR remains pressured inside two-week-old trading range, pokes short-term support line of late.
- 100-SMA, one-month-old ascending trend line adds strength to the downside filters.
- Bulls should wait for a daily close beyond 80.20 to retake control.
- RSI, MACD signals hint that buyers are running out of steam.
USD/INR extends the post-Fed losses as the bears attack a five-week-old rising trend line support near 79.80 during the initial hour of the Indian trading session on Thursday. Even so, the pair remains inside a fortnight-long trading range between 80.20 and 79.70.
Considering the latest weakness in the RSI, as well as an impending bear cross on the MACD< USD/INR is likely to break the 79.70 support.
Following that, an upward sloping trend line from June 29, at 79.55, will be in focus.
In a case where USD/INR prices drop below 79.55, the odds of witnessing the quote’s south-run towards 79.00 and then to the June 29 swing low near 78.80 will be in focus.
Meanwhile, recovery moves may initially aim for the 80.00 threshold before challenging the aforementioned range’s resistance, at 80.20.
In a case where the USD/INR buyers manage to keep reins past 80.20, the 81.00 round figure could flash on their radars.
USD/INR: Four-hour chart
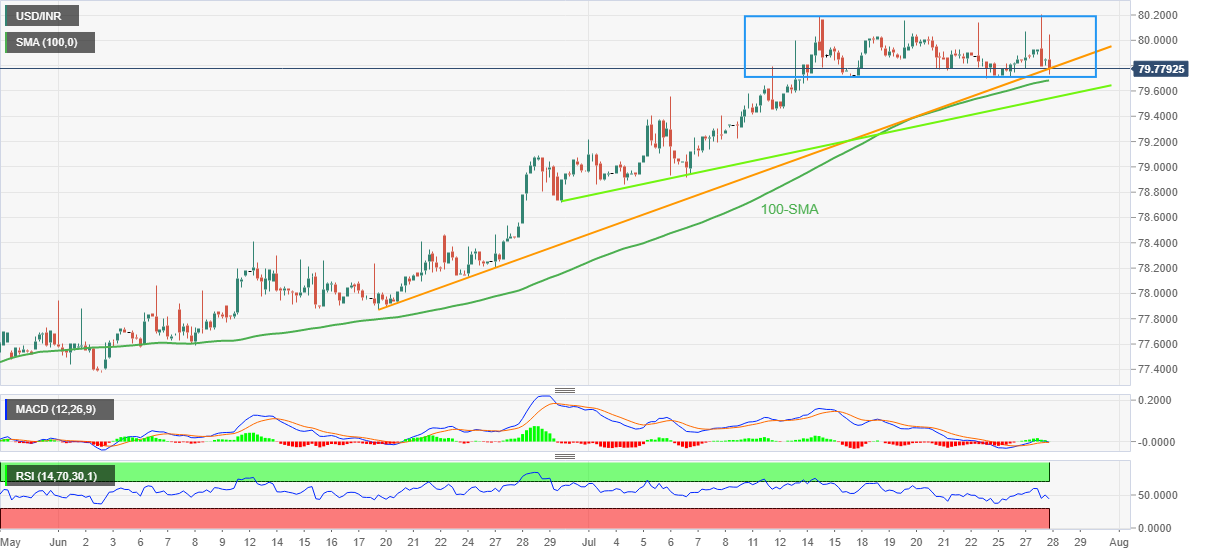
Trend: Further weakness expected
- Steel price refreshes weekly high amid market’s cautious optimism.
- Fed’s Powell hinted at gradual pause in the rate hike cycle while announcing 0.75% rate lift.
- Indonesia’s Krakatau, South Korea’s Posco announces plan for $3.5 billion investment.
- Recession fears in the US, Japan and China test bulls, US GDP Xi-Biden talks in focus.
Steel price takes the bids to renew one-week high amid broad US dollar weakness, as well as cautious optimism in Asia during early Thursday. In doing so, the metal ignores headlines suggesting more investment in steel production, as well as fears of recession. While portraying the moves, the most active steel rebar contract on the Shanghai Futures Exchange rises to 3,980 yuan per metric tonne ($590) by the press time.
That said, Indonesia's Krakatau Steel and South Korea's Posco have signed an agreement to invest $3.5 billion starting next year to expand their production capacity in the Southeast Asian country, Indonesia's investment ministry said on Thursday, reported Reuters. The news also mentioned that the expansion will also include the production of automotive steel for electric vehicles, the ministry said in a statement.
Elsewhere, US Treasury yield curve inversion keeps signaling the fears of the US economic slowdown even if Fed Chairman Jerome Powell’s speech signaled that the hawks are running out of fuel. It’s worth noting that the US Federal Reserve (Fed) matched market forecasts by announcing a 75-bps rate increase.
Also portraying the recession risks were comments from the International Monetary Fund’s (IMF) Chief Economist Pierre-Olivier Gourinchas, not to forget looming concerns over China’s failure to return to the growth trajectory despite heavy stimulus announcements. On Wednesday, JP Morgan followed the IMF and Moody’s white citing the recession risks for the Eurozone.
Looking forward, updates from the virtual meeting between US President Joe Biden and his Chinese counterpart Xi Jinping will join the recession fears to entertain steel traders. However, major attention will be given to the flash readings of the US second quarter (Q2) Gross Domestic Product (GDP).
Also read: US GDP Preview: Win-win for the dollar? Economy's flirt with recession to boost the buck
- EUR/USD is looking to surpass 1.0220 to record more gains as DXY has extended losses.
- Fed’s consecutive rate hike by 75 bps has failed to support the DXY.
- This week, the GDP data from the US and Eurozone will remain in limelight.
The EUR/USD pair is displaying a tad higher range oscillation around 1.0200 in the Asian session. The asset is likely to extend the prior recovery after overstepping late Tuesday’s high at 1.0220. Plummeting US dollar index (DXY) has underpinned the risk-on market mood and the risk-sensitive currencies are capitalizing on the same.
The DXY has recaptured the three-week low around 106.10 and more losses are on the cards as commentary from Federal Reserve (Fed) has confirmed a slump in retail demand. Price pressure has been hurting the households and the retail demand took the bullet, which was visible after the US Consumer Confidence dropped to the lowest since February 2021 to 95.7.
Fed chair Jerome Powell announced a consecutive rate hike by 75 basis points (bps) and laid down a target of 3.5% interest rates by the end of 2022.
Now, investors will focus on US Gross Domestic Product (GDP) numbers for further guidance on the asset. A preliminary estimate for the US GDP data is 8% against the prior release of 8.3% on a quarterly basis. While the annualized figure will significantly improve to 0.4% vs. -1.6% in the prior release.
On the eurozone front, soaring odds of an energy crisis are escalating the expectations of recession as Russia has cut off energy supply from its main pipeline to Europe. The core member of the European Union (EU), Germany may face severe heat amid its higher dependency on Russian energy imports. Also, the eurozone GDP is of utmost importance, which is seen lower at 3.4% vs. 5.4% in the former period.
The World Gold Council (WGC) lowered its demand outlook for gold in the second half of this year after the market witnessed a robust physical demand in the first half.
Key takeaways
"Some macroeconomic factors such as aggressive monetary policy tightening and continued U.S. dollar strength may create headwinds, but upside surprises for gold investment remain firmly on the table. The WGC sees demand relatively flat by year-end.”
“Physical gold demand fell by 948 tonnes or 8% compared to the second quarter of 2021. However, physical gold demand in the first half of the year totaled 2,189 tonnes, up 12% compared to the first half of last year.
"Although H1 ended well, with bar & coin, ETF and OTC demand combined posting the third largest H1 since 2010, Q2 set a slightly weaker tone for ETFs, which has continued so far in July. And this may set a precedent for the rest of H2 given a potential softening of inflation amid aggressive monetary policy tightening."
"Although inflation may start to tail off in H2, the supply situation in many commodity markets remains precarious and renewed spikes can't be ruled out. Such an environment would further highlight the safety of gold. After all, gold's relative performance remains solid in 2022, buttressing its diversification benefits compared to other hedges."
"In addition, geopolitics are always a wild card and remain top of mind for investors. And finally, net investor positioning in futures is historically short, presenting a short-covering risk on a positive price trigger."
"While global jewelry consumption has recovered from the worst of the COVID-induced weakness seen in 2020, it has yet to regain the typical quarterly averages – of around 550t – that characterized the few years preceding the pandemic.”
"Despite healthy Q2 demand, the macroeconomic backdrop of a weaker currency, rising inflation and higher interest rates posed headwinds.”
Related reads
- Gold Price Forecast: XAU/USD pokes 21-DMA hurdle near $1,740 ahead of US GDP
- DXY bulls need to break 107.40 to gain control again
- GBP/JPY is likely to extend losses if the cross drops below 164.50 confidently.
- BOJ’s Amamiya has emphasized continuing policy easing to spurt the growth rate.
- Japan’s employment data is expected to remain upbeat as jobless data may slip to 2.5%.
The GBP/JPY pair has surrendered more than 1% gains after printing a fresh weekly high at 166.33 on late Wednesday. The availability of significant offers while testing the previous week’s high indicates that the pound bulls need more momentum to establish at elevated levels. A sheer downside move has triggered the yen bulls and the asset has been dragged into a negative trajectory.
The cross has delivered a modest rebound after plummeting to near 164.50, however, the downside remains warranted as investors will capitalize on the weak pullback to initiate fresh shorts.
It seems like the commentary from Bank of Japan (BOJ) Deputy Governor Masayoshi Amamiya has strengthened the Japanese yen despite favoring the continuation of an ultra-loose monetary policy. BOJ Amamiya has highlighted the fact that the inflation rate above 2% is temporary and the BOJ is aiming to keep price pressures above 2% comfortably. Adding to that, an easy monetary policy will accelerate the wage rate hike, which is necessary to keep the inflation rate above desired levels.
This week, the employment data from the Statistics Bureau of Japan will be of utmost importance. The jobless rate may trim to 2.5% vs. the prior release of 2.6%. Also, the Jobs/Applicants ratio is expected to increase to 1.25 from the former figure of 1.24.
On the UK front, an increase in the overall inflation rate is impacting the paychecks of the households. The annual inflation rate has climbed to 9.4% and to contain the price pressures the Bank of England (BOE) will announce one more bumper rate hike ahead.
Delivering a "confronting" economic statement to the nation on Thursday, Australia’s Treasurer Jim Chalmers said that inflation is now forecast to peak at 7.75% in the December quarter.
Additional takeaways
Headline inflation seen at 5.5% by middle of 2023, 3.5% by end of 2023, 2.75% by middle of 2024.
Final budget outcome for 2021-22 likely to show a dramatically better-than-expected outcome.
Unemployment rate expected to remain low before returning to 3.75% by June 2023 and 4% by June 2024.
Short, medium-and-longer-term pressures on the budget are more pronounced.
Upgrades forecast for nominal wages growth to 3.75% this financial year and next.
Real wages are expected to start growing again in 2023-24.
Expect that government payments will be around a$30 billion higher over the forward estimates.
Market reaction
At the time of writing, AUD/USD is trading modestly lower at 0.6989, unperturbed by the above comments from Chalmers.
| Raw materials | Closed | Change, % |
|---|---|---|
| Silver | 19.098 | 2.37 |
| Gold | 1734.63 | 1 |
| Palladium | 2025.45 | 1.23 |
“The Funding for Lending Programme (FLP) is working largely as planned and it'll be staying in place until its scheduled end in December,” the Reserve Bank of New Zealand (RBNZ) responded when Interest.co.nz asked a series of questions about the FLP.
The FLP was launched by the RBNZ in December 2020 to provide additional monetary stimulus to the economy.
Additional takeaways
"The FLP is scheduled to end in December 2022. The commitment to the FLP is important to ensure this tool remains credible for future use if required.”
"The drawdown window for the initial allocation of the FLP closed in June 2022. This allocation was roughly two-thirds utilized and any unutilized portion is no longer available. The additional allocation remains open until December 2022."
“The FLP has worked broadly as intended and as expected. We can best observe this by considering the spread between household/business lending rates and wholesale interest rates, i.e. swap rates.”
more to come ....
- USD/JPY takes offers to refresh three-week low, down for the second consecutive day.
- Yen cheers Fed-inspired USD weakness even as fears of economic slowdown in Japan, US dominates.
- BOJ’s Amamiya talks downbeat likely challenges for monetary policy easing.
- Updates from Biden-Xi talks, US GDP will be important for fresh impulse.
USD/JPY braces for the biggest daily loss in a week as sellers poke a four-month-old support line near 135.40 during Thursday’s Asian session. In doing so, the yen pair cheers the broad US dollar weakness after the US Federal Reserve (Fed) announcements amid fears of economic slowdown in the US and Japan. It’s worth noting that a cautious mood ahead of important data/events also weighs on the risk-barometer pair.
Earlier in the day, Japanese media circulated comments made by IMF Chief Economist Pierre-Olivier Gourinchas and renewed fears of further pain for the Asian economy. “Yen’s depreciation “will support Japanese growth” as it “makes Japanese products more competitive globally,” mentioned IMF Economist Gourinchas.
Elsewhere, Bank of Japan (BOJ) Deputy Governor Masayoshi Amamiya said, per Reuters, “BOJ must support the economy with monetary easing as recovery is not solid and wage development remains uncertain.”
It should be noted that yield curve inversion and cautious mood ahead of a meeting between US President Joe Biden and China President Xi Jinping, as well as the US data, also favor the USD/JPY bears of late.
A wider gap between the short-range bond coupons and the longer-term Treasury yields hints at economic pessimism. The US 10-year Treasury yields dropped nearly four basis points (bps) to 2.78% while the 2-year bond coupons slumped by 2.58% to 2.98% after the Fed’s 0.75% rate hike. Even so, the gap between the key US bond coupons remains the widest since 2000 and in turn hints at the US recession woes. It should be noted that the US 10-year Treasury yield pares recent losses around 2.78% and also remains pressured around 2.98% by the press time.
On Wednesday, the USD/JPY pair reversed from the weekly top and snapped a two-day uptrend as the US Federal Reserve (Fed) matched market forecasts by announcing a 75-bps rate increase. The underlying reason for the pair’s weakness could be attributed to Fed Chairman Jerome Powell’s speech as it signaled that the hawks are running out of fuel. Key comments from the Fed’s Powell were that the rates had reached neutrality, so there won't be any more forward guidance, as well as rates will be decided meeting by meeting.
Moving on, updates from the virtual meeting between US President Joe Biden and his Chinese counterpart Xi Jinping will join the recession fears to entertain intraday AUD/USD traders. However, major attention will be given to the flash readings of the US second quarter (Q2) Gross Domestic Product (GDP).
Also read: US GDP Preview: Win-win for the dollar? Economy's flirt with recession to boost the buck
Technical analysis
USD/JPY bears attack an upward sloping support line from early March, near 135.40, by extending the pullback from the 21-DMA resistance near 136.85.
- AUD/JPY drops to key support line on mixed data, takes offer of late.
- Sustained break of 200-HMA favor sellers to break nearby support.
- Weekly low lures intraday bears, buyers need validation from 95.70.
AUD/JPY takes offers to renew intraday low around 94.50 after mixed Aussie data favored bears during Thursday’s Asian session.
Australia’s preliminary Retail Sales for June eased while posting a 0.2% monthly growth compared to the market forecasts of 0.5% and 0.9% in previous readings. Further, the second quarter (Q2) Important Price Index and Export Price Index came in mixed as the former arrived better-than-expected 1.9% but the later data eased to 10.7% versus 19.7% expected and 18.0% forecasts.
In addition to the data, a clear downside break of the 200-HMA and bearish MACD signals also keep AUD/JPY bears hopeful.
That said, an upward sloping support line from July 12, at 94.50 by the press time, restricts the AUD/JPY pair’s immediate downside moves.
Following that, the weekly low of 93.89 and 61.8% Fibonacci retracement of the July 12-20 run-up near 93.40 will gain the market’s attention.
On the contrary, an upside break of the 200-HMA level near 94.90, needs validation from the 95.00 round figure to recall the AUD/JPY buyers.
Even so, the double-tops formation around 95.70-75 appears a tough nut to crack for the bulls.
AUD/JPY: Hourly chart
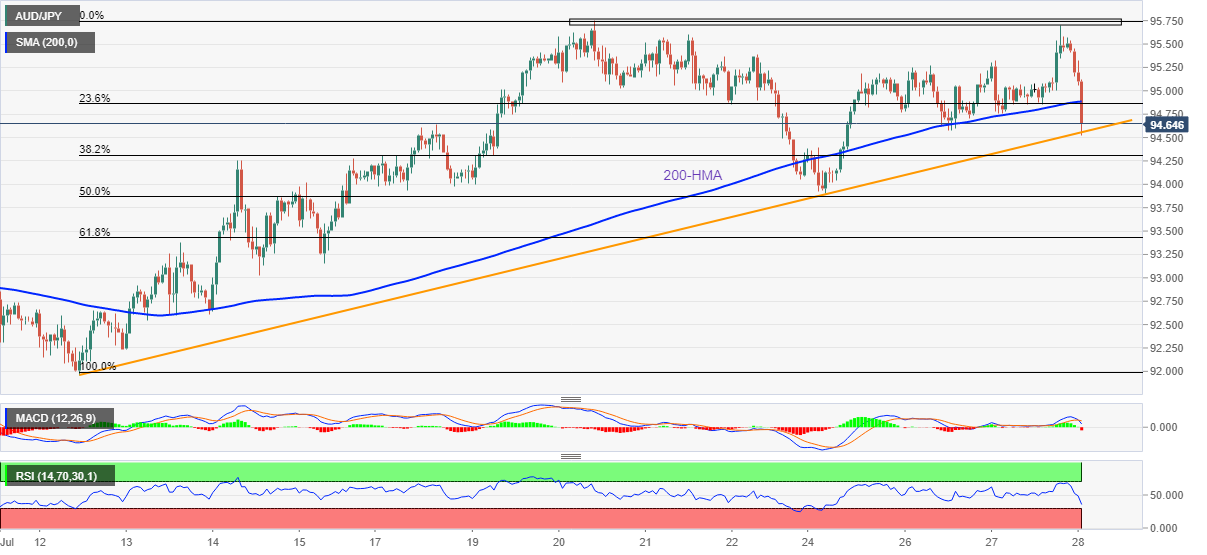
Trend: Further weakness expected
Bank of Japan (BOJ) must support the economy with monetary easing as recovery is not solid and wage development remains uncertain, the central bank Deputy Governor Masayoshi Amamiya said on Thursday.
Additional comments
We are aiming to achieve average 2% inflation, not a temporary rise to that level.
We will judge sustainability of inflation, looking comprehensively at various indicators, price outlook, output gap, inflation expectations and wage moves.
What's important is to create positive cycle where wages, inflation rise simultaneously.
Japan's real interest rates are falling as households' inflation expectations heightening, while nominal rates are kept low.
We must not loosen our grip in keeping monetary conditions easy as there is no prospect yet of meeting our 2% inflation target sustainably.
BOJ will seek sustained, stable achievement of price target, accompanied by wage rises via easy monetary policy.
Consumption recovery becoming clearer but recent spike in covid inflation cases worrying.
Consumer sentiment worsening due to rising energy, food prices.
Corporate profits remain elevated as a whole due partly to impact of weak yen.
If raw material costs remain high for prolonged period, pace of wage rise may not catch up with that of inflation and could hurt economy, consumption.
BOJ must be vigilant to financial, forex moves and their impact on economy, prices.
Medium-term real interest rates are falling as a trend, which is enhancing the effect of our monetary easing.
Nominal wages must rise at a faster pace than inflation for consumption to increase sustainably.
Expect wages to rise at faster pace than consumer inflation next year given economic recovery, tightening job market.
Market reaction
USD/JPY accelerates its decline on the above comments, trading at 135.22, down 0.96% on the day. The spot lost over 100 pips in the last hour, as the post-Fed sell-off extends.
- AUD/USD defends post-Fed rally at six-week high even as Australia Retail Sales eased in June.
- Aussie Retail Sales rose by 0.2% versus 0.5% MoM in June expected and 0.9% prior.
- Australia’s Q2 Import Price Index, Export Price Index also eased.
- Fears of recession jostles with post-Fed optimism, cautious mood ahead of the key data/events also challenge pair buyers.
AUD/USD picks up bids to defend the Fed-inspired gains around 0.7000 threshold despite downbeat data at home. However, the Aussie pair remains sidelined as traders await important data/events amid recession woes.
Australia’s preliminary Retail Sales for June eased while posting a 0.2% monthly growth compared to the market forecasts of 0.5% and 0.9% in previous readings. Further, the second quarter (Q2) Important Price Index and Export Price Index came in mixed as the former arrived better-than-expected 1.9% but the later data eased to 10.7% versus 19.7% expected and 18.0% forecasts.
The data justifies fears of economic slowdown in Australia, earlier conveyed by Bloomberg’s piece reporting excerpts of an economic statement to be delivered to parliament Thursday by Aussie Treasurer Jim Chalmers. However, the anxiety in the market ahead of a meeting between US President Joe Biden and China President Xi Jinpin, as well as the US GDP data, appears to probe the pair traders.
The market’s cautious mood takes clues from the US Treasury yield curve as it continues to signal a wider gap between the short-range bond coupons and the longer-term Treasury yields, which in turn hints at economic pessimism.
The US 10-year Treasury yields dropped nearly four basis points (bps) to 2.78% while the 2-year bond coupons slumped by 2.58% to 2.98% after the Fed’s 0.75% rate hike. Even so, the gap between the key US bond coupons remains the widest since 2000 and in turn hints at the US recession woes. It should be noted that the US 10-year Treasury yield pares recent losses around 2.78% and also remains pressured around 2.98% by the press time.
On Wednesday, the US Federal Reserve (Fed) matched market forecasts by announcing a 75-bps rate increase. The underlying reason for the pair’s weakness could be attributed to Fed Chairman Jerome Powell’s speech as it signaled that the hawks are running out of fuel. Key comments from the Fed’s Powell were that the rates had reached neutrality, so there won't be any more forward guidance, as well as rates will be decided meeting by meeting.
While portraying the mood, the S&P 500 Futures drop 0.15% intraday at the latest.
Looking forward, updates from the virtual meeting between US President Joe Biden and his Chinese counterpart Xi Jinping will join the recession fears to entertain intraday AUD/USD traders. However, major attention will be given to the US Q2 GDP.
Also read: US Gross Domestic Product Preview: Would the US avoid a technical recession?
Technical analysis
A successful upside break of the previous resistance line from April and the 50-DMA, as well as the bullish MACD signals, hint at the AUD/USD pair’s further upside. That said, the 38.2% Fibonacci retracement of the April-July downside, also nearing the mid-June swing high around 0.7070, appears to be the immediate resistance for the pair. Alternatively, pullback moves may initially aim for the 50-DMA level of 0.6972 before testing the previous resistance line near 0.6930.
Australian Retail Sales fell short of expectations in June as consumer spending reduced, suggesting demand is dwindling in the face of surging inflation and rising interest rates.
Retail Sales rose 0.2% in June, the sixth straight month of growth but missed the market forecast of a 0.5% increase, data from the Australian Bureau of Statistics (ABS) showed on Thursday. The gauge booked a 0.9% rise in May.
The country’s Import Price Index climbed 4.3% QoQ in Q2 vs. 1.9% expected and 5.1% last while the Export Price Index rose by 10.1% in the reported period, missing estimates of 19.7% and 18% prior.
Earlier on, Bloomberg reported that “Australia downgraded its economic growth outlook by a half-percentage point for this fiscal year and next due to accelerating inflation, higher interest rates and a slowing global economy.”
Market reaction
In an initial reaction to the data, AUD/USD kept its range just shy of the 0.7000 mark. The pair was last seen trading at 0.6992, almost unchanged on the day.
Why AustralianRetail Sales matter to traders?
The primary gauge of Australia’s consumer spending, the Retail Sales, is released by the Australian Bureau of Statistics (ABS) about 35 days after the month ends. It accounts for approximately 80% of total retail turnover in the country and, therefore, has a significant bearing on inflation and GDP. This leading indicator has a direct correlation with inflation and growth prospects, impacting the Reserve Bank of Australia’s (RBA) interest rates decision and AUD valuation. The stats bureau uses the forward factor method, ensuring that the seasonal factors are not distorted by COVID-19 impacts.
- USD/CHF remains pressured near three-week low as sellers poke the key support line.
- Bearish MACD signals, successful trading below 100-DMA favor sellers.
- Convergence of the 21-DMA, 50-DMA adds to the upside filters.
USD/CHF sellers jostle with a crucial support line from March while printing a 0.9590 figure during Thursday’s Asian session. In doing so, the Swiss currency (CHF) pair keeps the post-Fed losses around the lowest levels since July 04.
With this, the USD/CHF pair also holds the previous day’s downside break of the 100-DMA amid bearish MACD signals, which in turn keeps sellers hopeful of conquering the key support around 0.8590-85.
Following the clear downside break of 0.8585, the pair bears can aim for the lows marked in May and June, respectively around 0.9545 and 0.9495.
Alternatively, recovery moves need validation from the 100-DMA level of 0.9615 to lure intraday buyers of the USD/CHF pair.
Even so, the 21-DMA and the 50-DMA could challenge the bulls around 0.9690-95. Also acting as an upside filter is the 0.9700 threshold.
In a case where the USD/CHF prices stay firmer past 0.9700, the monthly high of 0.9885 will be in focus.
Overall, USD/CHF is ready to extend the Fed-led losses but waits for the US Q2 Gross Domestic Product (GDP) Annualized, expected 0.4% versus -1.6% prior.
USD/CHF: Daily chart
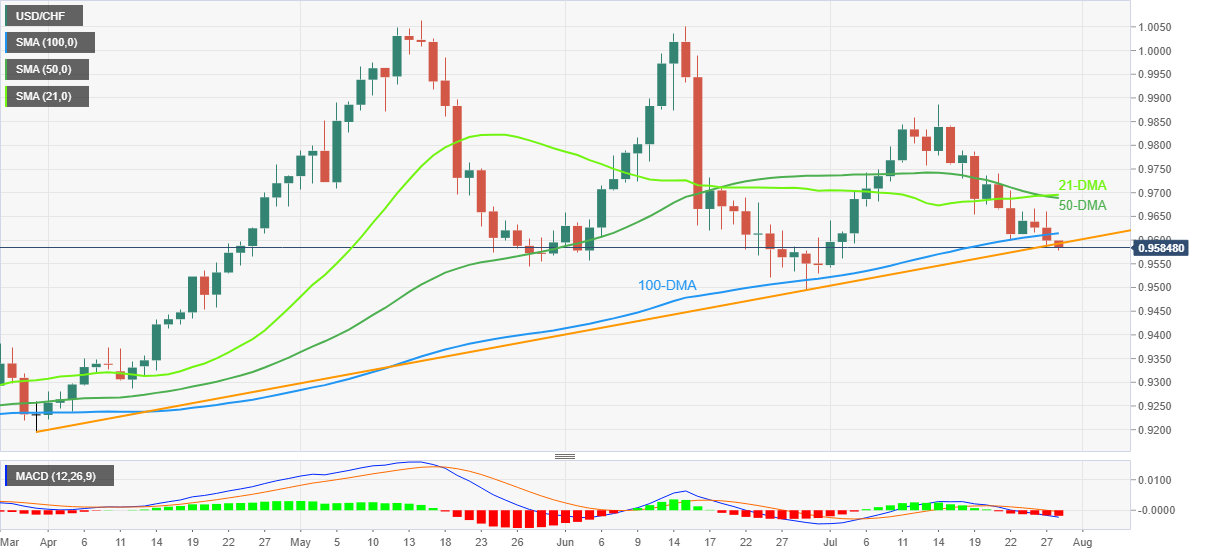
Trend: Further weakness expected
The People’s Bank of China (PBOC) set the yuan (CNY) reference rate at 6.7411 versus the previous release of 6.7731, while crossing the market expectations of 6.7425 during Thursday's Asian session. It should be noted that the USD/CNY closed at 6.7570 the previous day.
About the fix
China maintains strict control of the yuan’s rate on the mainland.
The onshore yuan (CNY) differs from the offshore one (CNH) in trading restrictions, this last one is not as tightly controlled.
Each morning, the People’s Bank of China (PBOC) sets a so-called daily midpoint fix, based on the yuan’s previous day closing level and quotations taken from the inter-bank dealer.
- Oil prices will remain sideways on symmetrical triangle formation.
- Investors should brace for a volatility contraction, which will be followed by an expansion in the same.
- A move above 60.00 by the RSI (14) has underpinned bulls.
West Texas Intermediate (WTI), futures on NYMEX, has slipped below the immediate support of $97.00 after facing barricades while attempting to recapture a weekly high at $98.24. The black gold has displayed a confined range for the whole week amid the unavailability of a potential trigger.
Oil prices are auctioning in a Symmetrical Triangle chart pattern that indicates a squeeze in the volatility, which is followed by a breakout in the same. The upward sloping trendline of the above-mentioned chart pattern is placed from July 14 low at $88.34 while the downward sloping trendline is plotted from June 21 high at $100.30.
The 20-and 50-period Exponential Moving Average (EMA) at around $96.00 are overlapping on each other, which signals an ongoing consolidation in the asset.
However, the Relative Strength Index (RSI) (14) has crossed 60.00, which signals that the oil bulls have an upper hand.
A decisive break above Wednesday’s high at $97.86 will trigger the symmetrical triangle breakout and will activate oil bulls for an upside towards the psychological resistance at $100.00, followed by July 8 high at $102.77.
Alternatively, bears could gain control if the asset drops below Wednesday’s low at $93.33. An occurrence of the same will drag the asset towards July 12 low and July 14 low at $91.70 and $88.34 respectively.
WTI hourly chart
-637945666866870996.png)
- Gold buyers struggle to extend post-Fed rally amid recession fears, pre-data caution.
- Fed matched market’s forecasts of 0.75% rate hike, Chairman Powell favored XAU/USD bulls.
- US Treasury yield inversion keeps recession fears on the table, highlights flash readings of US Q2 GDP.
Gold price (XAU/USD) fades the Fed-inspired rally as the metal seesaws around $1,735 during Thursday’s Asian session. That said, the bullion prices rallied the most in one week to refresh a fortnight high on the US Federal Reserve’s (Fed) showdown. However, fears of economic slowdown and market anxiety ahead of the key US data seem to probe the XAU/USD bulls of late.
Despite retreating, the US Treasury yield curve continues to signal the recession fears and weigh on the gold price at the latest. Reuters mentioned that the US government bond market is sending a fresh batch of signals that investors are increasingly convinced the Federal Reserve's aggressive actions to tame inflation will result in recession. “Some of those moves reversed slightly on Wednesday, with rates at the short end of the curve turning lower on expectations of the Fed being less likely to continue with super-sized hikes,” adds Reuters.
It should be noted that the US 10-year Treasury yields dropped nearly four basis points (bps) to 2.78% while the 2-year bond coupons slumped by 2.58% to 2.98% after the Fed’s 0.75% rate hike. Even so, the gap between the key US bond coupons remains the widest since 2000 and in turn hints at the US recession woes.
Further, the market’s cautious mood ahead of the virtual talks between US President Joe Biden and his Chinese counterpart Xi Jinping seems to challenge the gold buyers. On the same line is the anxiety before the flash readings of the US Q2 Gross Domestic Product (GDP) Annualized, expected 0.4% versus -1.6% prior.
Also read: US GDP Preview: Win-win for the dollar? Economy's flirt with recession to boost the buck
On Wednesday, the US Federal Reserve (Fed) matched market forecasts by announcing a 75-bps rate increase. The underlying reason for the pair’s weakness could be attributed to Fed Chairman Jerome Powell’s speech as it signaled that the hawks are running out of fuel. Key comments from the Fed’s Powell were that the rates had reached neutrality, so there won't be any more forward guidance, as well as rates will be decided meeting by meeting.
It should be noted that the mixed data and recent risk-off mood also seem to challenge the XAU/USD bulls. Talking about the data, US Durable Goods Orders rose by 1.9% MoM versus expectations of -0.4% and the revised prior of 0.8%. Further, the Nondefense Capital Goods Orders excluding Aircraft also increased by 0.5% compared to 0.2% market consensus and 0.6% prior. Additionally, the US Pending Home Sales dropped by 8.6% MoM in June, compared to the market expectation for a decrease of 2% and following May's growth of 0.4%.
While portraying the mood, the S&P 500 Futures drop 0.15% intraday at the latest while the Asia-Pacific markets traded mixed during the initial hours of Thursday even if Wall Street benchmarks closed positive. That said, the US 10-year Treasury yields pares recent losses around 2.78% by the press time.
Technical analysis
Gold price remains firmer around a two-week top as bulls jostle with the 21-DMA resistance near $1,740. Keeping the buyers hopeful are the MACD signals and the metal’s sustained trading beyond the 10-DMA, as well as the weekly support line.
That said, XAU/USD upside past $1,740 could aim for the downward sloping resistance line from June 13, close to $1,750 by the press time.
However, the metal’s successful run-up beyond $1,750 enables gold buyers to aim for the $1,800 threshold before rushing towards the mid-June swing low near $1,805.
Alternatively, pullback remains elusive beyond $1,718, comprising the 10-DMA and one-week-old ascending trend line.
Following that, the $1,697 could act as the last defense fur buyers before directing XAU/USD bears towards the yearly low of $1,680.
Gold: Daily chart
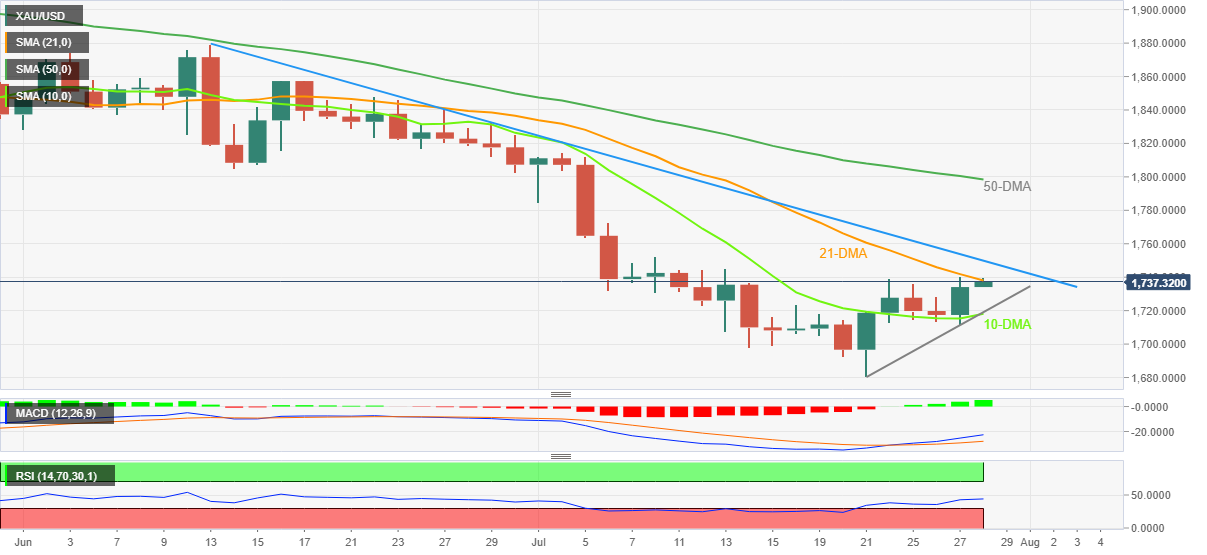
Trend: Limited upside expected
| Index | Change, points | Closed | Change, % |
|---|---|---|---|
| NIKKEI 225 | 83.87 | 27715.75 | 0.3 |
| Hang Seng | -235.84 | 20670.04 | -1.13 |
| KOSPI | 2.57 | 2415.53 | 0.11 |
| ASX 200 | 15.9 | 6823.2 | 0.23 |
| FTSE 100 | 41.93 | 7348.23 | 0.57 |
| DAX | 69.45 | 13166.38 | 0.53 |
| CAC 40 | 46.49 | 6257.94 | 0.75 |
| Dow Jones | 436.05 | 32197.59 | 1.37 |
| S&P 500 | 102.56 | 4023.61 | 2.62 |
| NASDAQ Composite | 469.85 | 12032.42 | 4.06 |
- AUD/NZD has printed a fresh four-year high at 1.1176, empowered by a three-day winning streak.
- As per the market consensus, Australian Retail Sales are seen lower at 0.5%.
- The New Zealand Business Confidence data is expected to improve to -55.
The AUD/NZD pair has recorded a fresh four-year high at 1.1176 in the early Tokyo session despite the lower consensus for Australian Retail Sales, which will release on Thursday. The cross has displayed a juggernaut rally after surpassing the psychological resistance of 1.1100. The pair continued its three-day winning streak on Thursday and more gains seem possible ahead.
A preliminary estimate for the Australian Retail Sales is 0.5%, lower than the prior release of 0.9% on a monthly basis. It is worth noting that price pressures have remained higher in the Australian economy. The Australian Bureau of Statistics, on Wednesday, reported the inflation rate for Q2CY22 at 6.1%. The investing community is aware of the fact that higher energy bills and costly food products have resulted in higher payouts for households.
Therefore, the Retail Sales data should have soared dramatically but lower estimates for the economic data indicate that the overall demand from the retail participants has remained extremely lower. An occurrence of the same could push aussie on the back foot.
On the kiwi front, the release of the Business Confidence data holds significant importance. The economic data is expected to improve to -55 against the prior release of -62.6. An improvement in the above-mentioned data indicates that corporate is enjoying the available business conditions in the economy. Also, it empowers the companies to invest vigorously.
Retail Sales Overview
Early Thursday, the market sees preliminary readings of Australia's seasonally adjusted Retail Sales for June month at 01:30 GMT. Market consensus suggests a downbeat MoM print of 0.5% versus 0.9% prior readings, suggesting the lack of sustained improvement in economic activity after posting the softer outcome in May.
Given the recently mixed Aussie data and downbeat economic forecasts from Aussie Treasurer Jim Chalmers challenging the Reserve Bank of Australia’s (RBA) hawkish bias, today’s Aussie Retail Sales appear the key for the AUD/USD traders.
It’s worth noting that the Australian Bureau of Statistics (ABS) is also up for releasing the second-quarter (Q2) Export Price Index and Import Price Index at the aforementioned time, which in turn increases the importance of Thursday’s economic calendar for the pair traders.
Ahead of the data, Westpac said,
Australian credit and debit card data suggest retail sales should post a solid gain in June, concealing the backdrop of weakening confidence (Westpac f/c 0.6%). A strong lift in export prices is anticipated in Q2 given the strength of commodity prices (Westpac f/c: 8.0%), while a higher AUD likely tempered the lift in import prices from global energy inflation (Westpac f/c: 2.0%).
How could it affect AUD/USD?
AUD/USD dribbles around the six-week high near 0.7000, struggling to extend the post-Fed rally, as traders await Australia’s Q2 Import Price Index and Retail Sales for June during Thursday’s Asian session. In doing so, the Aussie pair traders also justify the market’s cautious mood amid fears of US recession, as well as recently released downbeat economic forecast updates from Australia.
That said, Australia’s seasonally adjusted Retail Sales for June is expected to ease to 0.5% versus 0.9% prior, which in turn supports Australian Treasury’s downbeat economic predictions and can probe the RBA hawks. The same could also trigger the AUD/USD pair’s pullback if Australia’s Q2 readings of the Export Price Index and Import Price Index came in softer than market forecasts of 19.7% and 1.9% in that order.
It’s worth noting that the softer-than-expected Aussie Q2 Consumer Price Index (CPI) has already teased AUD/USD sellers but failed due to the Fed-led rally. Hence, today’s Aussie data may clarify the near-term pair moves ahead of the US Q2 Gross Domestic Product (GDP) Annualized.
Technically, a successful upside break of the previous resistance line from April and the 50-DMA, as well as the bullish MACD signals, hint at the AUD/USD pair’s further upside. That said, the 38.2% Fibonacci retracement of the April-July downside, also nearing the mid-June swing high around 0.7070, appears to be the immediate resistance for the pair. Alternatively, pullback moves may initially aim for the 50-DMA level of 0.6972 before testing the previous resistance line near 0.6930.
Key Notes
AUD/USD Price Analysis: Stays on the way to 0.7070 hurdle
AUD/USD steadies near six-week top around 0.7000 ahead of Aussie Retail Sales, US GDP
About Australian Retail Sales
The Retail Sales released by the Australian Bureau of Statistics is a survey of goods sold by retailers is based on a sampling of retail stores of different types and sizes and it''s considered as an indicator of the pace of the Australian economy. It shows the performance of the retail sector over the short and mid-term. Positive economic growth anticipates bullish trends for the AUD, while a low reading is seen as negative or bearish.
| Pare | Closed | Change, % |
|---|---|---|
| AUDUSD | 0.69911 | 0.72 |
| EURJPY | 139.305 | 0.54 |
| EURUSD | 1.01999 | 0.79 |
| GBPJPY | 165.989 | 0.77 |
| GBPUSD | 1.21553 | 1.03 |
| NZDUSD | 0.62633 | 0.48 |
| USDCAD | 1.28249 | -0.43 |
| USDCHF | 0.95901 | -0.39 |
| USDJPY | 136.562 | -0.25 |
- US dollar pressured by dovish Fed outcome but remains in a bullish cycle.
- The bulls need to break 107.40 DXY to gain control again.
The US dollar is pinned to the ground following the latest economic update from the Federal Reserve that raised rates by just 75bps in a decision that the FOMC unanimously decided upon, increasing the target range for the federal funds rate to 2.25-2.50%.
The FOMC statement downgraded its assessment of the economic situation and admitted that “recent indicators of spending and production have softened”. This immediately pressured the greenback and took a little while longer to within rates in the 2 and 10year yields. The statement repeated that job gains have been robust in recent months and the unemployment rate has remained low. However, Fed's chairman Jerome Powell conceded that the labour market would likely moderate in time.
ish outcome for the September meeting as the Fed turns data-dependent. The Fed's chairman's presser concluded in recent trade and following a cautiously optimistic tone over the US economy, with Jerome Powell warning of a softer labour market, the US dollar was down to the lows of the day at 106.279, losing 0.86% as per the DXY index.
Fed Powell key takeaways
-
Powell speech: We want to get to 3% to 3.5% by end-2022
-
Powell speech: Time to go to a meeting-by-meeting basis
-
Powell speech: Another unusually large increase could be appropriate at next meeting
-
Powell speech: Labor market is extremely tight
-
Powell speech: Growth in consumer spending has slowed significantly
-
Powell speech: Another unusually large increase could be appropriate at next meeting
- Powell speech: Time to go to a meeting-by-meeting basis
-
Powell speech: We want to get to 3% to 3.5% by end-2022
-
Powell speech: Want to see demand running below potential for sustained period
- Powell speech: Balance sheet reduction will be picking up steam
- Powell speech: Households are in very strong shape
At the press conference, Powell said he does not think the US is currently in recession and the Fed tends to take the advanced growth reports with a grain of salt.
The door has been left open for 25, 50, 75 or 100 bps in September from a now data-dependent Fed.
DXY 4-hour chart
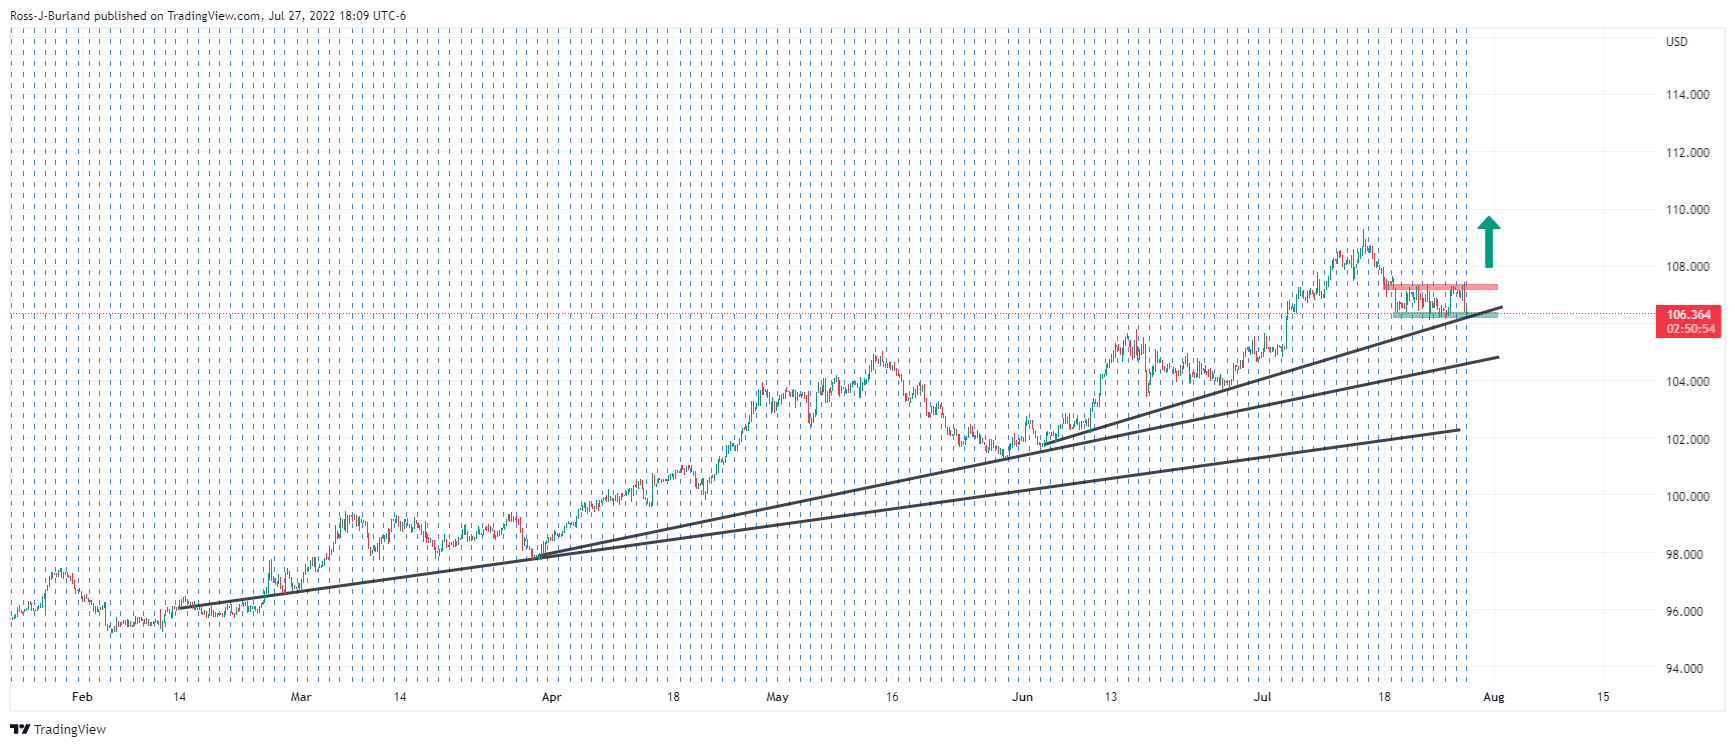
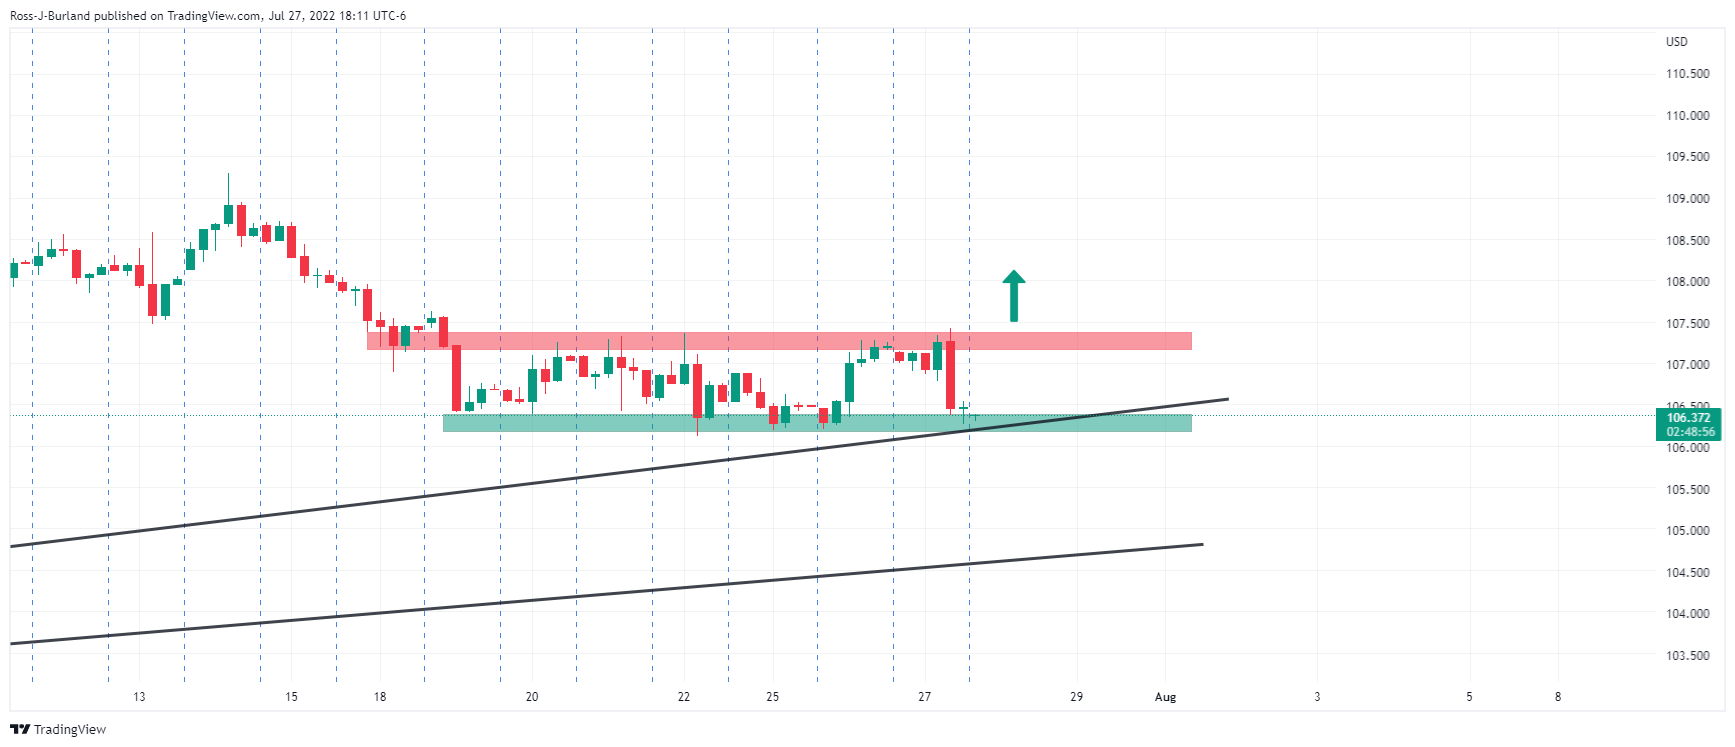
Bulls need to break 107.40 to gau back control in an otherwise bullisj trajectory.
- EUR/USD grinds higher after posting the biggest daily gains in over a week.
- Fears of economic slowdown challenges post Fed optimism.
- Flash readings of US Q2 GDP will be important ahead of Eurozone GDP announcements.
- Chatters surrounding European gas crisis, German inflation shouldn’t be ignored as well.
EUR/USD bulls seem taking a breather around 1.0200 after the Fed-led rally. In doing so, the major currency pair struggles to keep the pair’s bullish bias during Thursday’s Asian session.
The fears of the US economic slowdown, as portrayed by the US Treasury yield curve, appear to recently challenge the market’s optimism. Reuters mentioned that the US government bond market is sending a fresh batch of signals that investors are increasingly convinced the Federal Reserve's aggressive actions to tame inflation will result in recession. “Some of those moves reversed slightly on Wednesday, with rates at the short end of the curve turning lower on expectations of the Fed being less likely to continue with super-sized hikes,” adds Reuters.
It should be noted that the US 10-year Treasury yields dropped nearly four basis points (bps) to 2.78% while the 2-year bond coupons slumped by 2.58% to 2.98% after the Fed’s 0.75% rate hike. Even so, the gap between the key US bond coupons remains the widest since 2000 and in turn hints at the US recession woes.
That said, the US Federal Reserve (Fed) matched market forecasts by announcing a 75-bps rate increase. The underlying reason for the pair’s weakness could be attributed to Fed Chairman Jerome Powell’s speech as it signaled that the hawks are running out of fuel. Key comments from the Fed’s Powell were that the rates had reached neutrality, so there won't be any more forward guidance, as well as rates will be decided meeting by meeting.
Elsewhere, optimism about the bloc’s capacity to gain energy supplies outside Russia, despite signals of further hardships for the old continent due to the further deterioration in the gas supplies via the key pipeline from Russia, also seemed to have favored the EUR.
Talking about data, US Durable Goods Orders rose by 1.9% MoM versus expectations of -0.4% and the revised prior of 0.8%. Further, the Nondefense Capital Goods Orders excluding Aircraft also increased by 0.5% compared to 0.2% market consensus and 0.6% prior. Additionally, the US Pending Home Sales dropped by 8.6% MoM in June, compared to the market expectation for a decrease of 2% and following May's growth of 0.4%.
Amid these plays, the S&P 500 Futures drop 0.10% intraday at the latest while the Asia-Pacific markets traded mixed during the initial hours of trading.
To sum up, EUR/USD prices struggle to extend the post-Fed gains as traders await Germany’s key inflation data, namely Harmonized Index of Consumer Prices (HICP) for July, as well as the US Q2 Gross Domestic Product (GDP) Annualized, expected 0.4% versus -1.6% prior. If the data signals more reflation woes and softer US GDP growth, the major currency pair could witness a pullback.
Also read: US GDP Preview: Win-win for the dollar? Economy's flirt with recession to boost the buck
Technical analysis
EUR/USD bulls need successful trading beyond the previous weekly top surrounding 1.0280 to keep reins. However, sellers may not risk the entry until witnessing a clear downside break of the 21-DMA, near 1.1960 at the latest.


© 2000-2026. All rights reserved.
This site is managed by Teletrade D.J. LLC 2351 LLC 2022 (Euro House, Richmond Hill Road, Kingstown, VC0100, St. Vincent and the Grenadines).
The information on this website is for informational purposes only and does not constitute any investment advice.
The company does not serve or provide services to customers who are residents of the US, Canada, Iran, The Democratic People's Republic of Korea, Yemen and FATF blacklisted countries.
Making transactions on financial markets with marginal financial instruments opens up wide possibilities and allows investors who are willing to take risks to earn high profits, carrying a potentially high risk of losses at the same time. Therefore you should responsibly approach the issue of choosing the appropriate investment strategy, taking the available resources into account, before starting trading.
Use of the information: full or partial use of materials from this website must always be referenced to TeleTrade as the source of information. Use of the materials on the Internet must be accompanied by a hyperlink to teletrade.org. Automatic import of materials and information from this website is prohibited.
Please contact our PR department if you have any questions or need assistance at pr@teletrade.global.
transfers