- Analytics
- News and Tools
- Market News
CFD Markets News and Forecasts — 04-08-2021
| Time | Country | Event | Period | Previous value | Forecast |
|---|---|---|---|---|---|
| 01:30 (GMT) | Australia | Trade Balance | June | 9.681 | 10.45 |
| 06:00 (GMT) | Germany | Factory Orders s.a. (MoM) | June | -3.7% | 1.5% |
| 06:45 (GMT) | France | Industrial Production, m/m | June | -0.3% | 0.6% |
| 08:00 (GMT) | Eurozone | ECB Economic Bulletin | |||
| 08:30 (GMT) | United Kingdom | PMI Construction | July | 66.3 | 64 |
| 11:00 (GMT) | United Kingdom | Asset Purchase Facility | 875 | 875 | |
| 11:00 (GMT) | United Kingdom | BoE Interest Rate Decision | 0.1% | 0.1% | |
| 11:00 (GMT) | United Kingdom | Bank of England Minutes | |||
| 12:30 (GMT) | U.S. | Continuing Jobless Claims | July | 3269 | 3260 |
| 12:30 (GMT) | U.S. | Initial Jobless Claims | July | 400 | 384 |
| 12:30 (GMT) | Canada | Trade balance, billions | June | -1.39 | -0.8 |
| 12:30 (GMT) | U.S. | International Trade, bln | June | -71.2 | -73.9 |
| 22:30 (GMT) | Australia | AIG Services Index | July | 57.8 | |
| 23:00 (GMT) | Australia | RBA's Governor Philip Lowe Speaks | |||
| 23:30 (GMT) | Japan | Labor Cash Earnings, YoY | June | 1.9% | |
| 23:30 (GMT) | Japan | Household spending Y/Y | June | 11.6% | 0.1% |
- Says he believes that necessary conditions for raising the target range for the federal funds rate will have been met by year-end 2022, if his outlook for inflation and outlook for unemployment realized [the necessary conditions are that "labor market conditions have reached levels consistent with FOMC's assessments of maximum employment and inflation has risen to 2% and is on track to moderately exceed 2% for some time]
- Commencing policy normalization in 2023 would, under these conditions, be entirely consistent with our new flexible average inflation targeting framework
- Says his projections for headline and core PCE inflation are also similar to those provided in Fed's most recent Summary of Economic Projections (SEP)
- If, as projected, core PCE inflation this year does come in at, or certainly above, 3%, I will consider that much more than a "moderate" overshoot of our 2% longer-run inflation objective
- I believe that the risks to my outlook for inflation are to the upside
- Under present circumstances, support from fiscal policy in tandem with appropriate monetary policy can fully offset the constraint of effective lower bound
- FOMC is rightly basing its judgments on outcomes, not just the outlook. Looking ahead, our policy decisions will continue to depend on data in hand at the time, along with their implications for outlook and associated risks
- In coming meetings, FOMC will again assess the economy's progress toward our goals. As we have said, we will provide advance notice before making any changes to our purchases
- Says he can certainly see Fed announcing tapering later this year
- Would support announcing a moderation in asset purchases later this year
The
U.S. Energy Information Administration (EIA) reported on Wednesday that crude
inventories rose by 3.626 million barrels in the week ended July 30, following
a decline of 4.089 million barrels in the previous week. Economists had
forecast a draw of 3.102 million barrels.
At
the same time, gasoline stocks dropped by 5.292 million barrels, while analysts
had expected a fall of 1.780 million barrels. Distillate stocks grew by 0.833
million barrels, while analysts had forecast a draw of 0.543 million barrels.
Meanwhile, oil production in the U.S. remained unchanged at 11.200 million barrels a day.
U.S.
crude oil imports averaged 6.4 million barrels per day last week, down by
75,000 barrels per day from the previous week.
The
Institute for Supply Management (ISM) reported on Wednesday that its
non-manufacturing index (NMI) came in at 64.1 in July, which was 4.0 percentage
points higher than unrevised June’s reading of 60.1 percent. The latest reading pointed to the
growth in the services sector for the 14th straight month, which was also the fastest
on record.
Economists
forecast the index to increase to 60.5 last month. A reading above 50 signals
expansion, while a reading below 50 indicates contraction.
Of
the 18 services industries, 17 reported gains last month, the ISM said, even
though challenges with materials shortages, inflation, logistics and constrained
labor pool continued to be an issue.
According
to the report, the ISM’s non-manufacturing Production measure rose 6.6
percentage points to 67.0 percent from the June reading, while its New Orders
gauge increased 1.6 percentage points to 63.7 percent and the Employment
indicator went up 4.5 percentage points to 53.8 percent. Elsewhere, the Supplier
Deliveries index advanced 3.5 percentage points to 72.0 percent, while the
Inventories indicator decreased 0.7 percentage point to 49.2 percent. On the
price front, the Prices index increased 2.8 percentage points to 82.3 percent, recording
its second-highest reading ever, behind September 2005.
Commenting
on the data, the Chair of the ISM Services Business Survey Committee, Anthony
Nieves, noted, “The past relationship between the Services PMI and the overall
economy indicates that the Services PM for July (64.1 percent) corresponds to a
5.2-percent increase in real gross domestic product (GDP) on an annualized
basis.”
The
latest report by IHS Markit revealed on Wednesday the seasonally adjusted final
IHS Markit U.S. Services Business Activity Index (PMI) stood at 59.9 in July, down
from 64.6 in June but slightly above the earlier released “flash” estimate of
59.8. The latest reading pointed to the slowest growth in business activity
across the U.S. service sector since February.
Economists
had forecast the index to stay unrevised at 59.8.
According
to the report, a softer rise in new business was a major contributor
to the less marked upturn in output in July. Nonetheless, domestic and foreign client
demand remained historically strong. Backlogs of work increased solidly and at the
joint-fastest pace since August 2020. Meanwhile, employment eased for the third
month running, as firms faced challenges in finding staff. On the price front, input
prices increased due to supplier shortages, while service firms also
highlighted greater fuel costs. The rate of inflation was much faster than the
series average, despite easing further from May's historic peak.
- Notes that the last time we had a run-up in Covid cases in December and January, it did not impact the economy as much as predicted
- U.S. firms and consumers have found ways to work, produce and consume while the pandemic is still going on
- There have been some pretty good macroeconomic outcomes despite the pandemic
- For people in high physical contact jobs, there is still some hesitancy to go back to work because of the pandemic
- We've had a major inflationary shock
- Thinks inflation is going to be more persistent than some people expect
- Sees inflation of 2.5% to 3% in 2022
- Thinks inflation will come down but not as low as some people want
- Does not think there will be a taper tantrum in the markets
- Markets are well prepared for taper
- Labor markets are improving
- Believes Fed should taper more quickly so it can be prepared to react with rates in 2022
- Says he is moderately concerned about the housing market
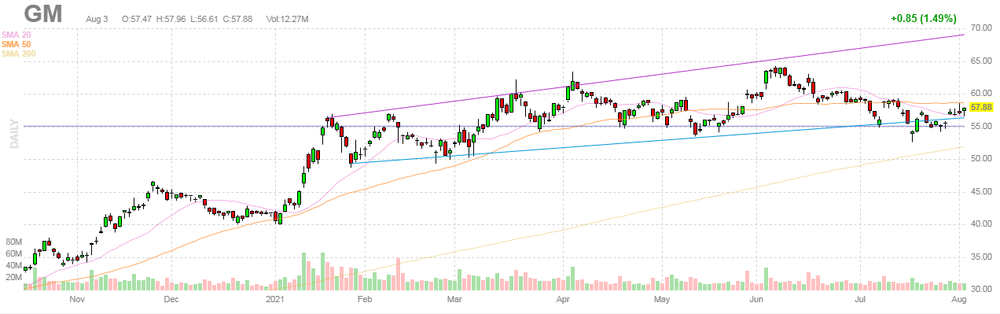
U.S. stock-index futures dropped on Wednesday, as investors digested the Q2 earnings report from the U.S. largest car manufacturer General Motors (GM; -3.9%) and weaker-than-expected private-sector jobs report from ADP.
Global Stocks:
Index/commodity | Last | Today's Change, points | Today's Change, % |
Nikkei | 27,584.08 | -57.75 | -0.21% |
Hang Seng | 26,426.55 | +231.73 | +0.88% |
Shanghai | 3,477.22 | +29.23 | +0.85% |
S&P/ASX | 7,503.20 | +28.70 | +0.38% |
FTSE | 7,121.96 | +16.24 | +0.23% |
CAC | 6,742.22 | +18.41 | +0.27% |
DAX | 15,639.92 | +84.84 | +0.55% |
Crude oil | $69.30 | -1.79% | |
Gold | $1,828.10 | +0.77% |
FXStreet notes that S&P 500 is expected to see a deeper push into the zone at 4436/56. Nevertheless, economists at Credit Suisse continue to look to not chase strength through here for now and look for a “summer consolidation/correction” to emerge.
“Weakness has yet again been contained by high-level support from the recent low, the price gap from last Friday morning and 13-day exponential average at 4381/64. This keeps the immediate risk higher for a more concerted push into our Q3 objective zone at 4436/56, also trend resistance from April.”
“Whilst we continue to view the core trend as bullish, our bias remains not to chase strength through here for now and for a ‘summer consolidation/correction’ to emerge. We have to acknowledge though the strong underlying momentum and a close above 4456 would see the immediate risk stay higher for a move to the psychological 4500 level next.”
“Near-term support moves to 4410, then 4398, with key still the 4386/64 zone."
(company / ticker / price / change ($/%) / volume)
3M Co | MMM | 200.2 | -0.83(-0.41%) | 473 |
ALCOA INC. | AA | 40.02 | -0.36(-0.89%) | 17659 |
ALTRIA GROUP INC. | MO | 47.73 | -0.06(-0.13%) | 19493 |
Amazon.com Inc., NASDAQ | AMZN | 3,369.38 | 3.14(0.09%) | 24443 |
American Express Co | AXP | 167.5 | -1.54(-0.91%) | 9014 |
AMERICAN INTERNATIONAL GROUP | AIG | 47.38 | -0.36(-0.75%) | 1534 |
Apple Inc. | AAPL | 147.27 | -0.09(-0.06%) | 1749276 |
AT&T Inc | T | 28.14 | -0.05(-0.18%) | 24477 |
Boeing Co | BA | 227.05 | -2.04(-0.89%) | 29105 |
Caterpillar Inc | CAT | 207.25 | -1.25(-0.60%) | 6014 |
Chevron Corp | CVX | 101.58 | -1.02(-0.99%) | 13668 |
Cisco Systems Inc | CSCO | 56.18 | -0.07(-0.12%) | 11953 |
Citigroup Inc., NYSE | C | 68.23 | -0.65(-0.94%) | 50916 |
Deere & Company, NYSE | DE | 363 | -2.86(-0.78%) | 689 |
E. I. du Pont de Nemours and Co | DD | 74.01 | -0.38(-0.51%) | 1736 |
Exxon Mobil Corp | XOM | 57.71 | -0.49(-0.84%) | 88119 |
Facebook, Inc. | FB | 351.53 | 0.29(0.08%) | 40713 |
FedEx Corporation, NYSE | FDX | 280.29 | -0.52(-0.18%) | 1171 |
Ford Motor Co. | F | 13.85 | -0.17(-1.21%) | 665177 |
Freeport-McMoRan Copper & Gold Inc., NYSE | FCX | 36 | -0.64(-1.75%) | 35024 |
General Electric Co | GE | 101.75 | -1.31(-1.27%) | 15959 |
General Motors Company, NYSE | GM | 55.75 | -2.13(-3.68%) | 1411159 |
Goldman Sachs | GS | 378.42 | -1.94(-0.51%) | 4366 |
Google Inc. | GOOG | 2,720.00 | -5.60(-0.21%) | 1257 |
Hewlett-Packard Co. | HPQ | 29.48 | -0.05(-0.17%) | 25429 |
Home Depot Inc | HD | 331 | -0.94(-0.28%) | 1361 |
Intel Corp | INTC | 54.09 | 0.03(0.06%) | 31150 |
International Business Machines Co... | IBM | 143.52 | -0.55(-0.38%) | 3623 |
Johnson & Johnson | JNJ | 174.41 | 0.02(0.01%) | 2295 |
JPMorgan Chase and Co | JPM | 151.4 | -1.49(-0.97%) | 22853 |
McDonald's Corp | MCD | 237.2 | 0.25(0.11%) | 1547 |
Merck & Co Inc | MRK | 76.45 | 0.04(0.05%) | 5591 |
Microsoft Corp | MSFT | 286.52 | -0.60(-0.21%) | 37972 |
Nike | NKE | 170.75 | -0.48(-0.28%) | 12751 |
Pfizer Inc | PFE | 46.08 | 0.40(0.88%) | 612903 |
Procter & Gamble Co | PG | 143.78 | -0.17(-0.12%) | 2664 |
Starbucks Corporation, NASDAQ | SBUX | 118.5 | -0.63(-0.53%) | 8009 |
Tesla Motors, Inc., NASDAQ | TSLA | 710.53 | 0.79(0.11%) | 157111 |
The Coca-Cola Co | KO | 56.78 | -0.14(-0.25%) | 9384 |
Twitter, Inc., NYSE | TWTR | 68.6 | -0.03(-0.04%) | 11962 |
Verizon Communications Inc | VZ | 55.65 | -0.08(-0.14%) | 330680 |
Visa | V | 236.55 | -0.54(-0.23%) | 9660 |
Wal-Mart Stores Inc | WMT | 143.65 | -0.17(-0.12%) | 10129 |
Walt Disney Co | DIS | 172.51 | -0.48(-0.28%) | 17404 |
Yandex N.V., NASDAQ | YNDX | 67.42 | -0.10(-0.15%) | 823 |
Chevron (CVX) downgraded to Hold from Buy at DZ Bank; target $110
Statistics
Canada announced on Wednesday that the value of building permits issued by the
Canadian municipalities climbed 6.9 percent m-o-m in June, following a revised 12.9
percent m-o-m tumble in May (originally a plunge of 14.8 percent m-o-m).
Economists
had forecast a 5.5 percent increase in June from the previous month.
According
to the report, the value of residential permits jumped 9.1 percent m-o-m in June,
as single-family permits rose 4.7 percent m-o-m and permits for multi-family
dwellings surged 13.5 percent m-o-m.
At
the same time, the value of non-residential building permits went up 2.2
percent m-o-m in June, reflecting gains in commercial (+7.4 percent m-o-m) and industrial
(+2.3 percent m-o-m) permits, which were partially offset by
a decrease in institutional permits (-6.7 percent m-o-m).
In
y-o-y terms, building permits surged 24.1 percent in June.
The
employment report prepared by Automatic Data Processing Inc. (ADP) and Moody's
Analytics showed on Wednesday the U.S. private employers added only 330,000
jobs in July. This marked the smallest advance in private-sector employment
since February.
Economists
had expected an increase of 695,000.
The June
number saw a downward revision to 680,000 from the originally reported 692,000.
“The
labor market recovery continues to exhibit uneven progress, but progress
nonetheless. July payroll data reports a marked slowdown from the second
quarter pace in jobs growth,” noted Nela Richardson, chief economist, ADP. “For
the fifth straight month the leisure and hospitality sector is the fastest
growing industry, though gains have softened. The slowdown in the recovery has
also impacted companies of all sizes. Bottlenecks in hiring continue to hold
back stronger gains, particularly in light of new COVID-19 concerns tied to
viral variants. These barriers should ebb in coming months, with stronger
monthly gains ahead as a result."
General Motors (GM) reported Q2 FY 2021 earnings of $1.97 per share (versus -$0.50 per share in Q2 FY 2020), beating analysts’ consensus estimate of $1.85 per share.
The company’s quarterly revenues amounted to $34.200 bln (+103.8% y/y), beating analysts’ consensus estimate of $29.657 bln.
The company also raised its FY 2021 EPS guidance to $5.40-6.40 from $4.50-5.25 previously versus analysts’ consensus estimate of $6.90.
GM fell to $55.95 (-3.33%) in pre-market trading.
| Time | Country | Event | Period | Previous value | Forecast | Actual |
|---|---|---|---|---|---|---|
| 07:50 | France | Services PMI | July | 57.8 | 57.0 | 56.8 |
| 07:55 | Germany | Services PMI | July | 57.5 | 62.2 | 61.8 |
| 08:00 | Eurozone | Services PMI | July | 58.3 | 60.4 | 59.8 |
| 08:30 | United Kingdom | Purchasing Manager Index Services | July | 62.4 | 57.8 | 59.6 |
| 09:00 | Eurozone | Retail Sales (MoM) | June | 4.1% | 1.7% | 1.5% |
| 09:00 | Eurozone | Retail Sales (YoY) | June | 8.6% | 4.5% | 5% |
USD traded mixed and mostly little changed against other major currencies in the European session on Wednesday as investors waited for the U.S. job market reports, hoping to get hints on the Federal Reserve's outlook for its monetary policy.
The U.S. Dollar Index (DXY), measuring the U.S. currency's value relative to a basket of foreign currencies, edged down 0.02% to 92.06.
Automatic Data Processing Inc. (ADP) will release its employment report today at 12:15 GMT. This report serves as a precursor to the official U.S. key jobs report that is usually published on the first Friday of every month. Economists expect that ADP’s report will show that the U.S. private sector added 695,000 jobs in July. A higher-than-expected reading could add to speculation that Friday's employment may heighten pressure on the Fed to advance the timeline for tapering of its $120 billion in monthly bond purchases.
The official July employment report is expected to show that 880,000 new jobs were added in the U.S. last month, following an 850,000 payroll gain in June.
FXStreet notes that the Brent crude oil rally has stalled again, with weekly momentum deteriorating sharply. Nonetheless, strategists at Credit Suisse expect the black gold to eventually resume its rise to test the $77.84 at first.
“The deterioration in weekly RSI momentum is now of growing concern, but our bias remains to view consolidation as a temporary pause ahead of an eventual break higher.”
“A quick move back above $76.38 though is needed to stabilize the market for a test of the $77.84 high. Beyond here can curtail thoughts of a more prolonged correction with resistance seen next at our original bull ‘flag’ target at $79.10, then the ‘measured triangle objective’ at $82.50.”
“Below $71.74 would see bearish pressure start to increase further in line with the momentum picture for a test of the $68.3/67.44 recent low and trend support. Removal of here would warn of a more serious break lower, for a move to $64.57 next, with scope for the 200-day average at $61.65.”
The
Mortgage Bankers Association (MBA) reported on Wednesday the mortgage
application volume in the U.S. fell 1.7 percent in the week ended July 30,
following a 5.7 percent surge in the previous week.
According
to the report, refinance applications dropped 1.7 percent, while applications
to purchase a home also declined 1.7 percent.
Meanwhile,
the average fixed 30-year mortgage rate decreased from 3.01 percent to 2.97
percent, the lowest level since the first week of February 2021.
“Interest
rates drifted lower globally last week, as markets assessed the latest concerns
regarding the delta variant,” noted MBA Senior Vice President and
Chief Economist Mike Fratantoni. “30-year mortgage rates dropped below 3
percent in our survey for the first time since this February, presenting an
opportunity for many homeowners who have not yet refinanced to lower their rate
and their payments”.
FXStreet reports that economists at ANZ Bank believe gold price (XAU/USD) could see another leg up as key factors are turning in favour of gold investments. Record low US real-yield, inflation, expensive equity valuation and a weaker dollar are likely to encourage strategic allocation in the yellow metal.
“Record low yield again turning in favour of non-yielding gold investment.”
“Weakness should continue to be a key support for investor demand.”
“Inflation and weaker USD are supporting central bank gold purchases. Meanwhile, physical demand in India should recover ahead of the festive season.”
“Fading likelihood of monetary tightening looks supportive in the near-term.”
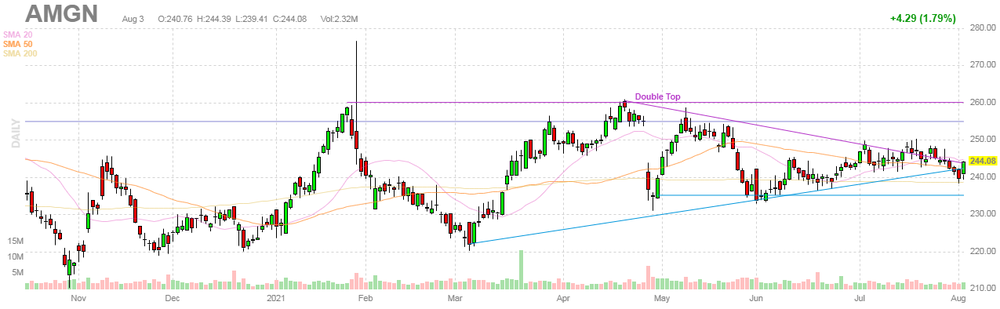
Amgen (AMGN) reported Q2 FY 2021 earnings of $4.38 per share (versus $4.25 per share in Q2 FY 2020), beating analysts’ consensus estimate of $4.01 per share.
The company’s quarterly revenues amounted to $6.526 bln (+5.2% y/y), beating analysts’ consensus estimate of $6.451 bln.
AMGN closed Tuesday’s trading session at $244.08 (+1.79%).
FXStreet notes that the RBA’s hawkish surprise decision to move forward with tapering suggests that the bottom of the 0.7350-0.7730 Q3 target range of analysts at Credit Suisse for AUD/USD is a valid floor for the pair.
“Although we acknowledge that yesterday’s meeting represented a hawkish surprise, we are reluctant to outright favour AUD/USD upside. It is likely that dovish central bank risks will persist as long as the COVID-19 situation continues to deteriorate.”
“The RBA’s hawkish surprise suggests that the bottom of our 0.7350-0.7730 Q3 target range should represent a valid floor for the pair. The relatively tame reaction in the currency and in Australia’s sovereign yields likely emboldens the RBA to continue tapering.”
“We are unwilling to take on a more bullish approach given lingering risks of lockdown escalations.”
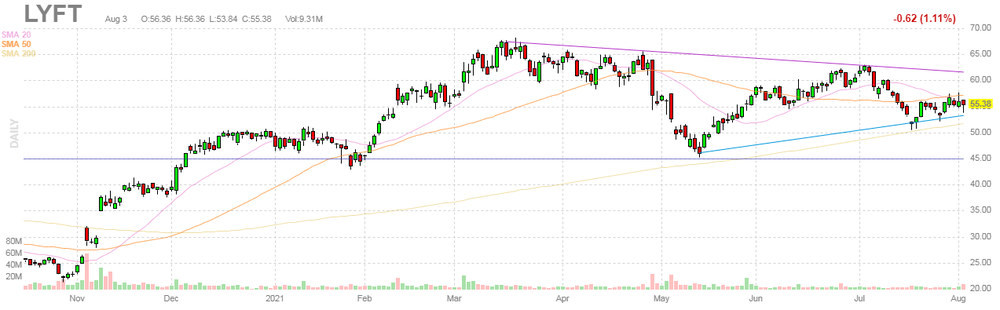
Lyft (LYFT) reported Q2 FY 2021 loss of $0.05 per share (versus -$0.86 per share in Q2 FY 2020), better than analysts’ consensus estimate of -$0.25 per share.
The company’s quarterly revenues amounted to $0.765 bln (+125.5% y/y), beating analysts’ consensus estimate of $0.700 bln.
The company also guided for Q3 FY 2021 revenues of $0.850-0.860 bln versus analysts’ consensus estimate of $0.869 bln.
LYFT rose to $55.94 (+1.01%) in pre-market trading.
FXStreet notes that the New Zealand dollar has continued to outperform following the release of the latest employment report from New Zealand. The report has helped lift the NZD/USD rate back above 0.7050. According to economists at MUFG Bank, the labour market report reinforces Reserve Bank of New Zealand (RBNZ) rate hike expectations.
“The latest employment report revealed that the unemployment rate fell much more sharply than expected by 0.6 point to 4.0% in Q2. It is now far below the RBNZ’s own unemployment rate forecast of 4.7% and is likely close to levels judged as consistent with full employment.”
“The tightening labour market which is being exacerbated by closed borders, and building wage pressure will trigger greater concern from the RBNZ. We now expect the RBNZ to begin raising rates this month and to follow up with at least one more rate hike later this year.”
“The domestic interest rate market is already pricing in that more hawkish scenario but the New Zealand dollar has failed to fully track the recent move higher in rates as spreads have moved sharply in its favour. Lingering concerns over the outlook for global growth have been weighing on commodity currencies more broadly even as global equity markets and commodity prices remain close to recent highs.”
FXStreet reports that Lisa Shalett, Chief Investment Officer, Wealth Management at Morgan Stanley explains why investors should not worry about slowing growth.
Economic growth is slowing but remains solid
“Recently, preliminary estimates for second-quarter gross GDP growth came in at 6.5%. We forecast third-quarter annualized GDP growth at 6.1%, expecting that supply-chain pressures will continue to resolve and fiscal spending prospects will turn up. Strong fundamentals also underpin this forecast".
Second-quarter corporate earnings have been excellent so far
“As of July 30, with 59% of S&P 500 companies having reported results, 88% of them have reported earnings that came in above analysts’ expectations, and 88% have reported a positive revenue surprise.”
The consumer remains strong
“US consumer confidence as measured by the Conference Board Consumer Confidence Index inched up slightly in July, to 129.1, the highest since February 2020.”
Bloomberg reports that according to Governing Council member Martins Kazaks, investors waiting for a heads-up from the European Central Bank on the future of pandemic bond-buying in September will probably be disappointed.
With nearly 600 billion euros left to spend and the program running at least through the end of March, it would be much too early for a decision on whether to extend or phase out purchases, Kazaks said.
“Given the uncertainty, given how much time is left, there is no need to decide on that,” said Kazaks. “We will discuss it, but at the moment it would still be premature.”
Policy makers have set up their September meeting -- when new forecasts will become available -- as a crucial session to scrutinize the euro-area economy and its prospects, and to start debating post-pandemic monetary stimulus.
Kazaks urged investors to be patient in expecting results on when or how emergency support will be unwound. The next scheduled opportunity for a decision after September would be the ECB’s meeting on Oct. 28.
According to the report from Eurostat, in June 2021, the seasonally adjusted volume of retail trade rose by 1.5% in the euro area and by 1.2% the EU, compared with May 2021. In May 2021, the retail trade volume increased by 4.1% in the euro area and by 4.2% in the EU. In June 2021 compared with June 2020, the calendar adjusted volume of retail trade increased by 5.0% in the euro area and by 5.3% in the EU.
In the euro area in June 2021, compared with May 2021, the volume of retail trade increased by 3.8% for automotive fuels and by 3.4% for non-food products, while it decreased by 1.5% for food, drinks and tobacco. In the EU the volume of retail trade increased by 3.6% for automotive fuels and by 2.6% for non-food products, while it decreased by 1.1% for food, drinks and tobacco.
In the euro area in June 2021, compared with June 2020, the volume of retail trade increased by 11.9% for automotive fuels, by 6.5% for non-food products and by 1.4% for food, drinks and tobacco. In the EU, the volume of retail trade increased by 11.5% for automotive fuels, by 7.1% for non-food products and by 1.7% for food, drinks and tobacco.
According to the report from IHS Markit/CIPS, UK service providers recorded an increase in business activity for the fifth month running during July, but the rate of growth was the weakest since March. Staff shortages and supply issues were a severe constraint on business capacity, which led to another strong rise in backlogs of work. Tight labour market conditions led to greater wage pressures across the service economy and this contributed to the fastest increase in overall input costs since the survey began in July 1996. Prices charged by service sector companies also rose at a survey-record pace.
At 59.6 in July, the headline seasonally adjusted UK Services PMI Business Activity Index posted above the crucial 50.0 no-change mark and was above the earlier 'flash' reading (57.8), but dropped from 62.4 in June. The index was the lowest since March and therefore signalled the slowest rate of expansion since the end of the winter lockdown. Staff shortages, supply chain issues and the end of the full stamp duty holiday for residential property sales were cited as factors leading to a slowdown since June.
A substantial loss of momentum was seen for new business growth during July, with this index the lowest since February. While many firms commented on strong consumer spending and a sustained recovery in demand for business services, there were also reports that COVID-19 isolation rules had negatively influenced sales volumes.
Job creation continued at a brisk pace in July, reflecting strong demand for staff across the service economy. However, the rate of employment growth slipped to a three-month low, which survey respondents often attributed to unexpected staff departures and delays with finding suitably skilled candidates.
Finally, the latest survey indicated that service sector companies remain highly upbeat about their growth prospects for the year ahead. Around 57% predict an expansion, while only 9% anticipate a decline in business activity. However, the degree of confidence has now slipped for four months in a row and the latest reading was the lowest since January.
According to the report from IHS Markit, eurozone business activity rose at its fastest rate in just over 15 years during July, with steep manufacturing output growth complemented by an accelerated expansion of services activity.
After accounting for seasonal factors, the Eurozone PMI Composite Output Index rose to 60.2, slightly below the preliminary ‘flash’ estimate of 60.6, but still surpassing June’s 15-year record of 59.5. This was the fifth successive month in which private sector output has expanded, the longest uninterrupted sequence since the pandemic began early last year.
Driving the broad acceleration in output growth was services, where activity increased at its fastest pace since mid-2006. Although manufacturing production rose at its softest rate in five months, the expansion was considerable and still outstripped that seen in the services sector.
Latest survey data also revealed the quickest rise in demand for euro area goods and services since May 2000 in July. Again, trends in new orders were similar to output, with more rapid demand growth for services contrasting with a slower pick-up for goods. Nevertheless, increased order book volumes reflected improvements in both domestic and international markets, as indicated by a rise in new export business. Although foreign demand rose at a marginally weaker pace than in June, it was still the second-fastest recorded since comparable data were first published in September 2014. The consequence of steep month-to-month growth in new business strained operating capacities across the eurozone immensely in July. This was evidenced by a survey-record rise in outstanding business and extended the current period of backlog accumulation to five months. However, notable efforts to bolster output potential were seen as employment increased at the fastest rate in almost 21 years.
Lastly, businesses remained firmly optimistic that output would grow over the next 12 months, although the degree of confidence slipped from June’s high (since 2012) to a four-month low.
Reuters reports that according to the report from IHS Markit, activity in Spain's service sector expanded for the fourth month in a row in July, albeit at a slower pace than in June.
PMI of services companies, which account for around half Spain's economic output, slipped to 61.9 last month from 62.5 in June. The 50 mark separates growth from contraction.
Paul Smith, Economics Director at IHS Markit, said that despite the slight drop, the index "continued to signal a considerable pace of expansion as the economy opens up, sales strengthen further and market demand continues to improve".
"That said, there were some hints of the ongoing challenges faced by the sector, with recent rises in infection numbers reportedly leading to some cancellation of orders and heightened caution, especially amongst foreign clients when booking hospitality," he added.
| Time | Country | Event | Period | Previous value | Forecast | Actual |
|---|---|---|---|---|---|---|
| 01:30 | Australia | Retail Sales, M/M | June | 0.4% | -1.8% | -1.8% |
| 01:45 | China | Markit/Caixin Services PMI | July | 50.3 | 54.9 |
During today's Asian trading, the US dollar fell against the euro and was almost unchanged against the yen.
Traders continue to closely monitor the situation with the spread of the new COVID-19 "delta" strain in the world, trying to assess the potential consequences for the global economy.
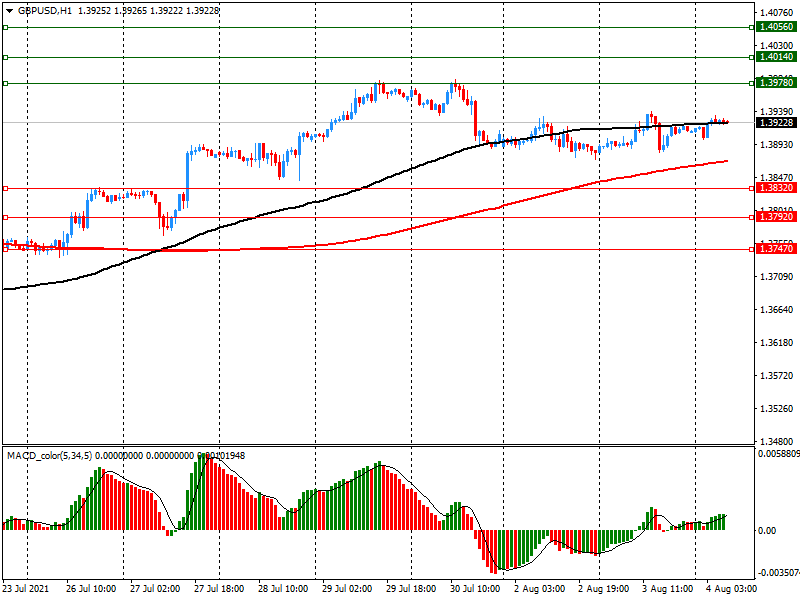
The pound rose 0.2% against the US dollar. Market participants are waiting for the results of the Bank of England meeting, which will be summed up on Thursday.
The Australian dollar also rose by 0.20% against the US dollar. The Reserve Bank of Australia (RBA) at the end of the meeting on Tuesday kept both the key rate and the target yield of three-year government bonds at the level of 0.1% per annum. The central bank said that it will begin to reduce the volume of bond repurchases in September, despite a slight deterioration in the prospects for economic growth due to new restrictive measures introduced in connection with the renewed rise in the incidence of COVID-19.
The ICE index, which tracks the dynamics of the dollar against six currencies (euro, swiss franc, yen, canadian dollar, pound sterling and swedish krona), fell by 0.10%.
FXStreet reports that analysts at Goldman Sachs discuss prospects of the RBNZ policy.
"Q221 labor market report was very strong. In context, the labor market has now returned to conditions comparable to late 2019 which the RBNZ then characterized as "around maximum sustainable employment. On any measure, this recovery to pre-pandemic conditions has been much faster than we and the RBNZ expected".
"In light of this and the RBNZ's comment yesterday that it needs to "think about when and how we would return interest rates to more normal levels", we front-load our forecast tightening cycle to include +25bp hikes in August, October and November 2021 - taking the official cash rate to 1.0% by end-2021 (previously 0.5% by end-2021).”
“This will take the OCR back to the pre-pandemic level of late 2019. We note the risk that the RBNZ hikes by 50bp at the August meeting, although we think a series of back-to-back 25bp hikes is more likely."
CNBC reports that an analyst at Moody’s said that more countries are pushing to produce their own semiconductor chips, which are in short supply globally, because “it’s a matter of national security.”
“I think the main problem really is that new supply is hard to come by and the surge in demand is not going to be abetting anytime soon,” Timothy Uy, an associate director at Moody’s Analytics, said.
“On both the supply and demand sides, I think companies are adjusting. Governments are also getting in on the action because they view this as, in some sense, kind of a matter of national security,” he added.
Semiconductor chips are ubiquitous — without them, a lot of products will not work. This is already being felt by the auto industry, where carmakers have been forced to stall production as a result of the global chip shortage. Some reports say the chip shortage may last until 2023.
Manufacturing semiconductor chips is an intricate, capital-intensive process that involves weeks of production, Uy said last week in a note. It takes even longer time to distribute them, he said.
He explained that new supply cannot be created instantly — and sometimes, it may take years for new supply to come online as factories need to be built and fitted with the proper technology.
EUR/USD
Resistance levels (open interest**, contracts)
$1.1954 (3559)
$1.1914 (2392)
$1.1888 (1665)
Price at time of writing this review: $1.1873
Support levels (open interest**, contracts):
$1.1834 (2894)
$1.1795 (2908)
$1.1749 (5359)

Comments:
- Overall open interest on the CALL options and PUT options with the expiration date August, 6 is 70817 contracts (according to data from August,3) with the maximum number of contracts with strike price $1,1700 (10352);
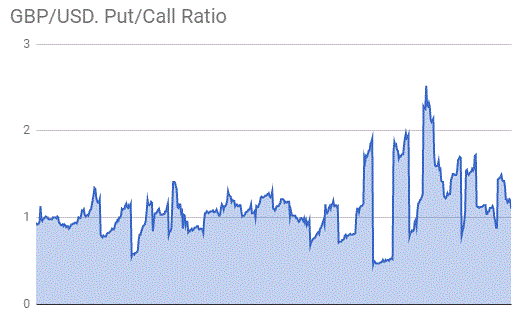
GBP/USD
$1.4056 (447)
$1.4014 (1753)
$1.3978 (722)
Price at time of writing this review: $1.3923
Support levels (open interest**, contracts):
$1.3832 (309)
$1.3792 (778)
$1.3747 (904)
Comments:
- Overall open interest on the CALL options with the expiration date August, 6 is 16579 contracts, with the maximum number of contracts with strike price $1,4150 (1782);
- Overall open interest on the PUT options with the expiration date August, 6 is 19372 contracts, with the maximum number of contracts with strike price $1,3400 (1677);
- The ratio of PUT/CALL was 1.17 versus 1.15 from the previous trading day according to data from August, 3
* - The Chicago Mercantile Exchange bulletin (CME) is used for the calculation.
** - Open interest takes into account the total number of option contracts that are open at the moment.
FXStreet reports that analysts at Bank of America Global Research (BofA) offer their expectations from 'Super Thursday’s' Bank of England (BOE) meeting.
“The Bank of England doesn't provide guidance anymore, so we do not expect any clear signals from this week's BoE policy meeting. The BoE's inflation forecast is the best signal we will get. We expect the BoE to raise near-term inflation a lot but medium-term inflation only little.”
“In the absence of changes in guidance to watch for, we suspect market focus will be on how many rate-setters vote to end-QE early - QE purchases are currently scheduled to run until year-end - and whether the BoE publishes its policy sequencing review, which will explain when Quantitative Tightening (QT) starts.”
“We expect a 6-2 vote in favor of continuing QE purchases as scheduled. The bar for a hawkish BoE surprise seems high.”
RTTNews reports that survey results from Caixin/IHS Markit showed that China's service sector activity logged a steeper growth in July as the successful containment of the recent uptick in COVID-19 cases led to greater customer numbers and boosted new order intakes.
At 54.9 in July, the PMI rebounded from June's 14-month low of 50.3 and signaled a sharp and accelerated expansion of services activity.
New order growth accelerated in July as the containment of the virus domestically boosted customer numbers and demand. Nonetheless, new export business remained broadly stagnant. Although marginal, service sector employment returned to growth in July.
On the price front, the survey showed that the rate of input cost inflation accelerated in the latest survey period. Consequently, prices charged by services companies increased, as firms looked to alleviate pressure on their operating margins.
In July, the composite output index came in at 53.1, up from a 14-month low of 50.6 in June, to point to a stronger rise in overall Chinese business activity.
| Raw materials | Closed | Change, % |
|---|---|---|
| Brent | 72.45 | -1.29 |
| Silver | 25.505 | 0.46 |
| Gold | 1809.907 | -0.18 |
| Palladium | 2642.83 | -1.28 |
| Time | Country | Event | Period | Previous value | Forecast |
|---|---|---|---|---|---|
| 01:30 (GMT) | Australia | Retail Sales, M/M | June | 0.4% | -1.8% |
| 01:45 (GMT) | China | Markit/Caixin Services PMI | July | 50.3 | |
| 07:50 (GMT) | France | Services PMI | July | 57.8 | 57.0 |
| 07:55 (GMT) | Germany | Services PMI | July | 57.5 | 62.2 |
| 08:00 (GMT) | Eurozone | Services PMI | July | 58.3 | 60.4 |
| 08:30 (GMT) | United Kingdom | Purchasing Manager Index Services | July | 62.4 | 57.8 |
| 09:00 (GMT) | Eurozone | Retail Sales (MoM) | June | 4.6% | 1.7% |
| 09:00 (GMT) | Eurozone | Retail Sales (YoY) | June | 9% | 4.5% |
| 12:15 (GMT) | U.S. | ADP Employment Report | July | 692 | |
| 12:30 (GMT) | Canada | Building Permits (MoM) | June | -14.8% | 5.5% |
| 13:45 (GMT) | U.S. | Services PMI | July | 64.6 | 59.8 |
| 14:00 (GMT) | U.S. | FOMC Member Clarida Speaks | |||
| 14:00 (GMT) | U.S. | ISM Non-Manufacturing | July | 60.1 | 60.5 |
| 14:30 (GMT) | U.S. | Crude Oil Inventories | July | -4.089 | -2.9 |
| Pare | Closed | Change, % |
|---|---|---|
| AUDUSD | 0.73932 | 0.45 |
| EURJPY | 129.307 | -0.32 |
| EURUSD | 1.18616 | -0.07 |
| GBPJPY | 151.657 | -0.04 |
| GBPUSD | 1.39107 | 0.21 |
| NZDUSD | 0.70173 | 0.69 |
| USDCAD | 1.25342 | 0.27 |
| USDCHF | 0.9034 | -0.15 |
| USDJPY | 109.033 | -0.24 |


© 2000-2026. All rights reserved.
This site is managed by Teletrade D.J. LLC 2351 LLC 2022 (Euro House, Richmond Hill Road, Kingstown, VC0100, St. Vincent and the Grenadines).
The information on this website is for informational purposes only and does not constitute any investment advice.
The company does not serve or provide services to customers who are residents of the US, Canada, Iran, The Democratic People's Republic of Korea, Yemen and FATF blacklisted countries.
Making transactions on financial markets with marginal financial instruments opens up wide possibilities and allows investors who are willing to take risks to earn high profits, carrying a potentially high risk of losses at the same time. Therefore you should responsibly approach the issue of choosing the appropriate investment strategy, taking the available resources into account, before starting trading.
Use of the information: full or partial use of materials from this website must always be referenced to TeleTrade as the source of information. Use of the materials on the Internet must be accompanied by a hyperlink to teletrade.org. Automatic import of materials and information from this website is prohibited.
Please contact our PR department if you have any questions or need assistance at pr@teletrade.global.
transfers