- Analytics
- News and Tools
- Market News
CFD Markets News and Forecasts — 11-08-2021
| Time | Country | Event | Period | Previous value | Forecast |
|---|---|---|---|---|---|
| 01:30 (GMT) | Australia | Wage Price Index, y/y | Quarter II | 0.6% | |
| 01:30 (GMT) | Australia | Wage Price Index, q/q | Quarter II | 1.5% | |
| 06:00 (GMT) | United Kingdom | Manufacturing Production (YoY) | June | 27.7% | 13.5% |
| 06:00 (GMT) | United Kingdom | Industrial Production (MoM) | June | 0.8% | 0.3% |
| 06:00 (GMT) | United Kingdom | Industrial Production (YoY) | June | 20.6% | 9.4% |
| 06:00 (GMT) | United Kingdom | Manufacturing Production (MoM) | June | -0.1% | 0.4% |
| 06:00 (GMT) | United Kingdom | Business Investment, q/q | Quarter II | -10.7% | |
| 06:00 (GMT) | United Kingdom | Business Investment, y/y | Quarter II | -16.9% | |
| 06:00 (GMT) | United Kingdom | GDP m/m | June | 0.8% | 0.8% |
| 06:00 (GMT) | United Kingdom | Total Trade Balance | June | 0.9 | |
| 06:00 (GMT) | United Kingdom | GDP, y/y | Quarter II | -6.1% | 22.1% |
| 06:00 (GMT) | United Kingdom | GDP, q/q | Quarter II | -1.6% | 4.8% |
| 06:00 (GMT) | United Kingdom | GDP, y/y | June | 24.6% | 14.9% |
| 08:00 (GMT) | France | IEA Oil Market Report | |||
| 09:00 (GMT) | Eurozone | Industrial Production (YoY) | June | 20.5% | 10.4% |
| 09:00 (GMT) | Eurozone | Industrial production, (MoM) | June | -1% | -0.2% |
| 12:30 (GMT) | U.S. | Continuing Jobless Claims | July | 2930 | 2880 |
| 12:30 (GMT) | U.S. | PPI, y/y | July | 7.3% | 7.3% |
| 12:30 (GMT) | U.S. | PPI, m/m | July | 1% | 0.6% |
| 12:30 (GMT) | U.S. | PPI excluding food and energy, m/m | July | 1% | 0.5% |
| 12:30 (GMT) | U.S. | PPI excluding food and energy, Y/Y | July | 5.6% | 5.6% |
| 12:30 (GMT) | U.S. | Initial Jobless Claims | August | 385 | 375 |
| 13:00 (GMT) | United Kingdom | NIESR GDP Estimate | July | 4.8% | |
| 22:30 (GMT) | New Zealand | Business NZ PMI | July | 60.7 | |
| 22:45 (GMT) | New Zealand | Visitor Arrivals | June | 2531.6% |
eFXdata reports that analysts at MUFG Research discuss the correlation between the U.S. yields and USD/JPY.
"Recent price action suggests that FX performance has been driven more by yield spreads than concerns over the global growth outlook. Our own correlation analysis shows that G10 FX correlations with long-term US yields have strengthened."
"USD/JPY continues to have the strongest correlation. The 30-day correlation between daily % changes in USD/JPY and the 10-year UST yield has been +0.64. USD/JPY also bottomed on the 4th August at 108.72 and has since rebounded to an intra-day high overnight of 110.69."
The
U.S. Energy Information Administration (EIA) reported on Wednesday that crude
inventories fell by 0.447 million barrels in the week ended August 6, following
a build of 3.626 million barrels in the previous week. Economists had forecast
a draw of 1.270 million barrels.
At the same time, gasoline stocks decreased by 1.400 million barrels, while analysts had expected a decline of 1.660 million barrels. Distillate stocks grew by 1.766 million barrels, while analysts had forecast a drop of 0.472 million barrels.
Meanwhile,
oil production in the U.S. rose by 100,000 barrels a day to 11,300 million
barrels a day.
U.S.
crude oil imports averaged 6.4 million barrels per day last week, down by
36,000 barrels per day from the previous week.
FXStreet notes that gold’s spike lower has exhausted ahead of the March lows at $1679/$1677 but strategists at Commerzbank favour some consolidation/recovery as the sell-off has not damaged the underlying long term bull trend.
“Gold saw a massive spike lower and has sold off to the March lows at $1679/$1677, which are currently holding. This is reinforced by the $1670 June 2020 low.”
“The slide lower took out the 2019-2021 uptrend line, which was damaging but has not done enough to tip the market into bearish territory and for now we believe the move lower was exhaustive and favour some near-term consolidation and recovery.”
“Rallies will find initial resistance at the June low at $1750 and face tough resistance now above $1804 and $1834 (100 and 200-day ma and the mid-July high.”
U.S. stock-index futures rose on Wednesday after the U.S.CPI report showed a moderation in consumer prices in July and the Senate approved a $3.5 trillion budget framework.
Global Stocks:
Index/commodity | Last | Today's Change, points | Today's Change, % |
Nikkei | 28,070.51 | +182.36 | +0.65% |
Hang Seng | 26,660.16 | +54.54 | +0.20% |
Shanghai | 3,532.62 | +2.69 | +0.08% |
S&P/ASX | 7,584.30 | +21.70 | +0.29% |
FTSE | 7,198.80 | +37.76 | +0.53% |
CAC | 6,849.16 | +28.95 | +0.42% |
DAX | 15,796.89 | +26.18 | +0.17% |
Crude oil | $67.42 | -1.27% | |
Gold | $1,742.70 | +0.64% |
- Says he is not focused on calendar in taper discussion
- Wants to see more improvement in job market and particularly a further increase in employment-to-population ratio
- Feels inflation may have "crested" but is not dismissing risks that supply shocks and other dynamics may keep it higher for longer than expected
- Says that Fall will be a key test; if workers do not return in significant numbers it could challenge assumptions about maximum employment
- Delta variant effect remains an open question
- When taper does begin, would prefer something simple and easy to explain to markets
(company / ticker / price / change ($/%) / volume)
3M Co | MMM | 199.08 | -0.17(-0.09%) | 982 |
ALCOA INC. | AA | 44.05 | 0.18(0.41%) | 94162 |
ALTRIA GROUP INC. | MO | 48.14 | 0.03(0.06%) | 3152 |
Amazon.com Inc., NASDAQ | AMZN | 3,328.80 | 8.12(0.24%) | 17975 |
AMERICAN INTERNATIONAL GROUP | AIG | 53.16 | 0.02(0.04%) | 7114 |
Apple Inc. | AAPL | 146.15 | 0.55(0.38%) | 501041 |
AT&T Inc | T | 28.11 | 0.02(0.07%) | 53063 |
Boeing Co | BA | 236.8 | 1.02(0.43%) | 67572 |
Caterpillar Inc | CAT | 215.37 | 1.30(0.61%) | 37503 |
Chevron Corp | CVX | 101.76 | -0.32(-0.31%) | 36717 |
Cisco Systems Inc | CSCO | 55.71 | 0.10(0.18%) | 26037 |
Citigroup Inc., NYSE | C | 72.86 | -0.12(-0.16%) | 38783 |
Deere & Company, NYSE | DE | 378.84 | 2.22(0.59%) | 1585 |
Exxon Mobil Corp | XOM | 58.05 | -0.13(-0.22%) | 112384 |
Facebook, Inc. | FB | 362.96 | 1.83(0.51%) | 38396 |
FedEx Corporation, NYSE | FDX | 271.8 | 0.54(0.20%) | 4224 |
Ford Motor Co. | F | 13.86 | 0.04(0.29%) | 193175 |
Freeport-McMoRan Copper & Gold Inc., NYSE | FCX | 38.63 | 0.41(1.07%) | 144675 |
General Electric Co | GE | 106.48 | 0.40(0.38%) | 24667 |
General Motors Company, NYSE | GM | 54.3 | 0.04(0.07%) | 23688 |
Goldman Sachs | GS | 407 | -0.97(-0.24%) | 13465 |
Google Inc. | GOOG | 2,758.99 | -2.94(-0.11%) | 2660 |
Hewlett-Packard Co. | HPQ | 29.75 | 0.02(0.07%) | 534 |
Home Depot Inc | HD | 331.56 | 0.08(0.02%) | 805 |
HONEYWELL INTERNATIONAL INC. | HON | 231.91 | 0.03(0.01%) | 914 |
Intel Corp | INTC | 54.2 | 0.26(0.48%) | 57823 |
International Business Machines Co... | IBM | 141.3 | -0.08(-0.06%) | 719 |
Johnson & Johnson | JNJ | 173.93 | 0.16(0.09%) | 1293 |
JPMorgan Chase and Co | JPM | 158.97 | -0.29(-0.18%) | 49404 |
McDonald's Corp | MCD | 234.4 | 0.95(0.40%) | 519 |
Merck & Co Inc | MRK | 75.33 | 0.14(0.19%) | 5956 |
Microsoft Corp | MSFT | 287.65 | 1.21(0.42%) | 57131 |
Pfizer Inc | PFE | 47.85 | -0.34(-0.71%) | 434384 |
Procter & Gamble Co | PG | 141.92 | -0.36(-0.25%) | 793 |
Starbucks Corporation, NASDAQ | SBUX | 116.5 | 0.56(0.48%) | 13368 |
Tesla Motors, Inc., NASDAQ | TSLA | 714.6 | 4.61(0.65%) | 161464 |
The Coca-Cola Co | KO | 56.77 | -0.03(-0.05%) | 7461 |
Twitter, Inc., NYSE | TWTR | 65.91 | 0.23(0.35%) | 56523 |
Verizon Communications Inc | VZ | 55.52 | 0.04(0.07%) | 11880 |
Wal-Mart Stores Inc | WMT | 149.82 | 1.14(0.77%) | 48781 |
Walt Disney Co | DIS | 176.8 | -0.27(-0.15%) | 9705 |
Yandex N.V., NASDAQ | YNDX | 67.35 | -0.01(-0.01%) | 1353 |
The
Labor Department announced on Wednesday the U.S. consumer price index (CPI) rose
0.5 percent m-o-m in July, following an unrevised 0.9 percent m-o-m gain in the
previous month.
This was the smallest one-month increase in headline CPI since February.
Over the last 12 months, the CPI climbed 5.4 percent y-o-y, unchanged from +5.4 percent y-o-y reported for the period ending in June.
Economists
had forecast the CPI to increase 0.5 percent m-o-m and 5.3 percent y-o-y in the
12-month period.
According
to the report, the indexes for shelter (+0.4 percent m-o-m), food (+0.7 percent
m-o-m), energy (+1.6 percent m-o-m), and new vehicles (+1.7 percent m-o-m) all rose
in July and contributed to the monthly all items seasonally adjusted advance.
Meanwhile,
the core CPI excluding volatile food and fuel costs rose 0.3 percent m-o-m in July
after an unrevised 0.9 percent m-o-m jump in the previous month.
In the 12 months through July, the core CPI surged 4.3 percent compared to an unrevised 4.5 percent advance for the 12 months ending June.
Economists
had forecast the core CPI to rise 0.4 percent m-o-m and 4.3 percent y-o-y last
month.
FXStreet notes that NZD/USD stays trapped in its range between 0.7103/7115 and support at 0.6910/6880. However, analysts at Credit Suisse still believe a downside breakout is more likely.
“We stay biased towards a deeper move lower within the range, with support seen next at 0.6952/46, below which would open up the range bottom between 0.6910/6901 and the YTD low at 0.6880.”
“Beneath the 0.6880 YTD low remains needed to confirm an important trend change lower, with next support then seen at a minor retracement level at 0.6861, then eventually 0.6703/00.”
“Early this morning, I voted ‘YES’ on a procedural vote to move forward on the budget reconciliation process because I believe it is important to discuss the fiscal policy future of this country. However, I have serious concerns about the grave consequences facing West Virginians and every American family if Congress decides to spend another $3.5 trillion," stated Joe Manchin, a Democratic senator of West Virginia.
“Given the current state of the economic recovery, it is simply irresponsible to continue spending at levels more suited to respond to a Great Depression or Great Recession - not an economy that is on the verge of overheating. More importantly, I firmly believe that continuing to spend at irresponsible levels puts at risk our nation’s ability to respond to the unforeseen crises our country could face. I urge my colleagues to seriously consider this reality as this budget process unfolds in the coming weeks and months.”
USD appreciated against other major currencies in the European session on Wednesday, as market participants awaited the U.S. inflation data for July, hoping to get further clues of when the Federal Reserve might start tapering its bond purchases.
The U.S. Dollar Index (DXY), measuring the U.S. currency's value relative to a basket of foreign currencies, edged up 0.10% to 93.15.
Economists forecast the data to show that inflation rose 0.5% m/m and 5.3% y/y in July. The pace in June was 0.9% m/m and 5.4% y/y.
Hotter-than-expected inflation data may suggest that inflation in the U.S. is more persistent, challenging the Fed's “transitory” narrative, and will heighten the risk of a near-term QE tapering.
In addition, the news that the Senate approved a $3.5 trillion budget framework on Wednesday morning, a day after the upper chamber of the U.S. Congress passed a $1 trillion bipartisan infrastructure bill, added to concerns that a fiscal policy push could keep inflation higher for an extended period of time.
Several Fed policymakers, who spoke earlier this week, expressed views that the U.S. central bank should begin trimming its $120 billion in monthly bond purchases in the fourth quarter. The expectations of a sooner withdrawal of monetary stimulus in the U.S. were bolstered by Friday’s release of stronger-than-anticipated July jobs data.
“We are engaging with relevant OPEC+ members on the importance of competitive markets in setting prices,” National Security Advisor Jake Sullivan said in the statement obtained by CNBC. “Competitive energy markets will ensure reliable and stable energy supplies, and OPEC+ must do more to support the recovery.”
According to CNBC, the Administration of the U.S. president also calls on the Federal Trade Commission (FTC) to “monitor the U.S. gasoline market” and “address any illegal conduct that might be contributing to price increases for consumers at the pump.” The letter from the National Economic Council (NEC) to the FTC urges the regulator to look into the factors contributing to the gain in gas prices in an effort to ensure that consumers aren’t footing an unfair bill.
“With its suite of tools to monitor industry prices, review merger-and-acquisition activity, conduct market studies, and investigate market manipulation and anti-competitive practices, the FTC is well placed to lead the effort to evaluate what is happening in the U.S. gasoline market and take any necessary steps to address illegal conduct,” the letter said.
The Mortgage Bankers Association (MBA) reported on Wednesday the mortgage application volume in the U.S. climbed 2.8 percent in the week ended August 6, following a 1.7 percent drop in the previous week.
According to the report, refinance applications surged 3.2 percent, while applications to purchase a home increased 1.8 percent.
Meanwhile, the average fixed 30-year mortgage rate rose from 2.97 percent to 2.99 percent.
“Mortgage applications rebounded last week, including an increase in purchase applications for the first time in nearly a month,” noted Joel Kan, MBA Associate Vice President of Economic and Industry Forecasting. “Rates slightly rose but remained below 3 percent, driven by an end-of-week increase in the 10-year Treasury yield following the positive July jobs report.”
FXStreet reports that strategists at Credit Suisse warn of a deeper fall in the price of Brent crude oil on a break below the $67.44 July low.
“Below the $67.44 July low would warn of a more serious break lower, for a move to $64.57 next, with scope for the 200-day average at $62.40, with buyers then expected here.”
“Above $72.43 is needed to ease the pressure off the $67.44 July low for a recovery back to the top of the range at $75.78/77.84.”
“Weekly RSI momentum holds a top and a bearish divergence, increasing the risk for a top in the market also.”
FXStreet reports that economists at Mizuho Bank expect USD/CAD to move in a range between 1.22-1.28.
“The US and other nations are seeing a rise in COVID-19 cases on the spread of new variants, so the Canadian dollar will be sold at times on risk aversion, with the USD/CAD pair likely to rise to around 1.28 at times. However, the Canadian economy is recovering at a steady pace, even compared to other developed nations.”
“With expectations for rate hikes also growing, the Canadian dollar looks set to move firmly, with USD/CAD expected to move between 1.22-1.28 in August.”
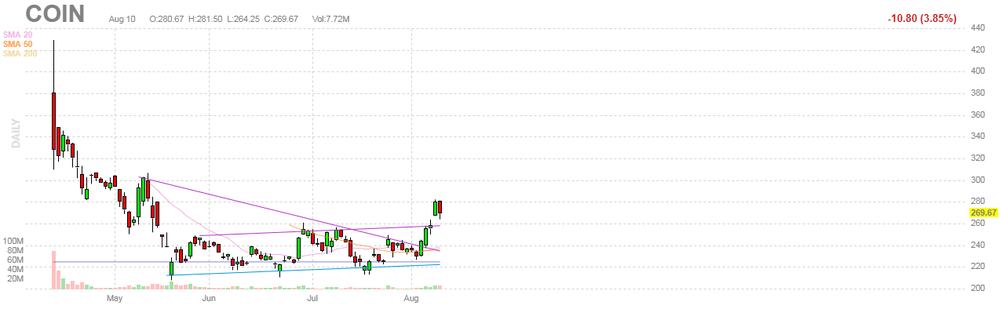
Coinbase Global (COIN) reported Q2 FY 2021 earnings of $6.42 per share, beating analysts’ consensus estimate of $2.57 per share.
The company’s quarterly revenues amounted to $2.033 bln, beating analysts’ consensus estimate of $1.828 bln.
COIN rose to $276.59 (+2.57%) in pre-market trading.
FXStreet reports that economists at Société Générale note that EUR/USD is close to potential support of 1.1700 and below this level, the next projections are located at 1.1600.
“The sequence of lower lows suggests that the selling has not been exhausted, but the RSI is approaching oversold territory.”
“Support for EUR/USD below 1.1704 is at 1.1695. A deeper pullback towards 1.1600 beckons on a successful break.”
“A below-forecast number on US CPI today could elicit pockets of short-covering, only for the rally to be sold again."
CNBC reports that in the opinion of Wood Mackenzie, a transition to renewable sources of energy will prompt a surge in demand for base metals in the coming years.
Analysts at the energy consultancy said that as governments fulfil commitments to limit global warming, a growing reliance on solar power would boost demand for several non-ferrous metals.
Three metals in particular were named by Wood Mackenzie as commodities to watch: aluminum, copper and zinc.
The report’s authors outlined three possible scenarios for the metals, with demand growth for each depending on the success of international efforts to limit global warming.
Aluminum
Wood Mackenzie’s base case scenario assumes that by the end of the century, temperatures will have risen by 2.8 to 3 degrees Celsius from pre-industrial times.
In this situation, aluminum demand from the solar power sector would rise from 2.4 million tons in 2020 to 4.6 million tons in 2040.
Copper
Demand for copper — used in high and low voltage transmission cables and thermal solar collectors — is also set for “notable gains” as solar energy becomes more mainstream, Wood Mackenzie said.
The report’s base case scenario predicted that demand for copper arising from solar power generation would rise from 0.4 million tons in 2020 to 0.7 million tons a year by 2040.
Zinc
Meanwhile, analysts noted that only zinc coatings could offer cheap, long-lasting corrosion protection, with the metal used in solar panels’ structural parts.
Currently, solar power installations account for around 0.4 million tons of annual global zinc consumption, Wood Mackenzie said.
If global temperatures were on track to rise by 2.8 to 3 degrees Celsius by the end of this century, this number was projected to grow to 0.8 million tons by 2040.
Wood Mackenzie’s predictions for the three metals were only around demand coming from the solar power industry, and did not speculate on total global demand.
FXStreet reports that the Credit Suisse analyst team discuss S&P 500 Index prospects.
“The S&P 500 has achieved our 4436/4456 Q3 objective and with daily and weekly RSI momentum holding bearish divergences our bias remains to not chase the market above here for now and see scope for a temporary pause.”
“Above 4456 though in due course post a consolidation can see a move to the psychological 4500 level, then upper end of the ‘typical’ extreme, now at 4562 (15% above the 200-day average) but with a fresh cap expected here.”
“Volume is starting to stall, increasing the risk for a pause in the uptrend. Breadth measures though stay bullish and continue to reinforce the underlying uptrend.”
CNBC reports that U.S. Treasury yields climbed on Wednesday, ahead of the release of the July consumer price index.
The yield on the benchmark 10-year Treasury note rose nearly 3 basis points to 1.372%. The yield on the 30-year Treasury bond added close to 3 basis points, climbing to 2.015%.
The July CPI index is due to be released at 12:30 GMT. Economists surveyed expect the index to have risen 0.5% last month, or 5.3% year over year. In June prices jumped 0.9%, which was the biggest monthly increase since August 2008.
Meanwhile, Kansas City Federal Reserve President Esther George is due to speak at 16:00 GMT. Investors will be listening to her comments closely, given that two Fed officials this week have already suggested that inflation has now reached the point that would satisfy one part of the central bank’s targets to start paring back its easy monetary policy. Both Atlanta Fed President Raphael Bostic and Richmond Fed President Thomas Barkin said on Monday they believed inflation had reached the central bank’s 2% long-term inflation threshold.
FXStreet reports that strategists at Credit Suisse discuss XAU/USD prospects.
“Gold has been consistently capped at its 200-day average and with the USD strengthening and US Real Yields moving back higher, bearish pressures have sharply re-surfaced. Whilst $1790 caps, the immediate risk is seen lower for a retest of pivotal support from the lows for the year and 38.2% retracement of the entire 2015/2020 bull market at $1682/71.Below $1682/71 we would see support at $1620/15 initially, then $1565/60.”
Reuters reports that the U.S. Senate narrowly approved a $3.5 trillion spending blueprint for President Joe Biden’s top priorities.
After months of haggling, the Senate on Tuesday passed a $1 trillion infrastructure bill here in a bipartisan 69-30 vote, proposing to make the nation's biggest investment in decades in roads, bridges, airports and waterways.
Democrats in the Senate then turned to a budget resolution containing spending instructions for the multi-trillion-dollar follow-up package here, which includes provisions to create universal preschool, affordable housing and climate-friendly technologies.
The bills have been a top priority for Biden, who has sought to enact sweeping changes during a time when his Democratic party narrowly controls both congressional chambers and where they fear loss of legislative control in the looming 2022 elections.
The Democrats plan to push the package through over the next few months, using a process called "budget reconciliation here," which allows them to pass legislation with a simple majority vote.
According to the report from Istat, in July 2021 the rate of change of Italian consumer price index for the whole nation (NIC) was +0.5% on monthly basis and +1.9% on annual basis (+1.3% in June); the flash estimate was +1.8%.
The speed-up of the growth on annual basis of All-item index was mainly due to the prices of Regulated energy products (that were up from +16.9% to +34.2%), whereas the Non-regulated ones slowed down (from +12.8% to +11.2%).
Core inflation (excluding energy and unprocessed food) was +0.6% and inflation excluding energy was +0.4% (both up from +0.3% in the previous month).
The increase on monthly basis was mainly due to the prices of Regulated energy products (+11.3%) and, to a lesser extent, to those of Services related to transport (+1.1%) and of Services related to recreation, including repair and personal care (+0.8%); instead, prices of Unprocessed food decreased (-1.6%).
The rate of change of Prices of Grocery and unprocessed food was -0.5% on monthly basis and zero variation on annual basis (from -0.7% in the previous month).
Reuters reports that Singapore's bellwether economy expanded more than initially estimated in the second quarter and the government raised its forecast for 2021.
GDP is forecast to grow 6% to 7% in 2021, versus a prior estimate for an expansion of 4 to 6%, the Ministry of Trade and Industry said.
GDP grew 14.7% year-on-year in the second quarter, higher than the 14.3% growth seen in the government's advance estimate. In absolute terms, GDP remained 0.6% below its pre-pandemic level in the second quarter of 2019.
"Barring a major setback in the global economy, the Singapore economy is expected to continue to see a gradual recovery in the second half of the year, supported in large part by outward-oriented sectors," said Gabriel Lim, permanent secretary for trade and industry.
He said easing border restrictions would also help in the recovery of consumer-facing sectors and alleviate labour shortages in sectors that are reliant on migrant workers.
FXStreet reports that in the opinion of economists at MUFG Bank, another inflation surprise would give the dollar a boost.
“Speculation had built up following the stronger NFP report for July that the Fed could announce QE taper plans as soon as at the September FOMC meeting and start the tapering process before the end of the year. A slower start and more gradual tapering plan would help to dampen US dollar strength in the near-term. The report is expected to reveal that the annual rate of headline and core inflation remain elevated at 5.3% and 4.3% respectively in July. We would expect the US dollar to strengthen today if there is another upside inflation surprise with risks tilted in that direction.”
| Time | Country | Event | Period | Previous value | Forecast | Actual |
|---|---|---|---|---|---|---|
| 00:30 | Australia | Westpac Consumer Confidence | August | 108.8 | 104.1 | |
| 06:00 | Germany | CPI, m/m | July | 0.4% | 0.9% | 0.9% |
| 06:00 | Germany | CPI, y/y | July | 2.3% | 3.8% | 3.8% |
During today's Asian trading, the US dollar rose against the euro, the pound and the yen.
Traders are waiting for statistical data on inflation in the United States, which are considered an important signal regarding the prospects for monetary policy. Experts expect inflation to weaken in July to 5.3% compared to 5.4% in June. The US Department of Labor will publish data on the dynamics of consumer prices today at 12:30 GMT.
"Higher - than-expected inflation rates will support the US dollar in the near future," said ActivTrades analyst Anderson Alves.
"They will put pressure on US Treasury yields in the short term, which may change the direction of global cash flows, as traders will have to re - evaluate inflation expectations, as well as the prospects for future actions of the Federal Reserve," Alves said.
The ICE index, which tracks the dynamics of the dollar against six currencies (euro, swiss franc, yen, canadian dollar, pound sterling and swedish krona), rose by 0.12%.
eFXdata reports that ING Research discuss EUR/CHF prospects.
"EUR/CHF looks to be one of the primary casualties of the ECB’s new symmetrical inflation targeting regime – which promises lower EUR rates for longer. The ongoing expansion in the ECB’s balance sheet as the ECB prints 100bn of euros per month stands in contrast to the SNB – where FX intervention has slowed. Low Swiss inflation means the real CHF is not quite as strong as nominal FX rates would suggest. A retest of the 2015 highs in the real exchange rate could mean SNB tolerates 1.03 in EUR/CHF," ING adds.
EUR/USD
Resistance levels (open interest**, contracts)
$1.1806 (276)
$1.1782 (135)
$1.1764 (110)
Price at time of writing this review: $1.1711
Support levels (open interest**, contracts):
$1.1674 (2287)
$1.1648 (4757)
$1.1616 (1521)
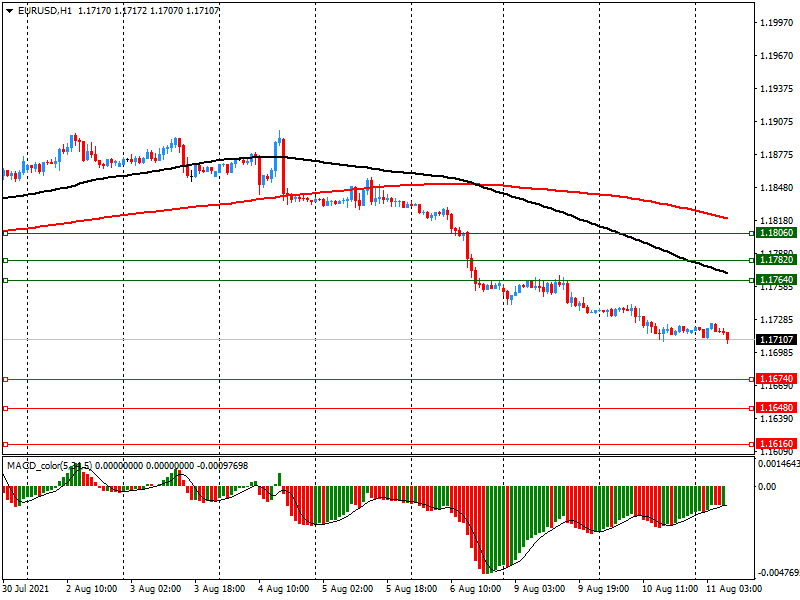
Comments:
- Overall open interest on the CALL options and PUT options with the expiration date September, 3 is 81709 contracts (according to data from August, 10) with the maximum number of contracts with strike price $1,2000 (8708);
GBP/USD
$1.4027 (711)
$1.3960 (392)
$1.3910 (211)
Price at time of writing this review: $1.3828
Support levels (open interest**, contracts):
$1.3760 (441)
$1.3732 (1103)
$1.3701 (898)
Comments:
- Overall open interest on the CALL options with the expiration date September, 3 is 14402 contracts, with the maximum number of contracts with strike price $1,4300 (2189);
- Overall open interest on the PUT options with the expiration date September, 3 is 11651 contracts, with the maximum number of contracts with strike price $1,3800 (1103);
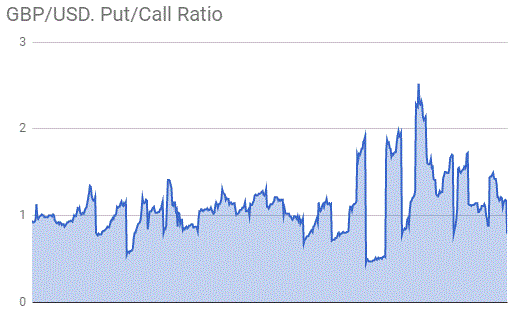
- The ratio of PUT/CALL was 0.81 versus 0.80 from the previous trading day according to data from August, 10
* - The Chicago Mercantile Exchange bulletin (CME) is used for the calculation.
** - Open interest takes into account the total number of option contracts that are open at the moment.
Reuters reports that data from the China Association of Automobile Manufacturers (CAAM) showed that vehicle sales in China fell 3% in May from the same month a year earlier, snapping a streak of 13 consecutive months of gains since April 2020.
Overall sales totaled 2.13 million vehicles in May. China sold 10.88 million vehicles between January and May, up 36% from the same period a year earlier.
A global chip shortage and surging raw material prices are having an increasing impact on automakers in the country, said Chen Shihua, senior official at CAAM. But Chen said CAAM remains cautiously positive about the sector's outlook. The industry body earlier expected China's overall vehicle sales to grow 6.5% this year.
According to the report from the Federal Statistical Office (Destatis), the inflation rate in Germany, measured as the year-on-year change in the consumer price index, stood at +3.8% in July 2021. The inflation rate has thus surged; in June 2021 it had been +2.3%. A higher inflation rate than in July 2021 was last measured in December 1993 (+4.3%). Destatis also reports that consumer prices were up 0.9% on June 2021.
The prices of goods (total) increased by 5.4% between July 2020 and July 2021, which was above average. Especially the increase in Energy product prices (+11.6%) was markedly higher than overall inflation. The price increase for such products accelerated again (June 2021: +9.4%). In addition to the price trend of a year ago (base effect) and the CO2 charge introduced at the beginning of the year, the increasing inflation rate was also attributable to the current rise in energy prices.
Food prices in July 2021 were up 4.3% on the same month a year earlier, following +1.2% in June 2021. Marked price increases on July 2020 were recorded, for example, for vegetables (+7.2%) and edible fats and oils (+6.9%).
The year-on-year increases in energy product prices and food prices had a clear upward effect on the inflation rate. Excluding energy prices, the inflation rate would have been just +2.9% in July 2021; excluding the prices of both product groups, it would have been +2.7%. The prices of services (total) increased by 2.2% in July 2021 compared with the same month a year earlier.
Compared with June 2021, the consumer price index rose by 0.9% in July 2021. Energy product prices were up 1.3%, especially the prices of heating oil (+3.0%) and motor fuels (+2.6%). The prices of food (total) rose by 0.4%. Prices of vegetables, for example, increased (+1.1%), whereas prices of fruit were down (-1.2%). The prices of clothing and footwear were also down (-2.4%), which was mainly due to seasonal reductions in the prices of summer articles.
| Raw materials | Closed | Change, % |
|---|---|---|
| UKBrent | 70.82 | 2.18 |
| Silver | 23.307 | -0.49 |
| Gold | 1728.589 | -0.01 |
| Palladium | 2640.42 | 1.51 |
| Time | Country | Event | Period | Previous value | Forecast |
|---|---|---|---|---|---|
| 00:30 (GMT) | Australia | Westpac Consumer Confidence | August | 108.8 | |
| 06:00 (GMT) | Japan | Prelim Machine Tool Orders, y/y | July | 96.6% | |
| 06:00 (GMT) | Germany | CPI, m/m | July | 0.4% | 0.9% |
| 06:00 (GMT) | Germany | CPI, y/y | July | 2.3% | 3.8% |
| 12:30 (GMT) | U.S. | CPI excluding food and energy, m/m | July | 0.9% | 0.4% |
| 12:30 (GMT) | U.S. | CPI, m/m | July | 0.9% | 0.5% |
| 12:30 (GMT) | U.S. | CPI excluding food and energy, Y/Y | July | 4.5% | 4.3% |
| 12:30 (GMT) | U.S. | CPI, Y/Y | July | 5.4% | 5.3% |
| 14:30 (GMT) | U.S. | Crude Oil Inventories | August | 3.626 | -1.05 |
| 14:30 (GMT) | U.S. | FOMC Member Bostic Speaks | |||
| 16:00 (GMT) | U.S. | FOMC Member Esther George Speaks | |||
| 18:00 (GMT) | U.S. | Federal budget | July | -174 | -307 |
| 22:45 (GMT) | New Zealand | Food Prices Index, y/y | July | 2.8% |
| Pare | Closed | Change, % |
|---|---|---|
| AUDUSD | 0.73447 | 0.22 |
| EURJPY | 129.508 | 0.03 |
| EURUSD | 1.17168 | -0.17 |
| GBPJPY | 152.931 | 0.17 |
| GBPUSD | 1.38363 | -0.03 |
| NZDUSD | 0.70031 | 0.2 |
| USDCAD | 1.25169 | -0.45 |
| USDCHF | 0.92247 | 0.39 |
| USDJPY | 110.526 | 0.21 |


© 2000-2026. All rights reserved.
This site is managed by Teletrade D.J. LLC 2351 LLC 2022 (Euro House, Richmond Hill Road, Kingstown, VC0100, St. Vincent and the Grenadines).
The information on this website is for informational purposes only and does not constitute any investment advice.
The company does not serve or provide services to customers who are residents of the US, Canada, Iran, The Democratic People's Republic of Korea, Yemen and FATF blacklisted countries.
Making transactions on financial markets with marginal financial instruments opens up wide possibilities and allows investors who are willing to take risks to earn high profits, carrying a potentially high risk of losses at the same time. Therefore you should responsibly approach the issue of choosing the appropriate investment strategy, taking the available resources into account, before starting trading.
Use of the information: full or partial use of materials from this website must always be referenced to TeleTrade as the source of information. Use of the materials on the Internet must be accompanied by a hyperlink to teletrade.org. Automatic import of materials and information from this website is prohibited.
Please contact our PR department if you have any questions or need assistance at pr@teletrade.global.
transfers