- Analytics
- News and Tools
- Market News
CFD Markets News and Forecasts — 12-08-2021
| Time | Country | Event | Period | Previous value | Forecast |
|---|---|---|---|---|---|
| 06:30 (GMT) | Switzerland | Producer & Import Prices, y/y | July | 2.9% | |
| 06:45 (GMT) | France | CPI, y/y | July | 1.5% | 1.2% |
| 06:45 (GMT) | France | CPI, m/m | July | 0.1% | 0.1% |
| 09:00 (GMT) | Eurozone | Trade balance unadjusted | June | 7.5 | |
| 12:30 (GMT) | U.S. | Import Price Index | July | 1% | 0.6% |
| 14:00 (GMT) | U.S. | Reuters/Michigan Consumer Sentiment Index | August | 81.2 | 81.2 |
| 17:00 (GMT) | U.S. | Baker Hughes Oil Rig Count | August | 387 |
eFXdata reports that economists at Danske Research see a scope for EUR/USD to resume its decline following yesterday post-CPI rebound.
"EUR/USD rebounded slightly and US interest rates dropped back after US CPI releases came out just below the consensus expectation. In our view, it is likely to only be a temporary set back in the downwards trend in EUR/USD and upwards trend in interest rates. We note that even though CPI inflation did not surprise on upside for the first time since February, inflation remains elevated and above 2% on an annualised basis."
"Hence, the release should not have material impact on Fed's pending decision to start tapering bond purchases. A string of Fed speakers following the release further hinted in that direction."
FXStreet reports that economists at Société Générale suggest that EUR/USD may have a chance to rebound towards the 1.1835 mark.
“EUR/USD has retested the low of March at 1.1700 where it has formed a Bullish Engulfing candlestick. The pattern denotes possibility of an initial rebound towards 1.1835, the 23.6% retracement from May.”
“Recent peak of 1.1900 could be an important resistance near-term.”
“Defending 1.1700 would be crucial to avert continuation in decline. Should this break, next potential objectives are likely to be at 1.1640 and September/November 2020 levels of 1.1610.”
FXStreet reports that economists at Westpac see tentative signs of a resumption of the late July rally in the GBP/USD pair.
“There are tentative signs of a resumption of the late July rally. Above 1.3900 would add confidence to that view and target the recent peak of 1.3985.”
“There’s plenty of UK data over the next week for upside surprise potential, with growth, labour and inflation all featuring.”
“The reopening of the economy, expected resultant economic recovery and less stimulatory monetary policy, should support the GBP. That said, the BoE has signalled a clear and predictable path for the removal of QE, but also one which is designed to minimise market disruption, so that any upside moves in GBP in response are likely to be measured.”
“Health outcomes are firmly in the mix. Cases fell in the second half of July, and have stalled so far in August, while hospitalisations have fallen slightly in August.”
FXStreet reports that economists at Rabobank expect USD/MXN to remain in the 19.80-20.20 range in the coming months.
“We maintain the view that the USD/MXN pair will primarily trade a 19.80-20.20 range in the coming months and favour playing that range.”
“We are becoming more bullish USD vs EM but within the EM space. We expect MXN to remain well supported compared to the bulk of its peers within the LatAm region.”
FXStreet notes that EUR/USD stays calm below 1.1750 but economists at TD Securities are not convinced that the bounce from 1.17 support is durable.
“We are not convinced that EUR/USD's bounce from 1.17 support is durable, especially as the real rate divergence between US and Germany persists, and likely to get wider into the fall.”
“EUR weakness is not unique to the USD, it is broadly based as the ECB's TWI measure (19 currencies) has weakened since June.”
U.S. stock-index futures edged down on Thursday, as investors assessed data that showed a higher-than-expected jump in producer prices for July and another decline in weekly jobless claims.
Global Stocks:
Index/commodity | Last | Today's Change, points | Today's Change, % |
Nikkei | 28,015.02 | -55.49 | -0.20% |
Hang Seng | 26,517.82 | -142.34 | -0.53% |
Shanghai | 3,524.74 | -7.88 | -0.22% |
S&P/ASX | 7,588.20 | +3.90 | +0.05% |
FTSE | 7,205.24 | -14.90 | -0.21% |
CAC | 6,884.82 | +26.83 | +0.39% |
DAX | 15,908.76 | +82.67 | +0.52% |
Crude oil | $68.94 | -0.45% | |
Gold | $1,750.30 | -0.17% |
(company / ticker / price / change ($/%) / volume)
3M Co | MMM | 201.71 | 0.14(0.07%) | 1071 |
ALCOA INC. | AA | 44.5 | -0.16(-0.36%) | 12857 |
ALTRIA GROUP INC. | MO | 48.25 | 0.08(0.17%) | 12165 |
Amazon.com Inc., NASDAQ | AMZN | 3,291.00 | -1.11(-0.03%) | 19740 |
American Express Co | AXP | 169.7 | -0.97(-0.57%) | 3704 |
AMERICAN INTERNATIONAL GROUP | AIG | 54.42 | 0.34(0.63%) | 37634 |
Apple Inc. | AAPL | 145.58 | -0.28(-0.19%) | 291331 |
AT&T Inc | T | 28.19 | 0.03(0.11%) | 35502 |
Boeing Co | BA | 240.2 | 0.71(0.30%) | 75582 |
Caterpillar Inc | CAT | 223.49 | 1.83(0.83%) | 38145 |
Chevron Corp | CVX | 102.76 | -0.09(-0.09%) | 12884 |
Citigroup Inc., NYSE | C | 74.44 | 0.14(0.19%) | 55401 |
Deere & Company, NYSE | DE | 387 | 0.92(0.24%) | 1579 |
E. I. du Pont de Nemours and Co | DD | 78 | -0.30(-0.38%) | 409 |
Exxon Mobil Corp | XOM | 57.54 | 0.06(0.10%) | 93952 |
Facebook, Inc. | FB | 358.28 | -1.68(-0.47%) | 33655 |
FedEx Corporation, NYSE | FDX | 276.5 | 0.23(0.08%) | 7768 |
Ford Motor Co. | F | 13.9 | -0.03(-0.22%) | 195446 |
Freeport-McMoRan Copper & Gold Inc., NYSE | FCX | 38.6 | -0.13(-0.34%) | 31929 |
General Electric Co | GE | 105.42 | -0.62(-0.58%) | 5802 |
General Motors Company, NYSE | GM | 54.25 | -0.02(-0.04%) | 41754 |
Goldman Sachs | GS | 414.25 | 0.36(0.09%) | 9600 |
Google Inc. | GOOG | 2,753.90 | 0.11(0.00%) | 3626 |
Hewlett-Packard Co. | HPQ | 30.11 | 0.01(0.03%) | 742 |
Home Depot Inc | HD | 337.5 | 0.50(0.15%) | 17232 |
HONEYWELL INTERNATIONAL INC. | HON | 233.2 | -0.05(-0.02%) | 1393 |
Intel Corp | INTC | 54.05 | -0.09(-0.17%) | 28993 |
International Paper Company | IP | 60.49 | 0.43(0.72%) | 447 |
JPMorgan Chase and Co | JPM | 161.65 | 0.49(0.30%) | 15963 |
Merck & Co Inc | MRK | 75.3 | 0.09(0.12%) | 6727 |
Microsoft Corp | MSFT | 286.2 | -0.75(-0.26%) | 42460 |
Pfizer Inc | PFE | 46.17 | -0.14(-0.30%) | 247175 |
Procter & Gamble Co | PG | 142.26 | -0.36(-0.25%) | 317 |
Starbucks Corporation, NASDAQ | SBUX | 116.69 | 0.19(0.16%) | 8275 |
Tesla Motors, Inc., NASDAQ | TSLA | 707.7 | -0.12(-0.02%) | 96977 |
The Coca-Cola Co | KO | 56.7 | -0.03(-0.05%) | 38954 |
Twitter, Inc., NYSE | TWTR | 65.36 | -0.10(-0.15%) | 20598 |
UnitedHealth Group Inc | UNH | 407.16 | -0.58(-0.14%) | 1146 |
Verizon Communications Inc | VZ | 55.63 | 0.06(0.11%) | 16282 |
Visa | V | 234 | -0.74(-0.32%) | 8095 |
Walt Disney Co | DIS | 178.46 | 0.37(0.21%) | 28047 |
Yandex N.V., NASDAQ | YNDX | 68.69 | 0.02(0.03%) | 270 |
The
Labor Department reported on Thursday the U.S. producer-price index (PPI) rose 1.0
percent m-o-m in July, the same pace as in June.
For the 12 months through July, the PPI surged 7.8 percent after an unrevised 7.3 percent climb in the previous month. That represented the largest increase since 12-month data were first calculated in November 2010.
Economists
had forecast the headline PPI would increase 0.6 percent m-o-m last month and 7.3
percent over the past 12 months.
According
to the report, nearly 3/4 of the July gain in the final demand index can be
traced to a 1.1-percent m-o-m advance in prices for final demand services. In
addition, the index for final demand goods increased 0.6 percent m-o-m.
Excluding
volatile prices for food and energy, the PPI rose 1.0 percent m-o-m and climbed
6.2 percent over 12 months. Economists had
forecast increases of 0.5 percent m-o-m and 5.6 percent y-o-y.
American Express (AXP) downgraded to Neutral from Outperform at Daiwa Securities; target $180
Visa (V) downgraded to Neutral from Outperform at Daiwa Securities; target $250
Micron (MU) downgraded to Equal-Weight from Overweight at Morgan Stanley; target $75
The
data from the Labor Department showed on Thursday the number of applications
for unemployment decreased in line with
forecasts last week.
According to the report, the initial claims for unemployment benefits fell by 12,000 to 375,000 for the week ended August 7. This was the lowest reading in four weeks.
Economists had expected 375,000 new claims last week.
Claims for the prior week were revised upwardly to 387,000 from the initial estimate of 385,000.
Meanwhile,
the four-week moving average of jobless claims rose to 396,250 from an upwardly
revised 394,500 in the previous week.
As
for continuing claims, they slipped to 2,866,000 from an upwardly revised 2,980,000
in the previous week. This was the lowest reading since March 2020.
FXStreet reports that economists at Credit Suisse suggest that USD/JPY is set to hold support at 110.10/00 for an eventual sustained break above 110.70.
“With 10yr US bond yields having completed a base and expected to rise further, we maintain our view that weakness in USD/JPY is temporary and we look for the cross to continue to move in line with yields.”
“Key support is seen starting at 110.23 and stretching down to 110.10/00 – the 13-day exponential average, 55-day average and the 38.2% retracement of the August rally.”
“We look for the 110.10/00 region to hold for an eventual sustained move above 110.70 to open the door to a challenge on long-term resistance starting at the 111.66 July YTD high and stretching up to the 112.40 high of 2019.”
| Time | Country | Event | Period | Previous value | Forecast | Actual |
|---|---|---|---|---|---|---|
| 06:00 | United Kingdom | Industrial Production (MoM) | June | 0.6% | 0.3% | -0.7% |
| 06:00 | United Kingdom | Manufacturing Production (YoY) | June | 28.2% | 13.5% | 13.9% |
| 06:00 | United Kingdom | Industrial Production (YoY) | June | 20.7% | 9.4% | 8.3% |
| 06:00 | United Kingdom | Manufacturing Production (MoM) | June | 0.1% | 0.4% | 0.2% |
| 06:00 | United Kingdom | Business Investment, q/q | Quarter II | -10.7% | 2.4% | |
| 06:00 | United Kingdom | Business Investment, y/y | Quarter II | -16.9% | 9.7% | |
| 06:00 | United Kingdom | GDP m/m | June | 0.6% | 0.8% | 1.0% |
| 06:00 | United Kingdom | Total Trade Balance | June | -0.2 | -2.5 | |
| 06:00 | United Kingdom | GDP, y/y | Quarter II | -6.1% | 22.1% | 22.2% |
| 06:00 | United Kingdom | GDP, q/q | Quarter II | -1.6% | 4.8% | 4.8% |
| 06:00 | United Kingdom | GDP, y/y | June | 24.5% | 14.9% | 15.2% |
| 08:00 | France | IEA Oil Market Report | ||||
| 09:00 | Eurozone | Industrial Production (YoY) | June | 20.6% | 10.4% | 9.7% |
| 09:00 | Eurozone | Industrial production, (MoM) | June | -1.1% | -0.2% | -0.3% |
GBP depreciated against most of its major rivals in the European session on Thursday, as the UK's in-line Q2 GDP data were not seen to be enough to make the Bank of England (BoE) change its monetary policy stance.
The Office for National Statistics (ONS) reported that Britain’s GDP grew by 4.8% q/q in the second quarter of 2021 after a 1.6% q/q contraction in the previous quarter, as activity and demand rebounded amid the easing of coronavirus restrictions. This was in line with economists’ expectations. On a y/y basis, the UK GDP surged by 22.2%, following a 6.1% decline in the first quarter. This marked the fastest pace of expansion on record and was broadly in line with economists’ forecast of a 22.1% growth. Despite solid Q2 expansion, the UK’s GDP was 4.4% below pre-pandemic levels.
Market participants said that they do not expect that the latest data will force the BoE to change its policy stance, as it is expected that the UK’s economic growth will slow down in the third quarter.
FXStreet reports that the outlook for iron ore demand continues to weaken amid restrictions on Chinese steel output and a slowing housing market. In the opinion of economists at ANZ Bank, this raises the downside risks for iron ore prices.
'The steel making raw material has been under pressure as China steps up efforts to reduce the steel industry’s impact on the environment. To reach the goal of producing less steel this year, output in H2 2021 would need to fall to 495mt, down 23% YoY.”
“Liquidity problems at China’s largest real estate developer, Evergrande, have brought back into focus the government’s efforts to cool the property market. As a means to improve its financials, the developer has cut prices and sped up construction on near completed projects to raise funds. This is likely behind the surge in residential buildings under construction. However, new developments have shown no signs of acceleration; and, with land sales low, this is unlikely to improve in the short-term.”
“Steel and iron ore demand are likely to weaken further in the second half of the year.”
FXStreet reports that the Credit Suisse analyst team notes that GBP/USD has completed a bullish “reversal day” from just ahead of its 200-day moving average (DMA) at 1.3773. However, the cable needs to close above its 55-DMA at 1.3920 to mark a low.
“GBP/USD weakness has been arrested at 1.3803, just ahead of the rising 200-day average at 1.3773 and the subsequent recovery has seen a bullish ‘reversal day’ established to suggest a low may be in place. Above price resistance at 1.3895 is needed to add weight to this view for a move back to the 55-day average at 1.3920.”
“A close above the 55-DMA at 1.3920 is needed to further increase the upside risk and potential basing process for 1.3956, then a fresh challenge on key ‘neckline’, price and 61.8% retracement resistance at 1.3978/1.4010.”
“A break above the 1.3978/1.4010 area would mark the completion of a ‘head & shoulders’ base and a more important turn higher for 1.4099/1.4104 initially and eventually back to the 1.4249 YTD high.”
- Says Saudi Arabia increased output by 547k bpd as voluntary cuts phase out
- Raises forecasts for world economic growth in 2021 and 2022
- Sees global economy growing by 5.6% this year, up from 5.5% previously forecast
- Sees 2021, 2022 global oil demand growth forecasts unchanged
- Reiterates that it expects oil market to tighten in 2H 2022
FXStreet reports that according to Karen Jones, Team Head FICC Technical Analysis Research at Commerzbank, the strong rebound off the 1.12 support seen in the U.S. 10-year yields implies an interim low is in place. A push higher is expected.
“The US 10Y yield has again tested and held over the February 10 low at 1.12 and the sharp rebound from here implies that this may be an interim low. We would also highlight that the market has remained underpinned by the 55-week ma at 1.157 and generally we are looking for another leg higher.”
“The recovery is well-placed to test resistance at 1.43/46 (the May low and mid-July high) and should it be overcome we would allow for another attempt on the short-term downtrend and the April low and the late June high at 1.52/55. A close above here would re-target the 1.78 April high.”
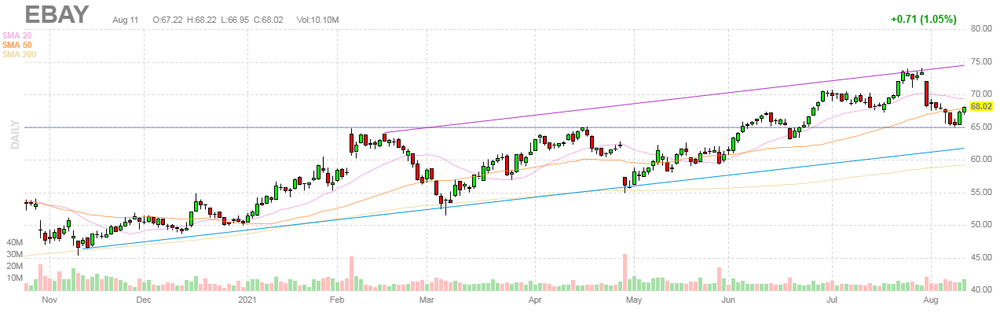
eBay (EBAY) reported Q2 FY 2021 earnings of $0.99 per share (versus $1.08 per share in Q2 FY 2020), beating analysts’ consensus estimate of $0.95 per share.
The company’s quarterly revenues amounted to $2.700 bln (+15.5% y/y), missing analysts’ consensus estimate of $2.857 bln.
The company also guided Q3 FY 2021 EPS in line with analysts’ consensus estimate, and revenues below analysts’ consensus estimate.
EBAY fell to $66.93 (-1.60%) in pre-market trading.
FXStreet notes that USD/JPY remains capped below 110.50. However, economists at Westpac still see a push towards 111.70/ 112.20 but further positive news needs to unfold.
“We maintain the view that USD/JPY is stuck in a broad range – unable to push much above 110.50, unwilling to push much below 109.25. To be sure, the 108.72 mid last week tested the lower end of that range in a pretty material way. But the speed with which we bounced back reinforces the near-term outlook.”
“The big test for us will come late August and then late September. Does Powell lay out a pathway to taper at Jackson Hole Aug 26-28 and then follow up with a formal announcement Sep 21-22.”
“We still see a push towards 111.70/112.20. However, such a move requires further positive news to unfold e.g. infrastructure plans be approved and thus likely delayed until the fall."
Baidu (BIDU) reported Q2 FY 2021 earnings of RMB14.73 per share (versus RMB14.73 per share in Q2 FY 2020), beating analysts’ consensus estimate of RMB13.36 per share.
The company’s quarterly revenues amounted to RMB31.550 bln (+21.2% y/y), beating analysts’ consensus estimate of RMB31.020 bln.
BIDU fell to $164.39 (-0.34%) in pre-market trading.

Reuters reports that the Nikkei business daily said that Japan's government will create a new indicator aimed at reflecting the country's progress in reducing greenhouse gas emissions compared with its GDP.
Japan's greenhouse gas emissions have been declining in recent years, the Nikkei said without saying where it got its information, adding that the new measure will show the country's decarbonisation efforts from an economic growth perspective.
But an official at the Cabinet Office, which is also in charge of calculating GDP, said nothing had been decided about releasing a new indicator on a regular basis in the future, describing the Nikkei's report as inaccurate.
The Cabinet Office was only looking at ways to assess carbon neutrality-related statistics, but its research was still in the early stages while it may stretch out over multiple years, the official said.
FXStreet reports that in the view of analysts at Westpac, dips on the US Dollar Index (DXY) are likely limited to 91.5-92.0.
“July’s emphatic payrolls gain underscores an economy that is finding its reopening groove despite ongoing reopening constraints and an expanding 4th Delta Covid wave. The Fed’s centre of gravity is shifting, doves (Evans) and centrists (VC Chair Clarida and SF President Daly) voicing support for a scaling back of stimulus. Fed officials likely continue to drop more explicit hints in coming weeks, markets likely to focus on the upcoming Jackson Hole symposium and the Sep FOMC meeting. DXY should continue to find support in the 91.5-92.0 area and as taper talk rises to a crescendo in Q3 could see new highs beyond 93.50.”
According to estimates from Eurostat, in June 2021, the seasonally adjusted industrial production fell by 0.3% in the euro area and by 0.2% in the EU, compared with May 2021. Economists had expected a 0.2% decrease in the euro area. In May 2021, industrial production fell by 1.1% in the euro area and by 0.9% in the EU. In June 2021 compared with June 2020, industrial production increased by 9.7% in the euro area and by 10.5% in the EU. Economists had expected a 10.4% increase in the euro area.
In the euro area in June 2021, compared with May 2021, production of capital goods fell by 1.5% and energy by 0.6%, while production of durable consumer goods and intermediate goods both rose by 0.1% and non-durable consumer goods by 1.6%. In the EU, production of capital goods fell by 1.2% and energy by 0.2%, while production of intermediate goods rose by 0.2%, durable consumer goods by 0.5% and non-durable consumer goods by 1.4%.
In the euro area in June 2021, compared with June 2020, production of durable consumer goods rose by 16.1%, intermediate goods by 15.7%, non-durable consumer goods by 9.8%, capital goods by 6.3% and energy by 2.9%. In the EU, production of durable consumer goods rose by 16.4%, intermediate goods by 16.1%, non-durable consumer goods by 8.9%, capital goods by 8.1% and energy by 3.9%.
According to the report from the National Institute of Statistics (ISTAT), in June 2021 seasonally-adjusted data, compared to May 2021, increased by +1.4% for outgoing flows and by +1.9% for incoming flows. Exports raised for both EU countries (+2.5%) and non EU countries (+0.2%). Imports increased by +2.4% for EU countries and by +1.2% for non EU countries.
Over the last three months, seasonally-adjusted data, compared to the previous three months, increased by +5.0% for exports and by +7.3% for imports.
In June 2021, compared with the same month of the previous year, both exports and imports grew (+25.4% and +32.6% respectively). Outgoing flows increased by +27.3% for EU countries and by +23.4% for non EU countries. Incoming flows rose by +33.7% for EU area and by +31.2% for non EU area. The trade balance in June 2021 amounted to +5,681 million Euros (+879 million Euros for EU countries and +4,802 million Euros for non EU countries).
In June 2021, import prices increased by 0.6% on monthly basis (+0.3% for the euro zone, +0.7% for the non-euro zone). Import prices, compared to the same month a year ago, increased by 9.5% in June 2021 (+6.4% for the euro zone and +12.4% for the non-euro zone).
Reuters reports that the International Energy Agency said that rising demand for oil abruptly reversed course in July and is set to proceed more slowly for the rest of the year.
"Growth for the second half of 2021 has been downgraded more sharply, as new COVID-19 restrictions imposed in several major oil consuming countries, particularly in Asia, look set to reduce mobility and oil use," the IEA said.
"We now estimate that demand fell in July as the rapid spread of the COVID-19 Delta variant undermined deliveries in China, Indonesia and other parts of Asia," it said in its monthly oil report.
The IEA put the demand slump last month at 120,000 barrels per day (bpd) and predicted growth would be half a million bpd lower in the second half of the year compared to its estimate last month, noting some changes were due to revisions in data.
Bloomberg reports that the figures from the Royal Institution of Chartered Surveyors showed that U.K. house prices are likely to surge further in the next year because of a shortage of new properties coming onto the market.
The figures suggest that the expiration of a tax break on purchases will do little to slow what’s been a red-hot market. It’s one of the signals that inflation is picking up across the U.K. and starting to alarm policy makers at the Bank of England.
RICS said the number of estate agents seeing new properties come to market in July fell to its lowest since April 2020. A balance of 66% of respondents to the survey expected prices to rise in the next year, up 10 points from June. Areas far from city centers benefited most, notably the north of England, Wales and East Anglia.
A net balance of 79% of property appraisers saw an increase in prices in July, just shy of the 82% reading the month before.
The average asking price of apartments has climbed about 1% since the start of the pandemic while detached houses rose 10%.
The number of agreed sales of flats rose 14% in June and July from the year before and were 24% higher than the same months in 2019.
FXStreet reports that economists at MUFG Bank said that widening regulatory curbs from China are damaging the Asian and commodity related currencies.
“The latest new credit data from China revealed that credit growth expanded at its slowest pace since February 2020. The official China Securities Journal newspaper reported earlier this month that the growth rate of outstanding credit may bottom out and rebound in the fourth quarter of this year, providing a signal that policy setting may begin to turn more supportive for growth in China.”
“The release yesterday of a five year-year blueprint from the State Council and Communist Party’s Central Committee stating that they would ‘actively’ work on legislation in areas including national security, technology and monopolies is a further concern. The latest developments from China are continuing to create a less favourable backdrop for Asian and commodity-related currency performance.”
| Time | Country | Event | Period | Previous value | Forecast | Actual |
|---|---|---|---|---|---|---|
| 06:00 | United Kingdom | Industrial Production (MoM) | June | 0.6% | 0.3% | -0.7% |
| 06:00 | United Kingdom | Manufacturing Production (YoY) | June | 28.2% | 13.5% | 13.9% |
| 06:00 | United Kingdom | Industrial Production (YoY) | June | 20.7% | 9.4% | 8.3% |
| 06:00 | United Kingdom | Manufacturing Production (MoM) | June | 0.1% | 0.4% | 0.2% |
| 06:00 | United Kingdom | Business Investment, q/q | Quarter II | -10.7% | 2.4% | |
| 06:00 | United Kingdom | Business Investment, y/y | Quarter II | -16.9% | 9.7% | |
| 06:00 | United Kingdom | GDP m/m | June | 0.6% | 0.8% | 1.0% |
| 06:00 | United Kingdom | Total Trade Balance | June | -0.2 | -2.5 | |
| 06:00 | United Kingdom | GDP, y/y | Quarter II | -6.1% | 22.1% | 22.2% |
| 06:00 | United Kingdom | GDP, q/q | Quarter II | -1.6% | 4.8% | 4.8% |
| 06:00 | United Kingdom | GDP, y/y | June | 24.5% | 14.9% | 15.2% |
During today's Asian trading, the US dollar was trading steadily against the euro and the yen and rose slightly against the pound. Meanwhile, the US dollar index was held near the highest level in four months.
Many analysts still expect that the US Federal Reserve System (Fed) will announce a tightening of monetary policy this year, which in the future may support the dollar.
The pound fell slightly against the dollar. The UK economy in the second quarter of 2021 increased by 4.8% compared to the previous three months, according to preliminary data from the National Statistics Office (ONS). Relative to April-June 2020, GDP grew by 22.2%. Analysts predicted an increase of 4.8% in quarterly terms and 22.1% per annum.
The ICE index, which tracks the dynamics of the dollar against six currencies (euro, swiss franc, yen, canadian dollar, pound sterling and swedish krona), rose by 0.01%.
eFXdata reports that ING Research discusses USD/JPY outlook.
"Our bond strategy team feel that thin summer conditions and heavy Fed buying are behind drops in US yields – such that the move will be reversed in September. That could keep $/JPY supported. We targets the USD/JPY at 111, 113, and 115 in 1-, 3-, and 12-months. Probably the biggest risk to USD/JPY now is that the Delta variant shuts down Asia and especially China more broadly – prompting a re-assessment of global growth and equity valuations. But that seems a risk case at present. Instead, a Fed sounding quietly confident can see US money market rates & $/JPY firm up," ING adds.
CNBC reports that gold prices recovered slightly from a sharp fall earlier this week, but analysts are still pessimistic on the outlook for the precious metal going forward.
On Sunday evening, gold prices dropped to a four month low of $1,677.9 per ounce. The metal was hovering around $1,750 per ounce Thursday morning trade, still off its highs earlier this year of around $1,900.
Analysts pegged the fall to a stronger-than-expected U.S. jobs report as well as a rush to buy the dollar in response.
“The initial sell‑off in the gold price on Monday was likely triggered by the Asian market buying the US dollar and selling gold in response to the strong US payrolls for July from last Friday,” Vivek Dhar, commodities analyst at the Commonwealth Bank of Australia, said.
While gold has since recovered some losses, Dhar said it was “difficult to remain bullish on the precious metal,” given the hawkish outlook for U.S. monetary policy.
The Federal Reserve is expected to dial back monetary easing and slow its stimulus efforts as the economy recovers from the pandemic. The U.S. central bank has held rates near zero, but officials have signaled that hikes could happen soon, especially with inflation running hot.
“A stronger US dollar combined with a gradual increase in US 10 [year] real yields suggest that gold prices should trend lower,” Dhar wrote.
He predicts that gold prices will fall to $1,700 per ounce by the first quarter of 2022. Meanwhile, Dominic Schnider, chief investment officer at UBS Global Wealth Management, forecast that gold could see drops to $1,600 per ounce or lower.
EUR/USD
Resistance levels (open interest**, contracts)
$1.1836 (1413)
$1.1807 (600)
$1.1770 (110)
Price at time of writing this review: $1.1739
Support levels (open interest**, contracts):
$1.1709 (2507)
$1.1688 (2304)
$1.1660 (5101)
Comments:
- Overall open interest on the CALL options and PUT options with the expiration date September, 3 is 84558 contracts (according to data from August, 11) with the maximum number of contracts with strike price $1,2000 (8587);
GBP/USD
$1.3995 (1631)
$1.3965 (395)
$1.3920 (210)
Price at time of writing this review: $1.3868
Support levels (open interest**, contracts):
$1.3801 (619)
$1.3776 (434)
$1.3746 (1103)
Comments:
- Overall open interest on the CALL options with the expiration date September, 3 is 14635 contracts, with the maximum number of contracts with strike price $1,4300 (2189);
- Overall open interest on the PUT options with the expiration date September, 3 is 12320 contracts, with the maximum number of contracts with strike price $1,3800 (1103);
- The ratio of PUT/CALL was 0.84 versus 0.81 from the previous trading day according to data from August, 11
* - The Chicago Mercantile Exchange bulletin (CME) is used for the calculation.
** - Open interest takes into account the total number of option contracts that are open at the moment.
The Office for National Statistics said that monthly production fell by 0.7% between May 2021 and June 2021 meaning output was 3.2% below its February 2020 level, the last month of "normal" trading conditions prior to the coronavirus (COVID-19) pandemic. Economists had expected a 0.3% increase between May and June.
The fall in production was led by decreases of 11.9% in mining and quarrying and 1.9% in electricity and gas; these were offset partially by a 0.2% rise in manufacturing and a 1.1% rise in water supply and sewerage.
The 0.2% rise in manufacturing over the month was driven by an increase in output in 8 of the 13 manufacturing subsectors and was led by a rise of 7.4% in the manufacture of transport equipment; this was offset partially by a fall of 12.4% in the manufacture of basic pharmaceutical products subsector.
Production output for Quarter 2 (Apr to June) 2021 increased by 0.5% compared with Quarter 1 (Jan to Mar) 2021.
The COVID-19 pandemic has had a generally negative impact on production output, although each sector has been affected differently.
Manufacturing output remains 2.3% below its February 2020 level, and mining and quarrying is 31.6% below; electricity and gas is now 5.3% above its February 2020 level, and water supply and sewerage is 4.6% above.
According to the report from Office for National Statistics, UK gross domestic product (GDP) is estimated to have increased by 4.8% in Quarter 2 (Apr to June) 2021, following the easing of coronavirus (COVID-19) restrictions. Monthly estimates show that GDP increased across all three months at 2.2% in April, 0.6% in May and 1.0% in June 2021. Economists had expected a 0.8% increase in June.
There was an increase in services output of 5.7% in Quarter 2 2021, having contracted by 2.1% in Quarter 1 (Jan to Mar) 2021. Services output is now 3.5% below Quarter 4 (Oct to Dec) 2019 levels. Wholesale and retail trade, accommodation and food service activities, and education provided the largest quarterly contributions to services output growth. Production output rose by 0.5% in Quarter 2 2021, following a fall of 0.5% in the previous quarter, and remains 3.3% below its pre-coronavirus pandemic level. The increase in production output in Quarter 2 2021 was driven mainly by a 1.8% rise in manufacturing, in particular that of food products, beverages and tobacco, and machinery and equipment. Construction output increased by 3.3% in Quarter 2 2021, reflecting a rise in new work (3.7%), particularly infrastructure, and repair and maintenance (with growth of 1.7%). Construction has now nearly recovered to pre-pandemic levels, with output in Quarter 2 2021 at 0.6% below Quarter 4 2019 levels.
In output terms, the largest contributors to GDP increase in Quarter 2 were from wholesale and retail trade, accommodation and food service activities, and education.
The level of GDP is now 4.4% below where it was pre-coronavirus pandemic at Quarter 4 (Oct to Dec) 2019.
In Quarter 2 2021, there were increases in nearly all main components of expenditure apart from "trade", with the largest contribution from household consumption, which contributed 4.1 percentage points to the 4.8% increase following the easing of coronavirus restrictions in Quarter 2 2021 compared with Quarter 1 (Jan to Mar) 2021.
| Raw materials | Closed | Change, % |
|---|---|---|
| UKBrent | 71.55 | 0.95 |
| Silver | 23.514 | 0.79 |
| Gold | 1751.348 | 1.26 |
| Palladium | 2630.22 | -0.54 |
| Time | Country | Event | Period | Previous value | Forecast |
|---|---|---|---|---|---|
| 01:30 (GMT) | Australia | Wage Price Index, y/y | Quarter II | 0.6% | |
| 01:30 (GMT) | Australia | Wage Price Index, q/q | Quarter II | 1.5% | |
| 06:00 (GMT) | United Kingdom | Manufacturing Production (YoY) | June | 27.7% | 13.5% |
| 06:00 (GMT) | United Kingdom | Industrial Production (MoM) | June | 0.8% | 0.3% |
| 06:00 (GMT) | United Kingdom | Industrial Production (YoY) | June | 20.6% | 9.4% |
| 06:00 (GMT) | United Kingdom | Manufacturing Production (MoM) | June | -0.1% | 0.4% |
| 06:00 (GMT) | United Kingdom | Business Investment, q/q | Quarter II | -10.7% | |
| 06:00 (GMT) | United Kingdom | Business Investment, y/y | Quarter II | -16.9% | |
| 06:00 (GMT) | United Kingdom | GDP m/m | June | 0.8% | 0.8% |
| 06:00 (GMT) | United Kingdom | Total Trade Balance | June | 0.9 | |
| 06:00 (GMT) | United Kingdom | GDP, y/y | Quarter II | -6.1% | 22.1% |
| 06:00 (GMT) | United Kingdom | GDP, q/q | Quarter II | -1.6% | 4.8% |
| 06:00 (GMT) | United Kingdom | GDP, y/y | June | 24.6% | 14.9% |
| 08:00 (GMT) | France | IEA Oil Market Report | |||
| 09:00 (GMT) | Eurozone | Industrial Production (YoY) | June | 20.5% | 10.4% |
| 09:00 (GMT) | Eurozone | Industrial production, (MoM) | June | -1% | -0.2% |
| 12:30 (GMT) | U.S. | Continuing Jobless Claims | July | 2930 | 2880 |
| 12:30 (GMT) | U.S. | PPI, y/y | July | 7.3% | 7.3% |
| 12:30 (GMT) | U.S. | PPI, m/m | July | 1% | 0.6% |
| 12:30 (GMT) | U.S. | PPI excluding food and energy, m/m | July | 1% | 0.5% |
| 12:30 (GMT) | U.S. | PPI excluding food and energy, Y/Y | July | 5.6% | 5.6% |
| 12:30 (GMT) | U.S. | Initial Jobless Claims | August | 385 | 375 |
| 13:00 (GMT) | United Kingdom | NIESR GDP Estimate | July | 4.8% | |
| 22:30 (GMT) | New Zealand | Business NZ PMI | July | 60.7 | |
| 22:45 (GMT) | New Zealand | Visitor Arrivals | June | 2531.6% |
| Pare | Closed | Change, % |
|---|---|---|
| AUDUSD | 0.73712 | 0.36 |
| EURJPY | 129.61 | 0.07 |
| EURUSD | 1.17385 | 0.19 |
| GBPJPY | 153.099 | 0.11 |
| GBPUSD | 1.38634 | 0.2 |
| NZDUSD | 0.70368 | 0.49 |
| USDCAD | 1.25031 | -0.11 |
| USDCHF | 0.92051 | -0.21 |
| USDJPY | 110.405 | -0.11 |


© 2000-2026. All rights reserved.
This site is managed by Teletrade D.J. LLC 2351 LLC 2022 (Euro House, Richmond Hill Road, Kingstown, VC0100, St. Vincent and the Grenadines).
The information on this website is for informational purposes only and does not constitute any investment advice.
The company does not serve or provide services to customers who are residents of the US, Canada, Iran, The Democratic People's Republic of Korea, Yemen and FATF blacklisted countries.
Making transactions on financial markets with marginal financial instruments opens up wide possibilities and allows investors who are willing to take risks to earn high profits, carrying a potentially high risk of losses at the same time. Therefore you should responsibly approach the issue of choosing the appropriate investment strategy, taking the available resources into account, before starting trading.
Use of the information: full or partial use of materials from this website must always be referenced to TeleTrade as the source of information. Use of the materials on the Internet must be accompanied by a hyperlink to teletrade.org. Automatic import of materials and information from this website is prohibited.
Please contact our PR department if you have any questions or need assistance at pr@teletrade.global.
transfers