- Analytics
- News and Tools
- Market News
CFD Markets News and Forecasts — 13-08-2021
On Monday, a t 02:00 GMT, China will announce changes in the volume of investments in fixed assets, the volume of industrial production and the volume of retail trade for July. At 04:30 GMT, Japan will report on the change in industrial production for June. At 10:00 GMT in Germany, the Bundesbank's monthly report will be released. At 12:30 GMT, Canada will announce changes in the volume of production supplies and the volume of wholesale trade for June. Also at 12:30 GMT, the US will release the index of activity in the manufacturing sector from the Federal Reserve of New York for August. At 20:00 GMT, the US will announce changes in the net and total volume of purchases of long-term US securities by foreign investors for June.
On Tuesday, at 01:30 GMT, Australia will present the minutes of the RBA's monetary policy meeting. At 04:30 GMT, Japan will release the index of activity in the service sector for June. At 06:00 GMT, Britain will report changes in the number of applications for unemployment benefits, the unemployment rate and average earnings for July. At 09:00 GMT, the eurozone will announce changes in the volume of GDP and the level of employment for the 2nd quarter. At 12:15 GMT, Canada will announce a change in the housing starts for July. At 12:30 GMT, Canada will report on the change in the foreign securities purchases for June. Also at 12:30 GMT, the US will announce a change in the volume of retail trade for July. At 13:15 GMT, the United States will report changes in industrial production and the capacity utilization for July. At 14:00 GMT, the US will announce changes in the business inventories for June and will release the NAHB housing market index for August. At 22:45 GMT, New Zealand will present the producer price index for the 2nd quarter. At 23:50 GMT, Japan will report changes in the volume of orders for machinery and equipment for June and the foreign trade balance for July.
On Wednesday, at 00:30 GMT, in Australia, the leading economic indicators for July and the labor cost index for the 2nd quarter will be released . At 02:00 GMT, in New Zealand, the RBNZ interest rate decision will be announced, and at 03:00 GMT, the RBNZ press conference will be held. At 06:00 GMT, Britain will publish the consumer price index, the retail price index, the producer purchase price index and the producer selling price index for July. At 09:00 GMT, the eurozone will release the consumer price index for July. At 12:30 GMT, Canada will present the consumer price index for July. Also at 12: 30 GMT, the United States will announce changes in the construction permits and the housing starts for July. At 14:30 GMT, the US will report on the change in oil reserves according to the Ministry of Energy. At 18:00 GMT in the US, the minutes of the Fed meeting will be published.
On Thursday, at 01:30 GMT, Australia will announce changes in the unemployment rate and the number of people employed for July. At 08:00 GMT, the eurozone will report on the change in current account for June. At 11:30 GMT, in the eurozone, the ECB's report on the monetary policy meeting will be released. At 12:30 GMT, the US will announce a change in the number of initial applications for unemployment benefits and will release the Fed-Philadelphia manufacturing index for August. At 14:00 GMT, the US will present the index of leading indicators for July. At 23:01 GMT, Britain will publish the GfK consumer confidence indicator for August. At 23:30 GMT, Japan will release the consumer price index for July.
On Friday, at 06:00 GMT, Britain will announce changes in the volume of retail trade and the net amount of borrowed funds of the public sector for July. Also at 06:00 GMT, Switzerland will report a change in the foreign trade balance for July. In addition, at 06:00 GMT, Germany will release the producer price index for July. At 12:30 GMT, Canada will announce a change in retail sales for June. At 17:00 GMT, in the United States, the Baker Hughes report on the number of active oil drilling rigs will be released.
FXStreet reports that economists at ING suggest that the USD/CAD pair may slide below the 1.25 level next week.
“In the week ahead, the focus will be on July’s inflation data in Canada. We don’t think that small deviations from the 3.1% June read (especially if headline inflation stays above 3.0%) will have a material market impact.”
“Despite having fallen short of consensus, the July jobs report showed more gains on the employment side, which are enough in our view to leave the Bank of Canada on track to end its asset purchase programme by the end of the year.”
“USD/CAD could again explore sub-1.2500 levels next week as long as oil prices continue to show some resilience.”
eFXdata reports that analysts at MUFG Research discuss their expectations for next week's RBNZ policy meeting.
"In light of the stronger labour market data for Q2 and lingering concerns over financial stability risks from the domestic housing market, we now expect the RBNZ to begin rate hikes at next week’s (Wed) meeting. There is even the non-negligible risk of a larger 0.50 point hike. Policy communication over the need for further rate hikes will be important as well given the market has moved to price in over 100bps of hikes in the year ahead."
"Any setback for the NZD should prove short-lived. We expect at least two rate hikes from the RBNZ before the end of this year well ahead of the RBA which is not planning to hike rates until 2024."
A
report from the University of Michigan revealed on Friday the preliminary
reading for the Reuters/Michigan index of consumer sentiment tumbled 13.5
percent m-o-m to 70.2 in early August. This was the lowest reading since December
2011.
Economists
had expected the index would come in at 81.2 this month, unchanged from July’s
final reading.
According
to the report, the index of current U.S. economic conditions plunged 7.8
percent m-o-m to 77.9 in August from 84.5 in the previous month. Meanwhile, the
index of consumer expectations plummeted 17.5 percent m-o-m to 65.2 this month
from 79.0 in July.
According
to Surveys of Consumers chief economist, Richard Curtin, the losses in early
August were widespread across income, age, and education subgroups and observed
across all regions and covered all aspects of the economy, from personal
finances to prospects for the economy, including inflation and unemployment. “There
is little doubt that the pandemic's resurgence due to the Delta variant has been
met with a mixture of reason and emotion,” Curtin said. “Consumers have correctly
reasoned that the economy's performance will be diminished over the next
several months, but the extraordinary surge in negative economic assessments
also reflects an emotional response, mainly from dashed hopes that the pandemic
would soon end. In the months ahead, it is likely that consumers will again
voice more reasonable expectations, and with control of the Delta variant,
shift toward outright optimism.”
FXStreet notes that S&P 500 is pushing above the top of the 4436/56 zone as the market extends its low volatility grind higher. According to economists at Credit Suisse, a break above trend resistance from April at 4472/75 is needed to keep the trend directly higher.
“A bullish ‘outside day’ for S&P 500 although on very low ‘summer’ volume as the market extends its relentless low volatility grind higher. This sees the market pushing just above the top of our 4436/56 Q3 objective zone, but with strength still capped for now by trend resistance from April, today seen at 4472/75.”
“Whilst we look for a fresh pullback from 4475, a direct break can see the immediate risk stay higher for a move to the psychological 4500 level next, with the upper end of its ‘typical’ extreme (15% above the 200-day average) now at 4570/80.”
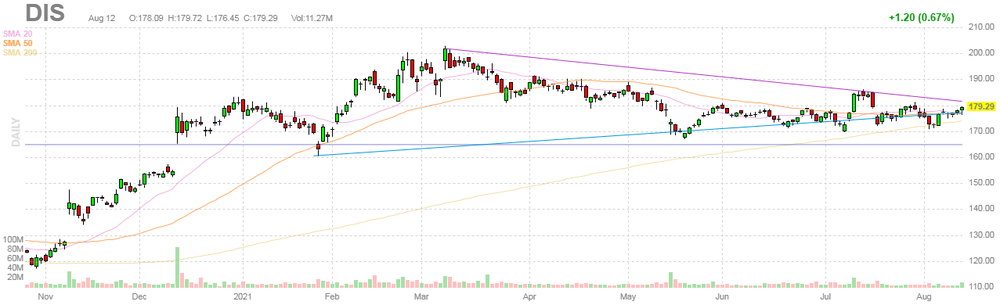
U.S. stock-index futures traded little changed on Friday, as investors assessed Walt Disney’s (DIS; +4.6%) earnings report and the prospects of the Fed’s policy path amid signs of easing inflation.
Global Stocks:
Index/commodity | Last | Today's Change, points | Today's Change, % |
Nikkei | 27,977.15 | -37.87 | -0.14% |
Hang Seng | 26,391.62 | -126.20 | -0.48% |
Shanghai | 3,516.30 | -8.44 | -0.24% |
S&P/ASX | 7,628.90 | +40.70 | +0.54% |
FTSE | 7,220.69 | +27.46 | +0.38% |
CAC | 6,901.33 | +18.86 | +0.27% |
DAX | 15,991.16 | +53.65 | +0.34% |
Crude oil | $68.84 | -0.36% | |
Gold | $1,762.60 | +0.62% |
FXStreet reports that economists at Société Générale expect EUR/CHF to extend its rebound on a break above the 1.0870/1.0900 region.
“A sharp rebound has taken shape and the EUR/CHF pair is heading towards the potential resistance zone of 1.0870/1.0900 representing June low and the 200-DMA. This hurdle must be overcome for a meaningful bounce.”
“Failure to hold above 1.0770, the 61.8% retracement of the rebound can lead to revisit of recent low at 1.0718/1.0700.”
(company / ticker / price / change ($/%) / volume)
ALCOA INC. | AA | 45.25 | 0.10(0.22%) | 7145 |
ALTRIA GROUP INC. | MO | 48.18 | 0.06(0.12%) | 4424 |
Amazon.com Inc., NASDAQ | AMZN | 3,302.00 | -1.50(-0.05%) | 5298 |
American Express Co | AXP | 168.75 | 0.23(0.14%) | 883 |
Apple Inc. | AAPL | 148.93 | 0.04(0.03%) | 515482 |
AT&T Inc | T | 28.01 | -0.01(-0.04%) | 44583 |
Boeing Co | BA | 237.48 | -0.70(-0.29%) | 19118 |
Caterpillar Inc | CAT | 220.7 | 0.46(0.21%) | 4511 |
Chevron Corp | CVX | 102.5 | -0.14(-0.14%) | 17562 |
Cisco Systems Inc | CSCO | 56.45 | 0.06(0.11%) | 8259 |
Citigroup Inc., NYSE | C | 74.19 | 0.06(0.08%) | 23698 |
Exxon Mobil Corp | XOM | 57.14 | -0.21(-0.37%) | 26460 |
Facebook, Inc. | FB | 362.29 | -0.36(-0.10%) | 13572 |
FedEx Corporation, NYSE | FDX | 275.5 | -0.60(-0.22%) | 268 |
Freeport-McMoRan Copper & Gold Inc., NYSE | FCX | 38.45 | 0.06(0.16%) | 15980 |
General Electric Co | GE | 106.51 | -0.01(-0.01%) | 3978 |
General Motors Company, NYSE | GM | 54.5 | -0.12(-0.22%) | 9618 |
Goldman Sachs | GS | 415.55 | 0.55(0.13%) | 7231 |
Google Inc. | GOOG | 2,764.00 | -3.79(-0.14%) | 1975 |
Hewlett-Packard Co. | HPQ | 30.35 | -0.05(-0.16%) | 363 |
Home Depot Inc | HD | 334 | -0.02(-0.01%) | 2688 |
HONEYWELL INTERNATIONAL INC. | HON | 232 | 0.06(0.03%) | 646 |
Intel Corp | INTC | 53.57 | 0.03(0.06%) | 36060 |
International Business Machines Co... | IBM | 143 | -0.07(-0.05%) | 871 |
JPMorgan Chase and Co | JPM | 161.6 | -0.19(-0.12%) | 5412 |
McDonald's Corp | MCD | 236.8 | 0.13(0.06%) | 1272 |
Merck & Co Inc | MRK | 76.4 | 0.36(0.47%) | 22326 |
Microsoft Corp | MSFT | 289.14 | -0.67(-0.23%) | 32238 |
Pfizer Inc | PFE | 47.47 | 0.23(0.49%) | 217209 |
Procter & Gamble Co | PG | 143 | 0.05(0.04%) | 627 |
Starbucks Corporation, NASDAQ | SBUX | 115.95 | 0.20(0.17%) | 7394 |
Tesla Motors, Inc., NASDAQ | TSLA | 722 | -0.25(-0.03%) | 142597 |
The Coca-Cola Co | KO | 56.88 | 0.04(0.07%) | 6792 |
Twitter, Inc., NYSE | TWTR | 64.85 | -0.10(-0.15%) | 8092 |
UnitedHealth Group Inc | UNH | 406 | 0.04(0.01%) | 406 |
Verizon Communications Inc | VZ | 55.68 | 0.04(0.07%) | 5568 |
Visa | V | 232.11 | 0.32(0.14%) | 8612 |
Wal-Mart Stores Inc | WMT | 149.66 | 0.60(0.40%) | 3989 |
Walt Disney Co | DIS | 187.32 | 8.03(4.48%) | 499984 |
Yandex N.V., NASDAQ | YNDX | 67.83 | 0.12(0.18%) | 384 |
Morgan Stanley (MS) downgraded to Neutral from Buy at Seaport Global Securities
The
Labor Department reported on Friday the import-price index, measuring the cost
of goods ranging from Canadian oil to Chinese electronics, rose 0.3 percent
m-o-m in July, following a revised 1.1 percent m-o-m gain in June (originally a
1.0 percent m-o-m advance). This was the smallest
monthly advance since November 2020. Economists had expected prices to increase
0.6 percent m-o-m last month.
According
to the report, the July gain was driven by higher fuel prices (+2.9 percent
m-o-m), while prices for nonfuel imports were flat.
Over the 12-month period ended in July, import prices jumped 10.2 percent, with higher fuel (+66.5 percent) and nonfuel (+6.3 percent) prices contributing to the surge.
Meanwhile, the price index for U.S. exports rose 1.3 percent m-o-m in July, following an unrevised 1.2 percent m-o-m increase in the previous month. U.S. export prices have not recorded a monthly decrease since April 2020. Economists had forecast export prices to move up 0.8 percent m-o-m in June.
The July
gain was driven by higher nonagricultural export prices (+1.6 percent m-o-m) that
more than offset lower agricultural export prices (-1.7 percent m-o-m; the
first monthly drop since August 2020).
Over the past 12 months, the price index for exports surged 17.2 percent, reflecting climbs in prices of both agricultural exports (+29.2 percent) and nonagricultural exports (+15.8 percent).
| Time | Country | Event | Period | Previous value | Forecast | Actual |
|---|---|---|---|---|---|---|
| 06:30 | Switzerland | Producer & Import Prices, y/y | July | 2.9% | 3.3% | |
| 06:45 | France | CPI, y/y | July | 1.5% | 1.2% | 1.2% |
| 06:45 | France | CPI, m/m | July | 0.1% | 0.1% | 0.1% |
| 09:00 | Eurozone | Trade balance unadjusted | June | 12.3 | 18.1 |
USD depreciated against most of its major rivals in the European session on Friday, as investors shrugged off inflation concerns.
The U.S. Dollar Index (DXY), measuring the U.S. currency's value relative to a basket of foreign currencies, declined 0.24% to 92.81.
July’s inflation readings were mixed. The consumer price data indicated that inflation may be peaking, while the producer prices surprised to the upside, recording the largest annual gain in more than a decade. It seems, however, that market participants did not consider higher prices for producers an issue to worry about.
Signals that inflation is moderating suggest that there is no need for the Federal Reserve to rush with its tapering plans. Nonetheless, Reuters’ poll shows that a solid majority of economists believe that the Fed might announce a plan to taper its $120 billion in monthly bond purchases in September.
In addition, several representatives of the U.S. central bank, who spoke earlier this week, expressed views that the withdrawal of monetary stimulus should begin in the fourth quarter.
FXStreet reports that analysts at OCBC Bank suggest that USD/JPY is to maintain a positive bias while trading above the 110.00 level.
“The USD/-JPY pair held steady despite the broader USD advance.”
“Near-term support remains at 110.00.”
“So long as 110.00 holds, the pair retains a positive momentum.”
FXStreet reports that Karen Jones, Team Head FICC Technical Analysis Research at Commerzbank, expects some recovery in EUR/GBP in the near-term with next resistance seen at the 0.8529 mark.
“EUR/GBP has severed its near term downtrend and is expected to correct higher near-term.”
“Initial resistance is the 20-day ma at 0.8529 and the 55-day ma at 0.8561 and the market will remain on the defensive while capped here.”
FXStreet notes that AUD/USD sold off on Canberra going into a 7-day lockdown. Economists at OCBC Bank suggest that a break below the 0.7290 mark would expose the 0.7200 level.
“The surprise lockdown in Canberra adds a near-term negative for the AUD/USD.
“The recent range lows at 0.7290 are in focus, and any breach of that support opens the path towards 0.7200 and 0.7000 in a multi-week horizon.”
- Does not expect a sustained increase in inflation
- Sees positive underlying momentum of overall economy persisting
- Sees two-speed economy with services sector benefiting from easing of restrictions, industry sector to be hit by supply bottlenecks
FXStreet reports that economists at Société Générale expect the GBP/USD to tackle the 1.3750 level.
“GBP/USD struggled near the daily Ichimoku cloud at 1.4000 after which a pullback is underway.”
“Cable is gradually drifting towards 200-DMA near 1.3750. In case this gets violated, the pair could retest last month's low of 1.3570.”
Walt Disney (DIS) reported Q3 FY 2021 earnings of $0.80 per share (versus $0.08 per share in Q3 FY 2020), beating analysts’ consensus estimate of $0.55 per share.
The company’s quarterly revenues amounted to $17.022 bln (+44.5% y/y), beating analysts’ consensus estimate of $16.761 bln.
DIS rose to $188.31 (+5.03%) in pre-market trading.
Reuters reports that data, published by the statistics office (SCB), showed that headline inflation in Sweden ticked up marginally in July, though price pressure is unlikely to affect central bank policy when rate-setters return from their summer recess.
Consumer prices in Sweden, measured with a fixed interest rate, rose 0.3 percent in July from the previous month and were up 1.7 percent from the same month last year. Higher electricity prices had the biggest impact on inflation. Stripping out energy prices, inflation was 0.5%. The Riksbank targets 2% headline inflation.
With Sweden's economy already back to pre-pandemic levels, the Riksbank has called time on its bond purchases, which are due to stop at the end of the year.
Rate hikes, however, look to be years off, though some policymakers are eyeing possible tightening toward the end of the current forecast horizon, which stretches to the third quarter of 2024.
Bloomberg reports that Hong Kong’s home prices jumped to a record high, joining other global real estate markets.
Values for resale houses rose 0.65% for the week ended Aug. 8, according to Centaline Property Agency Ltd.. The last record for the firm’s price index was set in mid-2019 at the beginning of anti-government protests. Residential property values have increased 8.6% since the beginning of the year.
Outsized demand, limited supply and low borrowing costs have fueled the world’s most expensive property market.
The abundance of liquidity has also resulted in soaring prices in other major financial centers around the world. U.S. residential property prices jumped the most in 30 years in April. Home prices in New Zealand, one of the world’s hottest markets, have risen for 31 straight months.
The rising prices also signal that a potential exodus of residents to the U.K. via a new visa program hasn’t hurt the real estate market in Hong Kong. In addition to the strong demand from local buyers, mainland Chinese investors are helping boost the market.
Prices are expected to keep rising. Cushman & Wakefield expects home values to climb another 5% in the second half of the year.
According to the report from Eurostat, the first estimate for euro area exports of goods to the rest of the world in June 2021 was €209.9 billion, an increase of 23.8% compared with June 2020 (€169.6 bn), a month which had been affected by the COVID-19 containment measures widely introduced by the Member States. Imports from the rest of the world stood at €191.8 bn, a rise of 28.2% compared with June 2020 (€149.6 bn). As a result, the euro area recorded a €18.1 bn surplus in trade in goods with the rest of the world in June 2021, compared with +€20.0 bn in June 2020. Intraeuro area trade rose to €188.0 bn in June 2021, up by 24.6% compared with June 2020.
In January to June 2021, euro area exports of goods to the rest of the world rose to €1 172.5 bn (an increase of 15.5% compared with January-June 2020), and imports rose to €1 070.1 bn (an increase of 15.2% compared with January-June 2020). As a result the euro area recorded a surplus of €102.5 bn, compared with +€86.0 bn in January June 2020. Intra-euro area trade rose to €1 047.8 bn in January-June 2021, up by 20.3% compared with January-June 2020.
RTTNews reports that final data from the statistical office INE showed that Spain's consumer prices increased in July, as initially estimated.
Consumer prices increased 2.9 percent year-on-year in July, following a 2.9 percent increase in June, as estimated. On a monthly basis, consumer prices fell 0.8 percent in July, following a 0.5 percent increase in the prior month. In the initial estimate, prices fell 0.7 percent.
Inflation based on the harmonized index of consumer prices, rose 2.9 percent annually in July, following a 2.5 percent increase in June as initially estimated. The HICP declined 1.2 percent monthly in July, following a 0.5 percent in the previous month, as estimated.
Bloomberg reports that asian buyers are snapping up cheap U.S. crude cargoes despite lingering demand concerns due to the latest Covid-19 resurgence.
Chinese, Indian and South Korean companies have purchased at least 7 million barrels this month for arrival through October to November, said traders who buy and sell that crude. The level of interest for U.S. oil has been higher than the same period in July as prices for American grades were trimmed with the summer travel season winding down and domestic demand dipping, they said.
Middle Eastern producers, however, hiked crude prices for Asian customers this month, even as the fast-spreading delta variant led to renewed restrictions on movement across the region, most notably in China. The resurgence has led to the International Energy Agency cutting its global oil demand estimates for the rest of this year, while predicting a new surplus in 2022.
While offers for U.S. oil have gained slightly recently, they are still competitive against comparable grades from the Middle East and Russia’s Far East, said the traders.
FXStreet reports that Jane Foley, Senior FX Strategist at Rabobank, expects the AUD/NZD to edge lower towards parity.
“This week iron ore futures pushed towards a four month low. This factor along with further covid related lockdowns have increased the bearish signals for the AUD.”
“Depending on the outcome of next week’s RBNZ meeting, there is scope for AUD/NZD to drop further towards the 1.00 level on a 3 to 6 month view.”
“Even with tapering after November, RBA remains accommodative with no rate rise potentially until 2024. By contrast the RBNZ could be poised to hike rates as soon as next week.”
“Although the December 2020 low in the 1.04 area is likely to offer strong support we expect the downtrend in AUD/NZD has further to run.”
According to the report from Destatis, in July 2021 the selling prices in wholesale trade rose by 11.3% compared with July 2020. This was the highest monthly annual rate of change since October 1974 after the first oil crisis (+13.2% compared with October 1973). In June 2021 and in May 2021 the annual rates of change had been +10.7% and +9.7%, respectively. The high rates of increase are partly due to a base effect as a result of the very low price level of the previous year's months in connection with the corona crisis and many currently increased prices for raw materials and precursors. Wholesale sales prices rose by 1.1% in July 2021 compared to the previous month.
In July 2021, the biggest impact on the rate of change in the wholesale price index compared to the same month of the previous year was the increase in the price of ores, metals and semi-finished metals wholesale (+59.2 %).
Particularly strong price increases compared to the previous year were also recorded in the wholesale trade of used and residual materials (+95.6 %), of raw and sawn timber (+59.9 %) and of petroleum products (+34.3 %). Cereals, raw tobacco, seeds and feed were also significantly more expensive (+20.7%) compared with the previous year. Lower than in July 2020 were prices in the wholesale of data processing equipment, peripheral equipment and software (-2,3%).
| Time | Country | Event | Period | Previous value | Forecast | Actual |
|---|---|---|---|---|---|---|
| 06:30 | Switzerland | Producer & Import Prices, y/y | July | 2.9% | 3.3% | |
| 06:45 | France | CPI, y/y | July | 1.5% | 1.2% | 1.2% |
| 06:45 | France | CPI, m/m | July | 0.1% | 0.1% | 0.1% |
During today's Asian trading, the US dollar fell slightly against the main world currencies.
The ICE index, which tracks the dynamics of the dollar against six currencies (euro, swiss franc, yen, canadian dollar, pound sterling and swedish krona), fell by 0.05%. Nevertheless, the index remains near the maximum value since the beginning of April.
Traders are waiting for signals from the US Federal Reserve System (Fed) about its plans to curtail stimulus measures.
Statistics published yesterday showed that the number of applications for unemployment benefits in the United States fell for the third week in a row. The number of Americans who applied for unemployment benefits for the first time last week decreased by 12 thousand - to 375 thousand people, according to the report of the Ministry of Labor. This is the minimum level since the end of June.
Producer prices in the United States in July jumped by 7.8% compared to the same month a year earlier, according to data from the Ministry of Labor of the country. This is the maximum growth rate since the beginning of the calculation of the indicator in November 2010.
Several Fed officials this week have spoken in favor of the regulator beginning to roll back stimulus it has put in place to support the economy amid the coronavirus pandemic.
According to the report from Insee, in July 2021, the Consumer Price Index (CPI) rose by 0.1% over one month, as in June. The prices of services accelerated at +0.7% after +0.1%, as well of those of energy (+2.2% after +1.1%). The food prices rebounded (+0.1% after −0.7%). The prices of manufactured goods dropped (−1.8% after +0.5%) as well as of tobacco prices to a lesser extent (−0.2% after being stable in June). Seasonally adjusted, consumer prices rose by 0.4% in July, after +0.2% in June.
Year on year, consumer prices slowed down to 1.2%, after +1.5% in June. This decline in inflation was driven by the fall back of the prices of manufactured goods (−1.1% after +0.7%), linked to the postponed summer sales, the decrease of the prices of services (+0.6% after +0.8%) and of those of tobacco (+5.1% after +5.3%). Contrariwise, the prices of energy accelerated (+12.3% after +10.9%) and those of food rebounded (+0.9% after −0.2%).
Year on year, core inflation fell in July, down to +0.4%, after +1.1% in June. The Harmonised Index of Consumer Prices (HICP) rose by 0.1% over one month after +0.2% in the previous month; year-on-year, it increased by 1.5%, after +1.9% in June.
EUR/USD
Resistance levels (open interest**, contracts)
$1.1830 (1449)
$1.1799 (915)
$1.1760 (99)
Price at time of writing this review: $1.1738
Support levels (open interest**, contracts):
$1.1707 (2507)
$1.1687 (2621)
$1.1660 (5124)
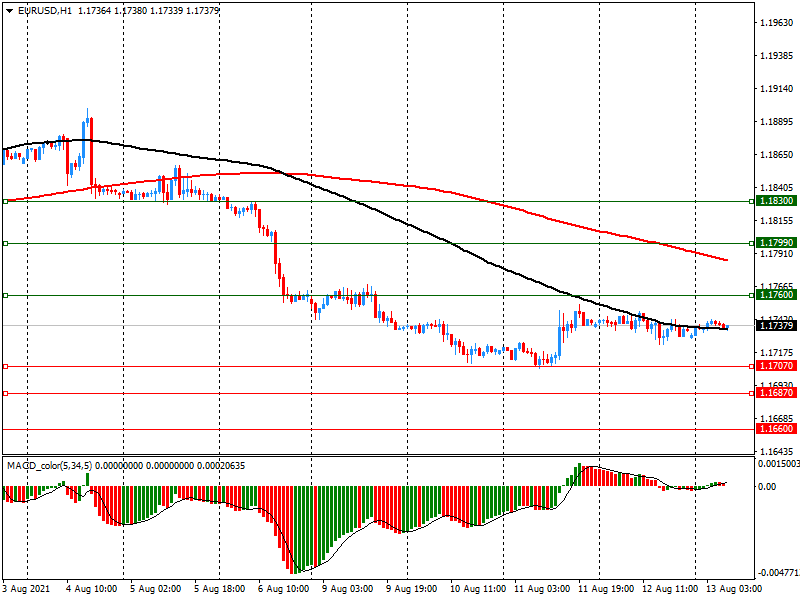
Comments:
- Overall open interest on the CALL options and PUT options with the expiration date September, 3 is 85896 contracts (according to data from August, 12) with the maximum number of contracts with strike price $1,2000 (8587);
GBP/USD
$1.3972 (1633)
$1.3935 (551)
$1.3876 (210)
Price at time of writing this review: $1.3807
Support levels (open interest**, contracts):
$1.3748 (434)
$1.3725 (1105)
$1.3696 (905)
Comments:
- Overall open interest on the CALL options with the expiration date September, 3 is 14841 contracts, with the maximum number of contracts with strike price $1,4300 (2169);
- Overall open interest on the PUT options with the expiration date September, 3 is 12701 contracts, with the maximum number of contracts with strike price $1,3800 (1105);
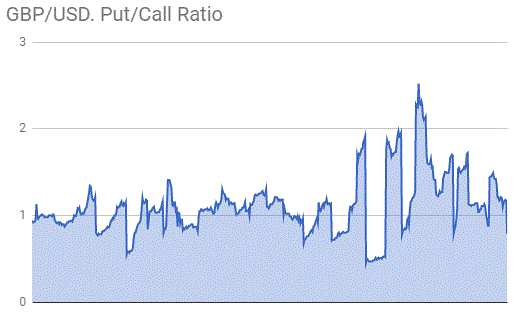
- The ratio of PUT/CALL was 0.86 versus 0.84 from the previous trading day according to data from August, 12
* - The Chicago Mercantile Exchange bulletin (CME) is used for the calculation.
** - Open interest takes into account the total number of option contracts that are open at the moment.
Reuters reports that Goldman Sachs said a recent call by the U.S. to OPEC+ to boost oil output is unlikely to result in higher production over the short-term given the threat to demand from the coronavirus Delta variant.
"We don't see the recent White House statement as threatening the current market deficit nor the pace of the rebalancing in 2H21," Goldman Sachs said, maintaining their year-end Brent forecast at $80 per barrel.
However, Goldman noted an additional hike in OPEC+ production by the year-end is required to counter recent supply disappointments globally and expects OPEC+ spare capacity to be fully normalized by spring 2022.
Last month, OPEC+ agreed to boost oil supply from August to cool prices that have climbed to 2-1/2 year highs.
The U.S. bank recently lowered its oil demand forecast for China, citing rising concerns over the spread of Delta variant.
RTTNews reports that data released by the statistical office Insee showed that French unemployment rate dropped marginally in the second quarter.
The ILO jobless rate dropped to 8 percent in the second quarter from 8.1 percent in the first quarter. The rate was forecast to fall to 7.9 percent.
The number of unemployed people decreased 16,000 from the previous quarter to 2.4 million in the second quarter.
On average in the second quarter, the employment rate of people aged 15 to 64 increased by 0.3 points to 66.9 percent, after remaining stable at the beginning of 2021.
Employment returned to its pre-crisis level and stood at its highest level since INSEE began measuring it on a quarterly basis in 2003.
| Raw materials | Closed | Change, % |
|---|---|---|
| UKBrent | 71.18 | -0.46 |
| Silver | 23.163 | -1.49 |
| Gold | 1752.788 | 0.09 |
| Palladium | 2621.24 | -0.34 |
| Time | Country | Event | Period | Previous value | Forecast |
|---|---|---|---|---|---|
| 06:30 (GMT) | Switzerland | Producer & Import Prices, y/y | July | 2.9% | |
| 06:45 (GMT) | France | CPI, y/y | July | 1.5% | 1.2% |
| 06:45 (GMT) | France | CPI, m/m | July | 0.1% | 0.1% |
| 09:00 (GMT) | Eurozone | Trade balance unadjusted | June | 7.5 | |
| 12:30 (GMT) | U.S. | Import Price Index | July | 1% | 0.6% |
| 14:00 (GMT) | U.S. | Reuters/Michigan Consumer Sentiment Index | August | 81.2 | 81.2 |
| 17:00 (GMT) | U.S. | Baker Hughes Oil Rig Count | August | 387 |
| Pare | Closed | Change, % |
|---|---|---|
| AUDUSD | 0.73351 | -0.5 |
| EURJPY | 129.505 | -0.08 |
| EURUSD | 1.17299 | -0.08 |
| GBPJPY | 152.457 | -0.43 |
| GBPUSD | 1.3809 | -0.43 |
| NZDUSD | 0.7 | -0.52 |
| USDCAD | 1.25219 | 0.15 |
| USDCHF | 0.92303 | 0.27 |
| USDJPY | 110.396 | -0.01 |


© 2000-2026. All rights reserved.
This site is managed by Teletrade D.J. LLC 2351 LLC 2022 (Euro House, Richmond Hill Road, Kingstown, VC0100, St. Vincent and the Grenadines).
The information on this website is for informational purposes only and does not constitute any investment advice.
The company does not serve or provide services to customers who are residents of the US, Canada, Iran, The Democratic People's Republic of Korea, Yemen and FATF blacklisted countries.
Making transactions on financial markets with marginal financial instruments opens up wide possibilities and allows investors who are willing to take risks to earn high profits, carrying a potentially high risk of losses at the same time. Therefore you should responsibly approach the issue of choosing the appropriate investment strategy, taking the available resources into account, before starting trading.
Use of the information: full or partial use of materials from this website must always be referenced to TeleTrade as the source of information. Use of the materials on the Internet must be accompanied by a hyperlink to teletrade.org. Automatic import of materials and information from this website is prohibited.
Please contact our PR department if you have any questions or need assistance at pr@teletrade.global.
transfers