- Analytics
- News and Tools
- Market News
CFD Markets News and Forecasts — 11-10-2021
- EUR/USD remains muted in the early Asian session on Tuesday.
- The pair remains pressured near 1.1550 tracking the gains in the US dollar.
- Momentum oscillator holds onto oversold zone warns caution on aggressive bids.
EUR/USD continues to trade in a sell-off mode following the previous session’s lacklustre moves on Tuesday morning. The pair confides in a very narrow trade band with a downside risk ahead of the eurozone data. At the time of writing, EUR/USD is trading at 1.1549, down 0.02% for the day.
EUR/USD daily chart
-637695916021536860.png)
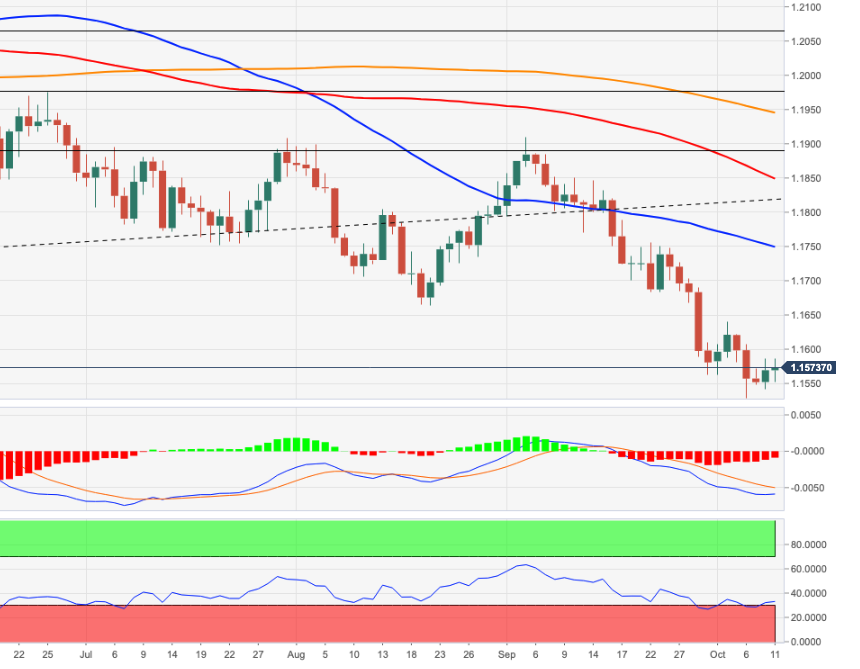
On the daily chart, the EUR/USD pair has come under renewed selling pressure after testing the highs near 1.1900 since the beginning of the September series (September 3). The pair ended the month breaking below the yearly lows around 1.1600. The October series too started on a lower note while dragging the price further near 2021 lows.
Having said that, if the price sustains intraday’s low, it could reverse some of its losses and trace back to the previous day’s high at 1.1586. Furthermore, the Moving Average Convergence Divergence (MACD) indicator offers potential for more upside as it remains in the oversold zone with stretched selling conditions for quite some time. Any uptick in the MACD would amplify the buying toward the 1.1600 and the 1.1650 horizontal resistance levels.
Alternatively, if the price reverses direction, the EUR/USD bears would once again dominate the trend with their eyes on Wednesday’s low of 1.1529. The price action would then target the weekly lows of July 24, 2020, at 1.1402.
EUR/USD additional levels
North Korean Leader Kim Jong Un has said that his nation will keep strengthening military power and there is no reason to believe that the US is not hostile.
The comments come as the country ramps up its missile testing activity in recent weeks while making conditional peace offers to Seoul, reviving a pattern of pressuring South Korea to get what it wants from the United States.
Nuclear negotiations between the US and N.Korea have stalled for more than two years over disagreements in exchanging the release of crippling US-led sanctions against North Korea and the North’s denuclearization steps.
There has been no reaction to the headline but markets are anxious over the deterorating relations between Washington and Pyongyang.
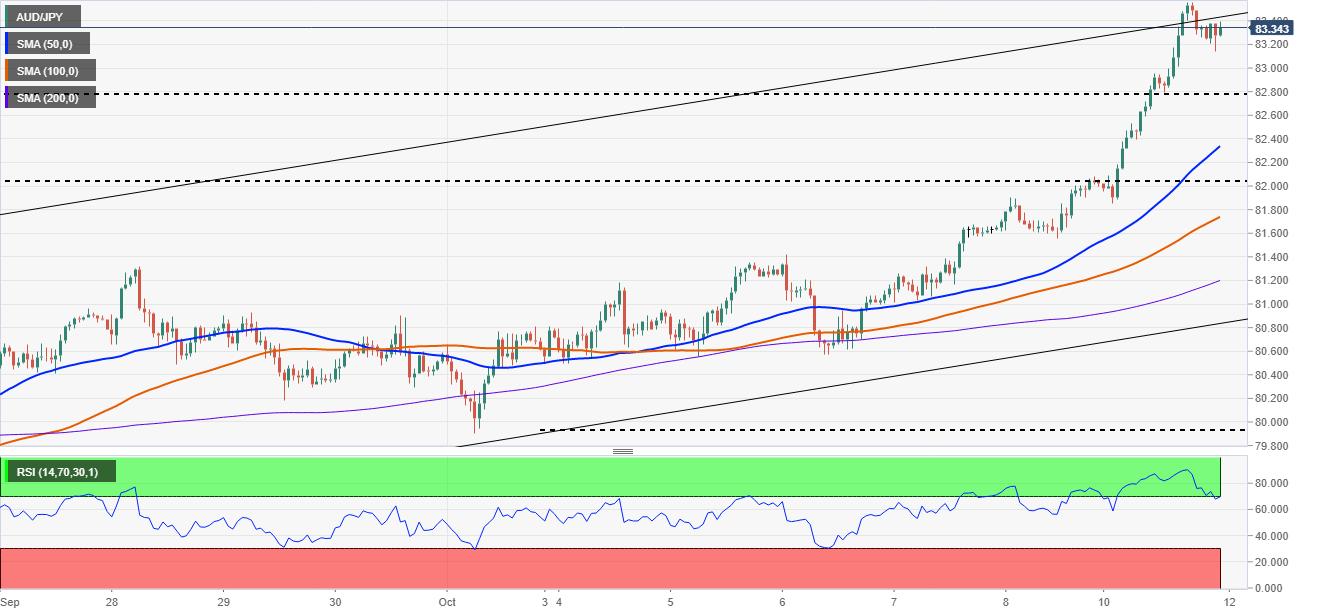
- AUD/JPY reaches a fresh three-month high around the 83.50 range.
- On Monday, the cross-currency broke the 200-day moving average, suggesting upside bias prevails.
- AUD/JPY: The daily chart depicts that the pair might consolidate or correct lower before resuming the uptrend.
The AUD/JPY is trading lower as the Asian session kicks in and is trading at 83.34, barely down 0.06%, during the day at the time of writing. The market mood is mixed, as depicted by Asian equity futures, split between gainers and losers.
AUD/JPY Price Forecast: Technical outlook
Daily chart
On Monday, the AUD/JPY reached 83.56 (the middle of the Andrew Pitchfork channel) but found intense selling pressure, retreating towards 83.24. A breach of the latter could accelerate an upside move towards the July 6 high at 84.19, but oversold levels at the Relative Strength Index (RSI) at 71, suggests the pair could be headed for a correction towards the 200-day moving average (DMA) at 82.37, before resuming a move towards higher prices. Nevertheless, in case of a push below the 200-DMA, the September 3 high at 82.02 will be the next support before reaching the 100-DMA at 81.83.

1-hour chart
The AUD/JPY is trading within a narrow range between 83.00-83.55. A break above the top of the range could open the way towards a re-test of the Monday high at 83.55. However, the Relative Strength Index is in oversold levels at 71, suggesting that an upside move could be capped at those levels. Failure to an upside break could signal that consolidation or a correction could lie ahead for the AUD/JPY in the near term.
On the flip side, a break beneath the bottom level will find the daily pivot at 82.87 as the first support level. A breach beneath the latter would exert downward pressure on the pair towards the confluence of the 50-simple moving average (SMA) and the S1 pivot level around the 82.33-82.18 area.
- USD/JPY extends the previous session’s gains on Tuesday.
- US dollar trades near yearly highs at 94.35 with 0.32% gains.
- Fed’s tapering and higher inflation concerns keep USD/JPY elevated.
USD/JPY prints fresh daily gains Tuesday in the early Asian trading session. The pair pierced above 113.00 in the previous session with more than 100-pips movement with the strong greenback gains. At the time of writing, USD/JPY is trading at 113.39, up 0.08% for the day.
The US Dollar Index (DXY), which tracks the performance of the greenback against six major currencies, trades near 94.40 with 0.32% gains. Investors remain concerned about higher energy prices and expectations of the Fed’s tapering timeline.
On the other hand, the Japanese yen remained on the backfoot after the Bank of Japan (BOJ) survey showed Japanese households expect prices to rise and economic conditions to worsen a year from now. The economy remained in deflation for the 11th straight month in August.
As for now, traders are waiting for Japan’s Producer Price Index (PPI) data, and US JOLTS Job openings to gauge the market sentiment.
USD/JPY additional levels
- NZD/USD grinds lower on Tuesday in the early Asian session.
- US Dollar Index near one-year high above 94.30 exerting pressure on NZD/USD.
- COVID-19 restrictions, risk-aversion, high inflation woes check kiwi nerves.
NZD/USD surrenders the previous session’s gains on Tuesday in the Asian session. The buying pressure in the US dollar keeps NZD/USD edgy. At the time of writing, NZD/USD is trading at 0.6933, down 0.12% for the day,
The US Dollar Index (DXY), which measures the greenback performance against its six major rivals, trades at 94.37 near its highest since September 2020. The greenback attracts the capital flows on its safe-haven appeal amid surging energy prices, which fuels the inflationary pressure. In addition to that, Fed’s remains unfazed by the disappointing NFP data as expectations of tapering as early as November stands strong.
On the other hand, Kiwi lost its momentum on reduced risk appetite among investors in the wake of the latest COVID-19 restrictions and mixed economic data. In the latest development, New Zealand’s Prime Minister Jacinda Arden announced that Auckland will remain in alert level 3, step 1, for at least one more week whereas Waikato and Northland will stay in alert level 3 until October, 14. It is worth noting that S&P 500 Futures is trading at 4,347,25, down 0.80% for the day.
On the economic data side, the visitors arrival in New Zealand fell to 30209 in July from 51590 in June. Electronic card transactions rose to 0.9% in September.
As for now, all eyes are on the US JOLTS Job opening data to take fresh trading impetus.
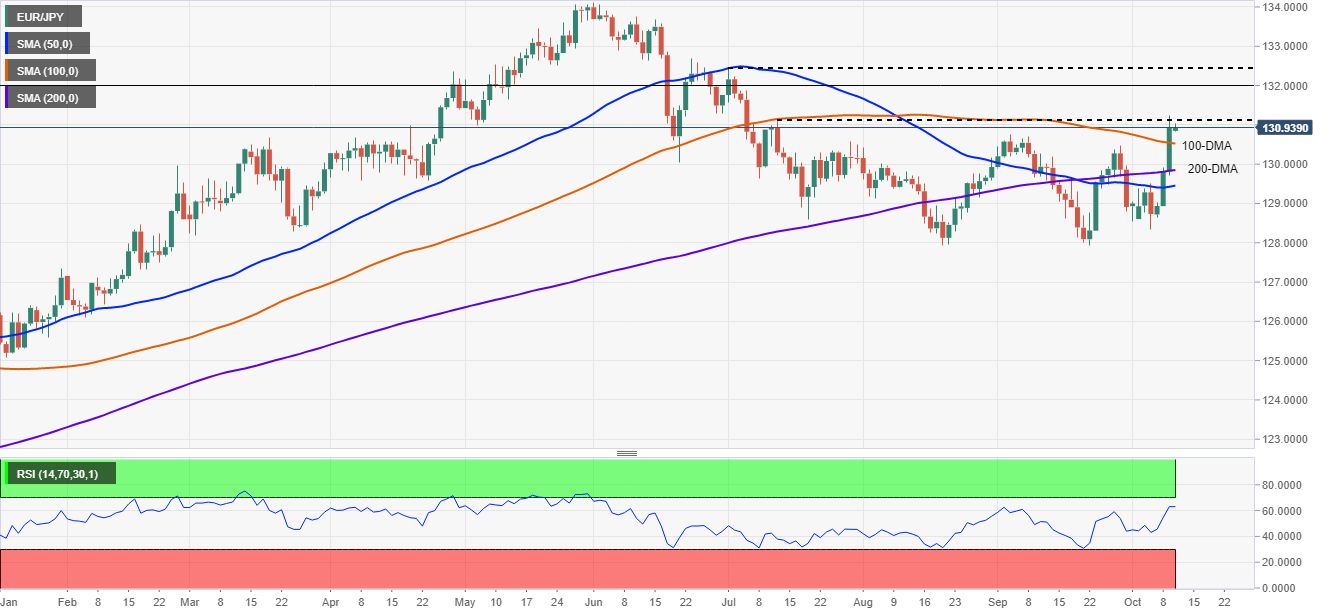
- The EUR/JPY approaches the 131.00 figure amid a risk-off environment.
- The euro followed the British pound path, rising against the Japanese yen.
- EUR/JPY: From a technical perspective, the cross-currency is in an uptrend.
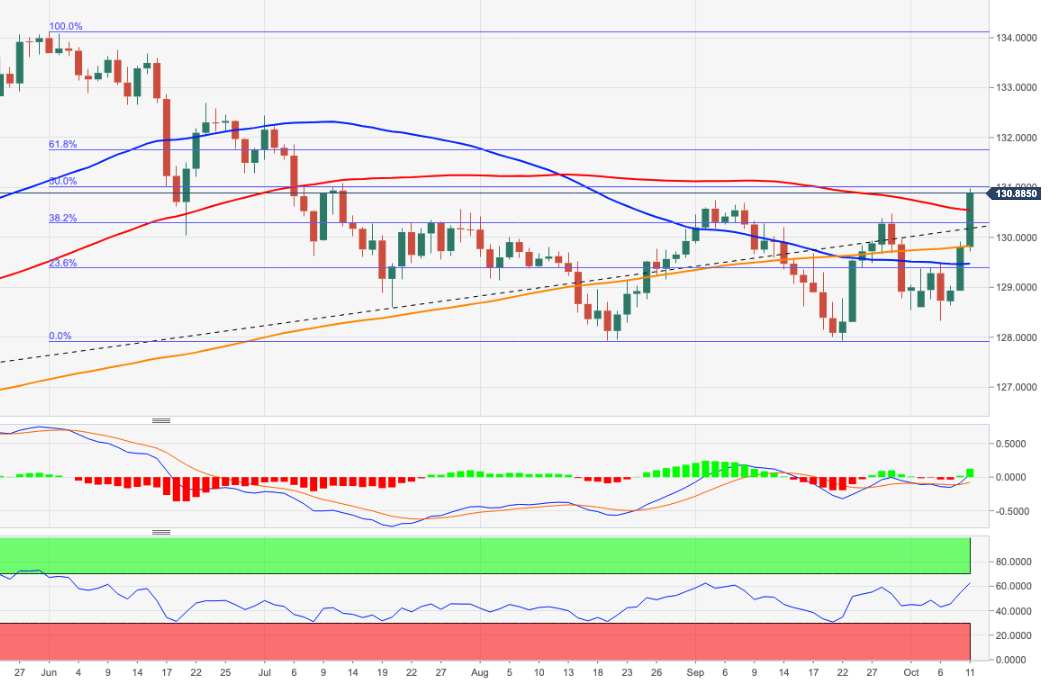
The EUR/JPY is rallying near the 131.00 thresholds, advances almost 1% during the day, trading at 130.93 at the time of writing. A risk-off market sentiment, as witnessed by US stocks indices which posted losses between 0.69% and 0.72%, failed to boost the safe-haven status of the Japanese yen, which was not able to gain traction against any of the G8 currencies.
Meanwhile, the single currency followed the British pound footsteps on the back of hawkish comments made by the Bank of England members, who expressed worries about inflation, and readiness to hike interest rates sooner than foreseen, despite continuing their bond purchasing program.
EUR/JPY Price Forecast: Technical outlook
Daily chart
The EUR/JPY is trading above the 200-day moving average (DMA). The abovementioned signals that the pair could be headed for higher prices, as the 200-DMA indicates the major trend. A daily close above the latter could open the way for further gains. The first resistance level would be the July 13 high at 131.08. A breach of that level could open the door for further gains. The following resistance level would be the July 1 high at 132.42 and the June 1 high at 134.117.
On the flip side, failure at 131.00 could push the cross-currency towards 130.00. In that case, the 200-DMA at 129.80 would be the first support. A breach of that level opens the door for a test of crucial demand levels at the 50-DMA at 129.39, followed by the October 8 low at 128.86.
The Relative Strength Index (RSI) is at 63. As it is located above the 50-midline, meaning that the EUR/JPY has an upside bias.
KEY ADDITIONAL LEVELS TO WATCH
- Gold consolidates at the start of the week but breakout on the cards.
- US dollar picks up a safe-haven bid towards three-year highs.
The price of gold on Monday was consolidating at daily support between a low of $1,750.24 and a high of $1,761.09. Inflation and consumer spending data is going to be critical for the days ahead leading into the Federal Reserve.
Meanwhile, the US dollar has been bid to start the week while investors remain cautious over the surging energy prices around the world which have kicked off a flow into safer havens, such as the greenback. DXY, a measure of the US dollar vs a basket of major rival currencies rallied towards a one-year high of 94.504 touched earlier this month. DXY hit 94.40 on the day. Investors are monitoring for further signs in the US economic recovery that will prompt the US Federal Reserve to announce a tapering of its bond purchases next month.
Meanwhile, oil prices surged on Monday to multi-year peaks, fueled by the rebound in global demand and this has weighed on US stocks as investors fear global supply-chain backlogs. US fixed income markets are closed on Monday for a holiday but the yield on benchmark 10-year Treasuries hit a four-month high of 1.617% on Friday, even after data showed the US economy created the fewest jobs in nine months in September, missing forecasts. Nevertheless, inflation worries remain elevated which is fuelling the prospects that the Fed will have to start to reduce its emergency stimulus begun last year.
Gold's compelling upside story
''Looking beyond Fed pricing, higher wages and no rise in participation rate will keep the stagflation theme alive, and gold could be an ideal hedge against these rising stagflationary winds,'' analysts at TD Securities argued.
''As the global energy crisis intensifies, impacting the production of goods across the world and supply chains across Europe and Asia, reasons to own the yellow metal are growing more compelling,'' the analysts added, ''Indeed, as these issues fuel concerns of slowing demand and rising inflation, price action across rates in recent trading sessions suggest that global macro is just starting to price in implications of the energy crisis. ''
Also, the analysts at TD Securities explained that, ''the Post-Fed move higher in rates was led by real rates, whereas it is now being led by breakevens, suggesting the market is pricing in higher inflation due to the spike in energy, but acknowledging that this is a supply-shock which impacts growth negatively.''
''In turn, with positioning in the yellow metal increasingly short, including CTAs, potential strength in gold due to this growing stagflationary narrative could spark aggressive short covering on the horizon.''
Gold technical analysis
- Gold Chart of the Week: XAU/USD bulls step in
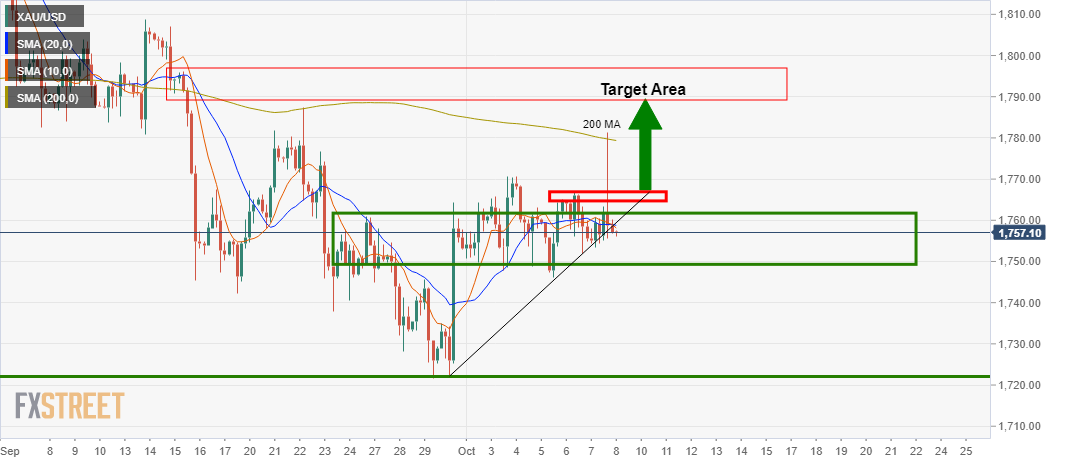
As illustrated on the chart above in analysis at the Asian open this week, from a 4-hour perspective, in targeting towards the 200-MA and prior structure above it, ''gold bulls would be prudent to see the price make a move in the direction of the target to break the near term resistance around $1,770. In engaging above this area, there is a higher probability of a bullish continuation for gold this week.''
Live market, 4-hour chart
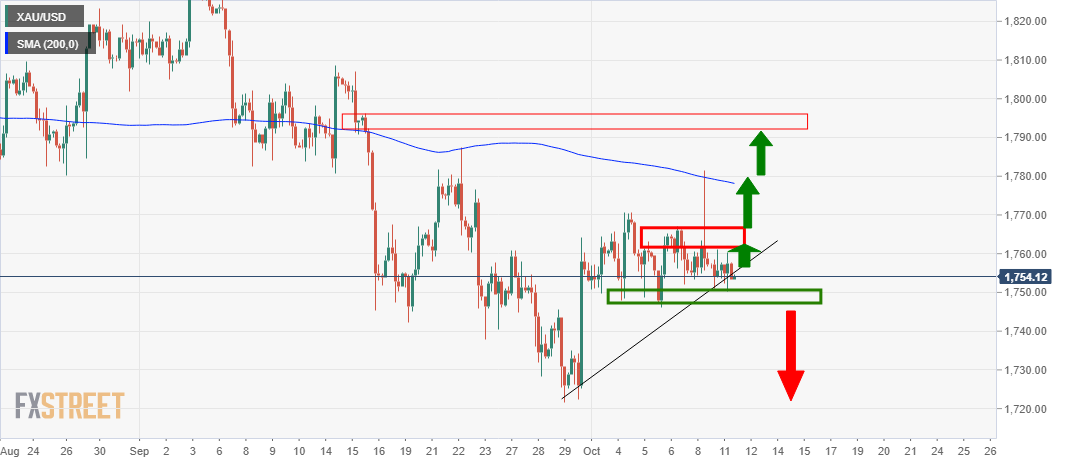
The price remains in consolidation below the critical resistance. A break there would be expected to see the prior analysis follow through. That being said, a break of the trendline support and subsequent drop below the horizontal support would be expected to result in a downside continuation.
- The AUD/USD threatens to break above 0.7400 despite broad US dollar strength across the board.
- Higher Iron Ore prices boost the Australian dollar.
- AUD/USD: A daily close above the 100-DMA could exert upward pressure towards 0.7500.
The AUD/USD advances 0.55% during the New York session and is trading at 0.7348 at the time of writing. Despite a negative market sentiment as witnessed by US stocks recording losses between 0.45% and 0.56%, the Australian dollar is rising on the back of Iron ore prices, which are up 5.45%, at $116 per metric tonne.
Overall, US dollar strength could not outweigh the Australian dollar
Meanwhile, the US Dollar Index, which tracks the buck’s performance against a basket of six currencies, is advancing 0.30%, at 94.38, failing to boost the greenback against the Australian dollar.
Concerning COVID-19 Australian issues, the ease of lockdown measures after four months has been welcomed by investors, boosting the AUD against the US dollar.
The Australian economic docket will feature the HIA New Home Sales for September in its monthly reading on Tuesday. Further, the Westpac Consumer Confidence for October is expected at 2.4%, which is higher than the September reading.
On the US front, the JOLTS Job Openings for August are foreseen at 10.925M. Also, the Atlanta Federal Reserve President Raphael Bostic will cross the wires.
AUD/USD Price Forecast: Technical outlook
Daily chart
The AUD/USD is trading above the 50-day moving average (DMA), which lies at 0.7303 but below the longer time frames, suggesting the pair is under downward pressure. Nevertheless, a break above the 100-DMA at 0.7424 could pave the way for further gains. The first resistance would be 0.7477. A breach of that level would expose key essential supply zones, the psychological 0.7500, and the 200-DMA at 0.7575.
On the other hand, a break below the 50-DMA could trigger a move towards the October 6 low at 0.7225, immediately followed by 0.7200.
The Relative Strength Index is at 56, slightly up, suggesting that a move higher is on the cards
What you need to know on Tuesday, October 12:
The week kick-started in slow motion with market participants looking for fresh catalysts. Generally speaking, concerns persisted as worrisome headlines came from China putting a cap to Friday stocks’ rally. Once again, Evergrande skipped a foreign dividend payment, while another local giant, developer Sinic Holdings, said it would likely default on its 2021 bonds, as it does not have enough financial resources to the make payments by their maturity date.
Wall Street seesawed between gains and losses, ending the day in the red. Earnings season kicked in with big banks reporting this week. The US bond market was closed, as the US celebrated Columbus Day.
The American dollar benefited from risk-off at the end of the day, although the AUD/USD pair retained its early gains, as higher copper prices underpinned the aussie. USD/CAD ended the day unchanged at around 1.2480, while the best performer was USD/JPY up to 113.40, its highest since 2018.
The EUR/USD pair ended the day with modest losses in the 1.1550 price zone, while GBP/USD finished the day just below the 1.3600 threshold.
Oil prices kept rallying to multi-year highs, with WTI settling at $ 80.50 a barrel. Gold ticked lower, closing the day at $1,754 a troy ounce.
Top 3 Price Prediction Bitcoin, Ethereum, Ripple: XRP to outperform BTC and ETH
Like this article? Help us with some feedback by answering this survey:
- GBP/USD bears step on the gas and break trendline support.
- GBP is under pressure due to Brexit angst and economic growth concerns.
GBP/USD has been pressured in New York trade, giving back its weekend BoE headline gains made in the open of the week. At the time of writing, GBP/USD is trading at the lows of the day near 1.3584 and has fallen from high of 1.3673.
There are a number of negative fundamentals at play, from Brexit woes to the energy crisis which amounts to a weaker economic backdrop in the United Kingdom. In recent trade, headlines have circulated that David Frost, the Brexit minister, has been accused by the EU of trying to undermine serious attempts to solve the problem of the Northern Ireland protocol, the Irish foreign minister has said.
Simon Coveney, Irish minister for foreign affairs, said he had spoken to Lord Frost’s counterpart, the European Commission vice-president, Maroš Šefčovič, on Sunday. They have agreed there would come a point when “the EU will say: enough, we cannot compromise anymore”, the Irish minister said.
There are risks of Britain implementing a move to suspend the post-Brexit Northern Ireland protocol, likely resulting in a trade war that would be damaging for both sides. This month will be key in this regard. Both sides put forward a fresh set of proposals in what might be the final disagreement before
UK factories at risk of closure due to energy crisis
Elsewhere, Britain's energy crisis is spiralling and industry leaders have been warning that this is going to halt factory production. British companies are warning that they may even be forced to close factories or have to pass on rising costs to consumers unless the UK government provides relief from soaring energy prices. Meanwhile, the British Chambers of Commerce has asked the government to implement an energy price cap to prevent smaller companies from closing down.
The hawks circle The Old Lady
- Bank of England says to brace for interest rate rises
Members of the MPC and the Bank of England have warned the public that inflation levels in Britain were concerning and told the nation to brace for earlier interest rate increases. BoE Governor Andrew Bailey stressed in weekend news the need to prevent inflation - running above the 2% target - from becoming permanently embedded.
Fellow MPC member Michael Saunders told households to get ready for "significantly earlier" interest rate rises as inflation pressure mounts in the British economy, the Telegraph newspaper said on Saturday.
"I'm not in favour of using code words or stating our intentions in advance of the meeting too precisely. The decisions get taken at the proper time," Saunders said.
"I think it is appropriate that the markets have moved to price a significantly earlier path of tightening than they did previously," Saunders added.
GBP/USD technical analysis

We have seen a breakout from the trendline support that would now be expected to act as a counter trendline on subsequent retests. However, the momentum is still with the bears and a retest of the horizontal resistance could lead to the next bearish impulse to test the old structure looking left.
- EUR/GBP has firmed since London trade and made fresh highs in New York.
- GBP is weighed by Brexit angst and the energy crisis.
EUR/GBP has climbed to the highest level of the day in New York, travelling from a low of 0.8472 to 0.8499 around the time of writing. Initially, sterling was getting a start of the week boost as the Bank of England warned of higher interest rates.
However, cable has dropped as the greenback finds its footing on the forex board once again. This has made some room higher up for the euro on the currency strength indicator. GBP is in the last position currently and down 0.03% on the day vs the greenback in the lows near 1.3601. Brexit angst and the energy crisis is a likely contributing factor to its recent decline.
- Bank of England says to brace for interest rate rises
In weekend interviews, members of the Bank of England warned the public that inflation levels in Britain were concerning and told the nation to brace for earlier interest rate increases. BoE Governor Andrew Bailey stressed the need to prevent inflation - running above the 2% target - from becoming permanently embedded.
Additionally, BoE policymaker Michael Saunders told households to get ready for "significantly earlier" interest rate rises as inflation pressure mounts in the British economy, the Telegraph newspaper said on Saturday.
"I'm not in favour of using code words or stating our intentions in advance of the meeting too precisely. The decisions get taken at the proper time," Saunders said.
"I think it is appropriate that the markets have moved to price a significantly earlier path of tightening than they did previously," Saunders added.
Reuters reported that ''Interest rate futures traded on the CME showed November contracts were pricing in as much as a 20% probability of a rate hike next month compared with 12% last week, while December futures were pricing in a 45% probability of a rate increase by then.'' Additionally, the news agency notes that a ''separate estimate from Refinitiv based on interest rate futures suggested a 15 bps rate hike by December is now fully priced in.''
Brexit angst anchors GBP
David Frost, the Brexit minister, has been accused by the EU of trying to undermine serious attempts to solve the problem of the Northern Ireland protocol, the Irish foreign minister has said. Simon Coveney, Irish minister for foreign affairs, said he had spoken to Lord Frost’s counterpart, the European Commission vice-president, Maroš Šefčovič, on Sunday. They have agreed there would come a point when “the EU will say: enough, we cannot compromise any more”, the Irish minister said.
The protocol seeks to avoid the need for a land border between Northern Ireland and the Republic of Ireland to the south. This has long been the most complex Brexit issue within the saga. The compromise struck as part of Brexit talks kept Northern Ireland aligned to key bits of EU law. However, the two sides disagree on its implementation and this month will see both sides putting forward a fresh set of proposals in what might be the final disagreement before Britain implements its move to suspend the post-Brexit Northern Ireland protocol. This would pose a major test of European unity, likely resulting in a trade war that would be damaging for both sides.
Britain's energy crisis is spiralling
Industry leaders are warning that the energy crisis could halt factory production. British companies that produce steel, paper, glass, cement, ceramics and chemicals say they will be forced to close factories. Alternatively, the companies said they would have to pass on rising costs to consumers unless the UK government provides relief from soaring energy prices.
The forex market will take into account that UK companies are being made less competitive compared to international rivals that have received help from their governments, weighing on the pound. What the forex space is needing to gauge, is whether rate hike increases to battle inflation pressures outweigh the negative prospects of higher energy prices on the UK's SMBs and industrial firms. In this respect, The British Chambers of Commerce has asked the government to implement an energy price cap to prevent smaller companies from closing down.
- New Zealand's dollar eases from 0.6965 to 0.6940.
- The kiwi remains bid on hawkish RBNZ.
- NZD/USD is expected to remain sideways below 0.7000 – ANZ.
New Zealand has lost steam during Monday’s afternoon US trading and has pulled back from session highs at 0.6965 to 0.6940 area. The pair, however, remains set to close in the green for the third day in a row, after bouncing from 0.6875 low last week.
The kiwi appreciates after the RBNZ hikes rates
The NZD found a fresh impulse on the hawkish RBNZ stance after the Bank announced its first interest rate hike in seven years. The move passed practically unnoticed on Friday, with all eyes on the US Non-Farm Payrolls report, although the increasing expectations of further rate hikes around the corner might have started to offer support to the NZD.
Beyond that, New Zealand’s authorities have reported a decline in new COVID-19 infections, which has prompted the government to ease restrictions in the capital, Auckland, with the latest Delta variant outbreak apparently under control.
NZD/USD: Seen moving between 0.6860 and 0.7000– ANZ
According to the FX Analysis team at ANZ, the pair is expected to remain trapped between 0.6860 and 0.7000 over the next days: “Near-term, the established 0.6860-0.7000 range may hold much of the price action ahead of the FOMC minutes, which will be released mid-week (…) Despite the payrolls miss, the fall in the unemployment rate and strength in average earnings growth helped to keep expectations over a Fed tapering announcement in November intact. That is well discounted and in the very short-term, DXY also looks confined to a 0.9350-0.9450 range.”
Technical levels to watch
- EUR/USD tested the 1.1600 level unsuccessfully, on the back of US dollar strength.
- The US Dollar Index trims some of its last week’s losses, sits at 94.32.
- The EUR/USD is downward pressured, as showed by the daily and the 1-hour chart, could test 2021 lows.
The EUR/USD is trading at 1.1559, down 0.09% during the New York session at the time of writing. The market sentiment has dampened throughout the day, as witnessed by US stock indices trading with losses between 0.12% and 0.42%.
The US Dollar Index that tracks the greenback’s performance against a basket of six peers rises 0.24%, currently at 94.32, boost the US dollar, exerting downward pressure on the EUR/USD pair.
In the European session, the EUR/USD pair advanced mainly on the back of the British pound. On the weekend, some Bank of England’s members expressed concerns about inflation, and the possibility of hiking rates, as it threatens to be stickier than expected. While the GBP/USD rose near 1.3700, the EUR/USD reached 1.1585 but retreated later.
On Tuesday, the Eurozone economic docket will feature the Zew Survey of Economic Sentiment and current situation. At the same time, ECB’s Chief Economist Philip R. Lane and ECB’s member Frank Elderson will hit the wires. Across the pond, the JOLTS Job Openings for August, expected at 10.925M, could offer some fresh impetus for EUR/USD traders.
EUR/USD Price Forecast: Technical outlook
Daily chart
EUR/USD is trading well below the daily moving averages (DMA’s), pushing towards last Friday’s lows, around 1.1540s. Momentum indicator like the Relative Strenght Index (RSI) is at 32, exited from oversold levels, suggesting the downward bias remains. A break below 1.1540 could open the door for 2021 low at 1.1528.
1-hour chart
The single currency tested last Friday’s highs around 1.1585, unsuccessfully retreating below the daily pivot point at 1.1566. On the upside, the confluence of the 50-simple moving average (SMA) and the daily pivot point impose strong resistance around 1.1566.
On the other hand, the confluence of the S1 pivot point level at 1.1547 near the last Friday’s low at 1.1540 acts as support.`However, the Relative Strength Index (RSI) at 43 is aiming lower, suggesting that a move towards the latter might be on the cards.
KEY ADDITIONAL LEVELS TO WATCH
- Gold prices consolidate above the $1,750 support zone.
- A firmer USD on Fed tapering expectations is weighing on metals.
- XAG/USD's bearish grip remains intact – FXStreet Insights Team.
Gold futures have opened the week in a slightly negative tone, weighed by the overall US dollar strength. In longer-term charts, however, the yellow metal remains moving within previous ranges, supported above &1,750 so far.
Gold eases on USD strength amid Fed tapering expectations
Bullion prices have ticked down about 0.1% on Monday with the dollar firm, despite the lackluster US employment report seen last Friday. Market expectations that the Federal Reserve will stick to their plan to kickstart QE tapering over the next months have supported the US dollar in an otherwise quiet market session on Monday.
US economy added 194,000 new jobs in September, according to data released by the Labor Department on Friday. This is the poorest reading in the last nine months and comes well below market expectations of a 500,000 increase. On the positive side, August’s reading was upwardly revised to 366,000 from previous estimations of 235,000 while the unemployment rate decreased to 4,.8% from 5.2% in the previous month.
XAU/USD: the bearish grip remains intact – FXStreet Insights team
Looking from a wider perspective, FXStreet’s Dhwani Mehta, observes gold prices’ consolidation exposed to downside risks: “Gold failed to find acceptance above the short-term critical resistance of the 21-Daily Moving Average (DMA) at $1762 on Friday, leaving the downside risks exposed (…) On a daily closing below the $1750-$1745 demand area, the multi-week troughs near $1720 could be on the gold sellers’ radars.”
Technical levels to watch
The Wall Street Journal has reported that ''Chinese President Xi Jinping is zeroing in on the ties that China’s state banks and other financial stalwarts have developed with big private-sector players, expanding his push to curb capitalist forces in the economy.''
This investigation is part of Xi's campaign that started late last year as the WSJ describes as being ''a regulatory assault on private technology giants.'' Now, Xi is diving deeper into the financial institutions which falls on the heels of the near default of the property giant, Evergrande Group.
''The financial-sector scrutiny comes as Beijing is also trying to address the economy’s dependence on debt-fueled construction sprees, which is prompting turmoil in China’s property sector. By expanding his economic campaign, Mr. Xi risks unleashing dynamics that could severely cut into growth in coming months,'' WSJ wrote.
''Mr. Xi’s goal, some officials said, is to make sure the party exerts full control over the economic lifeblood of the country, preventing the financial sector’s capture by big private businesses and other power players that threaten the state’s influence,'' the WSJ explained.
Market implications
This is a negative theme for markets that rely on the Middle Kingdom and its economic powerhouse. For instance, In 2020, China's contribution to world gross domestic product was about 18.34%. Back in July of this year, for 2021, the Global Times stated that the economy will power ahead at more than 8%. However, this was before China's property market and energy crisis and an escalation of The Chinese Communist Party's furthering of a clampdown on big private sector players.
Rating agency Fitch has downgraded its forecast for China’s economic growth because of concerns about a slowdown in the country’s colossal housing market and fears about struggling property giant Evergrande. Still, Fitch Ratings said it expected growth to come in at 8.1% this year, compared with a previous 8.4% estimate, saying the “main factor weighing on the outlook is the slowdown in the property sector”.
Meanwhile, there is more pessimism at the big banks. Goldman Sachs became one of the latest banking giants to cut its growth forecast for China, as the country struggles with energy shortages. It now expects the world's second-largest economy to expand by 7.8% this year, down from its previous prediction of 8.2%.
However, a far more pessimistic outlook comes from Citi Bank which has trimmed its China growth forecast for next year to 4.9% from 5.5%, citing expected spillover from the woes of embattled property giant Evergrande and predicted policymakers would deliver more interest rate reductions.
"The balancing between moral hazard risks and contagion risks points towards a managed restructuring," Citi's Xiangrong Yu wrote in a note to clients at the end of September.
"The pressure on growth will likely trigger some restrained policy easing, including a 25bp interest rate cut in 2022E," he said, adding he now also expected an anticipated 50 bps reduction of the reserve ratio requirements to be advanced to October
Going deeper, the Evergrande saga could be the end of China's growth model which will impact the whole world economy. Xi is hell-bent on centralising power and he has been increasingly touting the goal of "common prosperity," a key aspect of which is fighting wealth inequality - otherwise known as 'Xi-Thought'.
The problem for the world is that it has come too dependent on a fast-growing China and its debt-fueled real-estate sector. China is moving much more communist. China's crackdown on its corporate sector is part of a wider decoupling with the west, especially the US which means American companies will have to find new manufacturing partners which will impact the bottom line of the corporate West.
- The US dollar rebound from 1.2445 lows remains below 1.2500.
- CAD remains strong with oil prices surging.
- USD/CAD: Breach of 1.2450 might lead to 1.2300.
The US dollar is attempting to pick up on Monday after a sharp decline observed in the previous three days. The pair has bounced up from two-month lows at 1.2445 although, so far, it has remained unable to post a relevant recovery with the Canadian dollar supported by higher oil prices.
The loonie remains strong as crude prices hit fresh highs
The Canadian dollar has been unfazed by the moderate US dollar strength seen on Monday. The loonie remains supported by the steady rally on crude oil, one of Canada’s main exports. The benchmark US WTI has appreciated for the eighth consecutive day, hitting fresh 7-year highs above $82, while the barrel of brent has traded above $84 for the first time since September 2018.
With fixed income markets closed on Monday, oil prices have offset the overall positive greenback tone. The investors have assumed the fact that Friday’s lackluster employment report will not deter the Federal Reserve to start tapering its bond purchasing program over the next months, which has supported the USD against most of its peers.
In absence of any relevant macroeconomic releases on Monday, the market is focusing on the US CPI and the FOMC minutes, due next Wednesday, to better assess the next Fed move and set the near-term direction for the USD.
USD/CAD breach of 1.2450 will open the path towards 1.2300 – Scotiabank
According to the FX Analysis Team at Scotia Bank, the pair should confirm above 1.2450 level to avoid further depreciation: “From a technical perspective, the cross may struggle to detach itself from the 1.2450-1.2500 zone but a convincing decline opens up USD losses to the 1.24 mark with 1.23 following with relative ease.”
Technical levels to watch
- Oil prices are soaring to multi-year peaks on Monday.
- Widespread energy shortages in Asia, Europe and the United States underpin demand for oil.
WTI is trading at $81.02bbls and bid on the day, up 1.95% at the time of writing but well below the highs of $82.15bbls. The price moved from a low of $79.50bbls to scale multi-year peaks as global demand returns.
As the winter months and colder weather move in, demand for energy is growing at the same time that the Organization of the Petroleum Exporting Countries and allies, together known as OPEC+, have held back from boosting supply even as prices have risen.
Meanwhile, the widespread energy shortages in Asia, Europe and the United States have seen gas prices soar through the roof which is a likely factor playing into demand for oil as nations switch to alternative energy sources for power.
''Analysts have estimated that switching from natural gas to oil could add anywhere from 250,000 to 750,000 barrels per day of crude demand,'' Reuters wrote in a note on Monday. In other parts of the world, such as in India, some states are experiencing electricity blackouts because of coal shortages. In China, the government ordered miners to ramp up coal production as power prices surge.
Meanwhile, staying with the demand front, analysts at TD securities argued that the Delta-variant risks have proved benign. The analysts explained that growing departure levels suggest air traffic will continue to support jet fuel demand across both APAC and the US. ''This demand recovery is highlighted by the highest level of jet fuel exports from China since the early days of the stimulus-induced recovery in the summer of 2020.''
The analysts at TD Securities have revised their energy forecasts higher, anticipating that Brent crude could trend towards $90/bbl for 2021Q4 and 2022Q1 before consolidating thereafter.
- Wall Street leading indices are barely down as the week kicks in.
- Energy stocks keep in the green as crude oil continues its advance.
US stock indices are declining during the New York session amid thin liquidity conditions with the money markets (US Bond market) closed for the observation of Columbus Day in the US. The S&P 500 is down 0.10%, at 4,388.26, the Dow Jones Industrial Average slides 0.16% at 34,691.57, and the tech-heavy Nasdaq Composite slumps 0.04%, sitting at 14,814.58, at press time.
Among the 11 sectors, Energy is rising 0.17% on the back of higher crude oil prices, with the Western Texas Intermediate (WTI) advancing almost 2%, trading at $80.65. On the other hand, Financials are down 0.11%, despite higher US bond yields and the Federal Reserve QE reduction prospects.
S&P 500 Price Forecast: Technical outlook
Daily chart
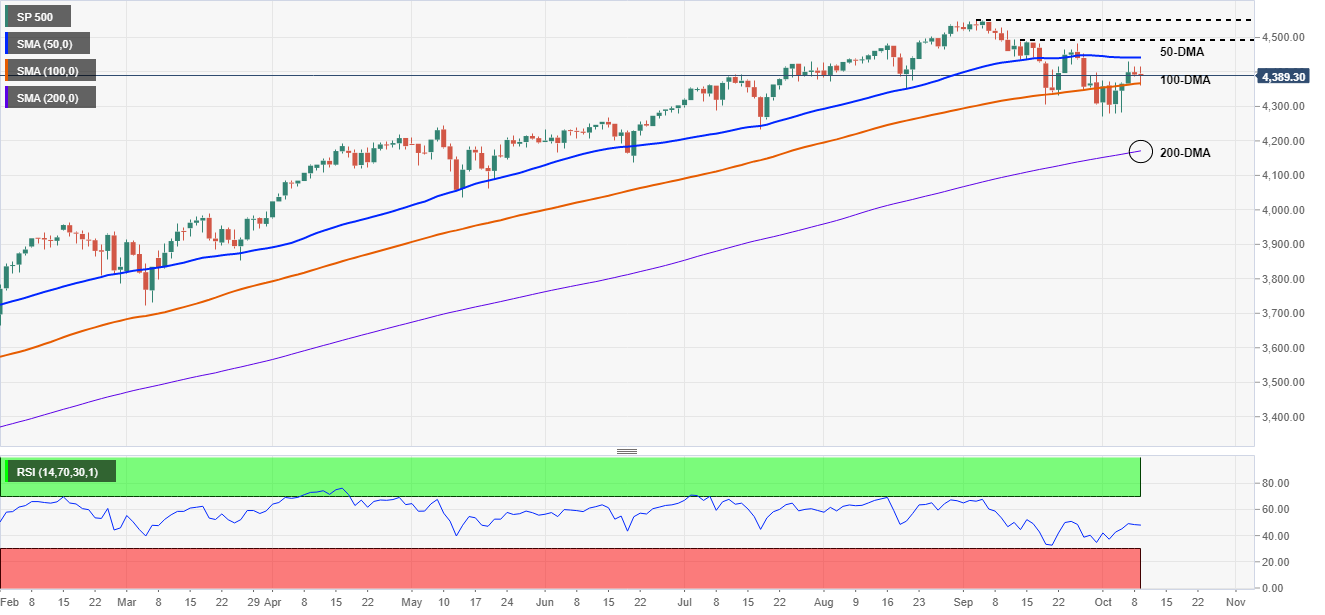
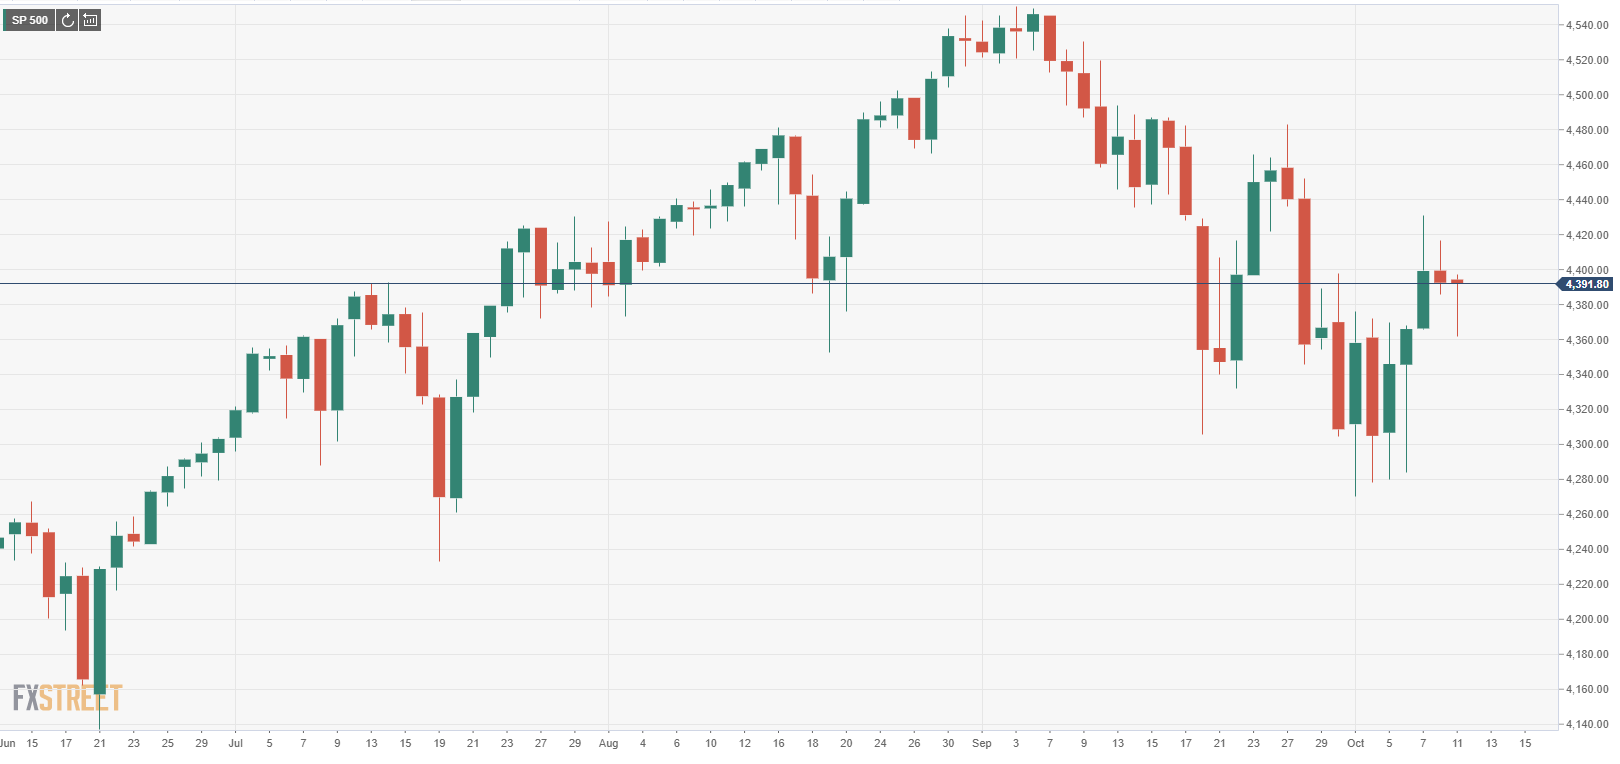
The S&P 500 retreated from yearly highs around 4,549, down the July 8 swing lows around 4,270. However, in the last week, the 100-day moving average (DMA) reclaimed around 4,370, boosts the prospects of “buying the dip.”
In the S&P 500, a break above the 50-day moving average at 4,442 could open the door for a re-test of the 2021 year highs. In case of that outcome, the following resistance level would be 4,482, and then 4,550 2021 highs.
On the flip side, failure at the 50-DMA coupled with a break below the 100-DMA could accelerate the fall towards the 200-DMA at 4,172 and beyond.
The Relative Strength Index (RSI) is at 48, indicating that downward pressure remains, opening the door of another leg down, perhaps towards the 200-DMA.
KEY ADDITIONAL LEVELS TO WATCH
- Silver's upside attempts capped below $22.80.
- US dollar's strength weighs on precious metals.
- XAG/USD: Moving sideways between $22.20 and $23.15.
Silver opened the week on a slightly positive tone although it was unable to extend past $22.80, amid a broad-based US dollar strength. The precious metal has retreated to the $22.65 area during the US trading session to remain practically unchanged on daily charts.
US dollar strength weighs on precious metals
Silver and precious metals, in general, remain on the defensive against a firmer US dollar with the market bracing for the official announcement of bonds-buying tapering by the Federal Reserve. The US Dollar Index has ticked up about 0.15% on Monday, to reverse the previous two days’ losses and approach year-to-date highs at 94.50
The US dollar has appreciated across the board on Monday. The investors have assumed that the discouraging US Non-Farm Payrolls report seen last Friday is unlikely to deter the Fed from announcing their plan to start rolling back the monetary stimulus at their next monetary policy meeting in November.
XAG/USD: consolidating between $22.20 and $23.15
From a technical perspective, the pair has been consolidating within a narrow range over the last week. On the upside, XAG/USD should breach September 22, October 8 highs, at $23.15 to increase bulls’ confidence, and attempt 14, 16 September highs, at $24.00 ahead of September 3 high at $24.87.
On the downside, immediate support lies at $22.15 (October 6 low) and below here, $21.37 (September 29 low) and 20.75 (50% Fibonacci retracement of the March-August 2020 rally.
Technical levels to watch
- The sterling accelerates past 153.35 to hit multi-month highs at 154.50.
- The pound rallies on BoE hike expectations.
- GBP/JPY is now approaching long-term highs at 156.05.
The British pound is trading higher against most of the major currencies on Friday, and especially against the Japanese yen. The pair has appreciated more than 1.5% over the last two days, reaching prices near 154.50 for the first time since late June.
BoE rate hike expectations boost the pound
The sterling has been appreciating over the last sessions, fuelled by higher expectations that the bank of England will be the first major central bank to start hiking interest rates following the COVID-19 crisis.
Surging energy prices have boosted yearly inflation to 3.2% in September, well beyond the Bank of England’s 2% target for price stability. This has forces some BoE officials to openly suggest the possibility of accelerating rate hikes, which has increased GBP’s attractiveness for investors.
On the other end, the Japanese yen, particularly sensitive to monetary policy differentials is suffering against the GBP and the USD. With the Bank of Japan discarding the possibility of any rate hike for the foreseeable future, and with the yield curve under control, the JPY remains vulnerable against monetary tightening expectations in the rest of the world’s major economies.
GBP/JPY: Approaching long-term highs at 156.00
The pair has accelerated after breaching the resistance area at 153.35/45 to advance towards the mid-range of 154.00 reaching overbought levels in hourly charts, which could anticipate some correction. If the sterling remains above the mentioned 153/35/45, the near-term bullish bias might push the pair to test 155.15 (June 23 high) before 155.45 (June 15 high) and 156.05 (May 27 high).
On the downside, below 155.35 (July 30, August 10, and 11 lows) the pair might seek support at 152.50/60 (September 14 and 28 highs) and 150.80 (October 6 low).
- USD/JPY breaks above 113.00 level non seen since December 2018.
- High US T-bond yields and broad US dollar strength are the main drivers of the USD/JPY pair.
- The Federal Reserve prospects of bond tapering remain intact, despite an awful NFP report.
The USD/JPY is soaring during the New York session, trading at 113.38, up 1.03% at the time of writing. The risk-on environment, as witnessed by US stock indices trading in the green, post gains between 0.43% and 0.86%. Also, the US T-bond yields, with the 10-year benchmark note rate rising above the 1.60% threshold, exert upward pressure on the USD/JPY pair.
The US Dollar resilience continues despite a dismal US Nonfarm Payrolls report
Additionally, the US Dollar Index that tracks the greenback’s performance against its rivals is advancing 0.16%, currently at 94.24, weighing on the Japanese yen and boosting the buck.
On Friday, the US Nonfarm Payrolls report was worse than expected, but August’s upward revision has kept the prospects of a Federal Reserve bond taper announcement alive. Further, US stock indices closed with losses, and US T-bond yields rose, reinforcing the abovementioned, as investors did not buy the dip, as they got ready for an easy money cycle coming to an end.
On the macroeconomic front, on Tuesday, the Japanese economic docket will feature the Producer Price Index monthly and yearly and the Bank Lending on an annual basis for September. Concerning the US, the JOLTS Job Openings for August, and the Atlanta Federal Reserve President Raphael Bostic, could add a fresh catalyst for USD/JPY traders.
USD/JPY Price Forecast: Technical outlook
Daily chart
The USD/JPY is trading well above the daily moving averages (DMA’s), above 113.00, supporting the upside bias. Momentum indicators like the Relative Strenght Index (RSI) are at 75, suggesting that the pair is oversold, so a consolidation or a correction towards 113.00 might be on the cards.
On the way north, December 2018, swing highs around 113.50 is the first resistance level. A break of the latter could open the way for further upside action. The following supply zone would be 114.00, and then September 2018 swing highs around 114.55.
KEY ADDITIONAL LEVELS TO WATCH
- Aussie's recovery from 0.7170 reaches levels near 0.7400.
- The Australian dollar rallies on higher commodity prices.
- AUD/USD rally seen capped at 0.7365 – Credit Suisse.
The Australian dollar has rallied about 0.9% so far today and is on track to close its best daily performance over the last months. The pair accelerated its uptrend, after breaking above the 0.7330 resistance area, to reach 0.7370 for the first time since mid-September.
Higher commodity prices boost AUD's recovery
Australian dollar’s appreciation has been underpinned by a solid rally on commodity prices. Crude oil has hit another multi-year high, with the WTI consolidating above $80, while iron ore, one of Australia’s main exports, appreciated amid higher demand from China, as the country's main ports opened following a national holiday.
Beyond that, the market has welcomed the relaxation of COVID-19 restrictions in New South Wales, one of the country’s most populated states. The reopening of bars, restaurants, and gyms in Sydney after a four-month lockdown has increased bullish momentum on the AUD, to offset the overall USD strength.
AUD/USD likely to be capped at 0.7365 – Credit Suisse
From a broader perspective, however, the FX analysis team at Credit Suisse remains skeptical about further AUD strength: “AUD/USD has broken out resistance at 0.7312/17, which suggests a short-term correction higher to the 2021 downtrend at 0.7365, which we then expect to cap the market. Thereafter, support is seen at 0.7291/87 initially, below which would confirm a turn back lower and retest of 0.7179/70 lows.”
Technical levels to watch
- GBP/USD upward pressure towards 1.3670 fades as the New York session kicks in.
- Overall, US dollar strength across the board capped the move towards 1.3700.
- BoE members expressed concerns about inflation, could probably hike rates sooner than expected.
The GBP/USD approaches last week’s highs around 1.3657, is trading at 1.3633, up 0.10% during the New York session at the time of writing. Market mood is upbeat, as it can be witnessed by European and US stock indices posting gains, except for the German DAX and the Spanian IBEX 35, each losing 0.12% and 0.68%.
The US Dollar Index that measures the greenback’s performance against six peers is up 0.10%, sitting at 94.19, putting a lid on the GBP/USD.
Earlier in the Asian session, the British pound reached a weekly high of around 1.3670. The factors that prompted that upward move are comments made over the weekend by Bank of England (BoE) members.
According to an interview with the Yorkshire Post on Saturday, Andrew Bailey, the BoE Governor, said he is concerned that prices accelerated above the central bank 2% and warned a potentially “very damaging” period of inflation for British customers. Bailey added, that “We [BoE] have got to, in a sense, prevent the thing [inflation] becoming permanently embedded…”.
Furthermore, in the same tone Michael Saunders, a Monetary Policy Committee (MPC) member added, that markets are right to price in an earlier interest rate hike than previously expected as inflation accelerates.
Meanwhile, across the pond, Goldman Sachs cut the forecast for US growth for this year and 2022, blaming the delay to consumer spending. The bank said that they now expect growth of 5.6% on a yearly basis, against a 5.7% foreseen and 4% in 2022, versus 4.4%.
On the macroeconomic front, the UK economic docket is awaiting the NIESR GDP (3M) for September, which is expected to rise by 3.2%. On the other hand, the US is in observation of Columbus Day.
KEY ADDITIONAL LEVELS TO WATCH
USD/CAD has fallen to the mid 1.24s. Strategists at Scotiabank expect the pair to tank towards the 1.23 level on a break below the 1.24 region.
Loonie strengthens with strong crude oil
“From a technical perspective, the cross may struggle to detach itself from the 1.2450-1.2500 zone but a convincing decline opens up USD losses to the 1.24 mark with 1.23 following with relative ease.”
“The loonie will have to resist Fed tapering bets ahead of its November meeting and 2022 hike calls will likely act as a tailwind for the dollar through year-end. On the other hand, there’s no quick solution in sight for the global energy crunch that should keep the CAD supported by stronger crude prices.”
- Gold was seen consolidating in a range through the early North American session.
- Hawkish Fed expectations underpinned the USD and capped gains for the metal.
- Stagflation fears helped limit any meaningful slide for the safe-haven commodity.
- Gold Price Forecast: XAU/USD remains exposed to downside risks ahead of a big week
Gold lacked any firm directional bias and seesawed between tepid gains/minor losses, just above the $1,750 level through the early North American session. A combination of diverging forces failed to provide any impetus and led to a subdued price action following Friday’s turnaround from the post-US jobs data highs to the $1,781 region, or over two-week tops.
The disappointing headline NFP print was largely offset by an upward revision to the previous month's reading. Moreover, a fall in the unemployment rate to the lowest level since March 2020 reaffirmed market expectations that the Fed remains on track to begin tapering its bond purchases later this year. This continued acting as a tailwind for the US dollar, which, in turn, undermined the dollar-denominated commodity.
Meanwhile, the markets have also been betting on the possibility of an interest rate hike in 2022 amid worries that the recent surge in crude oil/energy prices will stoke inflation. This was reinforced by elevated US Treasury bond yields, which was seen as another factor that weighed on the non-yielding gold. In fact, the yield on the benchmark 10-year US government bond shot to four-month tops on Friday, around 1.612%.
That said, expectations for a faster than expected rise in inflation comes amid signs of a slowdown in the global economic recovery and have been fueling fears of a return of stagflation. This, in turn, tempered investors' appetite for perceived riskier assets and extended some support to the safe-haven gold. It, however, remains to be seen if bulls are able to capitalize on the move amid holiday-thinned liquidity conditions.
Investors might also refrain from placing aggressive bets ahead of this week's important releases, including the US consumer inflation figures and the FOMC meeting minutes on Wednesday. Apart from this, the US monthly Retail Sales figures on Friday will influence the near-term USD price dynamics and provide a fresh directional impetus to gold.
Technical levels to watch
From current levels, any subsequent move up is likely to confront stiff resistance near the $1,770 area. Some follow-through buying has the potential to lift gold prices back closer towards the $1,783-84 horizontal barrier. A sustained strength beyond should allow bulls to aim back to reclaim the $1,800 round-figure mark.
On the flip side, the $1,750 area now seems to have emerged as immediate strong support. A convincing break below might prompt aggressive technical selling and accelerate the slide towards September monthly swing lows, around the $1,722-21 region. Gold could eventually drop to test the $1,700 mark en-route August monthly swing lows, around the $1,687 region.
World Bank President David Malpass said on Monday that they are expecting global economic growth of 5.7% in 2021 and 4.4% in 2022, as reported by Reuters.
Additional takeaways
"World seeing tragic reversals in development, progress in reducing extreme poverty set back by years due to pandemic."
"Looking for ways to make G20 common framework for debt restructuring more effective and avoid cliff when current freeze in bilateral debt payments ends at end of 2021."
Further suspension of debt payments could be considered as part of implementation of common framework treatment."
"World Bank hopes to raise $100 billion in donations for international development association fund for poorer countries."
Market reaction
These comments don't seem to be having a noticeable impact on market sentiment. As of writing, the S&P 500 Index was up 0.2% on the day at 4,400.
- EUR/USD trades within a consolidative mood in the mid-1.1500s.
- The YTD low at 1.1529 now emerges on the horizon.
EUR/USD alternates gains with losses always below the 1.1600 mark at the beginning of the week.
Another visit to the 2021 low at 1.1529 remains well on the table in the near future amidst the ongoing bearish context. Further south from here, a test of the 1.1500 neighbourhood should start emerging on the horizon.
In the meantime, the near-term outlook for EUR/USD is seen on the negative side below the key 200-day SMA, today at 1.1943.
EUR/USD daily chart
- Wall Street's main indexes inch lower at the start of the week.
- Energy stocks post strong gains on rising crude oil prices.
- Trading action is likely to remain subdued in the remainder of the day.
Major equity indexes opened modestly lower on Monday as trading conditions remain thin due to the Columbus Day holiday in the US. As of writing, the S&P 500 Index was down 0.1% on the day at 4,388, the Dow Jones Industrial Average was unchanged at 34,730 and the Nasdaq Composite was losing 0.1% at 14,562.
Among the 11 major sectors, the Energy Index is rising 1% after the opening bell supported by a more-than-2% increase seen in US crude oil prices. On the flip side, the risk-sensitive Communication Services Index is losing 0.65%.
Wake Up Wall Street: Slow jobs, slow growth, slow markets.
There won't be any high-tier data releases featured in the US economic docket on Monday and the trading action is likely to remain subdued.
S&P 500 chart (daily)
- DXY fades the recent weakness and moves to 94.30.
- Another test of the 2021 highs remains on the table.
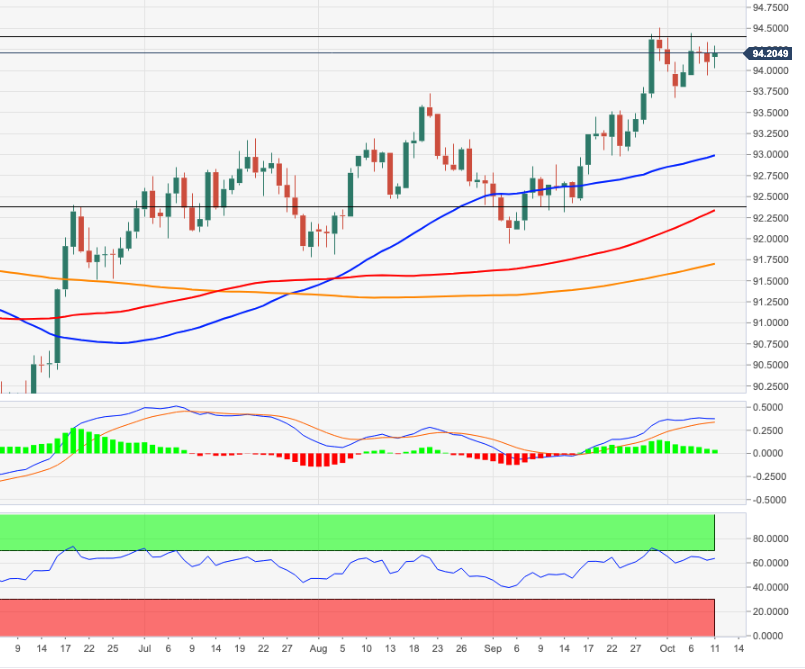
DXY resumes the upside following two consecutive sessions with losses on Monday.
The ongoing price action allows the index to attempt a move to YTD highs around 94.50 in the short-term horizon ahead of September 2020 high at 94.74 and the 200-week SMA, today at 94.76. Further north should come the round level at 95.00, also in the not-so-distant future.
Looking at the broader picture, the constructive stance on the index is seen unchanged above the 200-day SMA at 91.70.
DXY daily chart
- EUR/JPY’s recovery falters just below 131.00 the figure on Monday.
- The surpass of 131.00 should open the door to further upside.
EUR/JPY extends the rally to the boundaries of the 131.00 mark at the beginning of the week.
The cross moves further north of the 200-day SMA, allowing for extra gains in the very near term. That said, there is an interim hurdle at 131.75, where another Fibo level sits ahead of 132.69 (high June 23).
In the broader scenario, while above the 200-day SMA at 129.78, the outlook for the cross is expected to remain constructive.
EUR/JPY daily chart
Quek Ser Leang at UOB Group’s Global Economics & Markets Research still view USD/IDR attempting a move to 14,170.
Key Quotes
“Last Monday, we highlighted that ‘the bias for this week is tilted to the downside towards 14,220’. Our view for a weaker USD/IDR was not wrong even though the subsequent weakness exceeded our expectations as USD/IDR dropped to 14,190 last Friday (08 Oct)”.
“Downward momentum has increased and the bias for this week is still on the downside. A break of September’s low at 14,170 would not be surprising but the next major support at 14,120 is unlikely to come under threat. Resistance is 14,250 followed by 14,300.”
- Renewed USD buying assisted USD/CAD to bounce off descending channel support.
- Bullish crude oil prices continued underpinning the loonie and capped the upside.
- Holiday-thinned liquidity also held traders from positioning for any further recovery.
The USD/CAD pair turned flat heading into the North American session and was last seen trading around the 1.2470-75 region, nearly unchanged for the day.
The pair found some support near the lower boundary of a three-week-old descending trend channel and bounce around 25-30 pips from over two-month lows amid renewed US dollar buying. Expectations that the Fed will begin rolling back its pandemic-era stimulus as soon as November continued acting as a tailwind for the greenback.
The USD further drew support from rising bets for an interest rate hike in 2022, bolstered by worries that the recent surge in crude oil/energy prices will stoke inflation. The combination of factors pushed the yield on the benchmark 10-year US government bond to four-month tops, beyond the 1.60% threshold on Friday.
Meanwhile, fears of a return of stagflation – high inflation and low growth – tempered investors' appetite for perceived riskier assets. This was evident from a softer tone around the equity markets, which was seen as another factor that benefitted the safe-haven greenback and extended some support to the USD/CAD pair.
The upside, however, remains capped amid elevated crude oil prices, which tend to underpin the commodity-linked loonie. This, along with relatively thin liquidity conditions on the back of a bank holiday in the US and Canada, might keep a lid on any meaningful recovery for the USD/CAD pair, at least for the time being.
This makes it prudent to wait for a strong follow-through buying before confirming that the USD/CAD pair has bottomed out in the near term and positioning for any further gains. Hence, any subsequent move up is more likely to face stiff resistance near the key 1.2500 psychological mark, followed by the very important 200-day SMA.
Technical levels to watch
European Central Bank (ECB) chief economist Philip Lane said on Monday that there is an early stage of an energy shock in the eurozone and added that the trigger for a monetary policy is not there, as reported by Reuters.
"We need to be much less trigger happy, we need to wait for data," Lane further noted. "The medium-term inflation dynamic is too slow, not too fast."
Regarding the policy outlook, Lane explained that the ECB is in a recalibration mode and is not remotely in condition to taper.
Market reaction
The shared currency seems to be weakening modestly against its major rivals following these comments. The EUR/USD pair was last seen posting small daily losses at 1.1562.
- USD/JPY continued scaling higher on the first day of a new trading week.
- The formation of an upward sloping trend channel favours bullish traders.
- Overbought RSI warrants some caution before positioning for further gains.
The USD/JPY pair built on last week's bullish momentum and gained strong follow-through traction on the first day of a new trading week. This marked the third consecutive day of a positive move – also the fourth in the previous five – and pushed the pair to the highest level since December 2018, beyond the 113.00 mark.
Expectations that the Fed would begin tapering its bond purchases as soon as November, along with rising bets for a possible interest rate hike in 2022 acted as a tailwind for the US dollar. On the other hand, the recent widening US-Japanese yields differential further inspired bullish traders and remained supportive.
Meanwhile, fears of a return of stagflation – high inflation and low growth – tempered investors' appetite for perceived riskier assets. This was evident from a softer tone around the equity markets, which might extend some support to the safe-haven Japanese yen and held bulls from placing fresh bets around the USD/JPY pair.
From a technical perspective, the recent strong move up from the vicinity of the 109.00 round-figure mark has been along an upward sloping channel. This points to a well-established short-term uptrend and supports prospects for additional gains, though overbought RSI on hourly charts warrants some caution for bullish traders.
Hence, it will be prudent to wait for some intraday consolidation or a modest pullback before positioning for any further appreciating move. Nevertheless, the USD/JPY pair seems all set to climb further towards challenging a resistance marked by the top end of the mentioned channel, currently around mid-113.50 region.
On the flip side, any meaningful retracement slide could be seen as a buying opportunity. This, in turn, should help limit the downside near the 112.25-20 horizontal support. This is closely followed by the 112.00 round-figure mark, which if broken might prompt some technical selling and pave the way for a deeper corrective pullback.
USD/JPY 4-hour chart
-637695525987998315.png)
Technical levels to watch
European Central Bank chief economist Philip Lane said noted on Monday that they don't expect the coronavirus Delta variant to be a major domestic problem for the euro area, as reported Reuters.
"The response to Delta has involved shutdowns in Asian suppliers, which is feeding back to Europe through supply," Lane further explained.
Regarding the inflation outlook, Lane said 'mostly transitory' means inflation rise doesn't have much of a footprint in the medium-term outlook.
Market reaction
These remarks are having little to no impact on the euro's performance against its major rivals. As of writing, the EUR/USD pair was trading at 1.1567, where it was virtually unchanged on a daily basis.
European Central Bank chief economist Philip Lane said on Monday that calibrating the volume of asset purchases plays an important role in ensuring that the monetary stance is sufficiently accommodative to deliver the timely attainment of the medium-term 2% target.
Key quotes per Reuters
"If the economy is close to the effective lower bound, it is vitally important to adopt especially forceful or persistent monetary policy action to avoid negative deviations from the inflation target becoming entrenched."
"The compression of term premia through the duration extraction channel plays a quantitatively significant role in determining longer-term yields."
"An energy price shock can simultaneously raise headline inflation but exert downward pressure on the path of underlying inflation."
"A one-off shift in the level of wages as part of the adjustment to a transitory unexpected increase in the price level does not imply a trend shift in the path of underlying inflation."
"Tracking wage outcomes and differentiating between transitory and persistent shifts in the growth rate of wages will play an important role."
Market reaction
These comments don't seem to be having a significant impact on the common currency's performance against its rivals. As of writing, the EUR/USD pair was up 0.06% on the day at 1.1575.
- The British pound got a goodish lift on Monday after the BoE signalled an imminent rate hike.
- The upside remains capped amid the underlying bullish sentiment surrounding the greenback.
- Hawkish Fed expectations, cautious market mood acted as a tailwind for the safe-haven USD.
The GBP/USD pair surrendered a major part of its intraday gains and was last seen trading around the 1.3625-30 region, still up over 0.10% for the day.
The Bank of England officials signalled an imminent interest rate hike over the weekend and provided a goodish intraday lift to the British pound on the first day of a new trading week. The BoE Governor Andrew Bailey warned of a potentially very damaging period of inflation unless policymakers take action. Adding to this, Michael Saunders, one of the most hawkish members of the BoE's Monetary Policy Committee, suggested that investors were right to bring forward bets on rate hikes.
The GBP/USD pair climbed to near two-week tops, around the 1.3670-75 region, albeit struggled to capitalize on the move amid a modest pickup in the US dollar demand. Friday's disappointing headline NFP print for September was offset by a big upward revision to the previous month's reading and reaffirmed expectations that the Fed will soon begin tapering its asset purchases. The markets also seem to have increased the bets for an interest rate hike by the Fed in 2022.
Worries that the recent surge in crude oil/energy prices will stoke inflation have been fueling speculations for an early policy tightening by the Fed. The combination of factors pushed the yield on the benchmark 10-year US government bond to four-month tops, beyond the 1.60% threshold on Friday. This, in turn, continued acting as a tailwind for the greenback and kept a lid on any strong follow-through positive move for the GBP/USD pair, at least for the time being.
Meanwhile, fears of a return of stagflation – high inflation and low growth – tempered investors' appetite for perceived riskier assets. This was evident from a softer tone around the equity markets, which was seen as another factor that benefitted the greenback's relative safe-haven status. Hence, it will be prudent to wait for a strong follow-through selling before placing fresh bullish bets around the GBP/USD pair and positioning for any further appreciating move.
There isn't any major market-moving economic data due for release from the UK, while the US money markets will remain closed in observance of Columbus Day. This further held investors on the sidelines and collaborated towards capping gains for the GBP/USD pair, rather prompted some selling at higher levels. Market participants now look forward to the UK monthly employment details, scheduled for release on Tuesday for some meaningful trading opportunities.
Technical levels to watch
USD/TRY’s advance to its new all-time high at 8.99 has practically taken it to Commerzbank’s upside target at 9.00. The pair could surge as high as the 10.00 level.
Bullish bias while above the 8.8037 early October low
“A rise and daily chart close above the psychological 9.00 mark would put a daily 0.1 x 3 vertical Point & Figure target at 9.10 on the map. Further up lies the 10.00 mark.”
“We will stay immediately bullish while the cross remains above the 8.8037 early October low.”
“Minor support below the next lower 8.7267/6824 August and September 20 high is seen between the breached four-month resistance line and the 55-day moving average at 8.5678/5253.”
“Key support remains to be seen between the June-to-September lows at 8.2925/2605. Support below the 8.2605 June low comes in at the 8.2056 May low with further support being seen at the 8.1300 late April low.”
EUR/JPY has surged higher as the yen itself weakens sharply on a broad basis. The pair should see an important base established above 130.75 with resistance then seen at 131.04/10 initially and with its “measured base objective” seen at 133.43, economists at Credit Suisse report.
EUR/JPY to confirm a base above 130.75 with resistance seen at 131.04/10
“The spotlight turns to key resistance from the September highs and ‘neckline’ at 130.48/75. With USD/JPY already seen establishing a major base, we look for this to be cleared also to see an important base established here as well to mark the beginning of a more sustained move higher.”
“We would see initial resistance at the 50% retracement of the fall from June and mid-July reaction high at 131.04/10, ahead of the 61.8% retracement at 131.77. The ‘measured base objective’ though would be seen higher at 133.43.”
“Support moves to 130.30 initially, then 129.98, with 129.51 now ideally holding to keep the immediate risk higher.”
USD/JPY has today hit its highest level since December 2018, extending the upward move evident earlier in the year. Economists at Rabobank expect the pair to pounce the 113.70 December 2018 peak on an erosion of the 113.00 psychological level.
Nikkei 225's impressive increase puts additional weight on the safe-haven JPY's shoulders
“The move higher in US yields has enhanced the outlook for the USD vs. the JPY which in turn provided support for Japanese exporters and the Nikkei 225. Japanese firms were also relieved by the suggestion from PM Kishida that he is not intending to hike capital gains tax.”
“Considerable uncertainties remain over the economic policies of the new PM and these will seep through into business confidence, growth and potentially BoJ policy and the JPY over the medium-term.”
“A break of the 113.00 psychological level could put the December 2018 high in the 113.70 region in play.”
The EUR/USD pair registered losses for the fifth straight week. The fundamental, short-term valuation and technical factors are all aligning to point to this EUR/USD move to the downside having further to go, economists at MUFG Bank report.
EUR/USD set to grind further lower
“The ECB’s 5.0% GDP forecast for 2021 for the eurozone looks a stretch now. Furthermore, there was a speech by Chief Economist Philip Lane who was very firm in his views on inflation risks. Energy shocks tend to be contractionary, he stated, adding that the efforts of the ECB to re-anchor inflation expectations at 2% were not over. This to us is a clear message that there will be strong resistance to any shift in stance or communication through this period of inflation uncertainty.”
“The 2yr US-EU spread just broke through 100bps again and the jobs data is likely to give this spread further momentum in favour of lower EUR/USD. We are at a critical technical juncture here also. On a weekly chart – the 100-week MAV has just been broken and a close at this level is a strong bearish signal. Indeed, the last break to the downside was in Q1 2019 which saw EUR/USD head to the lows below 1.1000.”
“Our yield-based EUR/USD model also indicates current fair-value for EUR/USD being around the middle of the 1.100-1.1500 range – implying EUR/USD is currently trading about 2.5%-3.0% rich to fair-value.”
British Prime Minister Boris Johnson's spokesman said on Monday that they will be sharing the negotiating document on the Northern Ireland protocol directly with the European Commission later in the week, as reported by Reuters.
"Without new arrangements on governance, the protocol will never have the support it needs to survive," the spokesman added.
Market reaction
These comments don't seem to be having a noticeable impact on market sentiment. As of writing, the UK's FTSE 100 Index was up 0.37% on a daily basis at 7,121. Meanwhile, the GBP/USD pair is clinging to modest daily gains at 1.3630.
The Russian rouble continues its rise. USD/RUB weighs on the June trough at 71.55 below which lies the September 2018 high at 70.64, Axel Rudolph, Senior FICC Technical Analyst at Commerzbank, reports.
A rise and daily chart close above 73.62 is needed to see a bullish reversal
“USD/RUB continues its descent and weighs on the June low at 71.55, a daily chart close below which would engage the September 2018 high at 70.64. Slightly further down lies the December 2018 high at 69.78. Still further down the 2014-2021 uptrend line can be spotted at 69.52.”
“Minor resistance above the 72.22 September low sits between the August and early September lows at 72.55/69. Further resistance comes in between the two and seven month resistance lines at 72.97/73.35.”
“For any kind of (unexpected) bullish reversal to gain traction, a rise and daily chart close above the September 20 high at 73.62 would need to be seen. This scenario is highly unlikely, though, and instead further weakness is probably on the cards.”
The US Dollar Index (DXY) has strengthened by just over 2.5% from the intra-day low on 3 September as it moves closer to the high from 25 September 2020 at 94.742. In the view of economists at MUFG Bank, the stage is set for further USD strength in near-term but not without reversal risks.
A gradual grind higher for the US dollar over the coming weeks
“The Fed has signalled that it is planning to tighten policy more quickly than previously anticipated. We expect the Fed to announce QE taper plans at their next meeting in November. It would require evidence of much sharper loss of US growth momentum to delay QE taper plans.”
“We expect further USD upside in the near-term against other major currencies although President Biden’s Fed picks do pose reversal risks. It has been reported that an announcement could be made in the coming weeks.”
“The Fed’s continued hawkish policy shift combined with more persistent upside inflation risks is keeping upward pressure on US yields and the USD. Even after recent hawkish market repricing, the US rate market is still not expecting the Fed funds rate to rise beyond 1.00% by the end of 2023.”
AUD/USD has triggered a short-term base above 0.7312/17. However, analysts at Credit Suisse expect the 2021 downtrend at 0.7365 to cap the market.
The 2021 downtrend at 0.7365 is set to cap
“AUD/USD has broken out resistance at 0.7312/17, which suggests a short-term correction higher to the 2021 downtrend at 0.7365, which we then expect to cap the market. Thereafter, support is seen at 0.7291/87 initially, below which would confirm a turn back lower and retest of 0.7179/70 lows.”
“Beneath the 0.7179/70 lows should then clear the way for a test of major support starting at 0.7126/06, which is the ‘neckline’ to a major potential top and stretching down through 0.7053 to 0.6991. Below here would complete a large and substantial top to mark a significant change of trend lower.”
“A break above the important 2021 downtrend at 0.7365 would suggest a new lower level range is developing, with next resistance seen at 0.7410, then 0.7451.”
USD/MYR now risks a probable breakdown of the 4.1600 level, suggested Quek Ser Leang at UOB Group’s Global Economics & Markets Research.
Key Quotes
“Last Monday (04 Oct, spot at 4.1700), we highlighted that USD/MYR ‘is under mild downward pressure and could drift lower’. We were of the view that ‘any weakness is unlikely to threaten the support at 4.1550’. Our expectations for USD/MYR to drift lower did not materialize as it traded within a range of 4.1680/4.1850 last week.”
“USD/MYR opened sharply lower earlier today and downward pressure has increased (note that daily MACD is turning negative). For this week, there is room for USD to break 4.1600 but the next support at 4.1530 could be out of reach. Resistance is at 4.1760 followed by 4.1830.”
- EUR/USD fades Friday’s advance and drops to 1.150.
- The rebound in the greenback weighs on the pair on Monday.
- Industrial Production in Italy surprised to the upside in August.
The single currency comes under some selling pressure and drags EUR/USD back to the mid-1.1500s at the beginning of the week.
EUR/USD depressed on dollar strength
EUR/USD leaves behind Friday’s advance and returns instead to the lower end of the recent range in the 1.1550 region on Monday.
The resumption of the bid bias in the dollar coupled with higher US yields across the curve encourages the US Dollar Index to refocus its price action on the upside and with the immediate target at the 2021 peaks around 94.50.
Higher yields in the German 10-year Bunds – which trade in levels last seen in May around -0.12% - fail to ignite some fresh spark of buying interest in the European currency, leaving spot to the mercy of sellers for the time being.
Nothing of note in the euro docket, where Italian Industrial Production contracted 0.2% MoM in August and came flat on a yearly basis, both prints coming above initial estimates.
What to look for around EUR
Despite the recent bullish attempt, EUR/USD remains well under pressure. Indeed, dollar dynamics continue to rule the sentiment surrounding the European currency and relegate the pair to trade near YTD lows for the time being. The firmer tone in the buck along with higher US yields and bouts of risk aversion – particularly on the debt ceiling issue - continue to undermine the performance of the risk universe, while the growth outlook appears under pressure on rising speculations that the inflation could take longer to reverse the ongoing elevated levels. In addition, the likely loss of momentum in the economic recovery, as per some weakness seen in key fundamentals, also caps the upside potential in the pair.
Key events in the euro area this week: German/EMU Economic Sentiment (Tuesday) – German final CPI, EMU Industrial Production (Wednesday) – European Council Meeting (Thursday) - European Council Meeting, EMU Balance of Trade (Friday).
Eminent issues on the back boiler: Asymmetric economic recovery in the region. Sustainability of the pick-up in inflation figures. Progress of the Delta variant of the coronavirus and pace of the vaccination campaign. Probable political effervescence around the EU Recovery Fund. Investors’ shift to European equities in the wake of the pandemic could lend extra oxygen to the single currency. ECB tapering speculations.
EUR/USD levels to watch
So far, spot is losing 0.09% at 1.1560 and faces the next up barrier at 1.1640 (weekly high Oct.4) followed by 1.1664 (20-day SMA) and finally 1.1755 (weekly high Sep.22). On the other hand, a break below 1.1529 (2021 low Oct.6) would target 1.1500 (round level) en route to 1.1495 (high Mar.9 2020).
- USD/CHF edged higher on Monday amid a modest USD strength.
- Hawkish Fed expectations acted as a tailwind for the greenback.
- The cautious mood might benefit the CHF and cap the upside.
The USD/CHF pair quickly recovered over 20 pips from the early European session lows and has now moved to the top end of its intraday trading range, around the 0.9280 region.
The pair managed to attract some dip-buying near the 0.9260-55 region on Monday and was supported by a modest US dollar strength, though a cautious mood around the equity markets capped gains. Despite the disappointment from the headline NFP print, expectations for an imminent Fed taper announcement acted as a tailwind for the greenback.
In fact, investors remain convinced that the Fed will begin rolling back its massive pandemic-era stimulus as soon as November. The markets might have also started pricing in the possibility of an interest rate hike by the Fed in 2022 amid worries that the recent surge in crude oil/energy prices will stoke inflation.
The prospects for an early policy tightening, along with fears of a faster than expected rise in inflation pushed the yield on the benchmark 10-year US bond beyond the 1.60% threshold or four-month tops on Friday. This was seen as another factor that continued underpinning the greenback and extended some support to the USD/CHF pair.
Meanwhile, concern about stagflation kept a lid on the optimism and tempered investors' appetite for perceived riskier assets. This, in turn, could benefit the safe-haven Swiss franc and keep a lid on any meaningful upside for the USD/CHF pair, warranting caution for aggressive bullish traders amid absent relevant market moving-economic data.
Technical levels to watch
Quek Ser Leang at UOB Group’s Global Economics & Markets Research noted that USD/THB could see its upside bias alleviated once 33.60 is cleared.
Key Quotes
“In our update from last Monday (27 Sep, spot at 33.67), we highlighted that ‘overbought conditions coupled with early signs of waning momentum indicates that USD/THB is unlikely to strengthen from here’ and we expected USD/THB to ‘trade between 33.40 and 33.95.”
“USD/THB subsequently traded between 33.63 and 33.99. Upward momentum has waned further and the chance for USD/THB to break the rising trend-line support (currently at 33.60) has increased.”
“A break of the trend-line would indicate that the USD/THB strength from early September has run its course.”
- AUD/JPY hits three-month highs just shy of the 83 threshold.
- Soaring energy prices and yields differential boost AUD/JPY.
- AUD/JPY storms through the critical 200-DMA in a three-day uptrend.
AUD/JPY has kicked off a new week with a bang, closing in on the $83 mark, up over two big figures so far.
The widening US-Japanese yields differentials continue to benefit USD/JPY, in turn, boding well for the cross. Meanwhile, surging natural gas prices lifts the sentiment around the aussie dollar, despite the risk-off trading in the European equities.
At the time of writing, AUD/JPY is trading at 82.82, up 1.04% on the day, looking for a sustained move above the 83.00 mark.
Technically, the cross has recaptured the critical horizontal 200-Daily Moving Average (DMA) at 82.35, having found a strong foothold above the downward-sloping 100-DMA at 81.82.
The 14-day Relative Strength Index (RSI) is sitting just beneath the overbought territory, allowing room for more upside.
Acceptance above the 83.00 level could call for a test of the July tops at 84.19.
AUD/JPY: Daily chart
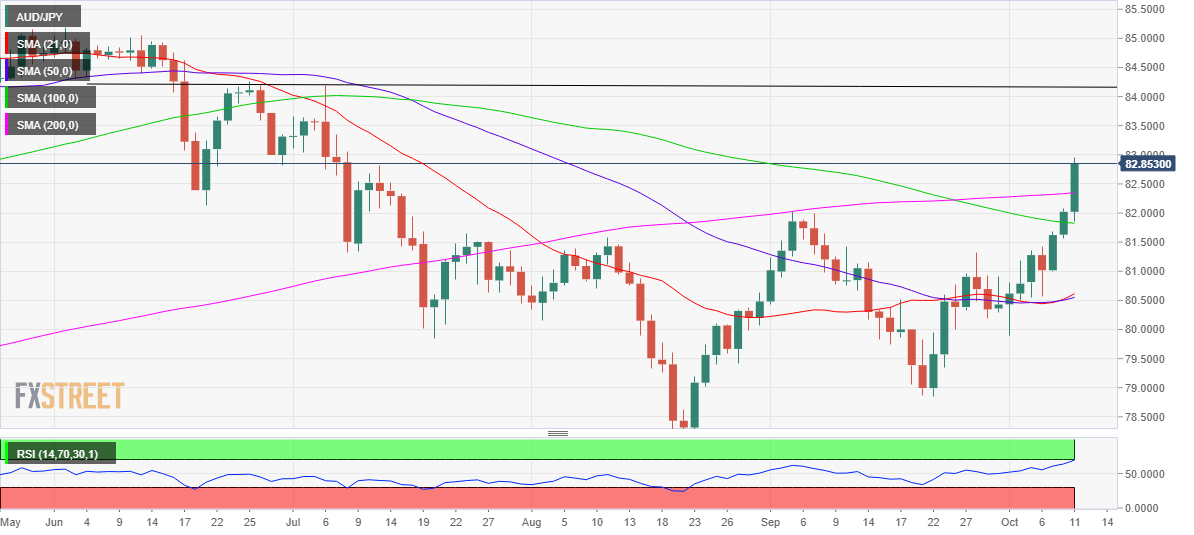
On the flip side, the buyers remain cheerful so long as the 100-DMA resistance-turned-support holds.
A break below the last could trigger a sharp sell-off towards the 80.00 psychological level.
AUD/JPY: Additional levels to consider
USD/JPY has surged sharply higher for a break above key long-term resistance from the 2019 and 2020 highs at 112.40 and 112.23 respectively. Economists at Credit Suisse expect the pair to trend higher for the 2018 highs at 114.26/55 initially and then 117.20, the long-term downtrend from April 1990.
Support at 111.51/41 to hold
“Immediate resistance is seen at 113.20/21 ahead of 113.70/71 and then the 2018 highs at 114.26/55. Whilst we would look for an initial pause here we look for this to be temporary with resistance above 114.55 seen next at the 78.6% retracement of the December 2016/March 2020 fall at 114.92 and then 117.20 in due course, the long-term downtrend from April 1990.”
“Big picture, the ‘measured base objective’ is seen at 122.90/123.00.”
“Near-term support moves to 112.33, then 112.08/05. Below this latter area can see a deeper pullback to the ‘neckline’ to the base at 111.87, with 111.51/41 now ideally holding.”
Oil prices have risen substantially this year; WTI crude is up 60.1% to $77.43/bbl and Brent has risen 58.1% to $80.98/bbl. Strategists at JP Morgan expect price pressures will persist and lead to higher inflation.
Brent prices to average $70-$80 in 4Q21
“Our base case remains that Brent prices average $70-$80 in 4Q21 as global inventories are restocked and global consumption continues to recover. We acknowledge that persistent supply chain constraints present some upside risk to this outlook. With that said, it should be emphasized the OPEC+ has plenty of capacity to ramp up production and could do so if prices continue to move higher.”
“Going forward, its likely oil prices will remain elevated over the medium-term, keeping headline inflation above 3% through mid-2022. However, supply constraints should ease and inventories should gradually be rebuilt, allowing for inflationary pressures driven by higher oil prices to ease into 2023.”
- DXY starts the week on a positive footing above 94.00.
- US 10-year yields regain traction above the 1.60% mark.
- Short-term Auctions will be the sole release in the US docket.
The greenback, when tracked by the US Dollar Index (DXY), manages to reverse two sessions with losses and resumes the upside around the 94.20 area on Monday.
US Dollar Index up on higher yields
The index picks up further pace and re-visits the 94.20 region at the beginning of the week sustained by the positive momentum in US yields.
Indeed, yields of the key US 10-year benchmark note extend the rally and climb past the 1.61%. The short end of the curve, in the meantime, records new highs above 0.32% so far on Monday.
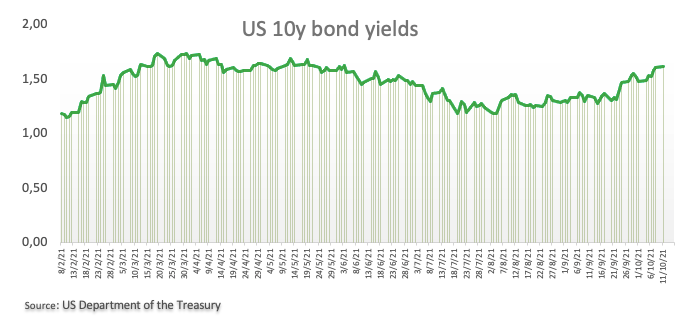
Indeed, the selloff in the fixed-income universe remains well in place for yet another session, while market participants continue to digest Friday’s disheartening Payrolls figures along with prospects of QE tapering as soon as in November.
Nothing scheduled data wise in the US docket other than a 3m, 6m Bill Auctions. Later in the week, the focus of attention is expected to gyrate around the publication of inflation figures tracked by the CPI for the month of September.
What to look for around USD
The index resumes the upside and keeps navigating in the upper end of the recent range north of 94.00 the figure on Monday. Positive news from the debt-ceiling front sponsors the selloff in the bonds market and propel yields higher, lending extra legs to the buck at the same time Looking beyond the immediate term, the dollar remains underpinned by markets’ adjustment to prospects for a “soon” start of the tapering process, probable rate hikes at some point during next year and the rising view that elevated inflation could last more than initially expected.
Key events in the US this week: Inflation tracked by the CPI, FOMC Minutes (Wednesday) – initial Claims (Thursday) – Retail Sales, flash Consumer Sentiment (Friday).
Eminent issues on the back boiler: Biden’s multi-billion Build Back Better plan. US-China trade conflict under the Biden’s administration. Tapering speculation vs. economic recovery. Debt ceiling debate. Geopolitical risks stemming from Afghanistan.
US Dollar Index relevant levels
Now, the index is gaining 0.16% at 94.26 and a break above 94.50 (2021 high Sep.30) would open the door to 94.74 (monthly high Sep.25 2020) and then 94.76 (200-week SMA). On the flip side, the next down barrier emerges at 93.67 (weekly low Oct.4) followed by 93.59 (20-day SMA) and finally 92.98 (weekly low Sep.23).
In the view of the strategists at Goldman Sachs, it’s a good opportunity to buy Wall Street stocks, including the S&P 500 index, despite the rising stagflation worries.
Key quotes
“Despite near-term uncertainty, we expect the equity market will continue to rally as investors gain confidence that the current pace of inflation is transitory.”
“We believe this dip will prove a good buying opportunity, as 5% pullbacks usually have in the past.”

Related reads
- Wall Street Week Ahead: No jobs, no taper, no rally. Can earnings change things?
- WTI renews seven-year highs amid persisting global energy crunch.
- The US oil is set to test the rising trendline hurdle at $81.10 on the 4H chart.
- Overbought RSI, light trading could exaggerate the moves in WTI.
WTI (NYMEX futures) bulls remain unstoppable, as they look to test the offers above the $81 mark, as major world economies grapple with an ongoing energy supply crunch.
With the covid situation improving globally and most economies emerging successfully out of the pandemic-induced lockdowns, the demand for black gold is on the rise, supporting the price rally.
In another evidence of increasing confidence in oil, fund managers increased their net long positions in the US crude futures and options in the week to October 5, according to the latest Commodity Futures Trading Commission (CFTC) data.
From a short-term technical perspective, WTI is inching closer towards the rising trendline resistance at $81.10 on the four-hour chart, beyond which there are increasing odds of the bulls initiating a fresh uptrend towards $82.
WTI: Four-hour chart
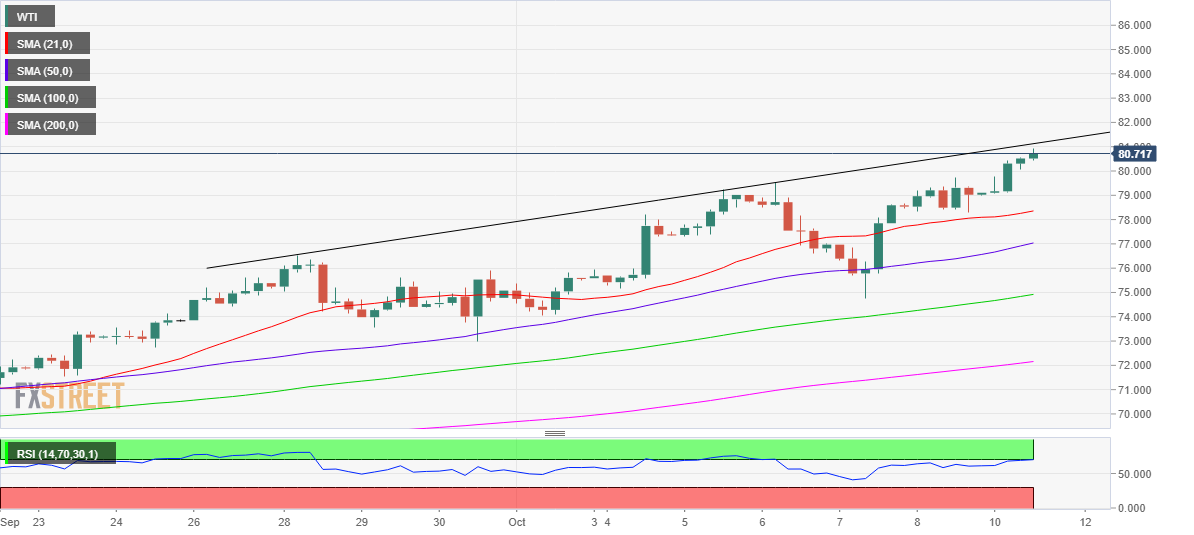
However, with the Relative Strength Index (RSI) peeping into the overbought region, currently at 70.48, the bulls could turn cautious.
Therefore, a retreat towards the $80 psychological level cannot be ruled out before the next upswing kicks in.
The 21-Simple Moving Average (SMA) at $78.36 will offer critical support to the oil buyers.
WTI: Additional levels to watch
- USD/CAD dropped to two-month lows and was pressured by a combination of factors.
- Slightly oversold RSI (14) on the 4-hour chart held trades from placing aggressive bets.
The USD/CAD pair remained on the defensive through the first half of the European session and was last seen trading around mid-1.2400s, or the lowest level since late July.
An extension of the recent bullish run in crude oil prices continued underpinning the commodity-linked loonie and exerted some pressure on the USD/CAD pair. That said, a modest US dollar strength – amid firming expectations for an imminent Fed taper announcement – helped limit any deeper losses, at least for the time being.
From a technical perspective, the USD/CAD pair, so far, has managed to defend a support marked by the lower boundary of a three-week-old descending channel. However, Friday's sustained break through the very important 200-day SMA and acceptance below the 1.2500 psychological mark supports prospects for a further near-term decline.
Meanwhile, technical indicators on the daily chart maintained their bearish bias and are still far from being in the oversold territory, adding credence to the negative outlook. That said, RSI (14) on the 4-hour chart is hovering below the 30 mark, which seemed to be the only factor that held traders from placing fresh bearish bets.
Hence, it will be prudent to wait for a convincing break below the trend-channel support, around the 1.2425 region before positioning for any deeper pullback amid a bank holiday in the US and Canada. The USD/CAD pair might then turn vulnerable and break below the 1.2400 mark, towards testing the next relevant support near the 1.2320-15 area.
On the flip side, any attempted recovery move might now confront stiff resistance near the 1.2500 mark. This is closely followed by the 200-day SMA support breakpoint, around the 1.2510 region, which if cleared decisively might trigger a short-covering move and allow bulls to aim back to reclaim the 1.2600 mark.
The momentum could further get extended towards the descending trend-channel resistance, currently near mid-1.2600s. The latter should act as a key pivotal point for short-term traders. A sustained move beyond will negate any negative bias and shift the near-term bias in favour of bullish traders.
USD/CAD 4-hour chart
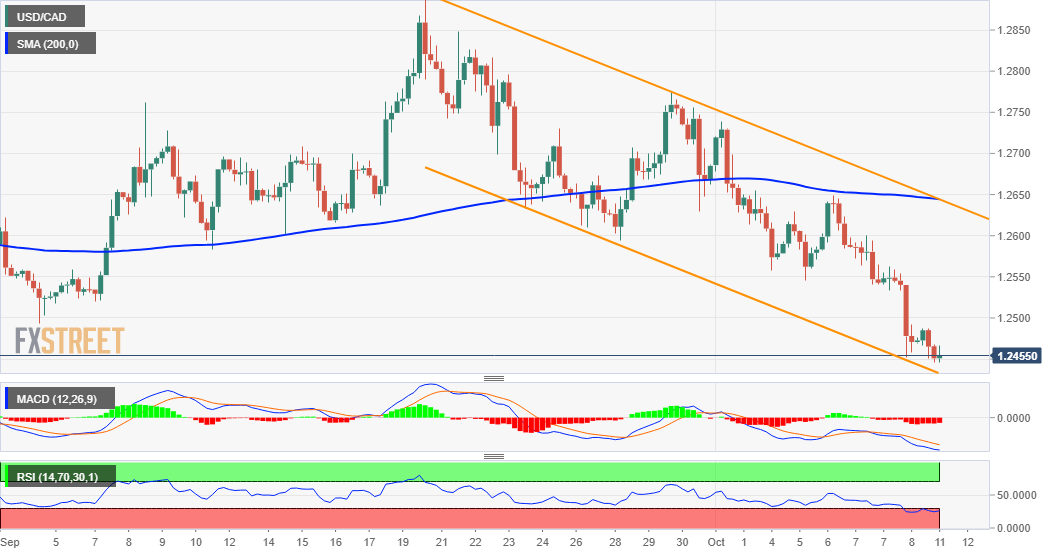
Technical levels to watch
"High gas prices are already pulling on the US and it is going to feel the pressure soon," Saad al-Kaabi, Qatari minister of state for energy, said on Monday, as reported by Reuters.
Additional takeaways
"Customers are already feeling the pressure of high gas prices because they will pay more for electricity."
"High gas prices will ease off slightly as some plants come back up and with the Russian pledge to supply more gas into Europe."
"Qatar will not expedite the timeline of north field expansion to meet high gas demand."
"The lesson from high gas prices is there should be more long-term supply deals."
" Qatar Energy has no plans to offer its assets up to investors, we have plenty of cash."
Market reaction
These comments don't seem to be having a significant impact on market sentiment. As of writing, the S&P Futures were down 0.27% on a daily basis.
The Reserve Bank of New Zealand (RBNZ) increased its benchmark rate for the first time in seven years and signalled further tightening. Economists at HSBC expect the next 25bp hike to come in November 2021, with further hikes due next year. What’s more, they still look for modest NZD weakness against the USD over the next 12 months.
The benchmark rate to reach 1.50% by end-2022
“Our central scenario is the RBNZ lifts its cash rate to 0.75% in November 2021, with further hikes through next year to 1.50% by end-2022, but the Delta variant and transitioning to ‘living with’ the virus remain clear near-term downside risks to domestic growth.”
“We see NZD/USD moving in a narrow range over the near-term, albeit with modest NZD weakness against the USD over the next 12 months.”
USD/CNH is now seen trading within the 6.4240-6.4800 range in the next weeks, suggested FX Strategists at UOB Group.
Key Quotes
24-hour view: “We expected USD to ‘trade between 6.4460 and 6.4660’ yesterday. USD subsequently traded within a narrower range than expected (6.4481/6.4566). The quiet price actions offer no fresh clues and further sideway-trading appears likely. Expected range for today, 6.4450/6.4650.”
Next 1-3 weeks: “There is not much to add to our update from Wednesday (06 Oct, spot at 6.4500). As highlighted, the recent downside risk has dissipated and USD is likely to trade between 6.4240 and 6.4800 for a period of time.”
Sterling cuts losses as the GBP/USD pair is trading at its highest level since late September. The cable could extend its advance towards the 1.3840/1.3910 region once above the 1.3660 resistance level, economists at Société Générale report.
Cable is probing daily Kijun line
“GBP/USD is in vicinity to daily Kijun line at 1.3660. Once overcome, ongoing rebound could extend towards 200-DMA and the daily Ichimoku cloud at 1.3840/1.3910.”
“Recent trough at 1.3410 remains a crucial support.”
- AUD/USD started the new week on a firm footing.
- US Dollar Index continues to move sideways above 94.00.
- Rising copper prices help AUD gather strength on Monday.
The AUD/USD pair closed the previous week modestly higher and preserved its bullish momentum on Monday. As of writing, the pair was trading at its highest level since mid-September at 0.7344, rising 0.5% on a daily basis.
In the absence of significant fundamental drivers and high-tier macroeconomic data releases, rising copper prices seem to be providing a boost to the commodity-related AUD at the start of the week. Currently, copper futures on COMEX are up 1.5% on a daily basis.
In the meantime, US stocks index futures are down between 0.55% and 0.16% during the European trading hours, suggesting that the cautious market mood could make it difficult for AUD/USD to continue to edge higher in the American session.
At the moment, the US Dollar Index is posting small daily gains at 94.15. The US bond markets will be closed due to the Columbus Day holiday and the risk sentiment is likely to impact the USD's valuation in the second half of the day.
On Tuesday, September HIA New Home Sales and National Australia Bank's Business Confidence data from Australia will be looked upon for fresh impetus.
AUD/USD near-term outlook
OCBC Bank analysts think that the AUD/USD pair could target 0.7400 next after managing to close the previous week above 0.7300.
"ACGBs has underperformed USTs in run higher in yield, providing some additional support for the AUD beyond risk sentiment," analysts added.
AUD/USD set to pounce the 0.7400 level – OCBC.
Technical levels to watch for
USD/CAD was successful in its attempt to break and close below 1.25 on Friday. Economists at Société Générale expects the pair to see further losses towards 1.2440/1.2420.
Short-term down move
“We think there is further room to catch up to the downside if oil prices stay above $83.”
“USDC/AD could drift towards 1.2440/1.2420 and 1.2365, the 61.8% retracement of recent bounce.”
“Reclaiming daily Ichimoku cloud at 1.2650 can lead to resumption in up move.”
AUD/USD closes in on the multi-week high it set at 0.7340 on Friday. The aussie is set to challenge the 0.7400 level as it stays on a firm footing above 0.7300, economists at OCBC Bank report.
Supported by ACGBs which has underperformed USTs in run higher in yield
“AUD/USD held above the 0.7300 mark on Friday. Consolidating above this level could see the pair target 0.7400 next, leaving the AUD bears impinged.”
“ACGBs has underperformed USTs in run higher in yield, providing some additional support for the AUD beyond risk sentiment.”
EUR/USD is in proximity to the peak of March 2020 at 1.1495. A loss of this level would imply a deeper dip to the 1.1450 mark, economists at Société Générale report.
Initial bounce not ruled out
“An initial rebound is not ruled out, 1.1640/1.1665 could be the first layer of resistance.”
“Failure to hold above 1.1495 can result in continuation of decline towards 1.1450 and projections of 1.1380.”
USD/JPY climbs to its highest level since 2018. The pair is now set to attack the 113.10 mark, economists at Société Générale report.
Support 112.00, resistance 113.10
“USD/JPY has now crossed above the peak of 2020 at 112.23/112.00 highlighting persistence of upward momentum.”
“Next potential objectives are located at 113.10 and projections of 113.40/113.90.”
“Previous peak at 112.23/112.00 and recent low of 110.80 are short-term support levels.”
Ireland’s Foreign Minister Simon Coveney said on Monday, he believes the European Union (EU) wants a deal but needs to compromise too.
Additional quotes
“Dismissals are more serious this week as compromise proposals are being put forward by the EU.”
“Very close to the point where the EU will say there can be no further compromises.”
“British government seems to be shifting the playing field, they know EU can't move on ECJ.”
These comments come after Coveney warned on Sunday that the UK demands risk a "further breakdown in relations" with the EU ahead of talks this week aimed at resolving the impasse over the Brexit agreement.
Market reaction
GBP/USD is retracing gains due to resurfacing Brexit concerns, now trading at 1.3645, up 0.26% on the day.
- A subdued USD price action assisted NZD/USD to gains some positive traction on Monday.
- Hawkish Fed expectations should act as a tailwind for the USD and cap gains for the major.
- A bank holiday in the US also warrants some caution before placing aggressive bullish bets.
The NZD/USD pair held on to its modest intraday gains through the early part of the European session and was last seen trading near daily tops, just below mid-0.6900s.
The pair managed to gain some positive traction on the first day of a new week and inched back closer to Friday's post-NFP swing highs amid a subdued US dollar price action. Apart from this, the uptick lacked any obvious catalyst and runs the risk of fizzling out rather quickly.
Despite the disappointing headline NFP print, investors still seem convinced that the Fed will begin tapering its bond purchases by the end of 2021. The markets have also been pricing in the possibility of a rate hike in 2022 amid fears of a faster-than-expected rise in inflation.
The market expectations were reinforced by the recent surge in the US Treasury bond yields, which should continue to act as a tailwind for the greenback and cap gains for the NZD/USD pair. In fact, the yield on the benchmark 10-year US government bond shot to four-month tops on Friday.
The US money markets will remain closed on Monday in observance of Columbus Day. This further makes it prudent to wait for a strong follow-through buying before placing aggressive bullish bets around the NZD/USD pair and positioning for any meaningful intraday appreciating move.
Technical levels to watch
- A combination of factors pushed GBP/JPY higher for the third successive session on Monday.
- The British pound got a strong boost after the BoE signalled that it could hike rates this year.
- The widening of the UK-Japanese bond spread weighed on the JPY and remained supportive.
The GBP/JPY cross continued scaling higher through the early European session and shot to the highest level since June 28, around the 154.20-25 region in the last hour.
The cross built on last week's strong bullish momentum and gained follow-through traction for the third successive session on Monday. This also marked the sixth day of a positive move in the previous seven and was sponsored by a combination of factors. The British pound was underpinned by comments by the Bank of England (BoE) officials, signalling an imminent interest rate hike.
Michael Saunders, one of the most hawkish members of the BoE's Monetary Policy Committee, suggested in remarks published Saturday that investors were right to bring forward bets on rate hikes. Earlier Governor Andrew Bailey warned of a potentially very damaging period of inflation unless policymakers take action, shifting the market focus to the upcoming policy meeting in November.
The money markets now seem to have fully priced in a 25bps BoE rate hike in December. This was evident from a spike in the UK 10-year gilt yield, which rose to the highest level since May 2019, at 1.204% and widened the UK-Japanese government bond yield spread. The yield on the 10-year Japanese government bond remained near zero due to the Bank of Japan's yield curve control policy.
Apart from this, the underlying bullish sentiment in the financial markets turned out to be another factor that weighed heavily on the safe-haven Japanese yen and benefitted the GBP/JPY cross. Monday's strong move up could further be attributed to some technical buying on a sustained move beyond the 152.60-80 resistance zone, setting the stage for additional gains.
In the absence of any market-moving economic releases from the UK, the GBP/JPY cross seems all set to prolong its appreciating move. That said, extremely overbought RSI on short-term charts makes it prudent to wait for some intraday consolidation or a modest pullback before placing fresh bullish bets.
Technical levels to watch
| Raw materials | Closed | Change, % |
|---|---|---|
| Brent | 82.78 | 0.33 |
| Silver | 22.629 | 0.24 |
| Gold | 1756.878 | 0.07 |
| Palladium | 2061.3 | 5.25 |
| Time | Country | Event | Period | Previous value | Forecast |
|---|---|---|---|---|---|
| 06:00 (GMT) | Japan | Prelim Machine Tool Orders, y/y | September | 86.2% | |
| 13:00 (GMT) | United Kingdom | NIESR GDP Estimate | Quarter III | 2.4% | |
| 21:45 (GMT) | New Zealand | Visitor Arrivals | August | 767.8% |
| Pare | Closed | Change, % |
|---|---|---|
| AUDUSD | 0.73079 | -0.06 |
| EURJPY | 129.882 | 0.72 |
| EURUSD | 1.15735 | 0.17 |
| GBPJPY | 152.814 | 0.58 |
| GBPUSD | 1.36165 | 0.03 |
| NZDUSD | 0.6927 | -0.02 |
| USDCAD | 1.24721 | -0.61 |
| USDCHF | 0.92701 | -0.12 |
| USDJPY | 112.214 | 0.55 |


© 2000-2026. All rights reserved.
This site is managed by Teletrade D.J. LLC 2351 LLC 2022 (Euro House, Richmond Hill Road, Kingstown, VC0100, St. Vincent and the Grenadines).
The information on this website is for informational purposes only and does not constitute any investment advice.
The company does not serve or provide services to customers who are residents of the US, Canada, Iran, The Democratic People's Republic of Korea, Yemen and FATF blacklisted countries.
Making transactions on financial markets with marginal financial instruments opens up wide possibilities and allows investors who are willing to take risks to earn high profits, carrying a potentially high risk of losses at the same time. Therefore you should responsibly approach the issue of choosing the appropriate investment strategy, taking the available resources into account, before starting trading.
Use of the information: full or partial use of materials from this website must always be referenced to TeleTrade as the source of information. Use of the materials on the Internet must be accompanied by a hyperlink to teletrade.org. Automatic import of materials and information from this website is prohibited.
Please contact our PR department if you have any questions or need assistance at pr@teletrade.global.
transfers