- Analytics
- News and Tools
- Market News
CFD Markets News and Forecasts — 12-10-2021
- EUR/USD bears are looking for a downside continuation to test weekly targets.
- At resistance, the hourly chart is riping for a downside continuation following a significant correction.
EUR/USD has seen a tremendous sell-off throughout Sep to date. The price has fallen from a fractal weekly high of 1.1909 to fresh lows at 1.1524 and into territory not traded in since July 2020. At this juncture, the price is not far off from the weekly 9 March candle's high of 1.1496 and then 1.1425 as being the 8 June weekly candle high. These are target levels for the bravest of bears who are still in anticipation of immediate lower levels.
The path of least resistance could well be to the upside at this juncture, given the weekly drop is expected to correct. However, according to the daily chart and momentum indicators, as well as the aforementioned weekly targets, there could still be some juice left to be squeezed out of this weekly move for day traders.
The following illustrates both the bullish and bearish bias in a top-down analysis, usually starting first with the monthly chart, then moving all the way into the 15-min chart. However, for the sake of the order of priority, we will look at the hourly and 15-min conditions that could offer a potential trade opportunity for day trades over the coming sessions.
EUR/USD 1-hour chart
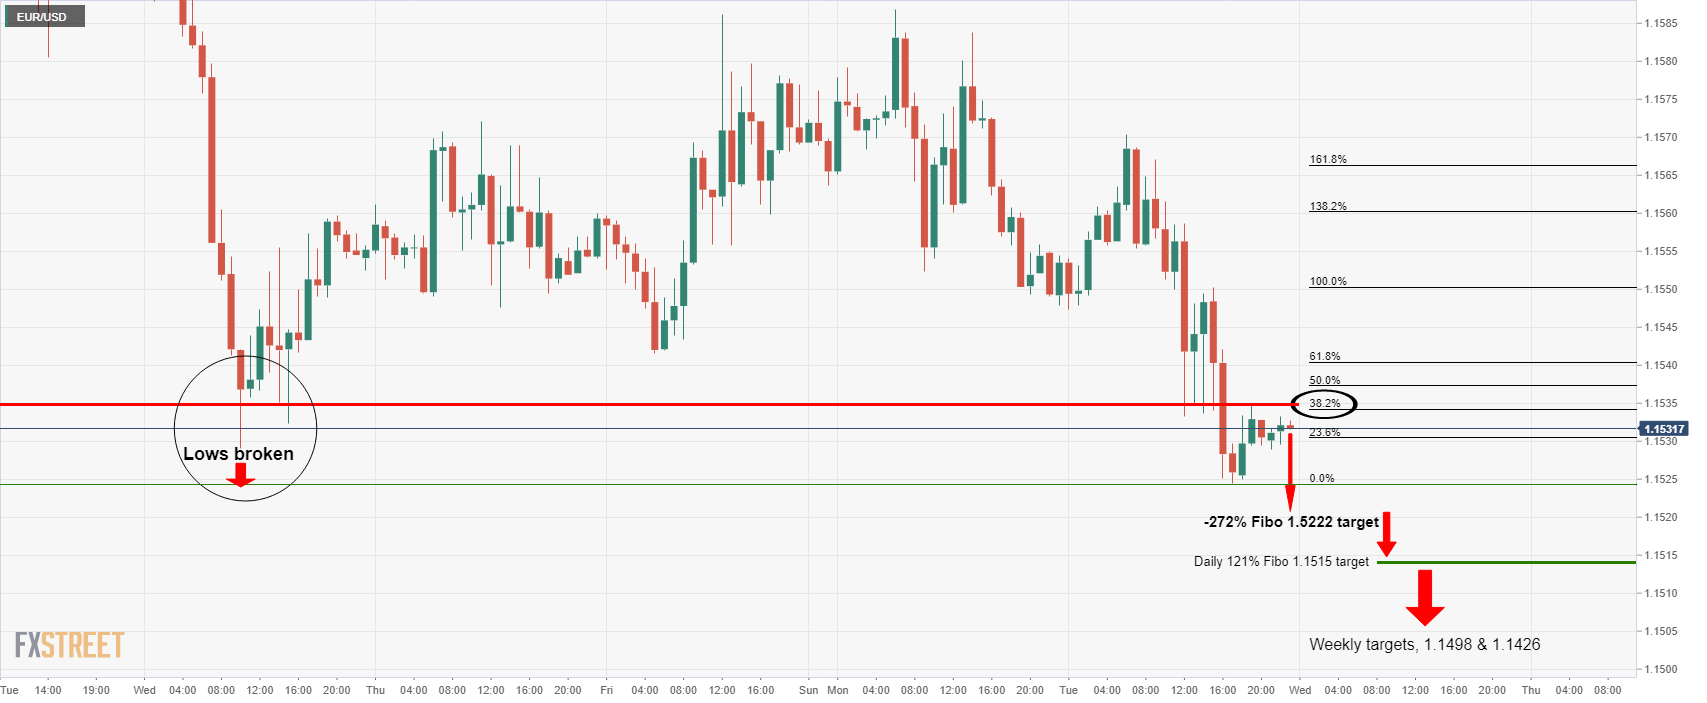
The hourly chart has seen the price fall in a bearish impulse and a correction to a significant level on the Fibonacci scale. The correction is stalling and the deceleration would be expected to lead to a downside continuation towards hourly, daily Fibo, or even, weekly structure targets as illustrated above.
EUR/USD, 15-min chart
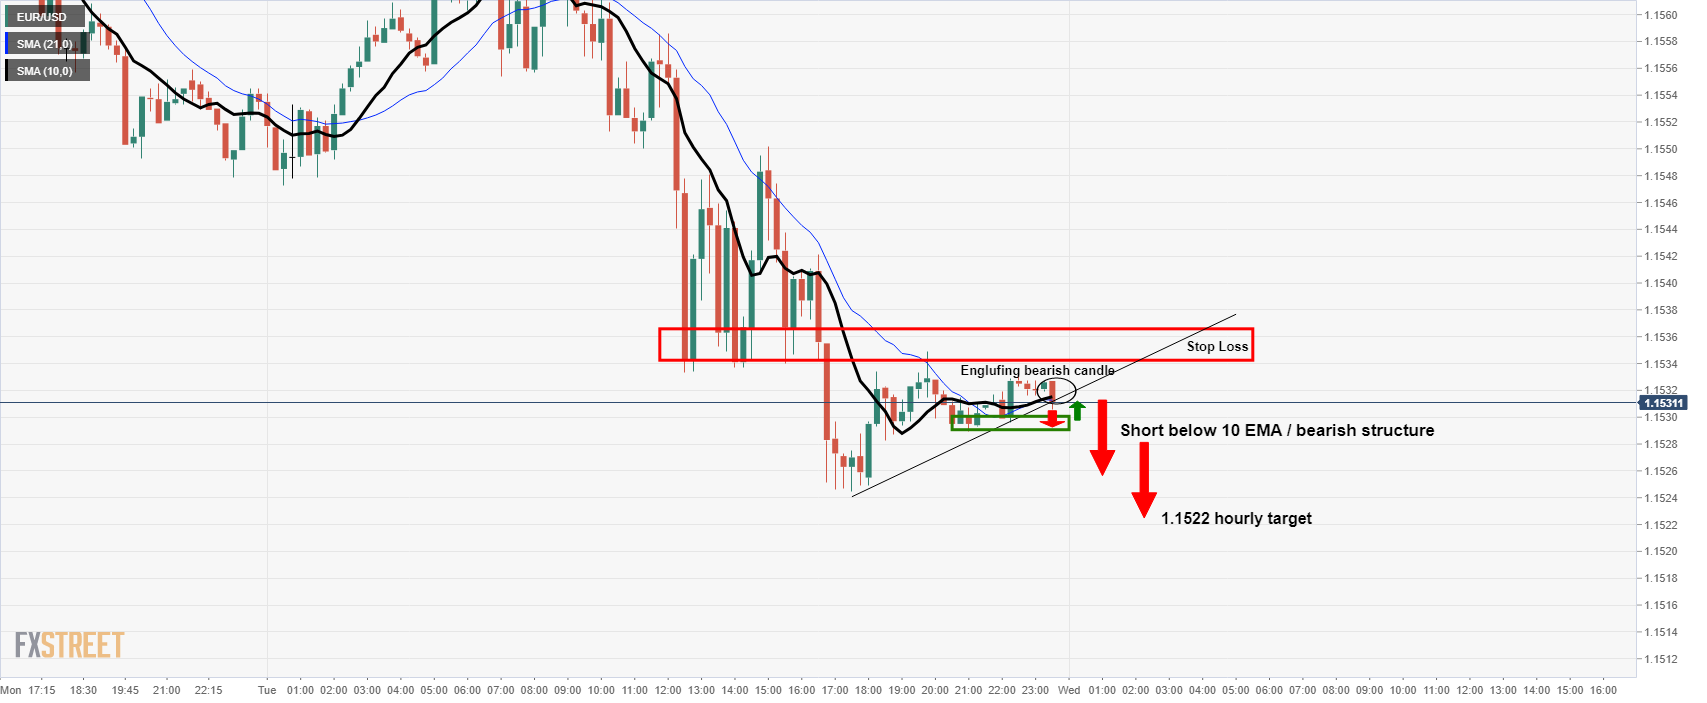
The 15 min time frame from where to execute the break of a support structure is showing an engulfing bearish test of the trendline support. A break there will likely engage the bears and potentially trigger a break of horizontal support near 1.1530 as being the prior day's closing price.
The market is bearish below there and traders can engage for a run to the hourly -272% Fibonacci retracement of the correction's range at 1.1522. However, given the quiet Asian session, the process could be slow but the Tokyo open and subsequent trade could add some life to an otherwise sleepy market.
More to come on the longer-term analysis...
- USD/JPY continue to accelerate gains for the third straight session on Wednesday.
- US dollar at fresh yearly high above 94.50 boosting prospects for USD/JPY.
- US Inflation, hawkish Fed members, and FOMC minutes steal the spotlight.
USD/JPY prints fresh daily gains on Wednesday in the early Asian trading session. The pair started higher this Monday and the momentum is still carried on the back of a firmer US dollar At the time of writing, USD/JPY is trading at 113.58, up 0.02% for the day.
The hawkish comments from Fed’s officials strengthen the US Fed’s stance on November tapering although recent economic data tell a different story. St. Louis Fed President James Bullard said he support November tapering along with Atlanta Fed President Raphael Bostic. The greenback remains supported at the higher level, pushing USD/JPY toward fresh 2021 highs.
The US Consumer Inflation Expectations came at 5.3% in September, rising for the 11th straight month whereas the number of job openings fell more than expected in August. Furthermore, the International Monetary Fund (IMF) downgraded the growth in the US economy from 7% in July to 6%. The US benchmark T-bond yields trade lower at 1.57% in response to the factors, but the US dollar remained unfazed.
On the other hand, the Japanese yen remained on the backfoot after the recent data revealed a drop in Japan’s Business Mood. The Reuters Tankan sentiment index for manufactures fell to 16 in October from 18 in the previous month.
As for now, traders are waiting for Japan’s Machine Orders, US Core Inflation Rate, and FOMC Minutes to gauge the market sentiment.
USD/JPY additional levels
- AUD/JPY reaches a fresh three-month high around the 83.80 range.
- AUD/JPY: A Doji in the daily chart depicts that the pair might correct lower before resuming the uptrend, supported by momentum indicators.
The AUD/JPY is trading unchanged as the Asian session begins and is trading at 83.48, barely down 0.01%, during the day at the time of writing. The market sentiment is mixed, as depicted by Asian equity futures, seesawing between gainers and losers.
AUD/JPY Price Forecast: Technical outlook
Daily chart
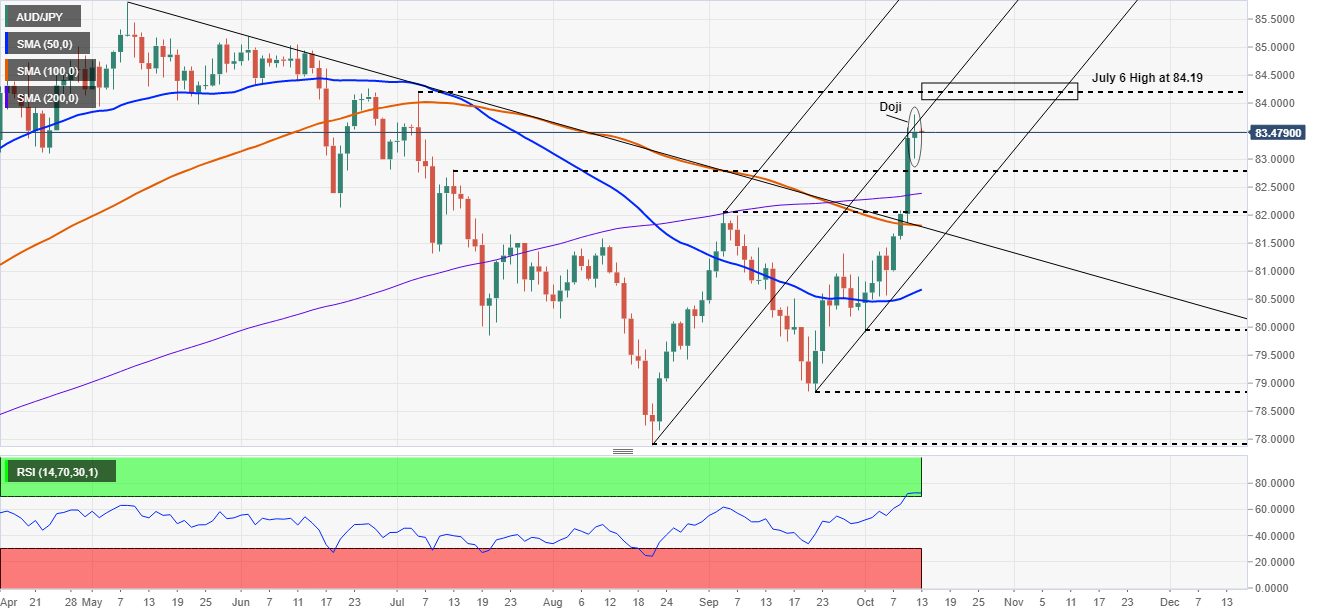
On Tuesday, the AUD/JPY reached 83.80 above the middle of the Andrew Pitchfork channel, but strong seeling pressure capped the move, retreating the cross-currency to 83.50. A breach of the latter could accelerate an upside move towards the July 6 high at 84.19, but oversold levels at the Relative Strength Index (RSI) at 73, suggests the pair could be headed for a correction towards the 200-day moving average (DMA) at 82.37, before resuming a move towards higher prices. Nevertheless, in case of a push below the 200-DMA, the September 3 high at 82.02 will be the next support before reaching the 100-DMA at 81.83.
Worth notice: the October 12 price action portrayed a Doji in the middle of the Pitchfork channel, meaning the pair could reverse the upward trend.
1-hour chart
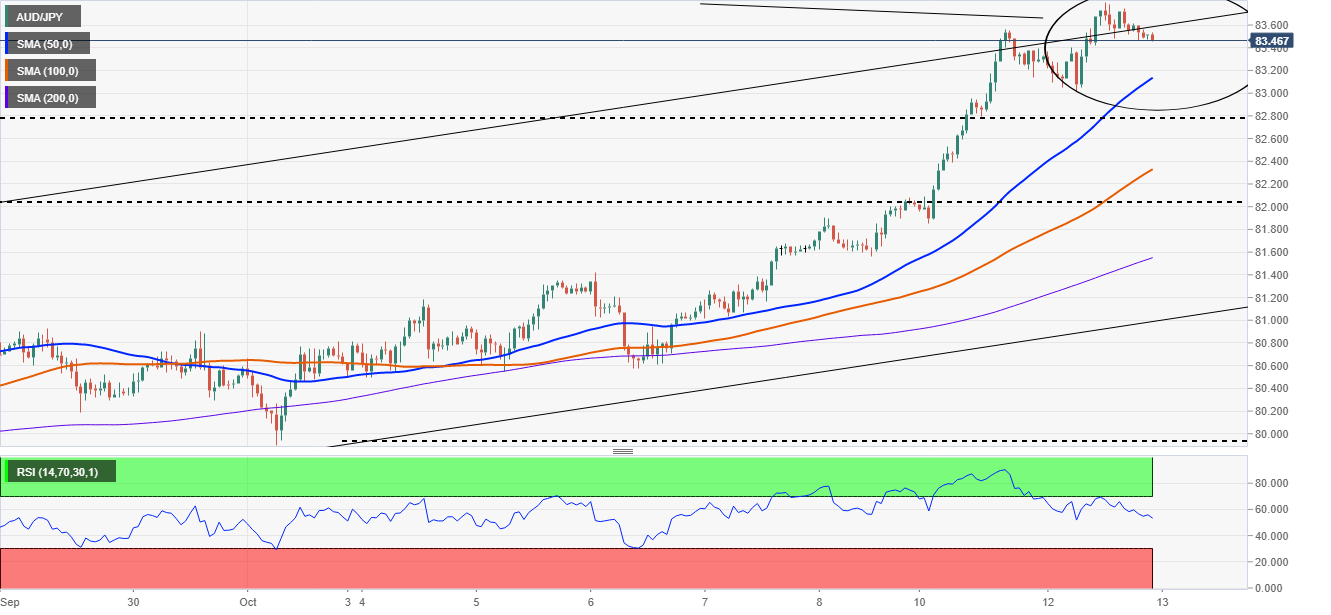
The AUD/JPY is trading within a narrow range between 83.50-83.80. A break beyond the upside level could open the way towards 84.00. However, the Relative Strength Index at 53, suggesting that an upside move might be on the cards. Failure to an upside break could signal that consolidation or a correction could lie ahead for the AUD/JPY in the near term.
On the flip side, a break beneath the bottom level will find the daily pivot at 83.41 as the first support level, followed by the 83.00 psychological level. A breach beneath the latter would exert downward pressure on the pair towards the confluence of the 50-simple moving average (SMA) and the S1 pivot level around the 83.12-83.22 area.
US Treasury Secretary Janet Yellen reiterates view high us inflation transitory and said that she sees an 'isolated' shortages of goods in coming months.
Last week, Yellen said that the various issues that have colluded to push up prices likely will pass though she’s not sure how long that will take. “Supply bottlenecks have developed that have caused inflation,” she said. ''I believe that they’re transitory, but that doesn’t mean they’ll go away over the next several months.”
Meanwhile, the carry trade currencies are up where rate hikes are being priced in from the likes of the Bank of England this year and the Federal Reserve next year. The US dollar is third to the CAD and AUD so far this week as investors seek shelter in commodity prices as a hedge against inflation.
DXY, an index that measures the US dollar vs a basket of major rivals, has been trading through 93.50 and is at the highest level since Sep 2020.
- NZD/USD treads water on Wednesday as it fails to capitalize on the previous session’s gains.
- US Dollar Index near one-year high above 94.50 with fresh 0.22% gains.
- Kiwi remains under pressure on mixed economic data, renewed COVID-19 outbreak, China data eyed.
NZD/USD continues to grind lower on Wednesday in the Asian session. The buying pressure in the US dollar keeps NZD/USD edgy. At the time of writing, NZD/USD is trading at 0.6933, down 0.01% for the day,
The US Dollar Index (DXY), which measures the greenback performance against its six major rivals, trades at 94.50 near its highest since September 2020. The greenback attracts the capital flows on its safe-haven appeal amid risk on sentiment and hawkish Fed member’s.
Fed Vice Chair Richard Clarida said that gradual taper concluding mid-2022 may soon be warranted as the economy has made substantial progress. In the same tune, both Atlanta Fed President Raphael Bostic and St. Louis Fed President James Bullard endorsed a November start.
On the other hand, Kiwi lost its momentum on reduced risk appetite among investors in the wake of the renewed COVID-19 restrictions and mixed economic data. In the latest development, the outlook for Auckland remains grim with the number of active new coronavirus cases jumping five-fold since a week ago.
On the economic data side, Food Inflation in New Zealand jumped 4% in September on yearly basis from 2.8 in the previous month.
As for now, all eyes are on the Chinese Export data, US Core Inflation data, and FOMC minutes to take fresh trading impetus.
NZD/USD additional levels
- The market sentiment is a mixed bag on the back of inflationary pressures.
- Higher Iron ore prices failed to boost the Australian dollar.
- Investors remain sidelined, awaiting crucial US CPI data due on Wednesday.
- AUD/USD: From a technical perspective, the pair is in a downward trend.
The AUD/USD is beginning the Asian session on the wrong foot, is down 0.04%, trading at 0.7347 during the day at the time of writing.
The market sentiment is mixed, as witnessed with US stock indices closed with losses between 0.24% and 0.35%. Meanwhile, Asian equity future indices seesaw between gains and losses. Factors like the energy crunch and inflationary pressures keep investors uncomfortable to open new positions on the AUD/USD pair.
Iron ore prices are up 11.21%, trading at $129.00 per metric tonne, but the Australian dollar has not followed its footprints.
On the macroeconomic front, the Australian docket will feature the Westpac Consumer Confidence for October, expected at 2.4%, more than the September reading at 2%.
Data-wise, the September CPI data is due on Wednesday in the US, and the market is expecting 5.3% YoY and 4.0% YoY, respectively, on headline and core.
AUD/USD Price Forecast: Technical outlook
Daily chart
The AUD/USD pair trades between the 50 and the 100-day moving averages (DMA’s) that lie at 0.7302 and 0.7416, respectively. The 200-DMA is located above the current spot price, meaning that the pair is in a downtrend.
To resume the downward trend for AUD/USD sellers, they will need a daily close below the October 12 low at 0.7330. in that outcome, sellers could push the price towards the confluence of the 50-DMA and the figure at 0.7300. This level is crucial, as a break underneath could open the door for the September 30 low at 0.7169.
Momentum indicator like the Relative Strength Index (RSI) is at 57, edging lower, indicating that downward pressure is waning, suggesting that the pair might consolidate before resuming the downside bias.
- Gold is in the balance of the market's forecasts for stagflation.
- Gold is at the mercy of the Fed, inflation risks and US jobs and other critical data this week.
The price of gold is higher by some 0.38% around the close of Wall Street as US equities plummet. The Dow fell more than 100 points as stocks end lower ahead of bank earnings, inflation data. The S&P 500 was 0.25% lower and the Nasdaq ended down 0.14%.
Meanwhile, the carry trade and commodity currencies are taking up the top leader boards, where rate hikes are now being priced in. The US dollar DXY, an index that measures the US dollar vs a basket of major rivals, is trading through 93.50 and is at the highest level since Sep 2020 as the market prices in the Federal reserve's tapering and rate hike expectations in 2021 and 2022 respectively.
Inflation and stagflation risks weighed
Risk markets have stabilised as inflation uncertainty continued to creep higher despite a dismal Nonfarm payrolls headline last week. However, investors will now look to the next key US data releases in September Consumer Price Index and Retail Sales which will be important in the current stagflation debate for which gold is akin.
''Looking beyond Fed pricing, higher wages and no rise in the participation rate, along with the ongoing energy crisis, will keep the stagflation theme alive,'' analysts at TD Securities explained. ''As such, gold could be an ideal hedge against these rising stagflationary winds, while a positioning slate that is skewed short also suggests that a further rout on the yellow metal is unlikely.''
Indeed, recent Fedspeak and inflation expectations data have indicated that confidence in the transitory inflation story is continuing to fade. This makes for September's CPI data that are due Wednesday important. The market is expecting 5.3% YoY and 4.0% YoY respectively on headline and core.
Meanwhile, as the global energy crisis intensifies, impacting the production of goods across the world and supply chains across Europe and Asia, reasons to own the yellow metal are growing more compelling, analysts at TD Securities argued.
''Indeed, as these issues fuel concerns of slowing demand and rising inflation, price action across rates in recent trading sessions suggest that global macro is just starting to price in implications of the energy crisis,'' the analysts pointed pout. ''After all,'' they say, ''the Post-Fed move higher in rates was led by real rates, whereas it is now being led by breakevens, suggesting the market is pricing in higher inflation due to the spike in energy, but acknowledging that this is a supply-shock which impacts growth negatively.''
''In turn, with positioning in the yellow metal increasingly short, including CTAs, potential strength in gold due to this growing stagflationary narrative could spark aggressive short covering on the horizon.''
Gold positioning
From a positioning standpoint, speculators have opted to add back some along following the breakout in Treasury yields that have been weighing on momentum, eventually sending the yellow metal to the lows. Still, short covering did not last long as investors look to the Fed for the November taper. Looking forward, however, there is plenty of dry powder on the sidelines which could help drive gold higher as investors look for traditional hedges vs stagflationary themes.
Gold technical analysis
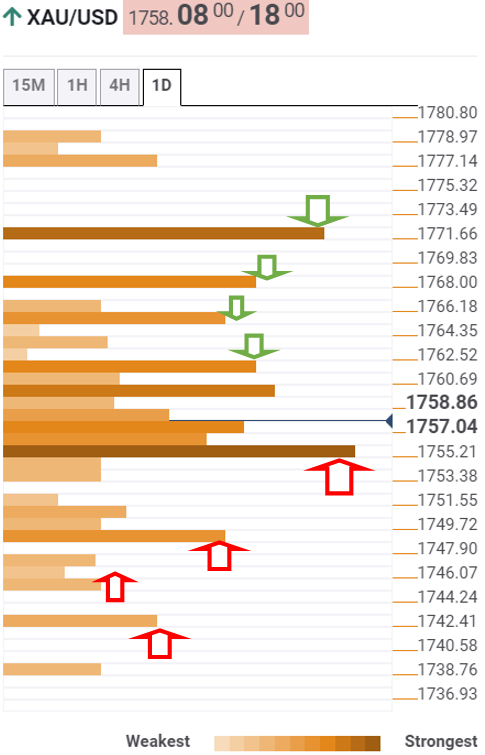
In the Chart of the Week: XAU/USD bulls step in, the 4-hour support was noted as follows:
Gold 4-hour chart, prior analysis
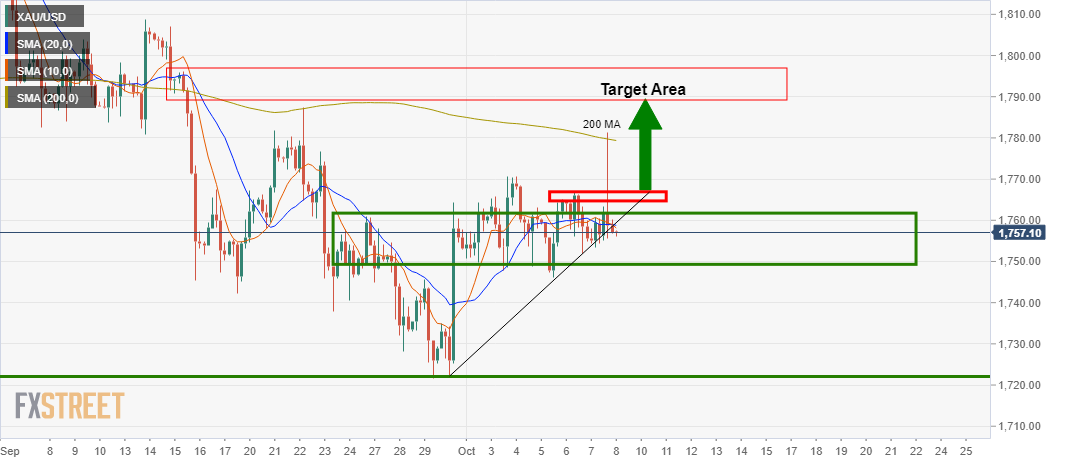
It was stated at the start of the week's analysis that, ''from a 4-hour perspective, gold bulls would be prudent to see the price make a move in the direction of the target to break the near term resistance around $1,770. In engaging above this area, there is a higher probability of a bullish continuation for gold this week.'
However, the bears have been testing the grit of the bulls and the price has moved sideways along horizontal support and pushing dynamic support further out along the trend as follows:
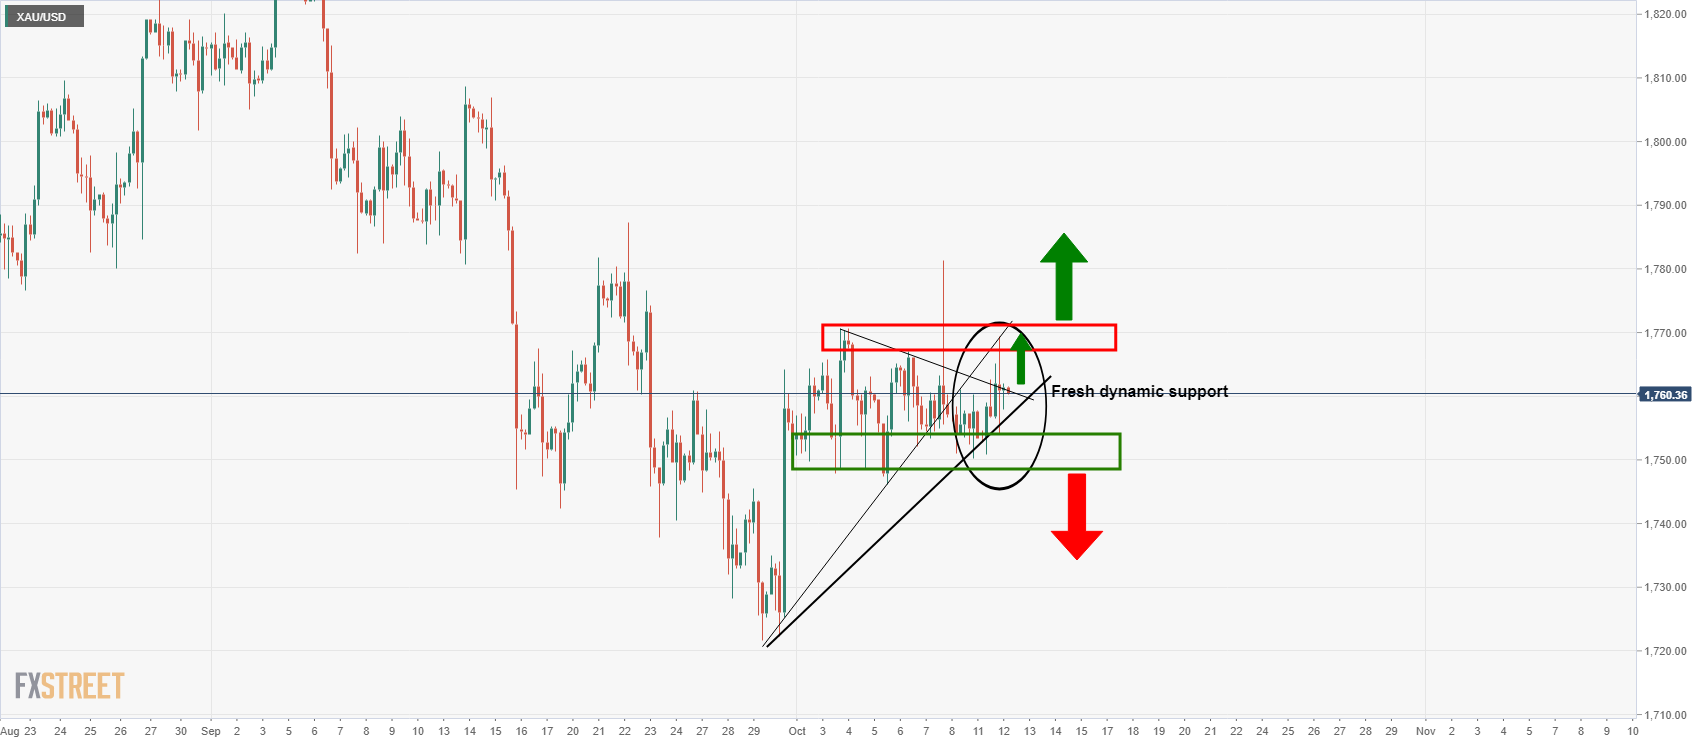
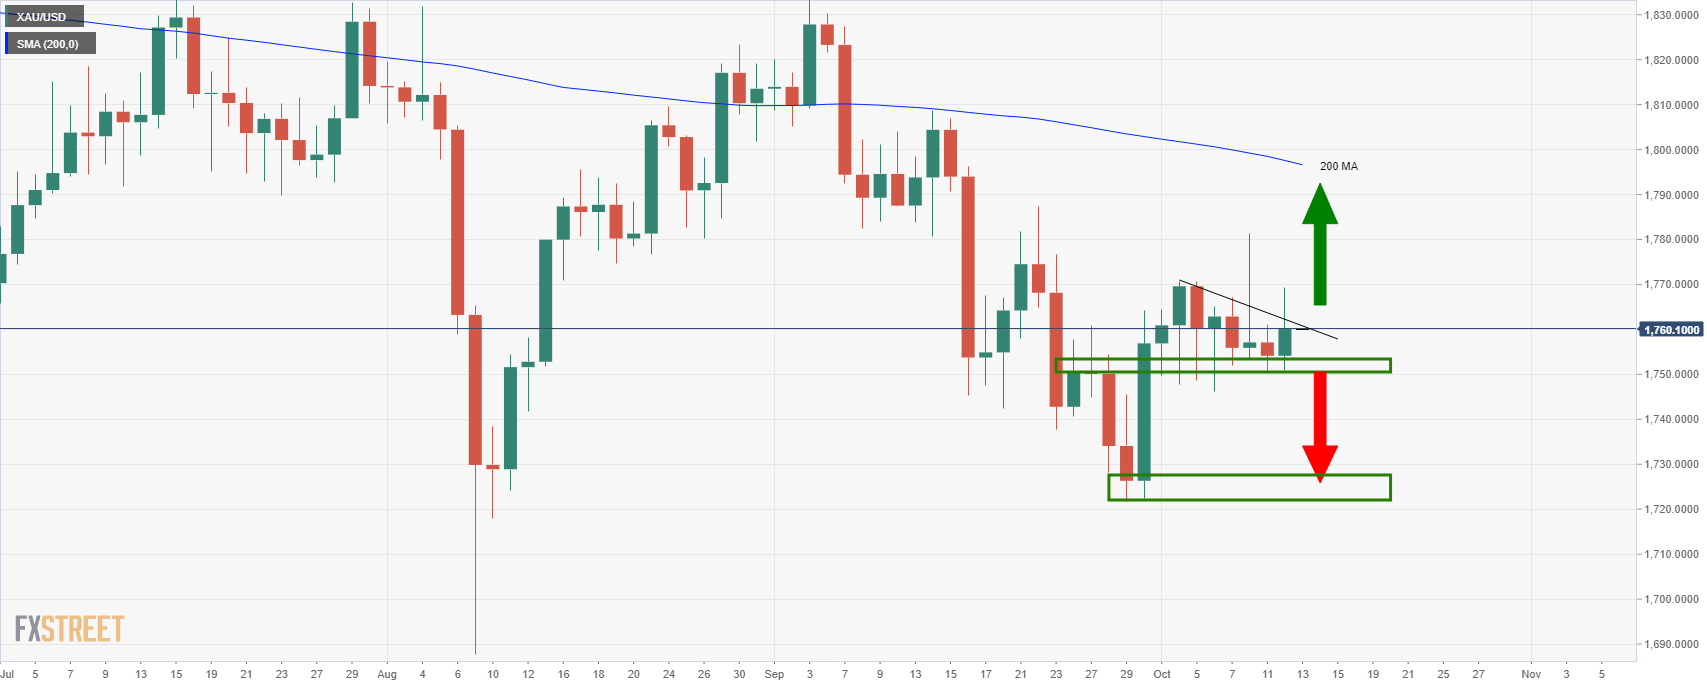
Should the price break the dynamic resistance that has formed and test into the 1,770 resistance area, then there are prospects of the bullish breakout. On the other hand, a break below the 1,750 would likely lead to a downside continuation from a daily perspective towards 1,720 and void the daily upside target towards the 200 MA near 1,800:
In a CNBC interview, Federal Reserve's James Bullard has stated that he supports starting a taper in November.
Key comments
Says he wants to finish the taper in Q1 of 2022 to be in place to react to higher inflation.
Says the pandemic will come under better and better control with pills, booster shots, shots for kids.
Says still in great shape economy-wise despite the delta setback in Q3.
Says by next spring could see the unemployment rate back to pre-pandemic level.
Says 'reasonable' to think inflation could come down on its own, but there's some risk it could go higher.
Says want to be in a position to raise rates if needed in spring or summer of 2022.
Says the probability of recession is exceptionally low at this point.
Meanwhile, the carry trade currencies, where rate hikes are being priced in, are higher. The US dollar is taking up the top spot behind CAD and AUD on Tuesday.
DXY, the index that measures the US dollar vs a basket of major rivals, is trading through 93.50 and is at the highest level since Sep 2020.
- USD/CAD break below 1.2500 amid higher energy prices.
- The market sentiment is downbeat, weighs on the USD/CAD pair.
- USD/CAD: The pair has another leg-down before momentum indicators reach oversold levels from a technical perspective.
The USD/CAD pair slides during the New York session is trading at 1.2462, down 0.18% at the time of writing.
The market sentiment is downbeat, portrayed by US stock indices posting losses between 0.25% and 0.34%. Factors like the energy crunch in Europe and Asia, the Chinese Evergrande’s real-estate spillover in the sector, inflationary pressures, and rising energy prices have kept investors at bay.
That said, rising oil prices are boosting the Canadian dollar. Western Texas Intermediate (WTI) crude oil is barely unchanged at $79.90, below the $80.00 threshold for the first time in two days.
Meanwhile, the US Dollar Index that measures the greenback’s performance against a basket of six peers is advancing 0.12%, currently at 94.48, whereas the US T-bond 10-year benchmark note rate is declining three basis points (bps), down to 1.566%, for the first time since the last week.
USD/CAD Price Forecast: Technical outlook
Daily chart
The USD/CAD is trading below the daily moving averages (DMA’s), suggesting the pair is in a downtrend. Momentum indicators, like the Relative Strength Index (RSI) at 36, edging lower, means another leg down could be on the cards.
To accelerate the downward trend, USD/CAD sellers need a daily close below 1.2445. In that outcome, the first support level would be 1.2421. A breach beneath the latter can push the pair towards the July 16 low at 1.2302.
On the flip side, a daily close above the 200-DMA at 1.2510 could pave the way for further gains. The first resistance would be 1.2600, immediately followed by the 50-DMA at 1.2622.
KEY ADDITIONAL LEVELS TO WATCH
- EUR/JPY bearish confluences point to an imminent downside correction.
- EUR/JPY bears are looking for an optimal entry point.
EUR/JPY has rallied as the Yen takes up the last position according to the CSI indicators. The market is getting behind the inflation theme which is seeing flows driven towards the commodity complex and higher-yielding currencies. This leaves the euro vulnerable and the yen is potentially due for a positive correction making EUR/JPY's recent rally a potential shorting opportunity. The following illustrates the bearish confluence on both the weekly and daily time frames with prospects of a 1-hour trade set-up.
Weekly chart
From a weekly perspective, the price is firmly bid and it can easily move higher. However, when examining the price action on the lower time frames, it makes the W-formation on both the weekly and daily charts compelling.
The W and M harmonic patterns are reversion patterns by nature and have a high completion rate. Therefore, the price would be expected to retrace some of the recent bids in due course. Examining the daily chart, that reversion could be imminent.
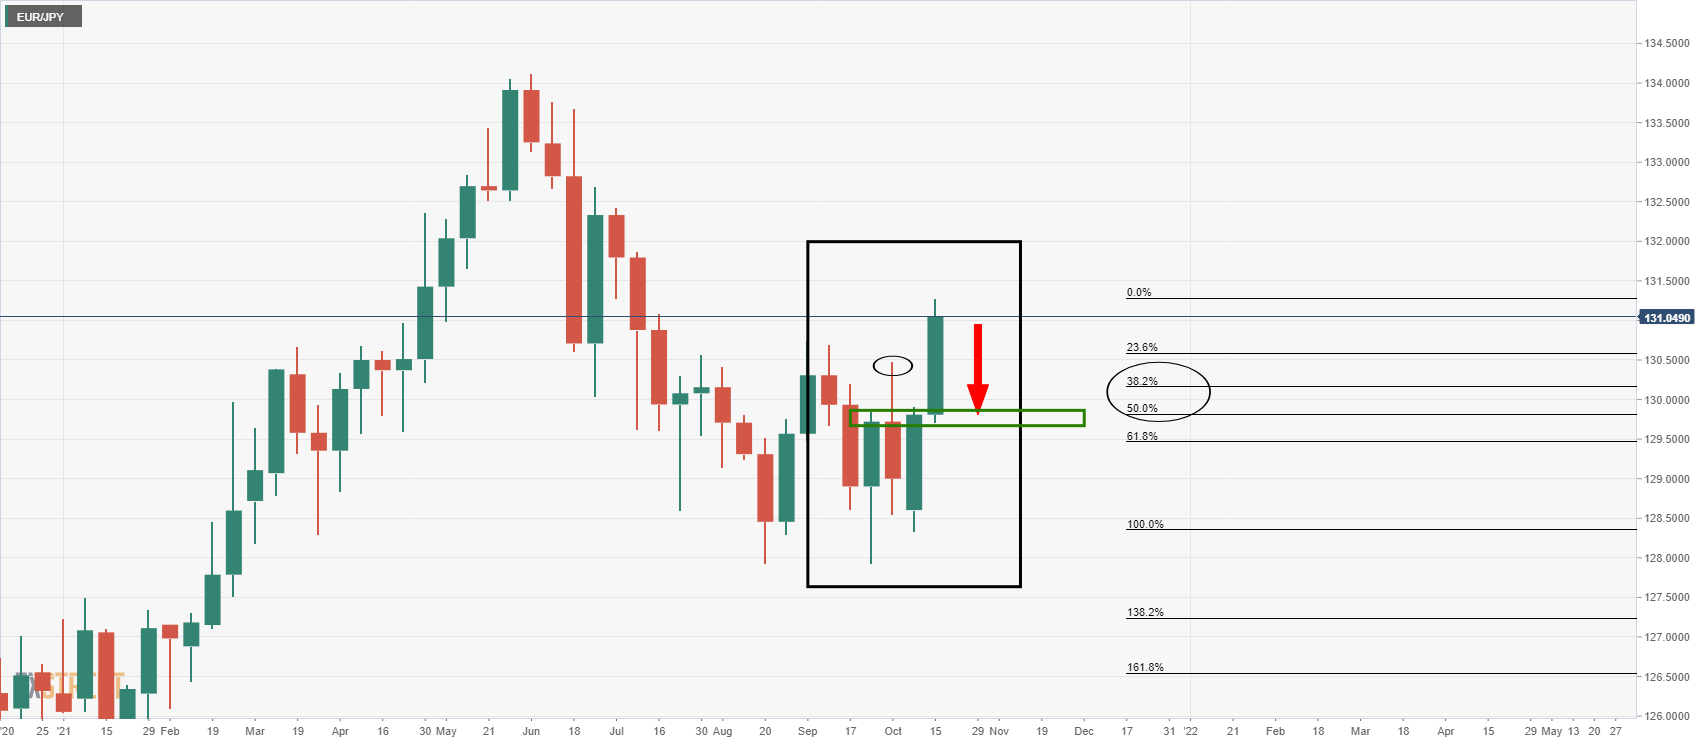
Daily chart
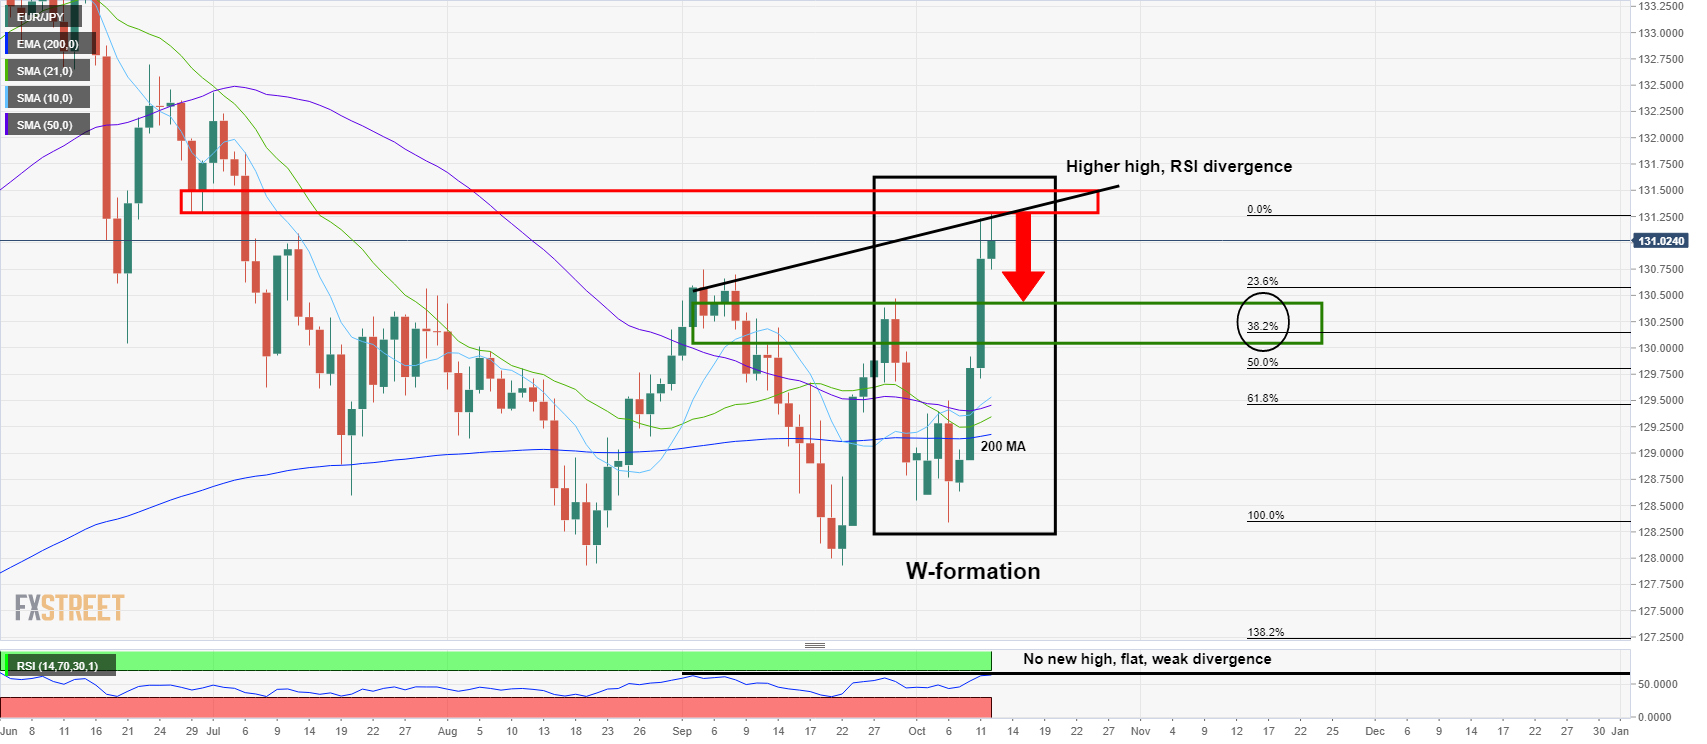
As illustrated, the daily chart is meeting resistance and the price is well above the 200-day moving average and a cluster of the 10, 21, and 50 MAs. Additionally, by measuring the peaks of Aug to current highs and comparing them to no fresh highs in RSI over the same time period, this is a bearish divergence.
However, it is a relatively weak divergence considering RSI is flat between the peaks. We would want to see a lower current high to that of Aug's peak for stronger divergence. Nonetheless, the confluence of factors points to a downside correction. A target to the prior daily highs near the 38.2% Fibonacci retracement level is a compelling zone between and near 130.50 and 130.20.
EUR/JPY, 1-hour chart
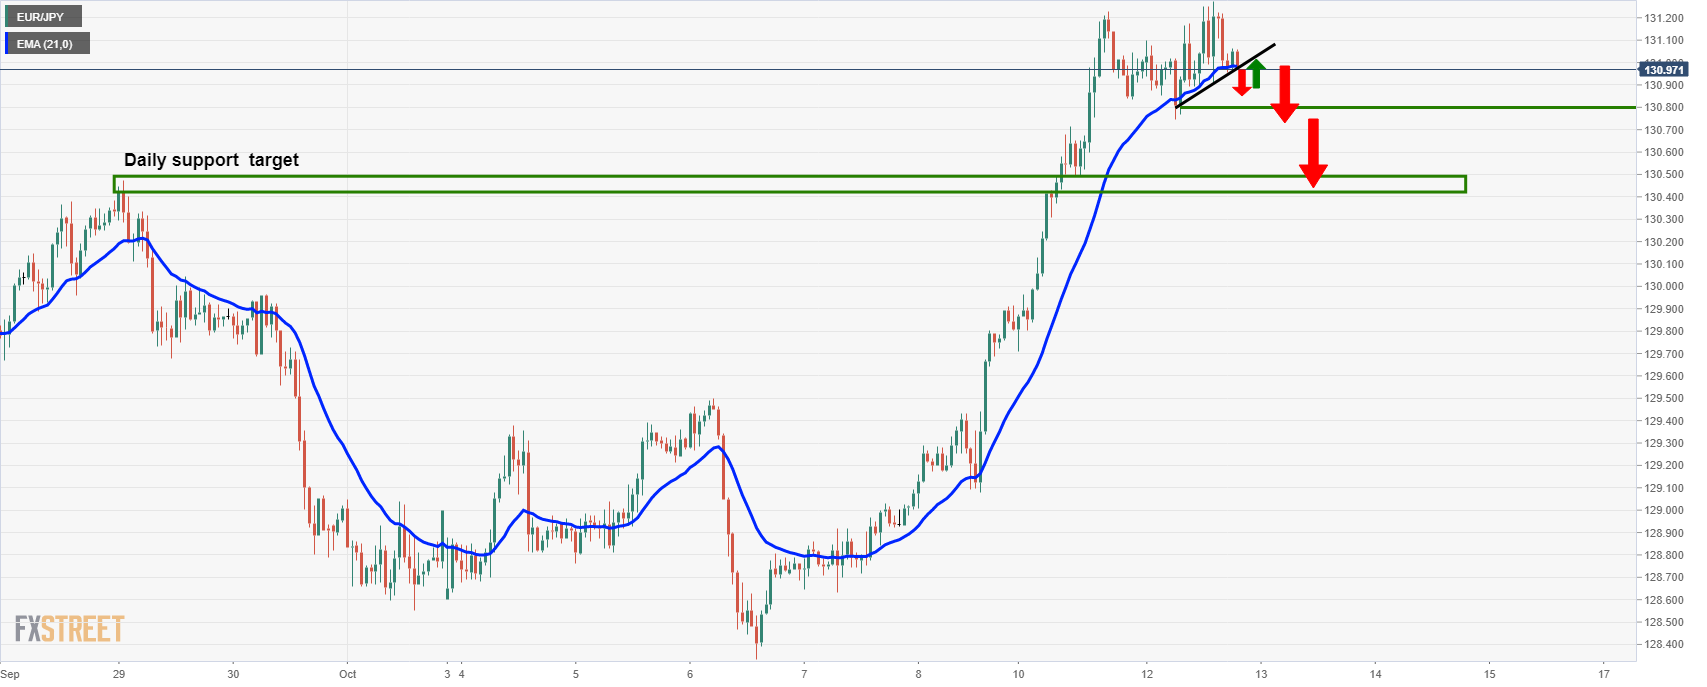
The 1-hour time frame is a suitable chart to monitor for an optimal entry point for a swing towards the daily target near the 130.20/50 zone. Bears would be prudent to wait for a break of dynamic trendline support and then to expect a restest of the structure as a counter-trendline. Then, the horizontal support near 130.80, if broken, would be expected to act as resistance on any restest. This would likely lead to a deterioration of bids equating to a significant downside correction as per the daily chart's forecast above.
What you need to know on Wednesday, October 13:
Market participants kept struggling for a catalyst as the macroeconomic calendar remained scarce. Overall, risk-aversion dominates the scene amid Chinese headwinds related to financial stability and the ongoing energy crisis.
Furthermore, the International Monetary Fund lowered its global growth forecast amid "seeing major supply disruptions around the world that are also feeding inflationary pressures, which are quite high and financial risk taking also is increasing, which poses an additional risk to the outlook."
The American dollar gathered momentum during US trading hours, helped by comments from US Federal Reserve officials aligned with soon-to-come tapering. Vice-Chair Richard Clarida said, "I myself believe that the 'substantial further progress' standard has more than been met with regard to our price-stability mandate and has all but been met with regard to our employment mandate," adding that gradual tapering of assets purchases could conclude mid-2022.
Federal Reserve Raphael Bostic noted that inflation is well above Fed's 2% goal, noting that persistent supply chain issues will probably last longer than initially anticipated. Hence, policymakers need to watch carefully to ensure that pandemic-induced pressures do not cause long-term inflation expectations to become unanchored.
Across the pond, dismal German data undermined demand for the shared currency. The EUR/USD pair fell to a fresh 2021 low of 1.1524, holding nearby as the day ended.
The GBP/USD pair hovers around 1.3590, undermined by the dollar's demand, and despite speculation the Bank of England could raise interest rates before year-end to counter inflationary pressures.
The AUD/USD pair held on to gains near 0.7350, although the sour tone of equities prevented it from advancing further. USD/CAD fell to 1.2433, a fresh 2-month low as crude oil prices held at multi-year highs. WTI settled at $80.60 a barrel.
Gold attempted to rally but changed course in the US afternoon, ending the day with modest gains around $1,760 a troy ounce.
Solana bound for further losses as SOL eyes $125
Like this article? Help us with some feedback by answering this survey:
- The euro returns to 0.8480 area after failure at 0.8520.
- BoE rate hike expectations are supporting the pound.
- EUR/GBP is trading above a key support area at 0.8471/49 – Commerzbank.
The euro has found support at 0.8480 area following a reversal from 0.8520 earlier today. Broadly speaking, the pair is licking its wounds, clinging right below 0.8500 after having lost nearly 2% over the previous two weeks.
BoE tightening expectations are supporting the GBP
The British pound has remained fairly firm in October, supported by expectations that the Bank of England will lead the rest of the major central banks in raising interest rates after the COVID-19 crisis. Some market sources are anticipating an interest rate hike early next year, with other hikes to follow, in an attempt to tackle inflationary pressures.
Furthermore, the euro remains on the defensive on rising concerns about inflationary pressures and supply bottlenecks thwarting the post-pandemic recovery. The macroeconomic docket has supported those fears on Tuesday, with the German ZEW economic sentiment index deteriorating for the fifth consecutive month.
EUR/GBP: Above important support at 0.8449 – Commerzbank
According to Karen Jones, Team Head FICC Technical Analysis Research at Commerzbank, breach of 0.8471/49 support would renew bearish pressure: “EUR/GBP is under pressure near term following last week’s failure just ahead of .8671, the July 2021 high. The market has reacted back to key support at .8505/00, the lows from mid-July, and these are exposed and failure here will target key support is .8471/49, the recent low and lows since 2019. We again look for these to hold the downside.”
Technical levels to watch
- High energy prices, supply shortages amid other factors dampened the market sentiment, thus weighing on the NZD.
- Fed’s Clarida commented that he would like the QE’s reduction to conclude by the first half of 2022.
- Among other policymakers, Atlanta’s Fed President Bostic is ready to begin the bond tapering in November.
The NZD/USD pair falls during the New York session, trading at 0.6933, down 0.12% at the time of writing.
High energy prices, supply shortages, and the ongoing energy crisis, among other factors, weigh on the market sentiment, as witnessed by US stocks falling between 0.02% and 0.09%. Also, some Federal Reserve Members crossed the wires, reinforcing the possibility of the start of the bond tapering process by the Federal Open Market Committee on November’s meeting
In the meantime, the US Dollar Index that measures the US dollar performance against a basket of six peers is aiming higher, almost 0.20%, sits at 94.50.
In the absence of any New Zealand fundamental catalyst, the US economic docket featured the JOLTS Job Openings for September, which decreased to 10.439M lower than the 10.925M foreseen by economists.
Fed’s Clarida would like to conclude the QE’s reduction by the first half of 2022
Fed speakers have crossed the wires during the New York session. The Federal Reserve Vice-Chairman Richard Clarida said that the bar for taper has all but met concerning the labor market. Moreover added, “if recovery remains on track, gradual tapering of asset purchases concluding middle of next year may soon be warranted.”
Meanwhile, Raphael Bostic, President of the Federal Reserve in Atlanta, said that the slowdown in the US labor market should not derail the Fed’s taper timeline. He said, “[he] would be comfortable starting tapering of asset purchase program in November.”
On the macroeconomic front, on Wednesday, the New Zealand economic docket will feature the REINZ House Price Index (MoM) and the Food Price Index (MoM), both for September.
On the US front, the Consumer Price Index and the last Federal Open Market Committee minutes could offer a fresh catalyst for NZD/USD traders.
NZD/USD Price Forecast: Technical outlook
Daily chart
The NZD/USD spot price is well below the daily moving averages (DMA’s), supporting the downward trend. In the last four days, the pair has unsuccessfully tested the 0.6960 level, retreating on heavy selling pressure, each of the moves below 0.6940. A daily break below 0.6900 could push the pair towards the confluence of a rising slope trendline and the October 6 low at 0.6875. A breach of that level could expose the 2021 lows at 0.6805.
The Relative Strength Index (RSI) is at 44, flattish, suggesting that the pair might consolidate before resuming another leg down, towards 0.6805.
- The US dollar extends gains to 10-day highs above 0.9300.
- The Swiss franc loses ground against a stronger dollar.
- USD/CHF: Above 0.9300, the next target is a 6-months high at 0.9380.
The US dollar is pushing higher on the afternoon US trading session, exploring levels above 0.9300 for the first time over the last ten days. The pair has pierced the top of the recent trading range, inching up towards multi-month highs at 0.9380.
The dollar firms up across the board
The greenback has bounced up after a soft opening on Tuesday, as investors' concerns about inflationary pressures curtailing economic recovery have dented the US dollar’s strength.
The greenback, however, has managed to bounce up, boosted by a rebound on US Treasury yields, with the 10-year note reaching 1.60% for the first time since June. Market expectations of QE tapering by the Federal Reserve are underpinning the US dollar’s rally.
In absence of relevant macroeconomic figures, the focus is on September’s US Consumer Prices Index data and the minutes of the last FOMC meeting, which could offer a fresh impulse to the USD.
USD/CHF: Above 0.9300, next resistance is 0.9380
On the upside, if the pair manages to confirm above 0.9300 (Oct. 6, 8 highs) the pair might attempt another attack to multi-month high 0.9380 (Sept. 30 high, 78,6% Fib. Retracement of the March-June decline) and 0.9435 (Apr. 5 high).
On the downside, immediate support lies at 0.9270 (61,8% Fib. Retracement of the March-June decline) then 0.9250 (Oct 7, 11 low, trendline support) and below here, 0.9220 (Sept. 23 lows).
Technical levels to watch
- GBP/JPY rallied on Tuesday to the highest levels since 21 June.
- UK jobs data keeps expectations for future rate rises from the Bank of England intact.
GBP/JPY soared as investors get on the carry trades and behind the pound following UK jobs data that met expectations and left sentiment in place for future rate rises from the Bank of England intact. The currencies that are expected to offer higher yields or track commodities due to inflation risks are performing the best. The risks of inflation have also kicked in on a week where plenty of Fed speakers are likely to advocate for action sooner than later.
BoE rate hike expectations lift GBP
Firstly, UK data that the Unemployment Rate edged down to 4.5% in the three months to August, in line with economists' forecasts in a Reuters poll. Additionally, British employers expanded their payrolls to a record high in September. This leaves scopes for the Bank of England to raise interest rates as risks of stagflation are limited so long as the jobs market is improving. Money market pricing shows around an 8 basis point rate hike from the BoE priced in as early as the Bank's November meeting.
At the start of the week, GBP/USD printed a two-week high on hawkish weekend comments from BoE governor Andrew Bailey and fellow policymaker Michael Saunders, who both advocated for rate hikes. Saunders, in particular, said households must brace for "significantly earlier" interest rate rises. Bailey stressed the need to prevent inflation. This leaves GBP vulnerable to the upside as investors back the carry trades, seeking yield from nations of whole economic are emerging from the COVID-19 lockdowns and being the first to hike rates since the start of the global COVID-19 pandemic.
GBP downside risks, (Brexit)
On the other hand, there are risks relating to Brexit woes and the UK's energy crisis. As analysts at Brown Brothers Harriman explained, ''a hike before year-end is now fully priced in, as are three more hikes to follow in 2022.''
''Despite the heightened BOE tightening expectations, we believe the fundamental backdrop for sterling remains negative,'' the analysts argued. ''For cable, a break below $1.3510 is needed to set up a test of the September 29 cycle low near $1.3410.''
The UK's Brexit Minister Frost made a speech today with a plea to the European Union to allow for "significant change" to post-Brexit rules governing trade with Northern Ireland.
A day before the EU is expected to present its proposals to solve a standoff over part of the Brexit divorce deal, Frost again warned Brussels London could unilaterally waive some of the terms of its agreement if the bloc failed to budge.
"With some effort of will, we could still, despite all the problems, be in a position where the poison is drawn from this issue entirely and it is removed from the diplomatic top table once and for all."
The European Commission has said it will not comment immediately on Frost's speech before it outlines its proposals. However, the EU has repeatedly said it will not renegotiate the protocol. Analysts at Brown Brothers Harriman are of the mind that this is going in circles. ''For the hundredth time, we must point out that there is simply no way for the UK to square the circle,'' the analysts said in a note today.
''That is, after the UK left the EU, there is no way to avoid a hard border somewhere between Ireland and Britain. A hard border in the Irish Sea would not be acceptable to loyalists in Northern Ireland, while one between Northern Ireland and the rest of Ireland would bring back bad memories of the Troubles.''
"For the EU now to say that the protocol drawn up in extreme haste in a time of great uncertainty can never be improved upon would be a historic misjudgement," Frost said. "So I repeat, to conclude- let us both be ambitious and agree a better way forward."
Meanwhile, on Monday, Irish Foreign Minister Simon Coveney said Britain knew full well Brussels could not move on the ECJ. "At some point the EU will say enough, we cannot compromise more and I think we're very close to that point now," he said
The risks are an outright trade war that would be expected to harm both sides. The EU has said it would try to find a cooperative solution but has also threatened sanctions if the U.K. were to take unilateral action.
''A costly trade war is probably the last thing Europe needs right now,'' analysts at Brown Brothers Harriman said. ''However, such a development would most likely hurt the smaller country the most. To put it bluntly, the UK needs the EU more than the EU needs the UK. And let’s not forget that the UK is still pushing the EU for so-called equivalence for British financial firms.''
Reuters reported on Atlanta Fed Bank President Raphael Bostic comments from a little earlier today.
Bostic was noted saying that US inflation is elevated but it is not at the point where it would affect the Federal Reserve's stance on interest rates.
He added that he still expects it will be more than a year before the central bank raises rates from near-zero levels.
"I'm not seeing signs that this elevated inflation is doing the kind of harm to the economy which would really call into question our policy stance in terms of interest rates," Bostic said during a virtual event with the Peterson Institute of International Economics.
Meanwhile, the carry trade currencies, where rate hikes are being priced in, are soaring with the US dollar taking up the top spot on Tuesday.
DXY, an index that measures the US dollar vs a basket of major rivals, is trading through 93.50 and is at the highest level since Sep 2020.
- Silver prices whipsaw between $22.35 and $22.75 before returning to previous ranges.
- Precious metals' upside attempts remain limited by US dollar strength
- XAG/USD treading water around $23.50.
Silver futures have whipsawed between $22.35 and $22.75 on Tuesday, to consolidate near $22.60 during the US trading session. On the daily chart, the precious metal remains practically unchanged with upside attempts weighed by US dollar strength
Silver prices pull back as the US dollar bounces up
Silver and other precious metals appreciated earlier on Tuesday, fueled by a moderate risk aversion on rising concerns about the economic consequences of surging inflation. Beyond that, the negative opening of US Treasury bonds weighed on the US dollar, driving silver prices somewhat higher.
The precious metal’s rally, however, has been short-lived. The US dollar has bounced up, with US T-Bond yields regaining lost ground, with the market anticipating the market pricing the upcoming announcement of QE tapering by the Federal Reserve. The US Dollar Index has bounced up above $94.25 earlier today to extend towards year-to-date highs beyond 94.50.
XAG/USD: treading water between $22.20 and $23.15
From a technical perspective, the pair remains moving within a horizontal range. On the upside, September 22, October 8 highs, at $23.15 remain the main obstacle to extend gains towards 14, 16 September highs, at $24.00, and of September 3 high at $24.87.
On the downside, immediate support lies at $22.15 (October 6 low) and below here, $21.37 (September 29 low) and 20.75 (50% Fibonacci retracement of the March-August 2020 rally.
Technical levels to watch
- EUR/USD slides for the second day in a row, on the back of Us dollar strength.
- The US dollar index is trading at one and ½ year highs above 94.50, weigh on the EUR/USD pair.
- The market sentiment is downbeat, attributed to inflationary pressures and slower growth.
- Fed’s Bostic and Clarida support the start of the bond tapering by November.
The EUR/USD is sliding during the New York session, downward pressured 0.23%, trading at 1.1526 at the time of writing. The single currency is trading near the 2021 year lows.
The market sentiment stills in a risk-off environment, portrayed by US stock indices falling between 0.15% and 0.34%. However, safe-haven currencies like the Japanese yen and the Swiss franc are losing against most G8 currencies, probably on the back of the carry trade. In the meantime, the US Dollar Index, which tracks the greenback’s performance against a basket of six rivals, advances 0.18%, is at 94.54, reaching a new one and ½ yearly high.
Factors like Inflationary pressures mainly spurred by high energy prices, supply shortages, and a drop in consumer confidence keep investors at bay.
Germany ZEW of Economic Sentiment was worse than expected
On the macroeconomic front, Germany featured the ZEW Survey Economic Sentiment and Current Situation for October. The German Economic Sentiment rose to 22.3 lower than the 24 foreseen, whereas the Current Situation reading rose to 21.6, worse than the 29.5 expected, and trailed the September 31.9.
Across the pond, the JOLTS Job Openings for August dropped to 10.439M, less than the 10.925M estimated.
Fed’s Bostic and Clarida support the start of the bond tapering by the November meeting
Fed speakers have crossed the wires during the session. Raphael Bostic, President of the Federal Reserve in Atlanta, said that the slowdown in the US labor market should not derail the Fed’s taper timeline. He added, “would be comfortable starting tapering of asset purchase program in November.”
Meanwhile, the Federal Reserve Vice-Chairman Richard Clarida said that the bar for taper has all but met concerning the labor market. Further added, “if recovery remains on track, gradual tapering of asset purchases concluding middle of next year may soon be warranted.”
KEY ADDITIONAL LEVELS TO WATCH
- The Australian dollar retreats from 0.7385 high: returns to 0.7360 area.
- The aussie remains firm, boosted by higher commodity prices.
- AUD/USD's rally might be capped at 0.7365 – Credit Suisse.
The Australian dollar has pulled back on Tuesday’s US session, returning to 0.7360 area after having reached fresh one-month highs at 0.7385. The pair, however, is showing strength despite the rising concerns about surging inflation pressures and has rallied about 2.5% in October so far.
Higher commodity prices are boosting AUD’s rally
The Aussie seems unaffected by the US dollar’s strength and has maintained its positive tone this week. The increasing commodity prices, with iron ore, one of Australia’s main exports surging amid higher demand from China, is driving the AUD higher across the board.
Beyond that, the relaxation of COVID-19 restrictions in Sydney, the country’s most populated city, which has gone through a four-month lockdown, has increased optimism about a post-pandemic recovery while the authorities accelerate the pace of vaccination.
AUD/USD resistance at 0.7365 might cap the upside trend – Credit Suisse
The FX analysis team at Credit Suisse, however, warns about a key resistance area at 0.7365, that could halt the current rally: “AUD/USD has broken out resistance at 0.7312/17, which suggests a short-term correction higher to the 2021 downtrend at 0.7365, which we then expect to cap the market. Thereafter, support is seen at 0.7291/87 initially, below which would confirm a turn back lower and retest of 0.7179/70 lows.”
Technical levels to watch
- WTI keeps trading above $80.00 as other energy resources advance.
- The market sentiment is downbeat on the back of higher energy prices, threatening to derail economic growth.
- WTI: The 1-hour chart depicts a possible consolidation before resuming the upward trend from a technical perspective.
Western Texas Intermediate (WTI) is advancing for the fourth consecutive day, is trading at $80.10, climbs 0.14% during the New York session at the time of writing. Market sentiment is a mixed bag, as US stocks seesaw around the green and red, while European stocks are recording losses between 0.07% and 0.44%, except for the Spanish IBEX 35, which increased 0.43%.
The ongoing energy crisis threatens to keep oil prices higher. Shortages of energy in Asia have pushed China to allow coal-fired power plants to pass on the high costs of generation to some end users. Further, India has asked energy producers to import up to 10% of their coal needs, despite being the world’s second-largest coal producer. However, a steep surge in power demand that has exceeded pre-pandemic levels in Asia means that coal India’s supplies are no longer sufficient.
Meanwhile, the US Dollar Index that tracks the greenback’s performance against a basket of six peers and influences commodity prices is up 0.09%, sitting at 94.45 near one and half year highs, putting a lid on WTI price.
WTI Price Forecast: Technical outlook
1-hour chart
WTI is hovering around the 50-simple moving average (SMA) at 80.02. A breach above $81.00 could pave the way for further gains. The first supply zone would be $82.00, a level tested on Monday unsuccessfully, with the move retreating to $79.00. A break above the latter would expose a move towards $84.00.
On the flip side, a break below the 50-SMA could exert downward pressure on WTI, pushing the price towards the 100-SMA at $78.84. In that outcome, the following demand zones would be the $78.00 and then the 200-SMA at $77.70.
The Relative Strenght Index (RSI) is at 49, suggesting that WTI could be headed towards consolidation or a correction lower before resuming the upward trend.
- Gold's upside attempt fails at $1,770.
- Bullion rally loses steam with the USD picking up.
- XAU/USD remains trading without a clear bias.
Gold futures’ appreciated on Tuesday, as inflation concerns hurt risk appetite, and the pair reached session highs at $1,770 before pulling back to $1,760 with the USD bouncing up as the US bond yields pare losses. The XAU/USD remains positive in the daily chart, yet still trapped within the last weeks’ horizontal range between $1,745 and $1,770/80.
Gold bulls lose steam as the USD picks up
Bullion is giving away ground on the afternoon US session, weighed by renewed USD strength. The greenback remains firm, fuelled by the firm advance on US treasury yields. The 10-year US T-Bond note has returned to levels past 1.60% after a weak opening, with the investors pricing that the Federal Reserve will soon announce the end of the Quantitative Easing era.
The US dollar index, which measures the value of the USD against a basket of the most traded currencies, remains firm, after bouncing from session lows at 94.25, to reach levels only a few pips shy of year-to-date highs at 94.50.
In the absence of first-tier macroeconomic releases, the market is focusing on September’s US Consumer Prices Index figures and the minutes of the FOMC, due on Wednesday, which could have a significant impact on the US dollar.
XAU/USD remains moving without a clear direction
From a technical perspective, gold prices remain trapped within a consolidative range, with upside attempts limited below $1,770 (October 5 high) and $1,780 (October 8 high) above here, bulls might gain confidence and push the pair towards $1,807 (September 14 and 15 highs).
On the downside, immediate support lies at $1,750 (October 10, 11, and 12 lows), $1,745 (October 6 low), and below here, a key support area at $1,725 (September 29, 30 low).
Technical levels to watch
- US dollar's reversal from three-year highs at 113.75.
- The treasury yield differential is crushing the Japanese yen.
- USD/JPY's rally is targeting 114.20 – UOB.
US dollar’s pullback from fresh three-year highs at 113.75 hit earlier on Tuesday has found support at 113.45. The pair has bounced up again returning to 113.65 so far.
The yes dives on higher US Treasury yields
The greenback keeps marching higher against the Japanese yen, boosted by surging US Treasury yields on expectations the Federal Reserve will soon announce the end of its bond-buying program. The US Treasury yields have appreciated again on Tuesday, with the benchmark 10-year note reaching five-month highs above 1.60%.
Furthermore, Japanese Prime Minister Kishida’s comments this weekend confirming that there is no plan to revise the country’s tax on capital gains and dividends, which has triggered concerns about capital flows from the stock markets, might have increased negative pressure on the JPY.
All in all, the widening yield gap between the US and Japan, with the BoJ maintaining the 10-year yield near zero through a yield curve control policy, is crushing the JPY. The USD has appreciated about 4% over the last 15 days.
USD/JPY: Next target seen at 114.20 – UOB
From a technical perspective, the FX Analysis team at UOB expects the current upside trend to extend towards 114.20: “The impulsive surge suggests that further USD strength would not be surprising. The next resistance is at 114.20. The USD strength is deemed intact as long as it does not breach 112.40 (‘strong support’ level is markedly higher from yesterday’s level of 111.50).”
Technical levels to watch
"I myself believe that the 'substantial further progress' standard has more than been met with regard to our price-stability mandate and has all but been met with regard to our employment mandate," Fed Vice Chair Richard Clarida said on Tuesday, per Reuters.
Additional takeaways
"If recovery remains on track, gradual tapering of asset purchases concluding middle of next year may soon be warranted."
"Decision on pace of asset purchases won't be intended to carry signal about the timing of the interest-rate hike."
"US GDP growth this year could be the fastest since 1983."
"Labor market progress has been notable."
"Course of the labour market, economy, continues to depend on the virus."
"Inflation running 'well above' moderate overshoot of 2% goal."
"Underlying inflation close to 2% goal; this year's unwelcome surge will be largely transitory."
"Risks to inflation are to the upside."
"If inflation expectations moved up to run persistently high, the Fed would react; that is not the case at present."
Market reaction
The US Dollar Index showed no immediate reaction to these comments and was last seen rising 0.08% on the day at 94.43.
- The British pound seesaws around 1.3600 amid risk-off sentiment.
- Supply shortages and high energy prices dampen the market sentiment.
- The US Dollar Index reaches a one and ½ year high, around 94.50.
The GBP/USD is barely unchanged 0.01% during the New York session, trading at 1.3595 at the time of writing. A negative tone surrounds the market sentiment, with European stock indices losing between 0.13% and 0.56%, except for the IBEX 35, which is in the green, up 0.20%. Meanwhile, US indices seesaw between loses and gains, without clear direction, with the Dow Jones Industrial up 0.15%, while the S&P 500 and the Nasdaq are down 0.02% and 0.20%, respectively.
Supply shortages and the ongoing energy crisis across Europe and Asia are factors that keep investors sidelined. The “buy the dip” narrative has remained shut-in, thus hurting the market sentiment, as traders scramble towards safe-haven assets, like the greenback.
The US Dollar Index reached a one and a half year high at 94.52
Meanwhile, the US Dollar Index that measures the buck’s performance against a basket of six peers is barely up 0.04%, at 94.40, trimming earlier losses, that saw the index dip to 94.22, putting a lid on the GBP/USD pair.
In the UK economic docket, the Claimant Count Change (MoM) for September rose to -51.1K better than the August reading at -58.6K. At the same time, the ILO Unemployment Rate dropped to 4.5%, versus a previous reading of 4.6%, in line with expectations.
Across the pond, the US JOLTS Job Openings fell to 10.439M versus 10.925M expected. The quit rate increased to a record 2.9% as more people left their jobs, underscoring how wage increases, sign-on incentives, and many job vacancies fuel the turnover.
The market reaction was muted, leaving the GBP/USD pair influenced mainly by market sentiment, the Federal Reserve bond taper announcement, and the possibility of the Bank of England hiking interest rates.
KEY ADDITIONAL LEVELS TO WATCH
Atlanta Federal Reserve President Raphael Bostic told the Financial Times on Tuesday that the slowdown in the US labour market should not detail the Fed's taper timeline, as reported by Reuters.
Additional takeaways
"Labour market had made sufficient gains to allow the central bank to reduce, or taper, its $120 billion a month asset purchase programme."
"Would be comfortable starting tapering of asset purchase programme in November."
"Progress has been made to start winding down asset purchases."
"There is significant uncertainty about how long inflationary pressures will last."
Market reaction
The US Dollar Index preserves its bullish momentum following these comments and was last seen trading at a fresh 12-month high of 94.51.
David Frost, the British minister responsible for implementing the Brexit deal, said on Tuesday that "it takes two" to fix the UK's relationship with the EU, as reported by Reuters.
"Despite the Indo-Pacific tilt, hard business of European defence remains vital," Frost added and noted that they will always look for constructive relations with France.
Market reaction
The GBP/USD pair remains on the back foot following these comments and was last seen trading at 1.3578, where it was down 0.12% on a daily basis.
- US JOLTS Job Openings declined modestly in August.
- US Dollar Index stays in the positive territory near 94.50.
The number of job openings on the last business day of August declined to 10.4, the US Bureau of Labor Statistics announced in its latest Job Openings and Labor Turnover Summary (JOLTS) on Tuesday. This reading came in lower than the market expectation of 10.9 million.
"Hires decreased to 6.3 million while total separations were little changed at 6.0 million," the publication further revealed. "Job openings decreased in several industries with the largest decreases in health care and social assistance (-224,000)."
Market reaction
This report doesn't seem to be having a significant impact on the greenback's performance against its rivals. As of writing, the US Dollar Index was up 0.1% on the day at 90.45.
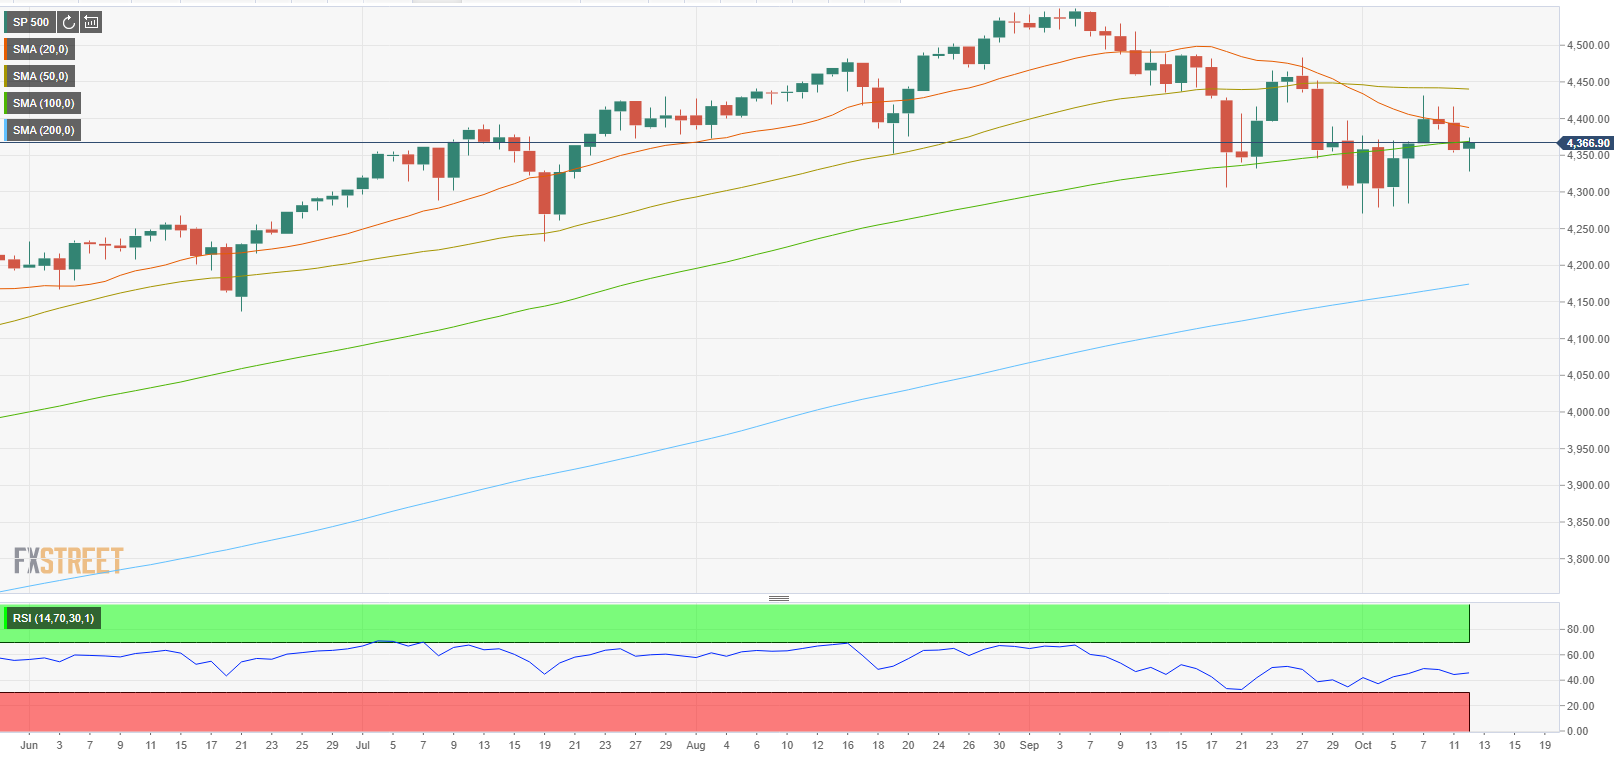
- Wall Street's main indexes push higher following Monday's decline.
- Energy Index trades in the negative territory after the opening bell.
After failing to gather bullish momentum and closing in the negative territory on Monday, major equity indexes in the US managed to open modestly higher on Tuesday. As of writing, the S&P 500 was up 0.2% on the day at 4,368, the Dow Jones Industrial Average was rising 0.1% at 34,515 and the Nasdaq Composite was rising 0.4% at 14,543.
Among the 11 major S&P 500 sectors, the Energy Index is down 0.5% as the biggest decline in early trade. On the other hand, the Consumer Discretionary Index is rising 0.85%.
Earlier in the day, the data from the US showed that the NFIB Business Optimism Index declined to 99.1 in September from 100.1 in August but this reading received little to no market reaction.
Wake Up Wall Street (SPY) (QQQ): Markets cornered by rising yields and surging energy costs.
S&P 500 chart (daily)
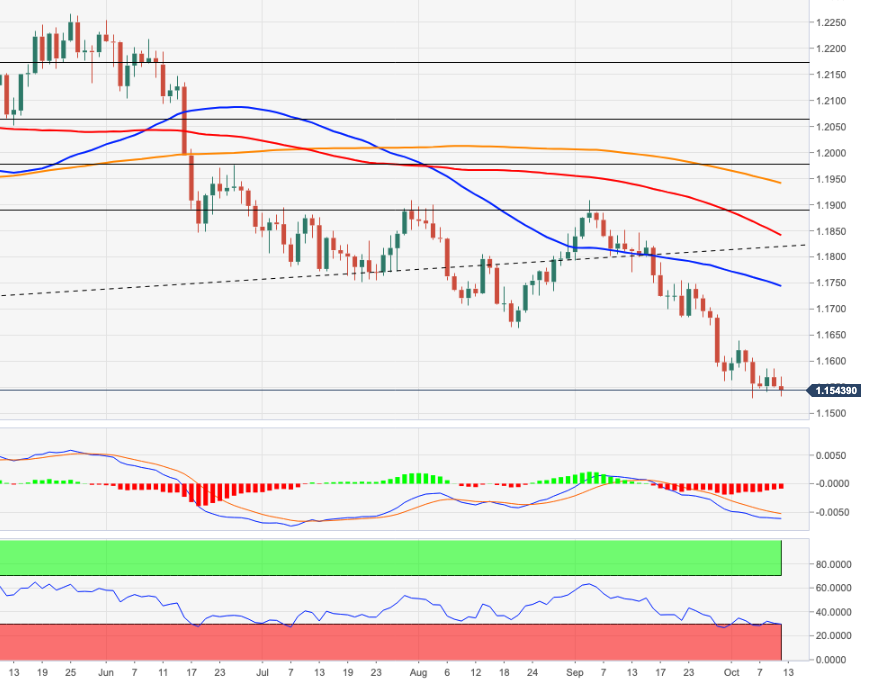
- EUR/USD remains under pressure in the mid-1.1500s.
- The outlook for the pair stays fragile and appears vulnerable.
EUR/USD extends the consolidative trade range for yet another session and always around the 1.1550 zone on Tuesday.
Another visit to the 2021 low at 1.1529 remains well on the table in the near future amidst the ongoing bearish context. A deeper pullback from here should trigger a relatively quick test of the 1.1500 neighbourhood, where the March 2020 high sits.
In the meantime, the near-term outlook for EUR/USD is seen on the negative side below the key 200-day SMA, today at 1.1939.
EUR/USD daily chart
In its World Economic Outlook published on Tuesday, the International Monetary Fund said that it lowered its 2021 global growth forecast to 5.9% from 6% in July due to supply disruptions in advanced economies, per Reuters.
Additional takeaways
"2022 global growth forecast unchanged at 4.9%."
"US 2021 growth forecast cut by 1 percentage point from July forecast; German growth cut by 0.5 points, Japan's growth cut by 0.4 points."
"China's 2021 growth forecast cut to 8.0% from 8.1% in July due to faster scaleback of public investment."
"2021 outlook for some low-income developing countries cut due to worsening COVID-19 dynamics; some commodity exporters upgraded on higher prices."
"Growth risks tilted to the downside, including possible emergence of new coronavirus variants, more persistent supply-demand mismatches, inflation pressures."
"Price pressures could prompt faster monetary policy normalization and tighter financial conditions, hurting emerging markets."
Market reaction
This publication doesn't seem to be having a significant impact on risk sentiment. As of writing, the S&P Futures were up 0.16% on the day.
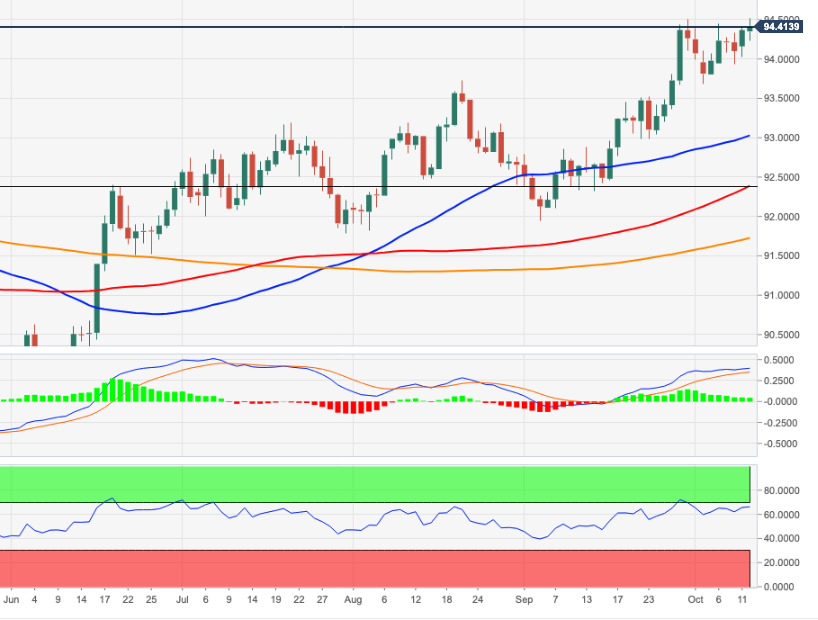
- DXY briefly surpassed 94.50 to clinch new 2021 highs.
- Further up comes the 94.74/76 region.
DXY adds to Monday’s gains and manages to re-visit the 94.50 region on turnaround Tuesday.
The ongoing price action allows the index to extend the leg lower to the area above 94.50 in the short-term horizon. That said, the next target is seen at the September 2020 high at 94.74 followed by the 200-week SMA, today at 94.76. Further north should come the round level at 95.00, also in the not-so-distant future.
Looking at the broader picture, the constructive stance on the index is seen unchanged above the 200-day SMA at 91.72.
DXY daily chart
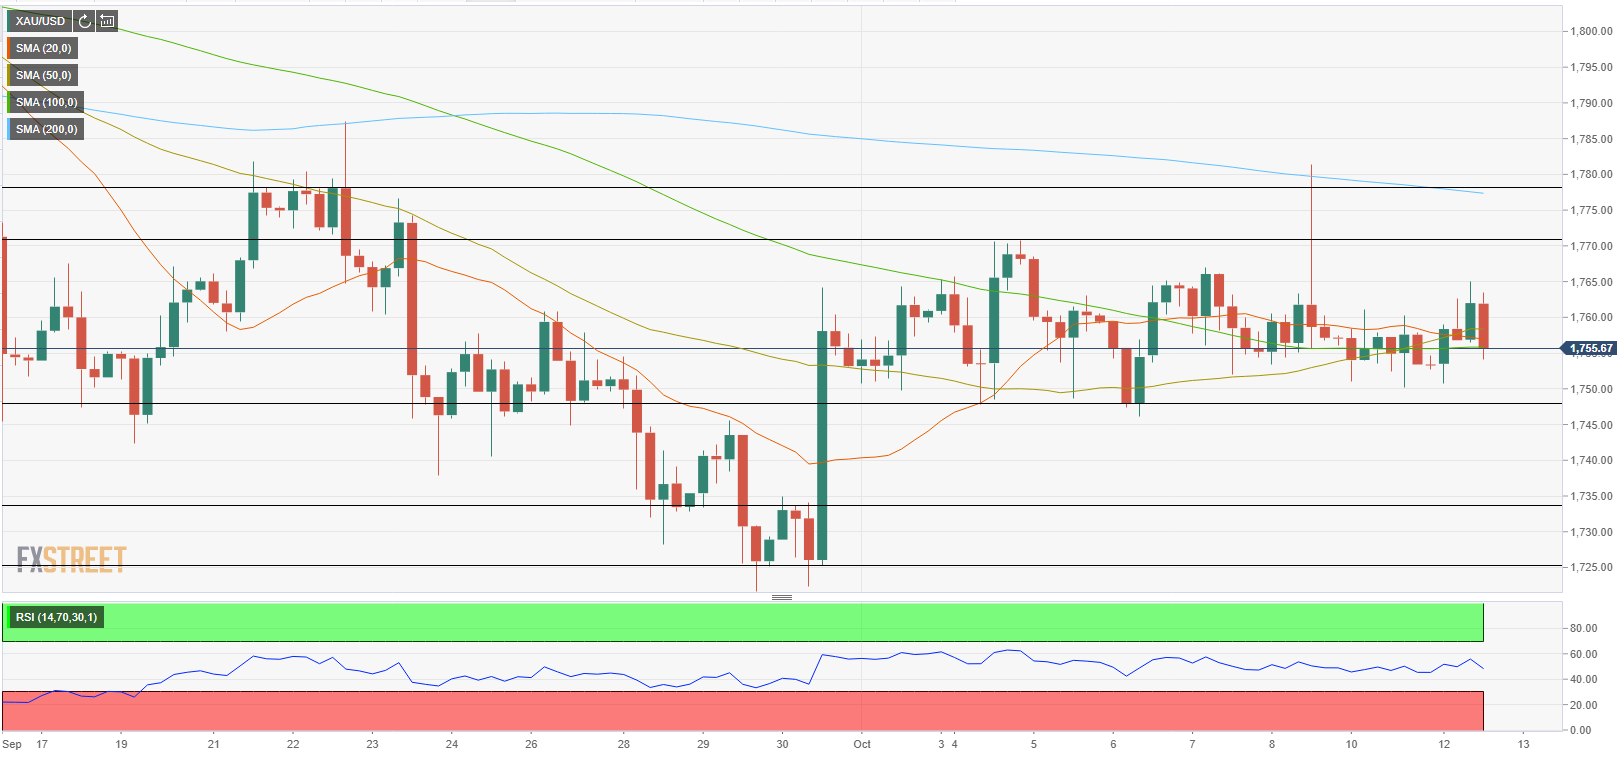
- Gold advanced beyond $1,760 following Monday's choppy action.
- 10-year US Treasury bond yield is down more than 1% on Tuesday.
- XAU/USD needs to break out of $1,750-70 range to determine next direction.
The XAU/USD pair extended its sideways grind above $1,750 during the Asian session on Tuesday but managed to gather bullish momentum in the European trading hours. After rising to a daily high of $1,765, however, gold lost its traction and erased its daily gains. As of writing, the pair was trading virtually unchanged on the day at $1,754.
Following the three-day weekend, the US bond markets returned to action on Tuesday and the 2% decline witnessed in the benchmark 10-year US T-bond yield helped XAU/USD turn north. Although the 10-year yield managed to pull away from daily lows, it's still down 1.5% on a daily basis while holding above the key 1.6% mark.
Meanwhile, the US Dollar Index is trading at its highest level in more than a year at 94.51, not allowing XAU/USD to stage a convincing recovery.
The only data from the US showed on Tuesday that the NFIB Business Optimism Index edged lower to 99.1 in September from 100.1 in August. Later in the session, August JOLTS Job Openings data will be looked upon for fresh impetus.
Gold technical outlook
Despite the recent decline, the XAU/USD pair continues to trade within the two-week-old $1,750-70 range. Only a daily close outside of that channel could trigger a decisive move.
In the meantime, the Relative Strength Index indicator on the four-hour chart continues to fluctuate between 40 and 60, confirming the view that XAU/USD is having a difficult time finding direction.
With a break below $1,750, gold could target $1,735 (static level) as the next target on the downside ahead of $1,725 (static level). On the other hand, the 200-period SMA forms significant resistance at $1,780.
Additional levels to watch for
European Central Bank (ECB) Governing Council member Francois Villeroy de Galhau said on Tuesday risk remains that they fall short of the 2023 inflation target rather than exceed it, as reported by Reuters.
"This calls for continued accommodative monetary policy," Villeroy added and noted that exiting from the Pandemic Emergency Purchase Program would not signal the end of the ECB's very accommodative monetary policy.
Market reaction
The EUR/USD pair showed no immediate reaction to these remarks and was last seen trading flat on the day at 1.1554.
- EUR/USD is having a tough time making a decisive move in either direction.
- US Dollar Index goes into consolidation after posting gains on Monday.
- Wall Street's main indexes look to open modestly higher.
The EUR/USD pair advanced to a session high of 1.1570 during the European trading hours but failed to preserve its bullish momentum. As of writing, the pair was virtually unchanged on a daily basis at 1.1552.
Markets remain calm ahead of Wednesday's key events
In the absence of significant fundamental drivers, major pairs are fluctuating in tight ranges. Moreover, investors seem to be opting out to stay on the sidelines while waiting for Wednesday's Consumer Price Index (CPI) data from the US and the FOMC's Meeting Minutes.
FOMC Minutes Preview: Fed to reiterate taper message, sending the dollar up, stocks down
Meanwhile, US stock index futures are up between 0.1% and 0.35% ahead of the opening bell. In case risk flows start to dominate financial markets in the second half of the day, the greenback could have a tough time finding demand. Currently, the US Dollar Index is posting small daily losses at 94.31. Nevertheless, EUR/USD is unlikely to break out of the horizontal channel that seems to have formed between 1.1550 and 1.1600.
Earlier in the day, the data from the US showed that the NFIB Business Optimism Index edged lower to 99.1 in September from 100.1 in August but investors showed little to no attention to this reading.
On the other hand, European Central Bank (ECB) Governing Council member and Bank of France Head Francois Villeroy de Galhau said on Tuesday that the uncertainty in the eurozone shifted from growth outlook to inflation outlook.
Technical levels to watch for
European Central Bank (ECB) top supervisor Andrea Enria said on Tuesday that the banking sector in Europe is comfortable in terms of capital, as reported by Reuters.
However, Enria further noted that forborne loans in the euro area warrant caution.
Market reaction
These comments don't seem to be having a noticeable impact on market sentiment. As of writing, the Euro Stoxx 50 Index was down 0.35% on the day at 4,058. Meanwhile, the EUR/USD pair continues to fluctuate in a tight range and was last seen trading unchanged on a daily basis at 1.1551.
- USD/CAD stays under modest bearish pressure on Tuesday.
- US Dollar Index continues to move sideways above 94.00.
- WTI holds above $80 after climbing to multi-year highs on Monday.
The USD/CAD pair spent the Asian session fluctuating in a tight range but started to edge lower ahead of the American session with the commodity-sensitive loonie gathering strength on rising crude oil prices.
Oil weakness remains short-lived
Supported by reports suggesting that OPEC+ is not looking to increase its output despite rising energy prices, the barrel of West Texas Intermediate reached its highest level in nearly seven years at $82.15 on Monday. Although WTI staged a correction and briefly dipped below $80 on Tuesday, it's currently up 0.5% on the day at $80.85.
On the other hand, the negative shift witnessed in risk sentiment helped the greenback gather strength in the late American session on Monday and allowed USD/CAD to limit its losses. The US Dollar Index, which reached a six-day high of 94.43 earlier in the day, is now flat around 94.30.
There won't be any high-tier macroeconomic data releases in the remainder of the day and the risk perception is likely to continue to impact the USD's market valuation. Currently, US stock index futures are little changed on a daily basis.
The Consumer Price Index (CPI) data from the US on Wednesday will be the next significant data that could ramp up the market volatility.
Technical levels to watch for
Economist at UOB Group Barnabas Gan reviews the latest interest rate decision by the RBI.
Key Takeaways
“The Reserve Bank of India (RBI) kept its policy repo rate and reverse repo rate unchanged at 4.00% and 3.35% respectively in its October’s monetary policy meeting, in line with market expectations. The monetary policy committee voted unanimously to keep the rates unchanged.”
“Similar to RBI’s August meeting, the MPC voted 5-1 majority to continue with an accommodative stance as long as necessary to revive and sustain growth on a durable basis, while keeping inflation within target.”
“RBI’s tone seen in the monetary policy statement continued to stay positive, similar to the previous August’s policy meeting.”
“Given the improving economic prognosis and ebbing COVID-19 infections in India, it is evident that RBI will likely floor its policy-rate at 4.0% for the rest of this year.”
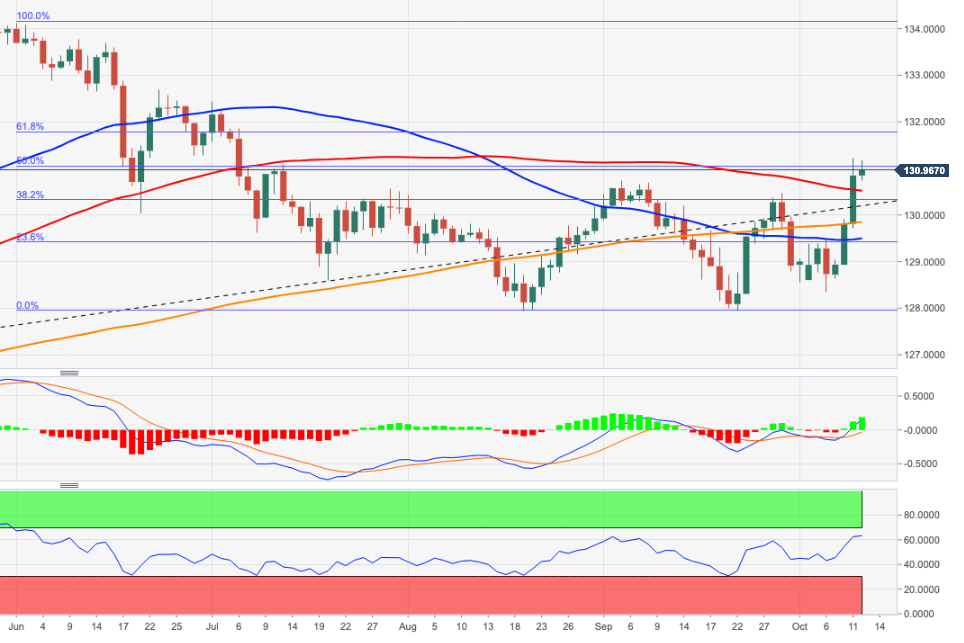
- EUR/JPY extends the recovery further north of 131.00.
- The next target is located at the Fibo level at 131.75.
EUR/JPY pushes higher and surpasses the 131.00 mark, reaching fresh 3-month peaks at the same time on Tuesday.
The cross keeps the recent breakout of the 200-day SMA well and sound, allowing for extra gains in the very near term. That said, there is an interim hurdle at 131.75, where another Fibo level sits ahead of 132.69 (high June 23).
In the broader scenario, while above the 200-day SMA at 129.81, the outlook for the cross is expected to remain constructive.
EUR/JPY daily chart
- USD/CHF attracted some dip-buying near 0.9255 area, though lacked follow-through.
- A recovery in equity markets undermined the safe-haven CHF and remained supportive.
- A subdued USD demand held bulls from placing aggressive bets and capped the upside.
The USD/CHF pair reversed an intraday dip to the 0.9255 area and was last seen hovering near the top end of its daily trading range, around the 0.9270-75 region.
A goodish rebound in the US equity futures undermined the safe-haven Swiss franc and was seen as a key factor that acted as a tailwind for the USD/CHF pair. However, a subdued US dollar demand held bulls from placing aggressive bets and kept a lid on any meaningful gains for the major, at least for the time being.
A softer tone surrounding the US Treasury bond yields failed to assist the USD to capitalize on the previous day's positive move back closer to one-year tops. That said, prospects for an early policy tightening by the Fed should assist the greenback to attract some dip-buying and lend some support to the USD/CHF pair.
Despite Friday's weaker headline NFP print, investors seem convinced that the Fed remains on track to begin tapering its bond purchases by the end of 2021. The markets have also started pricing in the possibility of an interest rate hike in 2022 amid worries that the recent surge in oil/energy prices will stoke inflation.
Hence, the market focus now shifts to the release of the US consumer inflation figures on Wednesday, which will be followed by the FOMC meeting minutes. Apart from this, the US monthly Retail Sales figures, due on Friday, will influence the USD price dynamics and provide a fresh directional impetus to the USD/CHF pair.
In the meantime, traders might take cues from Tuesday's release of JOLTS Job Openings data for some impetus later during the early North American session. This, along with a scheduled speech by Fed Governor Richard Clarida and the broader market risk sentiment, might produce short-term trading opportunities around the USD/CHF pair.
From a technical perspective, the pair has been oscillating in a familiar/narrow trading band over the past one week or so. This constitutes the formation of a rectangle on short-term charts and points to indecision amid traders over the USD/CHF pair's near-term trajectory. This, in turn, warrants some caution before placing aggressive bets.
Technical levels to watch
Suan Teck Kin, CFA, at UOB Group’s Global Economics & Markets Research comments on last Friday’s release of the US labour market report for the month of September.
Key Takeaways
“After the big miss in the Aug nonfarm payrolls (NFP), the pace of job creation in the US disappointed yet again. NFP increased 194,000 in Sep – the smallest advance this year – well below expectations of 450,000 and slower than the upwardly revised 366,000 gain in Aug. Cumulatively, nonfarm employment has increased by 17.4 million since the trough in April 2020, but is still down by 5.0 million, or 3.3%, from its pre-pandemic level in Feb 2020. Nonetheless, the US Labor Department’s employment situation report (8 Oct) shows that the unemployment rate improved to 4.8%, 0.4% point lower than 5.2% in Aug, and is at the lowest since the pandemic began.”
“Of the 194,000 increase in NFP, the private sector contributed 317,000 jobs (Aug: 332,000) which was offset by public sector job losses of 123,000, a reversal from an increase of 34,000 in Aug.”
“Despite another disappointing headline NFP, the US labor market continues to make steady progress to recover from the depth of job losses. At about 5 million jobs short of the pre-pandemic level, it is a vast improvement compared to the 22 million job losses at the worst point of the pandemic. In addition, job creation in the private sector remains the main driving force in the US labor market, with the creation of more than 17 million jobs since the recovery started in May 2020, vs. the cumulative addition of 670,000 government jobs.”
“As such, we believe that the Fed would not be deterred by the latest job report and will proceed with the tapering of its bond buying program at the 2/3 Nov FOMC and completing in 8 months by Jul 2022, as outlined in our report on the Sep FOMC. This will be followed by the first Fed rate increase of 25bps starting from Dec 2022, and then another 2 more 25bps hikes in 2023.”
- EUR/GBP witnessed heavy selling during the early part of the European session on Tuesday.
- Hawkish BoE signals helped revive the GBP demand and prompted selling around the cross.
- Disappointing ZEW Survey results weighed on the euro and contributed to the intraday slide.
The EUR/GBP cross faded an early European session bullish spike to three-day tops and dropped to fresh daily lows, back below the key 0.8500 psychological mark in the last hour.
The cross gained some positive traction during the first half of the trading action on Tuesday, albeit struggled to capitalize on the move and witnessed an intraday turnaround from the 0.8520 area. A sudden pickup in demand for the British pound turned out to be a key factor that prompted aggressive selling around the EUR/GBP cross.
Over the weekend, the Bank of England (BoE) officials, including Governor Andrew Bailey, signalled an imminent interest rate later this year. The money market seems to have fully priced in a 25bps BoE rate hike in December. This was evident from a spike in the UK 10-year gilt yield, which rose to the highest level since May 2019, at 1.222% on Monday.
On the other hand, the European Central Bank (ECB) chief economist Philip Lane said that the medium-term inflation dynamic is too slow and that the trigger for monetary policy action is not there. This widened the UK-German 10-year bond yield differential to the highest since mid-2016, favouring the GBP bulls and acting as a headwind for the EUR/GBP cross.
Apart from this, worsening economic sentiment in the Eurozone's largest economy – Germany – undermined the shared currency and contributed to the EUR/GBP pair's sudden fall over the past hour or so. In fact, the German ZEW Economic Sentiment Index fell to 22.3 from 26.5 previous and missed consensus estimates pointing to a reading of 24.0.
That said, a modest US dollar weakness extended some support to the euro and helped limit any deeper losses for the EUR/GBP cross, at least for the time being. Nevertheless, the fundamental backdrop seems tilted in favour of bearish traders and supports prospects for an extension of the recent sharp pullback from the very important 200-day SMA.
Technical levels to watch
- USD/TRY has more room to rise, with fresh record highs in sight.
- The spot charted a bull pennant breakout on the 1D chart last Friday.
- RSI stays overbought but impending bull cross keeps buyers hopeful.
USD/TRY is hovering close to fresh all-time highs of 9.04, as the bulls gather strength for the next push higher.
In doing so, the pair extends its bullish momentum into the third straight day, eyeing fresh record highs in the coming sessions.
The upside potential is well depicted by USD/TRY’s daily technical setup, which shows that the pair confirmed a bull pennant breakout on the said time frame last Friday after closing above the falling trendline resistance, then at 8.92.
With the big technical breakout, the upside opens up towards the measured target of 9.61. Ahead of that the 9.50 psychological level could come into play.
Impending bull cross, with the 50-Daily Moving Average (DMA) set to cross the 100-DMA for the upside, adds credence to a potential move higher.
However, with the 14-day Relative Strength Index (RSI) trending within the overbought territory, there remains a risk for a minor pullback before the next upswing kicks in.
USD/TRY: Daily chart
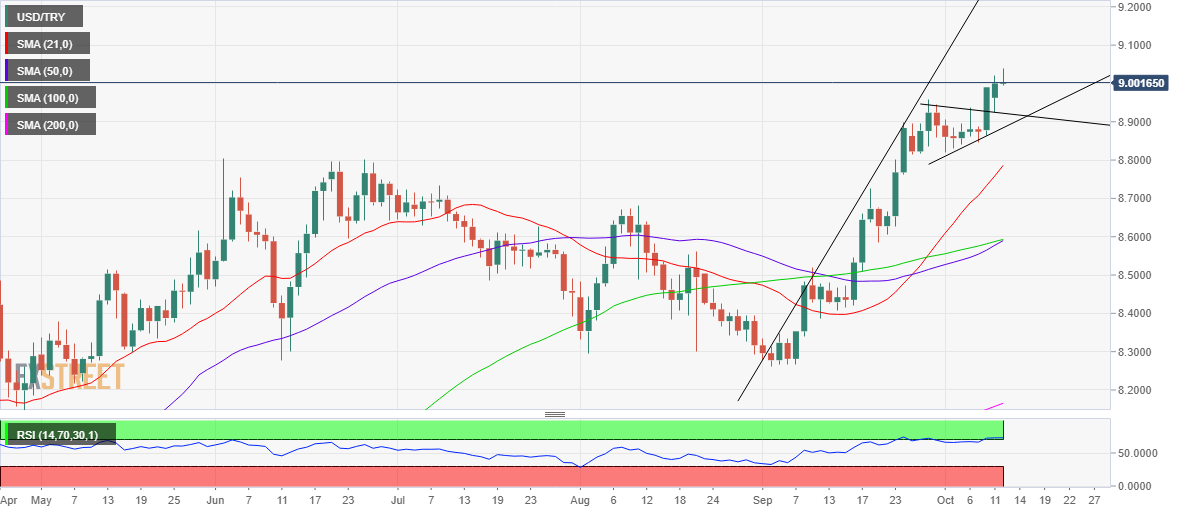
On the downside, the bull pennant resistance now turned support at 8.92 will offer immediate respite to the buyers on any pullbacks.
Further south, the original support of the bullish continuation pattern at 8.88 could challenge the buyers’ commitments.
A breach of the latter on a daily closing basis will lead to a pattern failure, opening floors for a test of the bullish 21-DMA at 8.76.
Following the release of the monthly ZEW Survey for Germany, the country’s highly influential institute presents a dour outlook of the economy.
Key takeaways
“Assessment of the economic situation in Germany has worsened in the current survey.”
“Compared to the previous month, the outlook for the economic development in the next six months has noticeably deteriorated.”
“Further decline of the ZEW indicator of economic sentiment is mainly due to the persisting supply bottlenecks for raw materials and intermediate products.”
“Financial market experts expect profits to go down, especially in export-oriented sectors such as vehicle manufacturing and chemicals/pharmaceuticals.”
“49.1 percent of the experts still expect the inflation rate to rise further in the next six months.”
Related reads
- German ZEW Economic Sentiment Index drops to 22.3 in October, misses estimates
- EUR/USD Forecast: Euro stays near 2021 lows as ECB doubles down on dovish outlook
- AUD/USD gained some positive traction on Tuesday amid a modest USD weakness.
- A combination of factors might act as a tailwind for the USD and cap gains for the pair.
- Acceptance above the 0.7315-20 resistance zone supports prospects for further gains.
The AUD/USD pair built on its steady intraday ascent and climbed to the 0.7365 region, back closer to four-week tops during the early part of the European session.
The pair attracted some dip-buying on Tuesday and now looks to build on last week's breakout through the 0.7315-20 horizontal resistance zone. The uptick was exclusively sponsored by a modest US dollar weakness, though lacked bullish conviction and warrants some caution before positioning for any further appreciating move.
Expectations that the Fed remains on track to begin rolling back its massive pandemic-era stimulus and the possibility for an interest rate hike in 2022 should act as a tailwind for the greenback. This, along with a generally softer risk tone, might hold investors from placing aggressive bullish bets around the perceived riskier aussie.
Investors remain worried that the recent surge in crude oil/energy prices could stoke inflation. This comes on the back of signs of a slowdown in the global economic recovery and has been fueling concerns about stagflation. Apart from this, fears of a spillover from China Evergrand's debt crisis took its toll on the global risk sentiment.
From a technical perspective, acceptance above the 0.7315-20 resistance breakpoint favours bullish traders and supports prospects for additional gains. Some follow-through buying beyond the overnight swing highs, around the 0.7375 region, will reaffirm the positive outlook and allow push the AUD/USD pair to aim back to reclaim the 0.7400 mark.
Market participants now look forward to the US economic docket, featuring the release of JOLTS Job Openings data. This, along with a scheduled speech by Fed Governor Richard Clarida, will influence the USD. Traders might further take cues from the broader market risk sentiment for some short-term trading opportunities around the AUD/USD pair.
Technical levels to watch
- German ZEW Economic Sentiment arrived at 22.3 in October, down from 26.5 previous.
- The ZEW Current Situation for Germany came in 21.6 at in October vs. 31.9 in September.
- EUR/USD remains unfazed around 1.1560 on downbeat ZEW data.
The German ZEW headline numbers for October showed that the Economic Sentiment Index worsened to 22.3 from 26.5 previous while missing estimates of 24.0.
Meanwhile, the Current Conditions sub-index dropped to 21.6 in October as against 31.9 recorded in the previous month and 29.5 expectations.
The Eurozone ZEW Economic Sentiment for October fell to 21.0 for the current month as compared to the 31.1 previous and 37.0 consensus forecast.
FX market reaction
The euro kept its retreat from daily highs intact on the downbeat ZEW Surveys, but EUR/USD held well above the 1.1550 level.
The spot was last seen trading at 1.1563, up 0.10% on the day.
- Gold price tests the higher levels once again amid steady USD, Treasury yields.
- Gold traders remain cautious of the critical US inflation data, Fed minutes.
- Gold on the back foot as NFP fails to alter taper prospects.
Gold price is posting modest gains but remains well within the recent trading range above the $1750 level so far this Tuesday. A flight to safety amid intensifying stagflation fears offers support to the traditional safe-haven gold. Further, a pause in the US Treasury yields rally aides the rebound in gold price. However, the Fed’s tapering expectations continue to limit gold’s upside potential, as investors await the return of full markets and Wednesday’s critical US inflation report for a fresh directional move in gold price.
Read: Gold Price Forecast: Will XAU/USD find a foothold above 21-DMA? US inflation in focus
Gold Price: Key levels to watch
According to the Technical Confluences Detector, gold is moving back and forth, without a clear directional bias, with a bunch of healthy barriers stacked up in either direction.
Immediate upside is capped at $1762, which is the convergence of the Bollinger Band one-hour Upper and the previous day’s high.
The next significant topside hurdle is seen at $1765, where the Fibonacci 38.2% one-month aligns.
The Fibonacci 61.8% one-week at $1767 will then challenge the bearish commitments.
Gold bulls need to find acceptance above the pivot point one-day R3 at $1771 to initiate a meaningful uptrend.
Alternatively, gold buyers will once again challenge bids at $1755, the convergence of the Fibonacci 23.6% one-week and Fibonacci 38.2% one-day.
A sustained move below the latter will expose the $1750 psychological level, below which the next downside target at $1748 could get tested. That level is the Fibonacci 23.6% one-month.
The next cushion appears around $1745, where the previous week’s low intersects the pivot point one-day S2.
The pivot point one-week S1 at $1741 will be the level to beat for gold bears.
Here is how it looks on the tool
About Technical Confluences Detector
The TCD (Technical Confluences Detector) is a tool to locate and point out those price levels where there is a congestion of indicators, moving averages, Fibonacci levels, Pivot Points, etc. If you are a short-term trader, you will find entry points for counter-trend strategies and hunt a few points at a time. If you are a medium-to-long-term trader, this tool will allow you to know in advance the price levels where a medium-to-long-term trend may stop and rest, where to unwind positions, or where to increase your position size.
UOB Group’s Senior Economist Julia Goh and Economist Loke Siew Ting assess the latest foreign portfolio figures in Malaysia.
Key Takeaways
“Malaysia continued to receive foreign portfolio inflows for the second consecutive month, albeit moderate at MYR1.4bn in Sep (Aug: +MYR7.7bn), bringing the accumulated overseas capital inflows to MYR4.1bn in 3Q21 (2Q21: +MYR5.3bn). Non-residents remained net buyers of domestic debt securities (+MYR0.6bn) and equities (+MYR0.7bn) for two months in a row in Sep. This helped to push up year-to-date overall foreign portfolio inflows to the highest level since 2016, at MYR24.3bn (Jan-Sep 2020: -MYR17.5bn).”
“Bank Negara Malaysia’s (BNM) foreign reserves dropped the most since Mar 2020 by USD1.1bn m/m to USD115.2bn as of end-Sep. This came after taking into account the quarterly foreign exchange revaluation changes, whereby the MYR weakened by 0.8% q/q to 4.1880 against the USD at the end of 3Q21 (end-2Q21: +0.1% q/q to 4.1543). The latest reserves position is sufficient to finance 8.2 months of retained imports and is 1.3 times of total short-term external debt.”
“Near-term capital flows into emerging markets including Malaysia are expected to remain volatile as market jitters surrounding the global monetary policy normalisation, China’s regulatory crackdown, elevated inflationary pressures, and a global energy crunch continue to take center stage. Domestically, positive developments in the national vaccination program, relaxations of lockdown measures, and bipartisan cooperation are seen as key catalysts for Malaysia’s capital flows ahead. Major events to watch this month (Oct) include IMF’s world economic outlook (between 11-17 Oct) and Malaysia’s Budget 2022 (on 29 Oct).”
- EUR/USD remains consolidative in the lower end of the range.
- The German/EMU ZEW survey comes next in the docket.
- US NFIB Index, JOLTs Job Openings are due in the NA session.
The European currency regains the smile and lifts EUR/USD to the 1.1560 region on turnaround Tuesday.
EUR/USD looks to data, risk trends
EUR/USD adds to the ongoing consolidation in the first half of the week, always in the lower bound of the recent range and close to the 2021 low in the boundaries of the 1.1530 level.
Absent drivers of note, the pair looks to the broad risk appetite trends for price direction as well as the usual dynamics surrounding the buck.
The pair failed to gather further upside traction as of late despite yields of the German 10-year Bund extended the rally to levels last seen in back in late May near the -0.10%, all amidst the inactivity in the US cash market on Monday due to the Columbus Day holiday.
In the domestic calendar, the Economic Sentiment in both Germany and the Euroland measured by the ZEW survey will take centre stage in the region later in the morning. Across the pond, the NFIB Index and JOLTs Job Openings are due ahead of the more relevant inflation figures due on Wednesday.
What to look for around EUR
Despite the recent bullish attempt, EUR/USD remains well under pressure. Indeed, dollar dynamics continue to rule the sentiment surrounding the European currency and relegate the pair to trade near YTD lows for the time being. The firmer tone in the buck along with higher US yields and bouts of risk aversion – particularly on the debt ceiling issue - continue to undermine the performance of the risk universe, while the growth outlook appears under pressure on rising speculations that the inflation could take longer to reverse the ongoing elevated levels. In addition, the likely loss of momentum in the economic recovery, as per some weakness seen in key fundamentals, also caps the upside potential in the pair.
Key events in the euro area this week: German/EMU Economic Sentiment (Tuesday) – German final CPI, EMU Industrial Production (Wednesday) – European Council Meeting (Thursday) - European Council Meeting, EMU Balance of Trade (Friday).
Eminent issues on the back boiler: Asymmetric economic recovery in the region. Sustainability of the pick-up in inflation figures. Progress of the Delta variant of the coronavirus and pace of the vaccination campaign. Probable political effervescence around the EU Recovery Fund. Investors’ shift to European equities in the wake of the pandemic could lend extra oxygen to the single currency. ECB tapering speculations.
EUR/USD levels to watch
So far, spot is gaining 0.12% at 1.1563 and faces the next up barrier at 1.1640 (weekly high Oct.4) followed by 1.1652 (20-day SMA) and finally 1.1755 (weekly high Sep.22). On the other hand, a break below 1.1529 (2021 low Oct.6) would target 1.1500 (round level) en route to 1.1495 (high Mar.9 2020).
- GBP/USD witnessed some selling on Tuesday amid the emergence of some USD dip-buying.
- The set-up favours bearish traders and supports prospects for a further depreciating move.
- A sustained move beyond mid-1.3600s is needed to negate the near-term bearish outlook.
The GBP/USD pair witnessed some selling during the early European session and dropped to four-day lows, around the 1.3570-65 region in the last hour.
Against the backdrop of expectations for an early policy tightening by the Fed, the risk-off impulse in the markets assisted the safe-haven US dollar to reverse an early dip. This, in turn, was seen as a key factor that exerted some pressure on the GBP/USD pair.
On the other hand, the British pound was pressured by the UK-EU stand-off over the Northern Ireland protocol of the Brexit agreement. This overshadowed mostly upbeat UK monthly employment figures for September and acted as a headwind for the GBP/USD pair.
From a technical perspective, the was seen flirting with confluence support comprising of 200-hour SMA and over one-week-old ascending trend-line. A convincing break below will prompt aggressive technical selling and pave the way for additional losses.
Meanwhile, oscillators on the daily chart maintained their bearish bias and have been gaining negative traction on hourly charts. The set-up seems tilted firmly in favour of bearish traders and supports prospects for an eventual breakthrough the confluence support.
The subsequent downfall has the potential to drag the GBP/USD pair towards intermediate support near the 1.3530-25 region en-route the key 1.3500 psychological mark. Some follow-through selling could expose September monthly swing lows, around the 1.3415-10 area.
On the flip side, the 1.3610-15 region now seems to have emerged as immediate strong resistance. This is followed by resistance near mid-1.3600s and the overnight swing highs, around the 1.3670-75 region, or near two-week tops touched in the previous day.
A sustained strength beyond will negate any near-term bearish bias and push the GBP/USD pair further beyond the 1.3700 mark, towards testing the next relevant hurdle near the 1.3720-25 region. This is followed by a strong horizontal barrier near the 1.3750-55 zone.
GBP/USD 1-hour chart
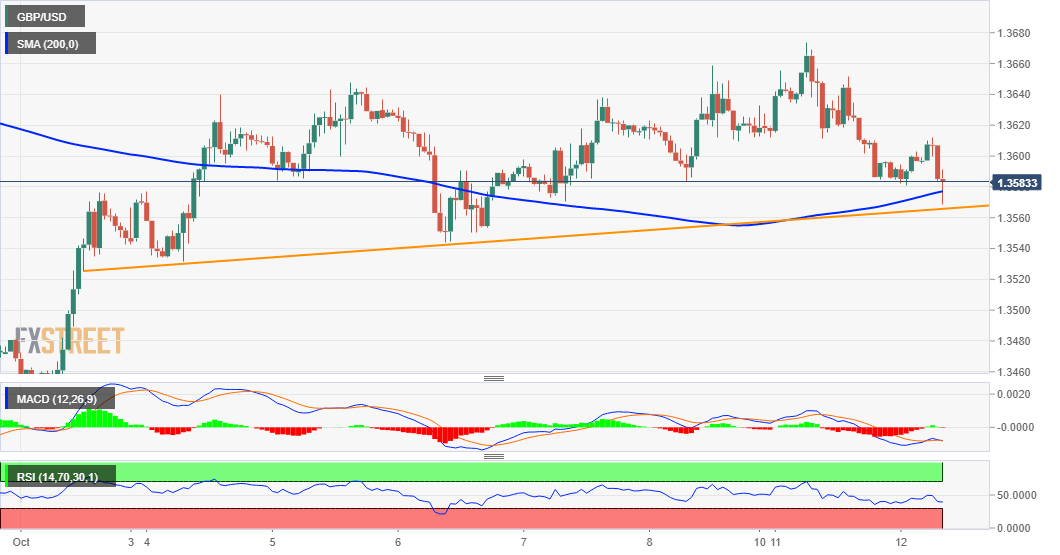
Technical levels to watch
Responding to an opposition lawmaker’s question on how the government would respond to excessive yen declines, Japanese Prime Minister Fumio Kishida told parliament that they are closely watching forex moves' impact on the economy.
Additional quotes
Yen weakening would help boost exports.
Weak yen would also increase corporate costs by pushing up import prices.
Want to expand current tax incentive scheme aimed at prodding firms to raise wages, such as targeting broader firms.
Must deploy fiscal stimulus flexibly but does not mean no problem with increasing debt balance indefinitely.
Must win market trust in Japan’s finances to avoid risk of default.
Market reaction
USD/JPY has bounced off a dip to 113.01, now trading around 113.30, as the US dollar gets a mild boost amid persistent risk-off flows. The spot is modestly flat on the day.
- USD/JPY witnessed an intraday pullback from multi-year tops touched earlier this Tuesday.
- The risk-off impulse benefitted the safe-haven JPY and prompted bulls to take some profits.
- A combination of factors should help limit any meaningful corrective pullback for the major.
The USD/JPY pair refreshed daily lows during the early European session, albeit managed to defend the 113.00 mark and quickly recovered few pips thereafter. The pair was last seen hovering around the 113.20-25 region, nearly unchanged for the day.
Worries of a faster than expected rise in inflation and signs of a slowdown in the global economic recovery have been fueling concerns about stagflation. Apart from this, the contagion risks from China Evergrande's debt crisis took its toll on the global risk sentiment. This, in turn, benefitted the safe-haven Japanese yen and triggered an intraday turnaround for the USD/JPY pair from mid-113.00s, or the highest level since December 2018 touched earlier this Tuesday.
Apart from this, a modest US dollar pullback from the vicinity of one-year tops exerted some downward pressure on the USD/JPY pair. That said, prospects for an early policy tightening by the Fed continued acting as a tailwind for the greenback and helped limit any deeper losses for the major, at least for now. Despite Friday's disappointing headline NFP print, investors seem convinced that the Fed might still begin tapering its bond purchases as soon as November.
The markets have also started pricing in the prospects for an interest rate hike in 2022 to counter the risk of inflation becoming too high. This was evident from the recent surge in the US Treasury bond yields, pushing the yield on the benchmark 10-year US government bond to four-month tops on Friday. On the other hand, the yield on the 10-year Japanese government bond remained near zero amid the Bank of Japan's yield curve control policy.
This has resulted in the widening of the US-Japanese yield differential, which could undermine the Japanese yen and further lend support to the USD/JPY pair. The fundamental backdrop favours bullish traders, though overbought conditions on short-term charts seemed to be the only factor capping the upside. That said, any meaningful pullback might still be seen as a buying opportunity and is more likely to remain limited.
Technical levels to watch
UOB Group’s FX Strategists noted that the consolidative theme is expected to persist around USD/CNH for the time being.
Key Quotes
24-hour view: “Yesterday, we held the view that the ‘bias for USD is on the downside towards 6.4340’. USD subsequently dipped to 6.4348 before making a sharp reversal and surged to 6.4599 before extending its gains during early Asian hours. The rapid build-up in momentum suggests that USD could strengthen further to 6.4710. The major resistance at 6.4800 is unlikely to come into the picture. On the downside, a break of 6.4500 (minor support is at 6.4550) would indicate that the current upward pressure has eased.”
Next 1-3 weeks: “There is no change in our view from last Wednesday (06 Oct, spot at 6.4500). As highlighted, USD is likely to trade between 6.4240 and 6.4800 for a period of time. Looking ahead, the odds for a break of 6.4800 first are higher but USD has to close above 6.4880 before a sustained advance can be expected.”
- DXY fades part of Monday’s advance and trades around 94.30.
- US cash market returns to normality following Monday’s inactivity.
- NFIB Index, JOLTs Job Openings next on tap in the US calendar.
The greenback, in terms of the US Dollar Index (DXY) gives away part of the optimism witnessed at the beginning of the week.
US Dollar Index remains focused on US CPI, FOMC Minutes
The index extends the recent choppy activity so far on Tuesday and manages well to keep business above the key 94.00 mark.
In the meantime, the dollar sheds some ground gained on Monday amidst the return to the normal activity in the US bonds market, where yields of the key 10-year benchmark remain firm above 1.60% while the short end of the curve eases from recent tops near 0.35%.
On the more macro view, the debate around the debt ceiling appears to have now entered into an impasse following last week’s agreement to extend the federal government funding until December. On another front, the energy crisis particularly in Asia coupled with supply constraints continues to fuel concerns around growth prospects and inflation.
A light docket in the US will see the NFIB Index and the JOLTs Job Openings, while QE tapering is expected to remain in centre stage in speeches by FOMC’s R.Clarida (permanent voter, dovish) and Atlanta Fed R.Bostic (voter, centrist).
What to look for around USD
The index resumed the upside on Monday, although a move beyond 2021 highs around 94.50 still remains elusive. Positive news from the debt-ceiling and inflation jitters sponsored the selloff in the bonds market seen in past sessions and propeled yields to fresh tops, lending extra legs to the buck at the same time. Looking beyond the immediate term, the dollar remains underpinned by markets’ adjustment to prospects for a “soon” start of the tapering process, probable rate hikes at some point during next year and the rising view that elevated inflation could last more than initially expected.
Key events in the US this week: Inflation tracked by the CPI, FOMC Minutes (Wednesday) – initial Claims (Thursday) – Retail Sales, flash Consumer Sentiment (Friday).
Eminent issues on the back boiler: Biden’s multi-billion Build Back Better plan. US-China trade conflict under the Biden’s administration. Tapering speculation vs. economic recovery. Debt ceiling debate. Geopolitical risks stemming from Afghanistan.
US Dollar Index relevant levels
Now, the index is losing 0.05% at 94.30 and a break above 94.50 (2021 high Sep.30) would open the door to 94.74 (monthly high Sep.25 2020) and then 94.76 (200-week SMA). On the flip side, the next down barrier emerges at 93.67 (monthly low Oct.4) followed by 92.98 (weekly low Sep.23) and finally 91.94 (monthly low Sep.3).
- USD/CAD stalls the recovery attempt just shy of the 1.2500 mark.
- US dollar weakens while WTI recaptures the $80 mark
- Four-hourly chart points to an additional downside while below 21-SMA.
USD/CAD has stalled its rebound from three-month troughs of 1.2446, as sellers return amid a pullback in the US dollar and a fresh uptick in oil prices.
The US oil is resuming its upside while recapturing the $80 mark while the greenback pulls back from near yearly tops despite the risk-off market profile.
The oil price action will be closely followed for fresh trading opportunities in the resource-linked loonie, as the main event risk remains the US inflation data due this Wednesday.
Looking at USD/CAD’s four-hour chart, the pair has failed to clear the 1.2500 mark on the road to recovery, leaving the rates consolidating in a tight range.
If the downside pressure intensifies, then the pair could drop back towards the multi-month lows of 1.2446.
Further south, the bulls will challenge the bearish commitments at 1.2396, which is the falling trendline support on the said time frame.
The Relative Strength Index (RSI) points lower below the midline, suggesting that there is room for additional decline.
USD/CAD: Four-hour chart
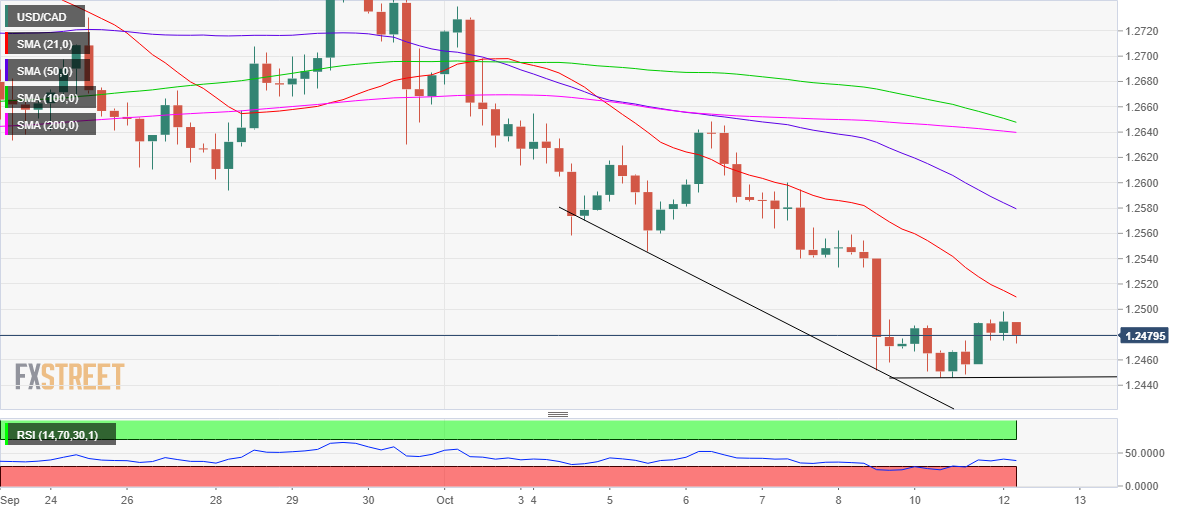
On the flip side, acceptance above 1.2500 will trigger a fresh advance towards the bearish 21-Simple Moving Average (SMA) at 1.2509.
The next relevant upside target for the buyers is seen at 1.2550, the psychological magnate.
USD/CAD: Additional levels
- NZD/USD reversed an intraday dip to the 0.6925 region amid a modest USD weakness.
- Hawkish Fed expectations should help limit the USD losses and cap the upside for the pair.
- The risk-off mood might hold bulls from placing fresh bets around the perceived riskier kiwi.
The NZD/USD pair bounced over 25 pips from daily lows, albeit lacked any follow-through buying beyond mid-0.6900s.
Following the previous day's pullback from multi-day tops, the NZD/USD pair attracted some dip-buying near the 0.6925 region on Tuesday and was supported by a modest US dollar weakness. That said, a combination of factors held bulls from placing aggressive bets and kept a lid on any meaningful upside for the pair, at least for the time being.
In the absence of any fresh fundamental catalyst, prospects for an early policy tightening by the Fed should continue to act as a tailwind for the greenback. Despite Friday's disappointing headline NFP print for September, investors seem convinced that the Fed will begin rolling back its massive pandemic-era stimulus as soon as November.
The markets might have also started pricing in the possibility of an interest rate hike in 2022 amid worries that the recent surge in crude oil/energy prices will stoke inflation. Apart from this, the risk-off impulse in the markets could further benefit the safe-haven greenback and cap any further gains for the perceived riskier kiwi.
Worries of a faster than expected rise in inflation and signs of a slowdown in the global economic recovery have been fueling concerns about stagflation. This, along with the contagion risks from China Evergrande's debt crisis, took its toll on the global risk sentiment, which was evident from a corrective pullback in the equity markets.
Even from a technical perspective, the NZD/USD pair has been oscillating in a familiar trading range over the past one week or so. This further makes it prudent to wait for a sustained break in either direction before placing aggressive bets amid a relatively thin US economic docket, featuring the release of August JOLTS Job Openings data.
Technical levels to watch
Here is what you need to know on Tuesday, October 12:
In the absence of high-impact macroeconomic data releases, the risk perception became the primary driver of market movement at the start of the week. With major equity indexes in the US turning south after spending the first couple of hours of the session in the positive territory, the US Dollar Index regained its traction and rose 0.27% on Monday.
Risk-aversion became prominent, once again, during the Asian trading hours on Tuesday as the Nikkei 225 and the Shanghai Stock Exchange both fell more than 1%. Later in the day, the ZEW Survey - Economic Sentiment Index for the euro area and Germany, NFIB Business Optimism Index and JOLTS Job Openings data from the US will be featured in the economic calendar. Nevertheless, market participants are likely to stay focused on the market mood ahead of Wednesday's key US inflation report.
US Consumer Price Index September Preview: Inflation averaging, what inflation averaging?
Wall Street: The S&P 500 lost 0.69% and the Dow Jones Industrial Average erased 0.72% on Monday. In addition to Friday’s disappointing jobs report, renewed concerns over Chinese real-estate developers failing to make payments also seem to have caused market participants to take a cautious stance. Pressured by a 1.45% decline in the Communication Services Index, the tech-sensitive Nasdaq Composite lost 0.65%. Major US banks including Bank of America, JPMorgan Chase and Citigroup will be reporting third-quarter earnings later in the week.
Renewed USD strength in the second half of the day forced the EUR/USD pair to close in the negative territory on Monday. The pair remains within a touching distance of the 15-month low it set at 1.1529 while consolidating its losses.
The USD/JPY pair advanced to its highest level since late-2018 and seems to have gone into a consolidation phase above 113.00 on Tuesday. After surging more than 10% in the previous week, the benchmark 10-year US Treasury bond yield touched a four-month high of 1.636%, fueling USD/JPY’s rally.
GBPUSD showed little to no reaction to the UK employment report, which showed that the ILO Unemployment Rate edged lower to 4.5% in August, and continues to move sideways around 1.3600. Further details of the publication revealed that Average Earnings Including Bonuses rose by 7.2% on a yearly basis.
For the second straight trading day, gold fluctuated in a very narrow range above $1,750. Wednesday's Consumer Price Index (CPI) data from the US could be the next major catalyst for XAU/USD, which currently posts modest losses around $1,760.
AUD/USD and NZD/USD both managed to register gains on Monday supported by rising commodity prices, especially copper.
Cryptocurrencies: Bitcoin renewed multi-month highs at the start of the week and closes in on $60,000. Ethereum trades near $3,500 on Tuesday and seems to be having a difficult time attracting investors, who are focused on the BTC.
The UK Cabinet Minister and former Brexit Minister Stephen Barclay expressed his concerns on the Northern Ireland protocol, which remains a headwind for the pound amid renewed Brexit jitters.
Barclay said: “There is recognition on both sides that the protocol needs to work for both communities in Northern Ireland, but the protocol is not working.”
Market reaction
GBP/USD is off the highs, attacking 1.3600 amid the Brexit headlines and downbeat mood. The spot is up 0.08% on the day.
In light of the recent price action, USD/JPY could extend the upside to the 114.20 level in the short-term horizon, suggested FX Strategists at UOB Group.
Key Quotes
24-hour view: “While our view for USD to ‘advance further’ yesterday was not wrong, we did not anticipate the manner by which USD rocketed to 113.41 (we were of the view that 112.80 is likely out of reach). Conditions are overbought but the impulsive momentum suggests that USD could strengthen further to 113.80. For today, it appears unlikely that USD would break the major resistance at 114.20. Support is at 113.10 followed by 112.80.”
Next 1-3 weeks: “Yesterday (11 Oct, spot at 112.30), we highlighted that ‘rapid improvement in upward momentum indicates that USD could advance to 112.50, possibly 112.80’. USD subsequently blew past both 112.50 and 112.80 as it rocketed to 113.41 before closing higher by a whopping +0.96% (NY close of 113.30), its largest 1-day advance since Nov last year. The impulsive surge suggests that further USD strength would not be surprising. The next resistance is at 114.20. The USD strength is deemed intact as long as it does not breach 112.40 (‘strong support’ level is markedly higher from yesterday’s level of 111.50).”
Considering advanced prints from CME Group for natural gas futures markets, open interest dropped for the fourth consecutive session on Monday, this time by around 10.8K contracts. On the flip side, volume rose by around 49.2K contracts, reversing at the same time two daily pullbacks in a row.
Natural Gas: Upside still targets the $6.50 mark
Monday’s decline in prices of natural gas was in tandem with shrinking open interest, hinting at the view that the continuation of the downtrend could lack vigour in the very near term. Looking at the broader picture, the resumption of the uptrend keeps targeting the area of recent 2021 peaks around the $6.50 mark per MMBtu.
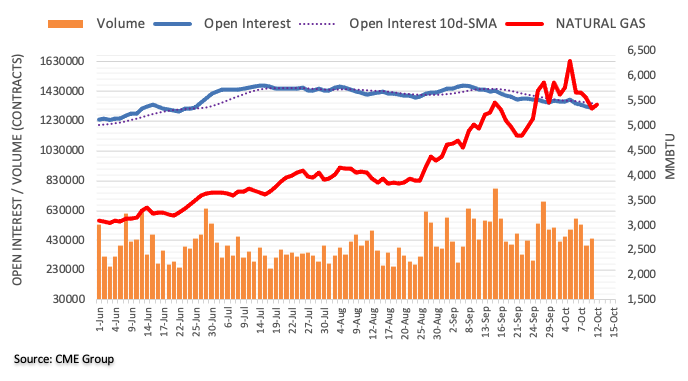
FX Strategists at UOB Group suggested that NZD/USD now moved into a consolidative phase, likely between 0.6875 and 0.7000.
Key Quotes
24-hour view: “Yesterday, we highlighted that ‘momentum indicators have turned neutral and NZD is likely to consolidate within a range of 0.6910/0.6960’. NZD subsequently traded between 0.6917 and 0.6965. We continue to view the price actions as part of a consolidation. For today, NZD is likely to trade within a range of 0.6915/0.6965.”
Next 1-3 weeks: “There is not much to add to our update from yesterday (11 Oct, spot at 0.6935). As highlighted, the recent downside risk has dissipated and NZD is likely to trade sideways within a 0.6875/0.7000 range for now.”
- UK claimant count change arrived at -51.1K in September.
- The unemployment rate in the UK dropped to 4.5% in August.
- The UK wages excluding bonuses rose by 6% YoY vs. 5.9% expected.
The Office for National Statistics (ONS) showed on Tuesday, the UK’s official jobless rate matched market expectations, by arriving at 4.5% in August vs. the previous 4.6% and 4.5% expected while the claimant count change showed a small decrease last month from the previous.
The number of people claiming jobless benefits showed a drop of 51.1K in September when compared to -58.6K seen previously. The claimant count rate came in at 5.2% vs. 5.4% last.
The UK’s average weekly earnings, excluding bonuses, arrived at 6% 3Mo/YoY in August versus +6.8% last and +5.9% expected while the gauge including bonuses came in at 7.2% 3Mo/YoY in August versus +8.3% previous and +7.0% expected.
Key points (via ONS)
207,000 more people were in payrolled employment in September 2021 when compared with August 2021.
UK vacancies 1.102 mln in three months to September.
Estimates underlying ex-bonuses earnings growth rate between 4.1% and 5.6% but stresses uncertainty.
GBP/USD reaction
GBP/USD keeps the advance above 1.3600 amid the upbeat UK jobs report.
The spot was last seen trading at 1.3605, up 0.08% on the day, courtesy of the latest leg down in the US dollar across its main peers.
About UK jobs
The UK Average Earnings released by the Office for National Statistics (ONS) is a key short-term indicator of how levels of pay are changing within the UK economy. Generally speaking, the positive earnings growth anticipates positive (or bullish) for the GBP, whereas a low reading is seen as negative (or bearish).
CME Group’s preliminary readings for crude oil futures markets noted open interest went down for the second session in a row on Monday, this time by around 11.2K contracts. On the other hand, volume went up for the third session in a row, now by nearly 31K contracts.
WTI looks to $82.00 and above
Prices of WTI briefly tested the area above the $82.00 mark at the beginning of the week, receding to the mid-$80.00s afterwards. The continuation of the rally was on the back of shrinking open interest, removing some strength from the upside at least in the very near term. That said, the immediate target now emerges at Monday’s 2021 highs just past the $82.00 mark per barrel.
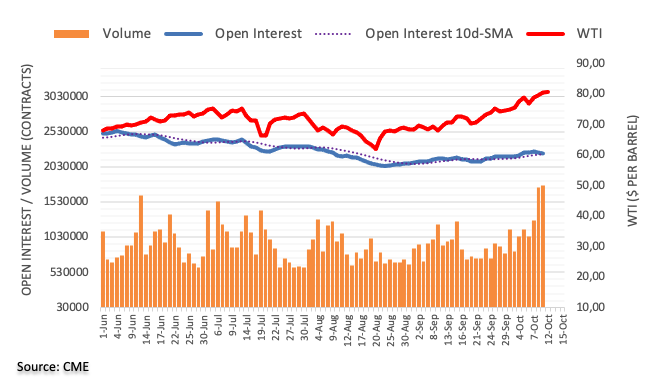
The US-based ratings agency, Fitch Ratings, in its latest report, said that “we further lowered India's GDP forecast for the fiscal year ending March 2022 (FY22) to 8.7% from 10.0% in June as a result of the severe second virus wave.”
Key takeaways
But high-frequency indicators pointed to a strong rebound in the second quarter, as business activity returned to pre-pandemic levels.”
“Raised the FY23 forecast to 10%, from 8.5%, in view of the sharp recovery.”
“Kept the country's rating unchanged at BBB-minus with a 'negative' outlook.“
"The impact of the second wave of the pandemic was to delay, rather than derail, India's economic recovery.”
Market reaction
USD/INR keeps its corrective decline from six-month tops of 75.54 intact, as it currently trades at 75.22, down 0.21% on the day. The rupee stands resilient to the GDP forecast downgrade by Fitch Ratings.
Cable is still seen navigating between 1.3500 and 1.3680 in the next weeks, noted FX Strategists at UOB Group.
Key Quotes
24-hour view: “Yesterday, we highlighted that ‘bias for GBP is on the upside but any advance is unlikely to break the strong resistance at 1.3680’. Our view was not wrong as GBP rose to 1.3674 but we did not anticipate the sharp and rapid drop from the high (low of 1.3584 during late NY hours). The rapid drop has gathered momentum and GBP could weaken to 1.3545. A sustained decline below this level appears unlikely (next support is at 1.3500). Resistance is at 1.3615 followed by 1.3635.”
Next 1-3 weeks: “We highlighted yesterday (11 Oct, spot at 1.3635) that the chance for GBP to break above the top of the expected consolidation range of 1.3460/1.3680 has increased. GBP subsequently rose to within several pips of 1.3680 (high of 1.3674) before staging a surprisingly sharp drop (overnight low of 1.3584). The build-up in shorter-term momentum has fizzled out quickly. In other words, GBP is still trading in a consolidation phase, likely within a 1.3500/1.3680 range (narrowed by 1.3460/1.3680 previously).”
Open interest in gold futures markets rose by just 441 contracts on Monday, adding to the previous small daily build according to flash data from CME Group. Volume, instead, extended the choppiness for yet another day and shrank by around 130.5K contracts.
Gold remains capped by $1,800
Gold prices remained within the consolidative mood at the beginning of the week, charting a negative session amidst a small uptick in open interest. So far, prices of the ounce troy of the precious metal are seen within $1,750 and $1,780 for the time being, while the key $1,800 mark continues to be the magnet for bulls.
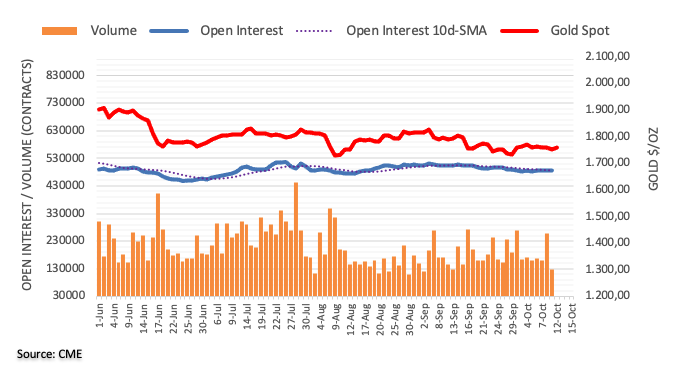
- AUD/USD remains subdued on Tuesday in the early European trading hours.
- The US Dollar Index stands strong above 94.30 with 0.03% gains.
- Higher Inflation risk, Fed’s tapering concerns exerts pressure on the riskier asset.
AUD/USD pauses the previous session’s gains on Tuesday amid risk-off mood. The pair opened higher albeit fizzled out rather quickly toward 0.7333 before recovering higher. The gains were captured following the upbeat Australian business confidence. At the time of writing, AUD/USD is trading at 0.7348, down 0.08% for the day.
The US Dollar Index (DXY), which tracks the performance of the greenback against its six major rivals prints fresh gains near 94.40. Investors digested a combination of factors of higher inflation concerns, China headwinds and supply-chain bottlenecks weighing on traders' sentiments. It is worth noting that the S&P 500 Futures is trading at 4,332.25, down 0.49% for the day.
On the other hand, the aussie gains some off late momentum after the NAB Business Confidence Index jumped 13 in September from a downwardly revised -6 in August, pointing to the highest reading since May. Nevertheless, the sour risk sentiment over the renewed China’s Everngrande default risk after it missed two more dollar bond interest payments limits the gains for the risk barometer AUD/USD.
As for now, traders await the US JOLTS Job Opening data to gauge the market sentiment.
AUD/USD additional levels
In opinion of FX Strategists at UOB Group, the downward momentum in EUR/USD seems to be losing some traction.
Key Quotes
24-hour view: “We highlighted yesterday that EUR ‘could edge higher but any advance is unlikely to break the resistance at 1.1605’. EUR subsequently rose to 1.1587 before easing off. The underlying tone has softened somewhat and EUR could drift lower. While EUR could dip below last week’s low at 1.1527, the major support at 1.1500 is not expected to come into the picture. Resistance is at 1.1565 followed by 1.1585.”
Next 1-3 weeks: “Our update from yesterday (11 Oct, spot at 1.1570) still stands. As highlighted, downward momentum is beginning to wane and the odds for EUR to move to 1.1500 have diminished. A break of 1.1605 (no change in ‘strong resistance’ level) would indicate that the weak phase that started about 2 weeks ago has run its course.”
- USD/INR edges higher for the second straight session on Tuesday.
- Double top formation near 75.60 stops bulls to march higher.
- Momentum oscillator holds onto the overbought with more upside potential.
USD/INR extends the previous session’s gains in the early European trading hours on Tuesday. The pair opened lower, however, recovered swiftly toward the session’s high. At the time of writing, USD/INR is trading at 75.50, up 0.15% for the day.
USD/INR daily chart
-637696096090005744.png)
On the daily chart, USD/INR is facing some price barrier near the yearly tops around 75.60. However, if the price sustains the intraday’s high, it could possibly breach the yearly highs. Having said that, the upside target above 75.60 could be the yearly highs of June 2020 at 76.51. The Moving Average Convergence Divergence (MACD) indicator holds onto the overbought zone. Any uptick in the MACD could strengthen the bullish scenario for the USD/INR pair.
Alternatively, on the lower side, the USD/INR bears could test the 75.25 horizontal support level. A daily close below the mentioned level would prompt bears to make the next move toward the previous day’s low of 74.99. Furthermore, the market participant would be looking for the 74.75 horizontal support level.
USD/INR additional levels
UK jobs report overview
The UK Office for National Statistics (ONS) is scheduled to release the September monthly employment details at 06:00 GMT this Tuesday. With employers reporting record-high job vacancies and the furlough scheme closing at the end of September, the number of people claiming unemployment-related benefits is expected to decline further. Meanwhile, the ILO Unemployment Rate is expected to edge lower to 4.5% during the three months that ended in August from 4.6% previous.
Further, the UK labor market report is expected to show that average weekly earnings, including bonuses, during the three months to August, decelerated sharply from 8.3% to 7%. Excluding bonuses, the wage growth is seen falling to 5.9% during the reported period from the 6.8% increase recorded previously.
How could the data affect GBP/USD?
Given that the Bank of England officials recently signalled about an imminent interest rate hike, a stronger than expected report should be enough to provide a fresh lift to the British pound. That said, the market reaction is likely to be limited amid the prevalent US dollar buying interest, bolstered by hawkish Fed expectations.
Conversely, a weaker reading might prompt aggressive selling and turn the GBP/USD pair vulnerable to extended the previous day's retracement slide from near two-week tops. This, in turn, suggest that the path of least resistance for the major is to the downside.
Meanwhile, Eren Sengezer, Editor at FXStreet, offered a brief technical outlook for the major: “GBP/USD continues to hold above the ascending trend line coming from late September. The 100-period SMA on the four-hour chart is reinforcing this line and forms strong support at 1.3620. As long as buyers continue to defend this level, the pair could target 1.3700 (psychological level, 200-period SMA on the four-hour chart).”
Eren also outlined important technical levels to trade the GBP/USD pair: “Although a daily close above this resistance is likely to open the door for additional gains toward 1.3750 (September 23 high), the Relative Strength Index (RSI) indicator on the four-hour chart could rise above 70. In that case, the pair might need to stage a technical correction before the next leg up. On the flip side, supports are located at 1.3620, 1.3560 (50-period SMA) and 1.3500 (psychological level).”
Key Notes
• GBP/USD Forecast: 1.3700 a reachable target ahead of UK jobs report
• GBP/USD Weekly Forecast: Ready to plunge again? US inflation, UK jobs and ongoing energy issues eyed
• GBP/USD bears take control below key hourly counter trendline
About UK jobs data
The Claimant Change released by the National Statistics presents the number of unemployed people in the UK. There is a tendency to influence the GBP volatility. Generally speaking, a rise in this indicator has negative implications for consumer spending which discourage economic growth. Generally, a high reading is seen as negative (or bearish) for the GBP, while a low reading is seen as positive (or bullish).
- GBP/JPY lacked any firm directional bias and remained confined in a range on Tuesday.
- The BoE rate hike signals continued lending some support to the sterling and the cross.
- The risk-off impulse benefitted the safe-haven JPY and capped any meaningful gains.
The GBP/JPY cross seesawed between tepid gains/minor losses through the Asian session and was last seen trading in the neutral territory, around the 154.00 mark.
A combination of diverging forces failed to provide any meaningful impetus to the GBP/JPY cross and led to a subdued/range-bound price action through the early part of the trading action on Tuesday. The British pound was supported by hawkish comments by the Bank of England (BoE) officials over the weekend, signalling an imminent interest rate.
Michael Saunders, one of the most hawkish members of the Monetary Policy Committee, suggested that investors were right to bring forward bets on rate hikes. Adding to this, the BoE Governor Andrew Bailey warned of a potentially very damaging period of inflation unless policymakers take action and continued acting as a tailwind for the sterling.
That said, the risk-off impulse underpinned the safe-haven Japanese yen and capped gains for the GBP/JPY cross. Worries that the recent surge in crude oil/energy prices will stoke inflation and derail the global economic recovery have been fueling fears about stagflation. This, in turn, tempered investors' appetite for perceived riskier assets, like equities.
Meanwhile, the range-bound price action comes on the back of the recent strong positive move to the highest level since June 25 and might still be categorized as a consolidation phase. Hence, any meaningful dip might still be seen as a buying opportunity and is more likely to remain limited ahead of Tuesday's release of the UK monthly employment details.
Technical levels to watch
- EUR/USD recovers initial losses on Tuesday in the Asian session.
- The US Dollar Index hovers at a one-year high near 94.40.
- Fed’s tapering, EU on higher energy prices, ECB mixed response weighs on the euro.
The EUR/USD pair has been tracking minor gains in the Asian session on Tuesday. The pair for the past two sessions moving in a range of 1.1540 and 1.1580 with limited price action. At the time of writing, EUR/USD is trading at 1.1558, up 0.05% for the day.
The US Dollar Index (DXY), which tracks the performance of the greenback against the six majors remains at a one-year high of around 94.40, which keeps EUR/USD gains limited.
The strong buying pressure in the greenback pushed EUR/USD below 1.1600 the lowest level since July 2020. Investors stay invested in the buck amid expectations for a tapering of Federal Reserve stimulus that could begin as soon as November and a possible interest rate hike in late 2022, despite disappointing NFP data released on Friday.
On the other hand, the shared currency remains depressed amid mounting inflationary concerns due to rising energy prices. Nevertheless, the European Central Bank (ECB) Chief Economist Philip Lane shrugged off the recent bout of inflation as a trigger for monetary policy. In addition to that, the ECB Governing Council member Yannis Stournaras dismissed the theory of rising energy prices and ultimately the rate hike in near future due to higher inflation. The dovish outlook of the central bank while Fed and BOE signals at probable rate hike weigh negatively on the prospects of the euro.
Meanwhile, China’s President Xi Jinping and the European Union (EU) Council President Charles Michel would be having a probable telephone conversation on October 15.
As for now, traders are waiting for the German Wholesale Price Index, Eurozone ZEW Economic Sentiment Index and US JOLTS Job Opening data to gain fresh trading impetus.
EUR/USD additional levels
During a press conference on Tuesday, the Bank of Korea (BOK) Governor Lee Ju-yeol said that the central bank is prepared to deploy FX market stabilizing measures if needed.
Additional quotes
Tuesday's rate decision was not unanimous
Board member Lim Ji-Won dissented to Tuesday's rate decision.
Board member Suh Young-Kyung dissented to Tuesday's rate decision.
Chances of stagflation currently low in South Korea.
Won's recent fall was faster than currency movements' of major countries.
Will closely monitor FX markets.
Related reads
- S. Korea President Moon: Need to focus on stabilizing consumer prices
- Bank of Korea keeps base rate unchanged at 0.75%
- Gold reversed an Asian session dip to the $1,750 area and refreshed daily tops in the last hour.
- The risk-off impulse was seen as a key factor that extended support to the safe-haven XAU/USD.
- Hawkish Fed expectations, sustained USD buying might cap any meaningful gains for the metal.
- Gold Price Forecast: On pause, but sellers outpace buyers
Gold attracted some dip-buying near the $1,750 area during the Asian session on Tuesday and climbed to fresh daily tops in the last hour. Currently hovering around the $1,759 region, the risk-off impulse in the markets was seen as a key factor that extended some support to the safe-haven XAU/USD. Worries that the recent surge in crude oil/energy prices will stoke inflation and derail the global economic recovery have been fueling fears about stagflation. This, in turn, tempered investors' appetite for perceived riskier assets, like equities, and benefitted traditional safe-haven assets. That said, prospects for an early policy tightening by the Fed should keep a lid on any further gains for the non-yielding yellow metal.
Despite Friday's disappointing headline NFP print, investors seem convinced that the Fed remains on track to begin rolling back its massive pandemic-era stimulus as soon as November. The markets have also started pricing in the possibility of an interest rate hike in 2022 amid concerns about a faster than expected rise in inflation. This was reinforced by elevated US Treasury bond yields, which continued underpinning the US dollar and might further act as a headwind for the dollar-denominated gold. In fact, the yield on the benchmark 10-year US government bond shot to 1.612%, or four-month tops on Friday as the market focus now shifts to this week's release of the latest US consumer inflation figures.
A stronger than expected CPI print will reaffirm hawkish Fed expectations and could bring further gains for the US currency. Apart from this, investors will further take cues from the FOMC monetary policy meeting minutes on Wednesday and the US monthly Retail Sales data on Friday. This will play a key role in influencing the greenback in the near term and provide a fresh directional impetus to gold. In the meantime, the broader market risk sentiment, along with the US bond yields and the USD price dynamics, will be looked upon for some short-term trading opportunities around the XAU/USD.
Technical levels to watch
From current levels, any subsequent move up is likely to confront stiff resistance near the $1,770 area. Some follow-through buying has the potential to lift gold prices back closer towards the $1,783-84 horizontal barrier. A sustained strength beyond should allow bulls to aim back to reclaim the $1,800 round-figure mark.
On the flip side, the $1,750 area now seems to have emerged as immediate strong support. A convincing break below might prompt aggressive technical selling and accelerate the slide towards September monthly swing lows, around the $1,722-21 region. Gold could eventually drop to test the $1,700 mark en-route August monthly swing lows, around the $1,687 region.
- WTI turns south after facing rejection above the $81 mark.
- Rising trendline hurdle at $81.28 on the 4H chart is a tough nut to crack for WTI bulls.
- RSI has eased from the overbought region but holds above 50.00, keeping bulls hopeful.
WTI (NYMEX futures) is consolidating near daily lows below the $80 mark so far this Tuesday, as the sellers take a breather after the run lower from seven-year highs in the overnight trades.
The retreat in oil prices comes on the heels of the reduced appetite for the riskier assets, as concerns over higher inflation amid surging energy prices weighed on the investors’ sentiment. The energy crunch threatens to negatively impact the post-pandemic global economic recovery.
From a short-term technical perspective, WTI turned south after facing rejection at rising trendline resistance at $81.28 on the four-hour chart.
With the latest leg down, WTI breached the $80 mark, remaining on track to test the upward-sloping 21-Simple Moving Average (SMA) at $78.84.
WTI: Four-hour chart
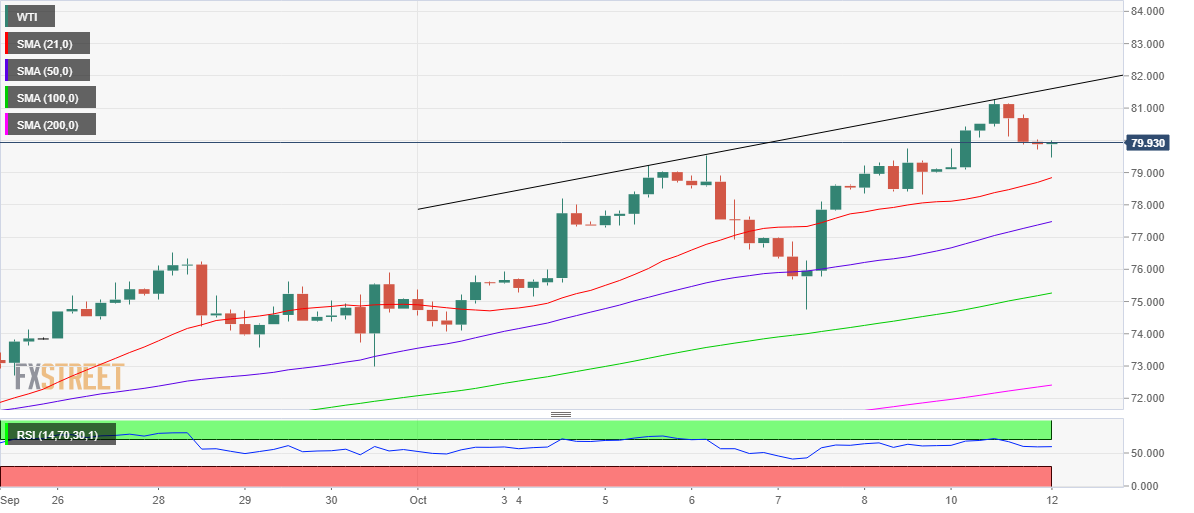
However, with the Relative Strength Index (RSI) easing from the overbought region, the bullish expectations have revived, as the leading indicator still holds well above the midline.
Therefore, bargain hunting could seep in at lower levels, taking WTI back above the $80 level, above which the aforesaid trendline hurdle could get retested.
Further up, buyers will continue to aim for the $82 round figure if the bullish momentum regains traction.
WTI: Additional levels to watch
- USD/JPY climbed to fresh multi-year tops on Tuesday amid sustained USD buying interest.
- The risk-off impulse benefitted the safe-haven JPY and capped the upside for the major.
- Bulls might now wait for a sustained strength beyond an ascending trend-channel hurdle.
The USD/JPY pair scaled higher for the fourth successive day and climbed to the highest level since December 2018 during the Asian session on Tuesday.
This also marked the fifth day of a positive move in the previous six and was sponsored by sustained US dollar buying, bolstered by expectations for an early policy tightening by the Fed. That said, the risk-off impulse in the markets underpinned the safe-haven Japanese yen and kept a lid on any further gains for the USD/JPY pair, at least for now.
Looking at the technical picture, the recent strong bullish momentum paused just ahead of a resistance marked by the top boundary of a near three-week-old ascending trend channel. Overbought RSI on short-term charts seemed to be the only factor that held traders from placing fresh bullish bets, though any meaningful corrective pullback seems unlikely.
From current levels, the trend-channel hurdle, around the 113.50-60 region, could act as a headwind for the USD/JPY pair. A convincing breakthrough will be seen as a fresh trigger for bullish traders and set the stage for additional gains. The pair might then accelerate the move and aim to reclaim the 114.00 mark for the first time since November 2018.
On the flip side, the 113.00 round-figure mark now seems to protect the immediate strong support. Sustained weakness below might prompt some technical selling. That said, any subsequent decline might still be seen as a buying opportunity near the 112.25-20 horizontal support. This, in turn, should help limit the downside near the 112.00 round figure.
USD/JPY 4-hour chart
-637696028169839318.png)
Technical levels to watch
Analysts at Goldman Sachs highlight three main reasons for the recent underperformance of the euro against the US dollar.
Key quotes
“EUR/USD is down 1.6% against the majors since early September.”
“EUR/USD is just off fresh year-to-date lows.”
“Over that period, the single currency has underperformed all of our models, where the fundamentals point to some deterioration but not to this degree.”
“We think this underperformance is likely a combination of lower real rate differentials, equity hedging flows and a relative downgrade of European growth.”
| Raw materials | Closed | Change, % |
|---|---|---|
| Brent | 83.76 | 1.11 |
| Silver | 22.551 | -0.54 |
| Gold | 1753.918 | -0.17 |
| Palladium | 2104.04 | -0.87 |
South Korean President Moon Jae-in said in a statement on Tuesday, his government needs to focus on stabilizing consumer prices.
His comments come after the Bank of Korea (BOK) kept the key rates unchanged at 0.75% after the August rate hike.
The central bank said that the country’s inflation is expected to run at the mid-2% level this year, adding that they will monitor growth and inflation.
Market reaction
USD/KRW sits at 15-month tops at 1,200.55 on BOK’s status-quo, benefiting from the advance in the US dollar amid the risk-off mood.
- Silver extended its range-bound price action and remained confined in a narrow band.
- The technical setup warrants some caution before placing aggressive directional bets.
Silver lacked any firm directional bias and remained confined in a narrow trading band, around mid-$22.00s through the Asian session on Tuesday.
Looking at the broader picture, the XAG/USD – barring the post-NFP spike to over three-week tops – has been oscillating in a familiar range since the beginning of the last week. The range-bound price action constitutes the formation of a rectangle on short-term charts, pointing to indecision over the commodity's near-term trajectory.
Moreover, technical indicators on the daily chart – though have managed to recover from the bearish territory – are yet to gain any meaningful traction. Adding to this, oscillators on the 4-hour chart have been hovering in the neutral territory. This makes it prudent to wait for a sustained break in either direction before placing aggressive bets.
Meanwhile, the top boundary of the mentioned trading range coincides with the 38.2% Fibonacci level of the $24.87-$21.42 downfall and should act as a pivotal point for intraday traders. The next relevant hurdle is pegged near the $23.15-20 confluence region, comprising of 200-period SMA on the 4-hour chart and the 50% Fibo. touched last Friday.
Some follow-through buying will be seen as a fresh trigger for bullish traders and set the stage for a further near-term appreciating move. The XAG/USD might then accelerate the momentum towards the 61.8% Fibo. level, around the $23.55-60 region, before eventually aiming back to reclaim the $24.00 mark for the first time since September 10.
On the flip side, the 23.6% Fibo. level, around the $22.25 area, coinciding with the lower end of the trading range, should protect the immediate downside. This is followed by the $22.00 round-figure mark, which if broken decisively might turn the XAG/USD vulnerable to slide back towards challenging monthly swing lows, around the $21.45-40 region.
Silver 4-hour chart
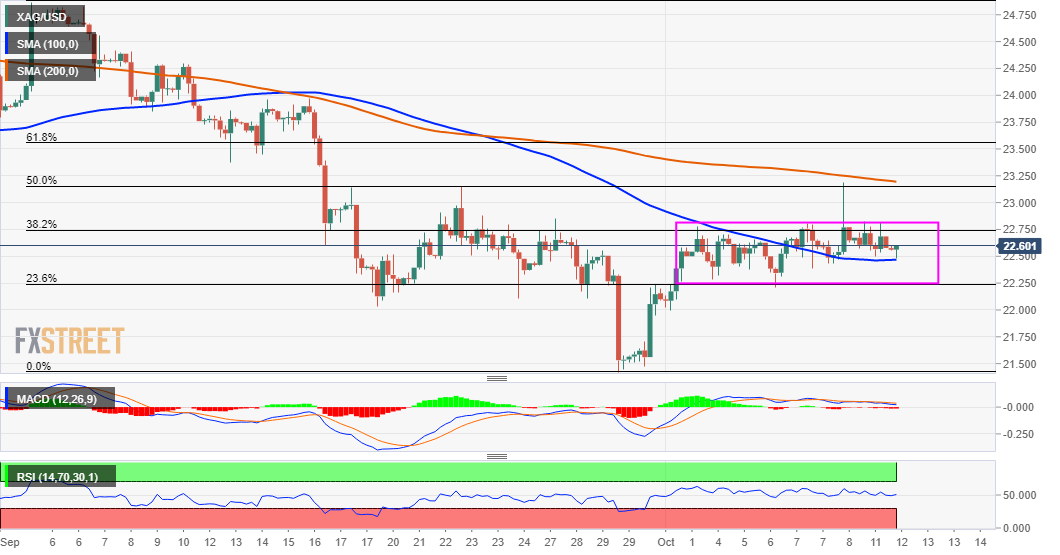
Technical levels to watch
Chinese property firms' bonds were hit with another wrecking ball this week as Evergrande missed its third round of bond payments in as many weeks.
The Evergrande contagion has continued to spread in markets and we are seeing risk-off on Tuesday in Asia following a negative close on Wall Street, likely owing to the Wall Street Journal that flagged the Central Commission for Discipline Inspection investigation into banks.
More on this here: 'Xi Thought' and its impact on the corporate West
High-yield Chinese bond markets have been in trouble again due to the fears about fast-spreading contagion in the $5 trillion sector, which drives a sizable chunk of the Chinese economy, continued to savage sentiment.
''If you cut off funding to a highly leveraged sector, and it sees sales collapse too, bad things tend to happen to liquidity,'' analysts at Rabobank said in a note today.
''The FTSE Chinese High-Yield index has now tumbled to 275.4, the lowest since late 2015, when back in May it was at 375.4, and looks like a falling knife. Chinese government bond yields didn’t benefit, rising slightly, and more so down the curve.''
- USD/CAD accumulates mild gains on Tuesday in the Asian session.
- Crude oil prices subsidize from the higher levels weigh on the loonie.
- The US Dollar Index remains stronger at 94.40 with fresh daily gains.
The USD/CAD pair remains muted on Tuesday. After testing the monthly low around 1.2450 in the previous two-session, the pair managed to move higher above 1.2490. At the time of writing, USD/CAD is trading at 1.2495, up 0.09% for the day.
The appreciative move in the US dollar pushes USD/CAD higher. The US Dollar Index (DXY), which measures the performance of the greenback against its six major rivals, trades near yearly highs at 94.40, up 0.05%.
Investors digested the disappointing NFP data on Friday and now brace for Fed tapering as soon as November amid rising inflation concerns. Crude oil prices soared to seven-year highs fueling the pricing pressure across the globe.
On the other hand, the loonie pares some of its previous gains as WTI, a major Canadian export, retreats from its seven-year high above $82.00. The better-than-expected Canadian employment data supported the prospects of another cut in the Bank of Canada (BOC) asset-buying scheme. The Canadian economy added 157K jobs in September.
As for now, traders are waiting for the US JOLTS Job Opening to take fresh trading impetus.
USD/CAD additional levels
S&P Global Platts said in its latest report many OPEC members may not have reached their planned increased quota in the month of September.
Key takeaways
“The coalition is producing far below what it said it would.”
“19 members with production quotas under the OPEC+ supply accord was a combined 570,000 b/d below their allocations for the month, bringing compliance to 111.5%.”
“The shortfalls have contributed to what many analysts say is a tight market.”
Market reaction
WTI is unimpressed by the above report, as it extends its correction from seven-year highs of $82.17 to now trade at $80.03, down 0.62% on the day.
- USD/INR remains bullish on the longer-term time frames.
- USD/INR broke monthly resistance and bulls make higher daily high.
- There are prospects of a mean reversion from daily resistance.
As per the analysis at the start of the week, USD/INR has been making headway deeper into the 75 areas and on the approach to the 21 April highs of 75.56. So far, the fresh high on the charts has been 75.50. However, there are now prospects of a downside correction from daily resistance.
The following illustrates the price action in a top-down analysis.
USD/INR monthly chart
-637695990169413179.png)
The price is breaking the monthly trendline resistance for the month of October which leaves bullish prospects to follow. 78.95 comes as the -272% Fibonacci retracement of the monthly correction's range for which bulls can target.
USD/INR daily target
-637695991843514245.png)
However, from a daily perspective, the price is reaching into daily resistance and we are yet to see a retest of the trendline following the breakout. A 61.8% Fib retracement meets prior resistance territory that would be expected to act as a support between there and the 50% mean reversion target. This area falls in at 74.80/75.00.
In recent trade today, the People’s Bank of China (PBOC) set the yuan (CNY) at 6.4447 vs the prev fix of 6.4479 and the previous close of 6.4513.
About the fix
China maintains strict control of the yuan’s rate on the mainland.
The onshore yuan (CNY) differs from the offshore one (CNH) in trading restrictions, this last one is not as tightly controlled.
Each morning, the People’s Bank of China (PBOC) sets a so-called daily midpoint fix, based on the yuan’s previous day closing level and quotations taken from the inter-bank dealer.
The S.Korea central bank kept the base rate unchanged at 0.75% vs a Reuters poll of 0.75%, taking a breather after its first rate hike in nearly three years in August, as a resurgence in COVID-19 cases also clouded the short-term outlook.
''The Bank of Korea (BOK) held the benchmark interest rate unchanged at 0.75%, as expected by 29 of 31 analysts polled by Reuters.
The BOK is seeking to keep the economic recovery on track, while trying to contain a surge in private-sector debt, a red-hot property market and above-target inflation,'' Reuters reported.
- USD/CHF continues to consolidate gains on Tuesday in the Asian session.
- Additional gains for pair if price decisively breaks 0.9300.
- MACD holds onto the overbought zone with receding upside momentum.
USD/CHF trades cautiously on Tuesday in the initial Asian trading hours. The pair confides in a narrow trade band of less than 10-pips movement. At the time of writing, USD/CHF is trading at 0.9277, down 0.01% for the day.
USD/CHF daily chart
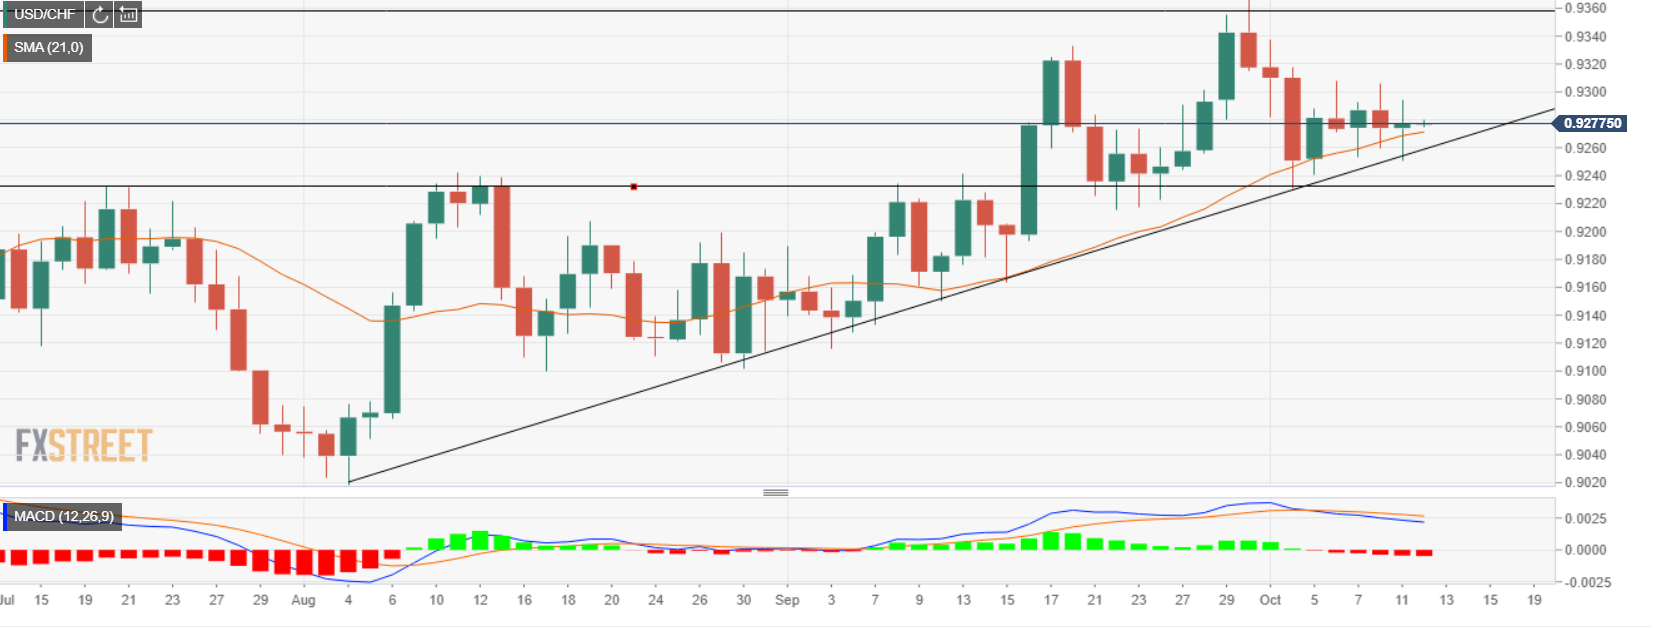
On the daily chart, after testing the five-month high near 0.9368, the USD/CHF pair failed to preserve the momentum and touched the intraday low of 0.9230 in the previous week. Now, the pair is hovering in a limiting trading range. The sluggish price movement in today’s session suggests indecisiveness among traders. Furthermore, the price trades above the 21-day Simple Moving Average (SMA) at 0.9270.
Having said that, If the price sustains the intraday high, it could immediately test the psychological 0.9300 mark. The Moving Average Convergence Divergence (MACD) trades in the overbought zone. Any uptick in the MACD would encourage the USD/CHF bulls to take over the high made on October 1 at 0.9337. Furthermore, the spot would likely testify to the 0.9360 horizontal resistance level.
Alternatively, a break beneath the 21-day SMA could reverse the trade direction with the previous day’s low at 0.9250 as the first downside target. A daily close below the ascending trendline from the lows of 0.9018 made on August,4 would open the gates for the 0.9235 horizontal support level followed by the September 16 low of 0.9193.
USD/CHF additional levels
- AUD/USD is testing a critical area of daily resistance and hourly support.
- Bulls need to clear 0.7380 for a look-in beyond there towards daily highs.
AUD/USD bulls are trying to establish a base on the hourly time frame for a run towards daily resistances. The following illustrates the market structure and prospects for higher levels so long as hourly support holds.
AUD/USD, 1-hour chart
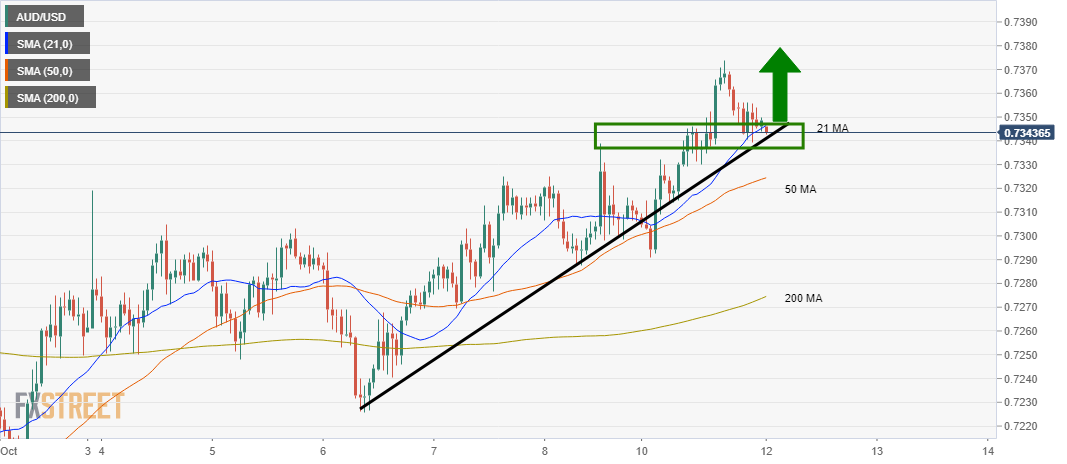
The price is consolidating at a critical area of support on the hourly chart where horizontal support meets the dynamic trendline support. The price is in the bullish territory while trending above the 200 moving average and the divergence between the 21 and 50 is encouraging also.
AUD/USD, daily chart
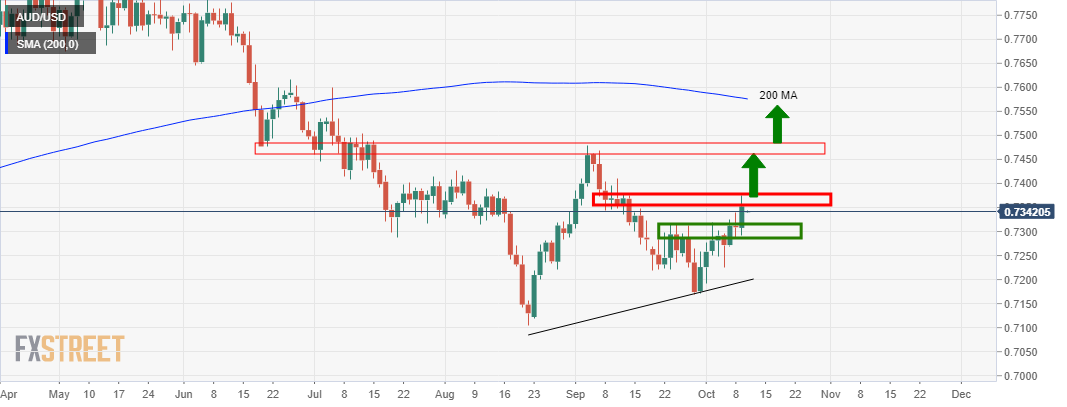
However, from a daily perspective, there is solid resistance near the 0.7380/0.7400 area. If this gives, then the bulls will likely be in the running for a test of the previous daily highs ahead of the 200-day moving average.
- GBP/USD edges lower on Tuesday in the early Asian session.
- The US Dollar Index remains strong near 94.40 with 0.32% gains.
- BoE’s inflation stance and Brexit concerns pull the sterling lower against the USD.
The GBP/USD pair extends declines on Tuesday. The pair touched a high of 1.3674 in the previous session but failed to preserve the momentum. At the time of writing, GBP/USD is trading at 1.3591, down 0.03% for the day.
The US Dollar Index (USD), which tracks the performance of the greenback against its six major rivals, trades near 94.40 near its highest level since September, 2020. Investors stay invested in the greenback on higher inflationary worries over rising energy prices and Fed’s tapering expectations as soon as November.
On the other hand, the British pound continues with its struggle on fear of inflation and interest rate hike bets. The Bank of England (BOE) and members of the Monetary Policy Committee (MPC) suggested a reversal in last year’s interest rate cuts at any point in the near future though unlikely before the early months of 2022 to neutralise the risk of inflation exceeding above the 2% BOE’s target. In addition to that, the UK Brexit Minister said changes would be required in the protocol that deals with Northern Ireland, as talks between Britain and the European Union (EU) continue this week. The EU already said it won’t renegotiate the agreement, raising the tension between the two countries.
Meanwhile, the British Retail Consortium (BRC) Retail Sales fell 0.6% in September on yearly basis. The fuel shortage held responsible for the weaker performance.
As for now, traders keep their focus on the UK’s Claimant Count Change, ILO Unemployment Rate, US JOLTS Job Opening data to gauge market sentiment.
GBP/USD additional levels
| Time | Country | Event | Period | Previous value | Forecast |
|---|---|---|---|---|---|
| 00:30 (GMT) | Australia | National Australia Bank's Business Confidence | September | -5 | |
| 06:00 (GMT) | United Kingdom | Average earnings ex bonuses, 3 m/y | August | 6.8% | 5.9% |
| 06:00 (GMT) | United Kingdom | Average Earnings, 3m/y | August | 8.3% | 7% |
| 06:00 (GMT) | United Kingdom | ILO Unemployment Rate | August | 4.6% | 4.5% |
| 06:00 (GMT) | United Kingdom | Claimant count | September | -58.6 | |
| 09:00 (GMT) | Eurozone | ZEW Economic Sentiment | October | 31.1 | |
| 09:00 (GMT) | Germany | ZEW Survey - Economic Sentiment | October | 26.5 | 24 |
| 14:00 (GMT) | U.S. | JOLTs Job Openings | August | 10.934 | 10.925 |
| 21:45 (GMT) | New Zealand | Food Prices Index, y/y | September | 2.4% | |
| 23:50 (GMT) | Japan | Core Machinery Orders, y/y | August | 11.1% | 14.7% |
| 23:50 (GMT) | Japan | Core Machinery Orders | August | 0.9% | 1.7% |
| Pare | Closed | Change, % |
|---|---|---|
| AUDUSD | 0.73474 | 0.63 |
| EURJPY | 130.903 | 0.81 |
| EURUSD | 1.1551 | -0.16 |
| GBPJPY | 154.035 | 0.81 |
| GBPUSD | 1.35933 | -0.16 |
| NZDUSD | 0.6933 | 0.27 |
| USDCAD | 1.24765 | 0.04 |
| USDCHF | 0.92706 | 0.1 |
| USDJPY | 113.304 | 0.97 |


© 2000-2026. All rights reserved.
This site is managed by Teletrade D.J. LLC 2351 LLC 2022 (Euro House, Richmond Hill Road, Kingstown, VC0100, St. Vincent and the Grenadines).
The information on this website is for informational purposes only and does not constitute any investment advice.
The company does not serve or provide services to customers who are residents of the US, Canada, Iran, The Democratic People's Republic of Korea, Yemen and FATF blacklisted countries.
Making transactions on financial markets with marginal financial instruments opens up wide possibilities and allows investors who are willing to take risks to earn high profits, carrying a potentially high risk of losses at the same time. Therefore you should responsibly approach the issue of choosing the appropriate investment strategy, taking the available resources into account, before starting trading.
Use of the information: full or partial use of materials from this website must always be referenced to TeleTrade as the source of information. Use of the materials on the Internet must be accompanied by a hyperlink to teletrade.org. Automatic import of materials and information from this website is prohibited.
Please contact our PR department if you have any questions or need assistance at pr@teletrade.global.
transfers