- Analytics
- News and Tools
- Market News
CFD Markets News and Forecasts — 15-03-2023
- USD/CHF eases from the one-week high to pare the previous day’s heavy gains.
- Nearly overbought RSI favors pullback from 100-SMA, six-week-old previous support line adds to the upside filters.
- 200-SMA holds the key to the further downside; bullish MACD signals also test Swiss currency pair sellers.
USD/CHF drops to 0.9313 as bulls take a breather during active trading hours of early Thursday, following a stellar run-up during the previous day.
In doing so, the Swiss currency pair retreats from the 100-bar Simple Moving Average (SMA) amid the overbought RSI conditions. Adding strength to the latest pullback could be the global policymakers’ recent announcements to tame the financial market risks, especially after the Credit Suisse turmoil.
Also read: Forex Today: Dollar and Yen jump as panic takes over markets
It’s worth noting, however, that the bullish MACD signals challenge the USD/CHF bears, which in turn highlights the importance of the 200-SMA level of 0.9270 as the key support. That said, the pair sellers also need validation from the 0.9300 immediate support.
In a case where USD/CHF breaks the 200-SMA support, the odds of witnessing a slump towards the 50% and 61.8% Fibonacci retracement levels of February-March run-up, respectively near .9250 and 0.9200, can’t be ruled out.
Alternatively, the 100-SMA and the previous support line from early February, close to 0.9325 and 0.9350 in that order, restrict short-term USD/CHF upside.
Following that, a run-up towards crossing the double tops near 0.9435-40 appears more likely.
To sum up, USD/CHF is expected to pare recent gains but the downside room seems limited.
USD/CHF: Four-hour chart
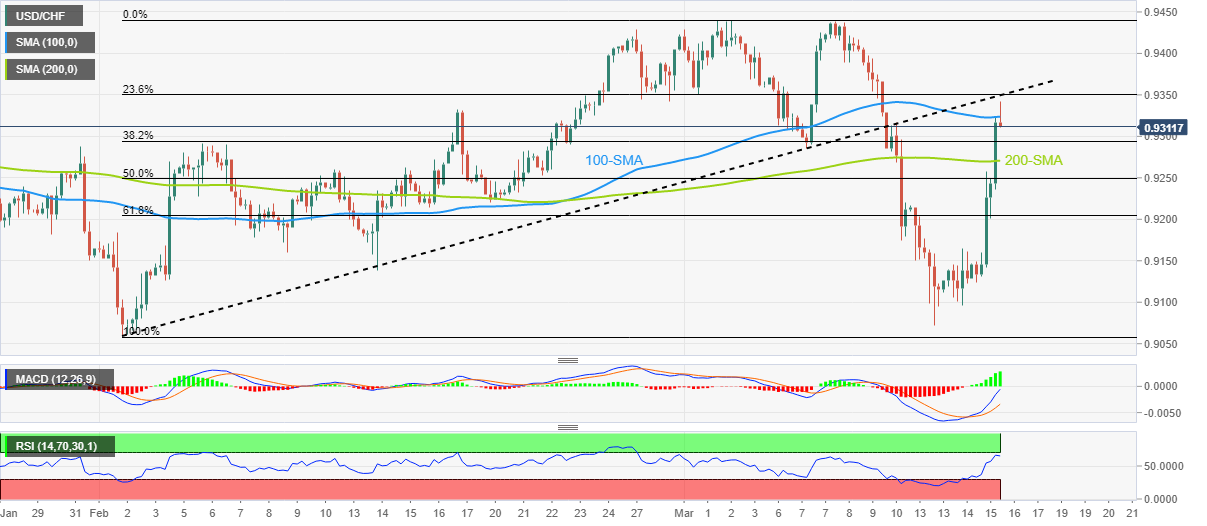
Trend: Limited downside expected
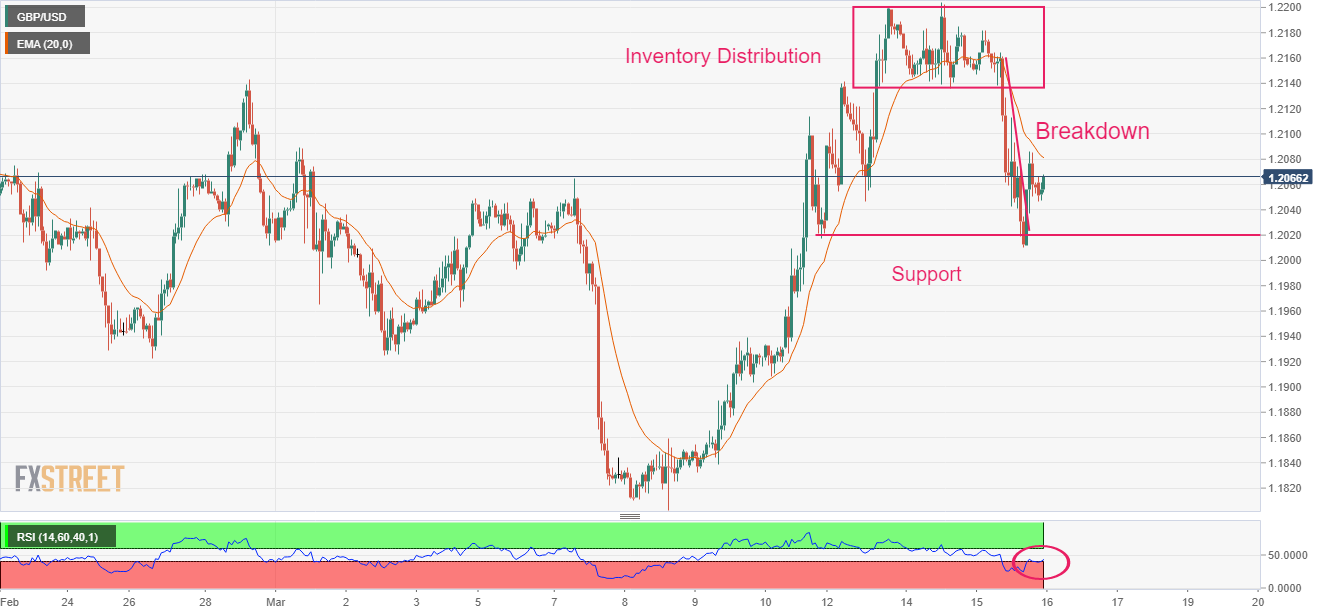
- GBP/USD has delivered a breakdown of the Inventory Distribution formed in the 1.2140-1.2200 range.
- The 20-period EMA at 1.2081 will act as a barricade for the Pound Sterling.
- The BoE officials were in talks with counterparts, as they all raced to assess the potential impact of the Credit Suisse fiasco.
The GBP/USD pair has attempted a recovery move from the psychological support of 1.2000 in the early Asian session. The Cable witnessed a sell-off on Wednesday after reports citing internal ‘materialistic weaknesses’ in Credit Suisse spooked market sentiment. The release of the financial budget by United Kingdom Finance Minister (FM) Jeremy Hunt failed to provide a cushion to the Pound Sterling.
The US Dollar Index (DXY) has corrected after challenging the critical resistance of 105.00 as the release of weak United States Retail Sales and lower Producer Price Index (PPI) figures confirmed that the US inflation is meaningfully declining. This eased hawkish Federal Reserve (Fed) bets dramatically.
Meanwhile, Bank of England (BoE) officials were in talks with counterparts, as they all raced to assess the potential impact of the problems at Credit Suisse, a ‘systemically important’ institution that is enmeshed in the global financial system, as reported by the Telegraph. It further added that experts predicted that it will require a bailout to prevent a collapse that would rock banks and pension funds around the world.
On an hourly scale, GBP/USD has witnessed a breakdown after an Inventory Distribution in which inventory is transferred from institutional investors to the retail participants. The Cable has sensed a cushion plotted near 1.2020.
Going forward, the 20-period Exponential Moving Average (EMA) at 1.2081 will act as a barricade for the Pound Sterling.
The Relative Strength Index (RSI) (14) has climbed into the 40.00-60.00 range from the bearish range of 20.00-40.00. Usually, a power-pack action is followed by a volatility squeeze.
Should the Cable break below the psychological support of 1.2000, US Dollar bulls would drag the asset toward February 27 low at 1.1922, followed by March 08 low at 1.1803.
Alternatively, a move above February 21 high of around 1.2140 will drive the Cable toward March 14 high at 1.2203. A breach above the latter would expose the asset to the round-level resistance at 1.2300.
GBP/USD hourly chart
February month employment statistics from the Australian Bureau of Statistics, up for publishing at 00:30 GMT on Thursday, will be the immediate catalyst for the AUD/USD pair traders.
Market consensus suggests that the headline Unemployment Rate may ease to 3.6% on a seasonally adjusted basis versus the 3.7% prior whereas Employment Change could rise by 48.5K versus the previous contraction of 11.5K. Further, the Participation Rate is expected to improve to 66.6% versus 66.5% prior level.
Adding importance to the 00:30 GMT is the Reserve Bank of Australia (RBA) Bulletin for the fourth quarter (Q4).
Considering the RBA policymakers’ struggle to defend the hawkish bias, as well as the fresh banking crisis and easing inflation clues, today’s Aussie jobs report become crucial for the AUD/USD pair traders.
Ahead of the event, FXStreet’s Valeria Bednarik mentioned
An upbeat report could help it recover some ground, although the sour sentiment extends throughout the different sessions, the bounce could be short-lived, and the pair would resume its decline once the dust settles. A strong static resistance area comes in at around 0.6710, where the pair topped a couple of times this week.
How could the data affect AUD/USD?
AUD/USD licks its wounds around 0.6620 after falling the most in a week drowned by the Credit Suisse turmoil the previous day. The Aussie pair’s latest moves could be linked to the major policymakers’ rush to placate the financial market fears.
Although the pre-data anxiety probes AUD/USD bears amid hopes of upbeat Aussie data, the risk barometer pair is likely to remain depressed, after showing an initial reaction to the actual outcome, unless witnessing too optimistic Aussie employment numbers. It should be noted that the RBA Bulletin must avoid dovish words to defend the pair’s latest corrective bounce.
The reason for the AUD/USD pair’s likely weakness could be linked to comparatively more hawkish Federal Reserve (Fed) bets despite the latest financial market fears, as well as the broad weakness in the pair due to its risk-barometer status.
Technically, a U-turn from the 1.5-month-old resistance line, around 0.6670 by the press time, keeps the AUD/USD bears hopeful of revisiting the monthly low of 0.6564.
Key Notes
AUD/USD struggles to extend recovery above 0.6620 ahead of Australian Employment
Australian Employment Preview: Job creation to add pressure on the RBA
AUD/USD Forecast: Risk aversion hits the Aussie; Australian employment numbers unlikely to help
About the Employment Change
The Employment Change released by the Australian Bureau of Statistics is a measure of the change in the number of employed people in Australia. Generally speaking, a rise in this indicator has positive implications for consumer spending which stimulates economic growth. Therefore, a high reading is seen as positive (or bullish) for the AUD, while a low reading is seen as negative (or bearish).
About the Unemployment Rate
The Unemployment Rate released by the Australian Bureau of Statistics is the number of unemployed workers divided by the total civilian labor force. If the rate hikes, indicates a lack of expansion within the Australian labor market. As a result, a rise leads to weaken the Australian economy. A decrease of the figure is seen as positive (or bullish) for the AUD, while an increase is seen as negative (or bearish).
- Credit Suisse-led oil weakness sent USD/CAD to the 1.3800 level.
- WTI dips below the $70 mark as financial turmoil weighs on risk assets.
- Rumor around some emergency meetings among central banks.
USD/CAD took a wild ride on Wednesday due to oil weakness. The pair touched the 1.3800 resistance as renewed price pressure affected oil prices. It all started with some floating rumors about Credit Suisse bank, which was perceived as a contagion effect following Silicon Valley Bank's (SVB) fallout. There were some threats attributed to Credit Suisse that might have been tangled up with SVB's financial crisis and could be the next liquidity victim, although all allegations have been denied by Credit Suisse's CEO. Later on, the Swiss banking regulator intervened and committed to providing liquidity solutions if required.
The aforementioned situation triggered a fresh wave of sell-offs among risky assets, and oil prices were affected the most. West Texas Intermediate (WTI) price fell below the $70 mark as panic was triggered among investors. The falling oil prices have been signaling "something to break" on surging borrowing costs since cracks began to appear in financial systems.
A corrective downturn in oil prices that started earlier this week has weakened the Canadian Dollar and given a boost to USD/CAD. Although falling US Treasury yields are keeping a lid on any appreciation in the US Dollar, the pair is mainly driven by oil prices rather than anything else. Since the Bank of Canada took a pause on the rate hiking cycle, USD/CAD is more likely to be driven by either US Dollar dynamics or oil's story.
Meanwhile, the US released its Retail Sales figures and Producer Price Index (PPI) data for February on Wednesday. The Retail Sales came in at a relatively massive downbeat; the MoM came in at -0.4% from the previous 3.2%, and the Control Group came in at 0.5% from the previous 2.3%. The PPI data showed some relief signs: the MoM reading came in at -0.1% from the prior 0.3%, and the YoY reading came in at 4.6% from the prior 5.7%.
Levels to watch
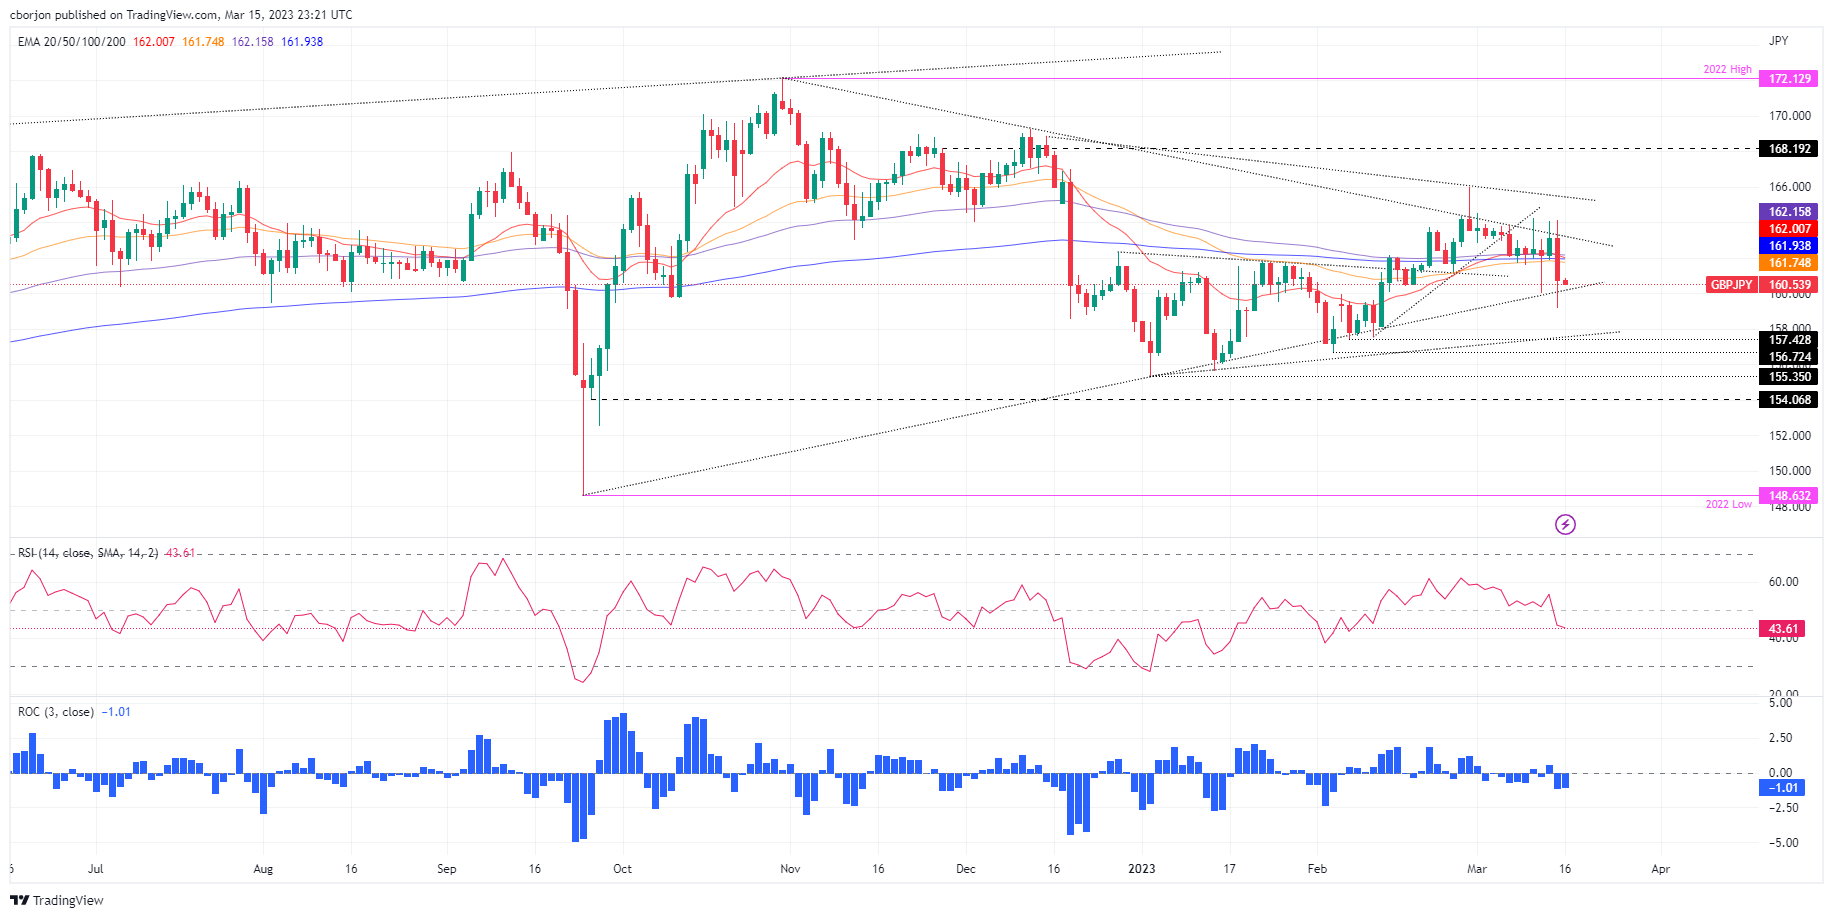
- GBP/JPY registered a bearish engulfing candle pattern but jumped off the weekly lows below 160.00.
- If the pair aims upwards, the GBP/JPY will face solid resistance around 161.70-90.
- Conversely, a GBP/JPY’s fall below 160.00 could pave the way toward 159.00.
GBP/JPY collapsed on Wednesday and lost 1.43% due to a deterioration in market sentiment, sponsored by fears of a banking contagion after regulators seized two US banks. In the Europan session, Credit Suisse (CS) sell-off sent its CDS skyrocketing as odds for a default increased. However, Swiss authorities stepped in and cushioned the bank’s fall. Therefore, the GBP/JPY exchanges hands at 160.50, gaining a minuscule 0.03% in the Asian session.
GBP/JPY Price action
After consolidating around the confluence of the 20, 50, 100, and 200-day Exponential Moving Averages (EMAs), the GBP/JPY distance from them, and edged towards a fresh 4-week low at 159.20. However, the GBP/JPY gained some traction late in the session and closed the day at 160.77.
Oscillators like the Relative Strength Index (RSI) are in bearish territory. However, the Rate of Change (RoC), showed that selling pressure eased toward the end of the trading day. Therefore, the path of least resistance is sideways.
Upwards, the GBP/JPY first resistance would be the 161.00 figure. Once the pair surges above that area, the confluence of the daily EMAs would be exposed, led by the 50 and 200-day EMAs, each at 161.75 and 161.94, respectively. Once cleared, the next stop would be the 20-day EMA at 162.00.
For a bearish continuation, the GBP/JPY needs to clear the March 13 low at 160.04 before posing a threat at the March 15 low at 159.20. Below that area looms the 159.00 figure.
GBP/JPY Daily chart
GBP/JPY Technical levels
The Bank of England was holding emergency talks with international counterparts last night amid rising concerns as the crisis deepens in Swiss bank Credit Suisse Group AG, the Telegraph reported on Wednesday per Reuters.
Key quotes
Bank of England officials were in talks with counterparts, as they all raced to assess the potential impact of the problems at Credit Suisse, a ‘systemically important’ institution that is enmeshed in the global financial system.
Experts predicted that it will require a bailout to prevent a collapse that would rock banks and pension funds around the world.
The crisis was in contrast to the improving picture that the Chancellor attempted to paint as he unveiled forecasts from the Office for Budget Responsibility that the UK will avoid a recession this year.
The Chancellor said the brighter outlook was “proving the doubters wrong” as the latest projections showed inflation falling to 2.9 per cent by the end of the year.
Mr Hunt said the economy was now “on the right track” after the Office for Budget Responsibility (OBR), the government's tax and spending watchdog, said any downturn would be “shorter and shallower” than predicted just four months ago.
However, senior economists warned that the collapse of Credit Suisse had the potential to upend a recovery from the twin shocks of pandemic and war in Ukraine.
GBP/USD licks its wounds
GBP/USD picks up bids to 1.2065 to pare the biggest daily loss in a week during Thursday’s inactive session.
Also read: Forex Today: Dollar and Yen jump as panic takes over markets
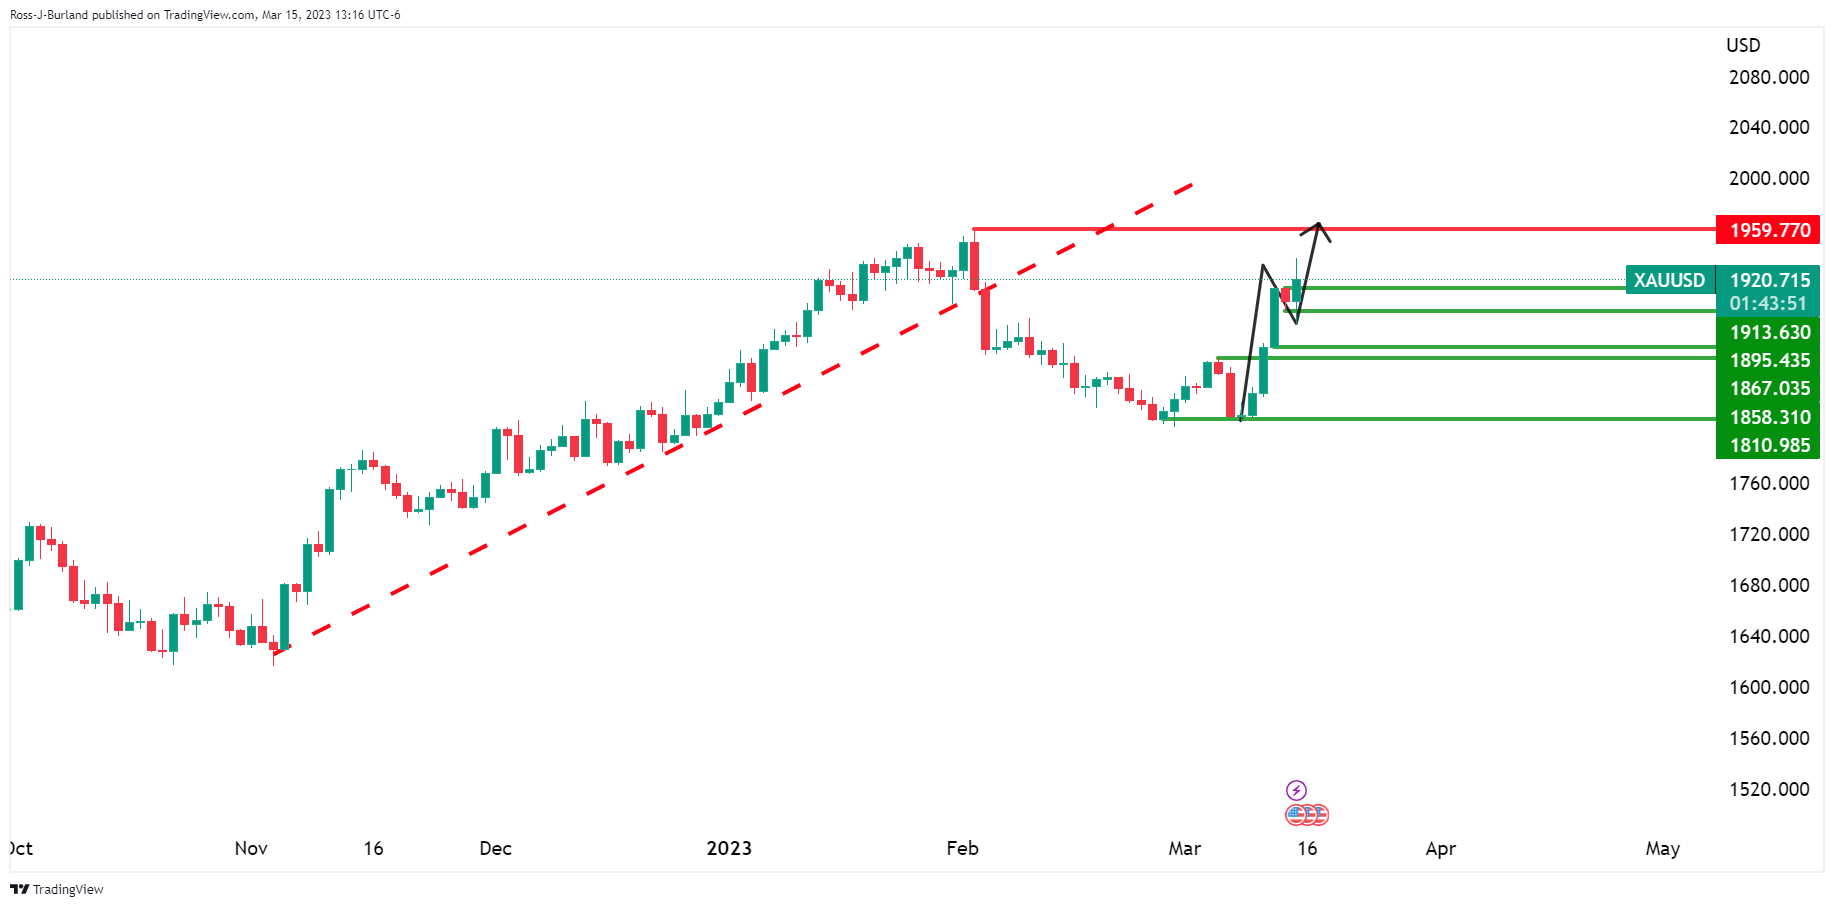
- Gold price picks up bids to reverse the day-end pullback from six-week high.
- Risk aversion underpins XAU/USD price as banking crisis reaches Europe with Credit Suisse in target.
- United States 10-year Treasury bond yields drop the most in four months, two-year counterpart renews six-month low.
- US Dollar’s gains fail to weigh on Gold price amid mixed United States statistics.
Gold price (XAU/USD) buyers flex muscles around $1,920, after refreshing the highest levels in 1.5 months during a stellar show of Credit Suisse (CS) inflicted risk aversion the previous day. The risk profile deteriorates more as the CS episode follows the latest fallouts of Silicon Valley Bank (SVB) and Signature Bank. Given the precious metal’s haven status, the Gold buyers even ignored the jump in the US Dollar prices amid a broad downward move in the United States Treasury bond yields.
Credit Suisse drama propels Gold price via United States Treasury bond yields
With the United States banking crisis reaching the old continent Europe, via a G-SIB – a global systemically important bank, namely Credit Suisse (CS), global market players fear the return of the 2008 financial crisis and rushed for risk-safety. The risk-aversion drowned the US Treasury bond yields but propelled the Gold price, as well as the US Dollar Index (DXY).
The Saudi National Bank’s rejection of infusing more funds into Credit Suisse propelled the key European bank’s Credit Default Swaps (CDS) and triggered the crisis for the financial markets on Wednesday. On the same line was the news that the European Central Bank (ECB) officials contacted banks to ask about exposures to Credit Suisse, which in turn fanned the risk-off mood.
That said, the US 10-year Treasury bond yields dropped the most in four months before bouncing off a four-month low to 3.46% at the latest. On the same line, the US two-year bond coupons refreshed a six-month low before ending the volatile Wednesday near 3.89%.
Elsewhere, the US Dollar Index (DXY) bounced off the 50-DMA to portray the biggest daily gains in a week before ending the day at around 104.75.
It should be noted that the European stock market closed in the red but Wall Street closed mixed as the Swiss National Bank (SNB) stepped forward to help CS.
As a result, the yellow metal rallied to refresh the multi-day high earlier on Wednesday before the SNB news allowed XAU/USD bulls to take a breather.
US data fails to impress XAU/USD traders
Amid the broad fears surrounding Credit Suisse, as well as the woes of another financial crisis, traders paid little heed to the United States data.
US Retail Sales dropped to -0.4% in February versus -0.3% expected and upwardly revised 3.2% prior while the Producer Price Index (PPI) slide to 4.6% YoY from 5.7% in January and 5.6% market forecasts. Further, NY Empire State Manufacturing Index dropped to -24.6 for March compared to analysts’ estimations of -8.0 and -5.8 prior.
Even so, global rating giant Moody’s expects the Federal Open Market Committee (FOMC) to raise the federal funds rate by 25 basis points at its March 22 meeting, per Reuters.
ECB, Risk catalysts are the key
Moving on, the second-tier data surrounding employment and activities from the United States may entertain the Gold traders. However, major attention will be given to the headlines surrounding Credit Suisse and the market’s fears of another financial crisis, which in turn could keep the XAU/USD firmer. Also important to watch will be the European Central Bank’s (ECB) action considering the latest banking fiasco in the bloc.
Also read: ECB Preview: Set for 50 bps rate hike, Lagarde holds the key
Gold technical analysis
Having bounced off the 100-DMA in the last week, the Gold price crossed the 50-DMA hurdle on Monday. The follow-on corrective pullback couldn’t last long and the fresh recovery rose past the two-month-old horizontal hurdle surrounding $1,920 which holds the key for the metal’s run-up towards the Year-To-Date (YTD) high of near $1,960.
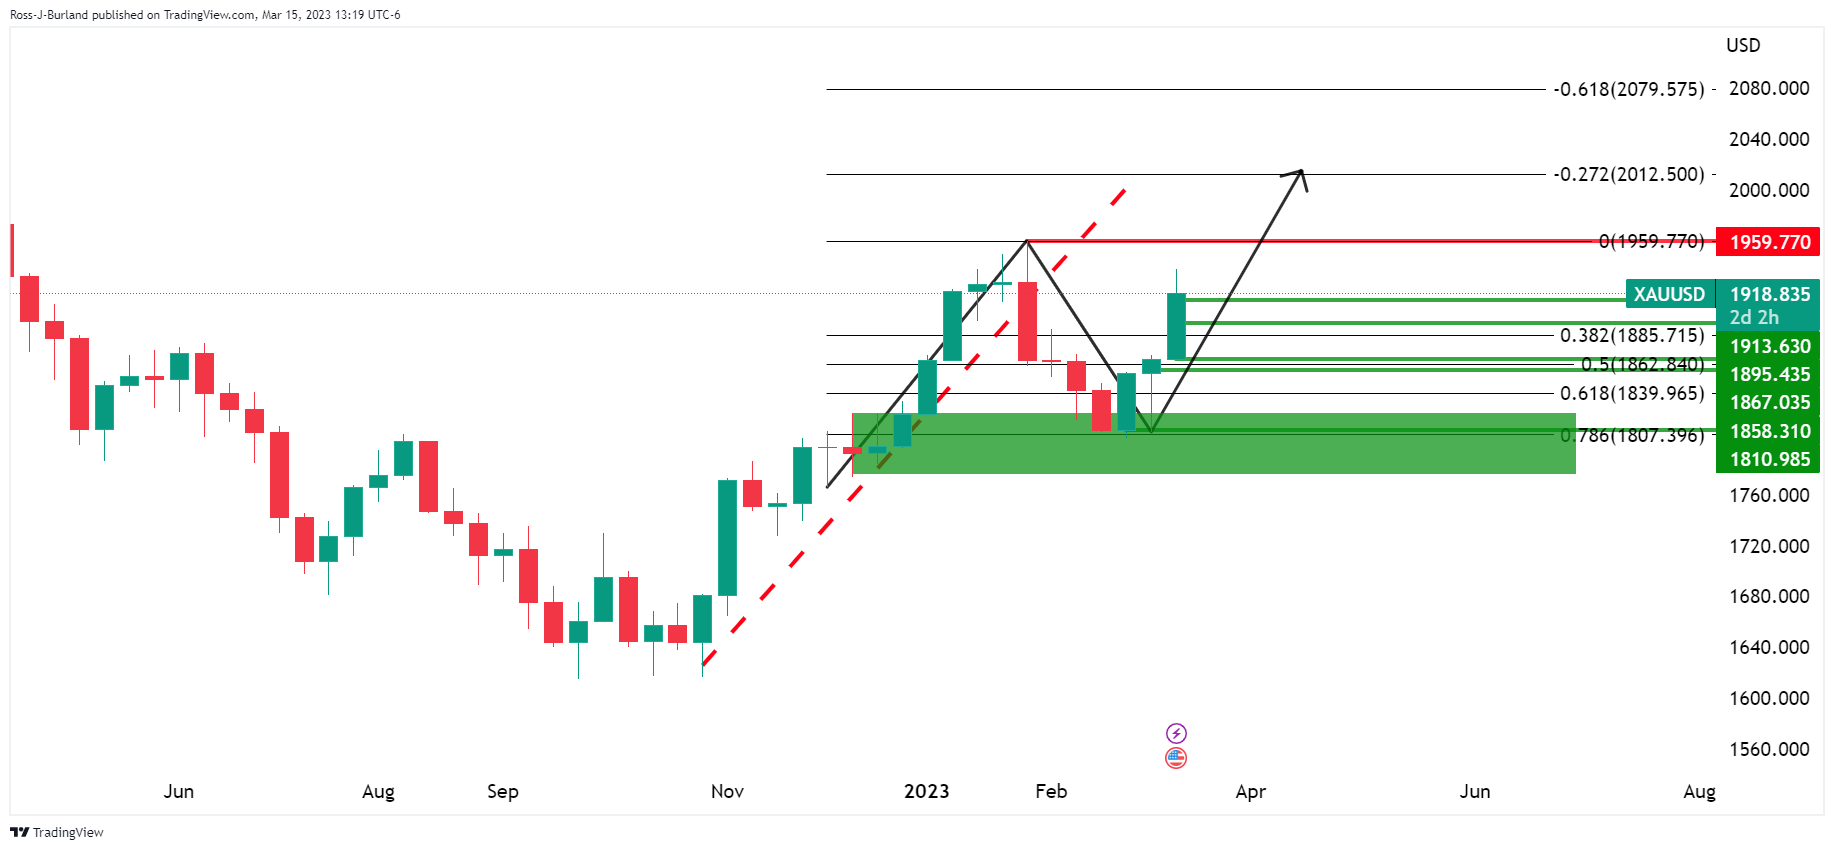
Although the Moving Average Convergence and Divergence (MACD) indicator flashes bullish signals and back the latest run-up, overbought conditions of the Relative Strength Index (RSI) line, placed at 14, suggests the bulls are running out of steam.
Hence, the XAU/USD’s further upside appears difficult but the occurrence of the same could challenge the 61.8% Fibonacci Expansion (FE) of the Gold price run-up from November 2022 to February 2023, around $2,017.
On the flip side, pullback moves remain unimpressive till the quote stays beyond the $1,900 threshold, a break of which could help the Gold sellers to aim for the 50-DMA support of $1,875.
In a case where the Gold price remains weak past $1,875, the early March high surrounding $1,858 precedes the 100-DMA support of $1,818 to challenge the XAU/USD bears.
Overall, the Gold price remains firmer but the road toward the north appears long and bumpy.
Gold price: Daily chart
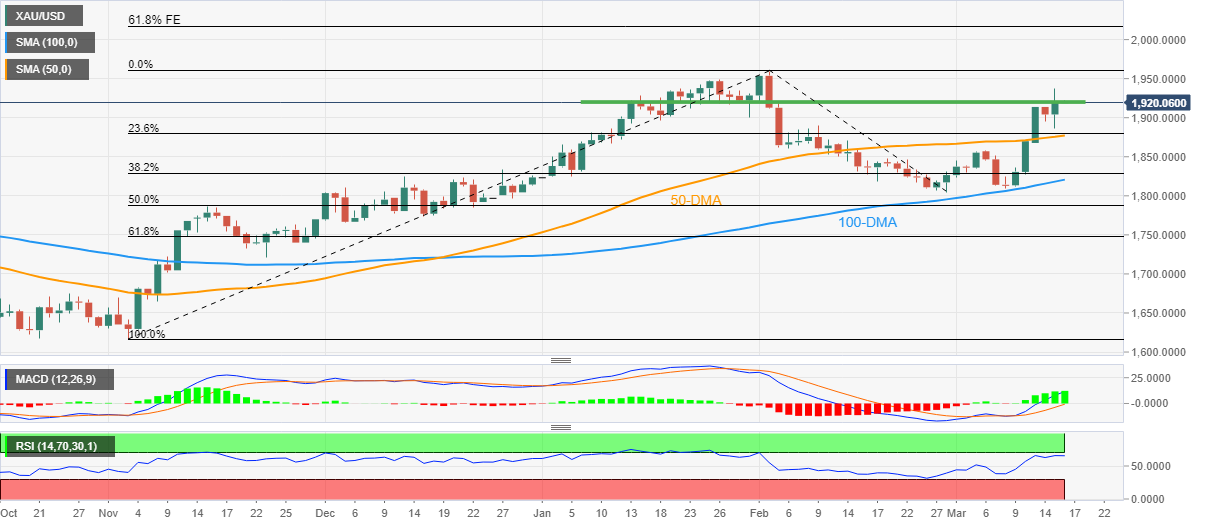
Trend: Further upside expected
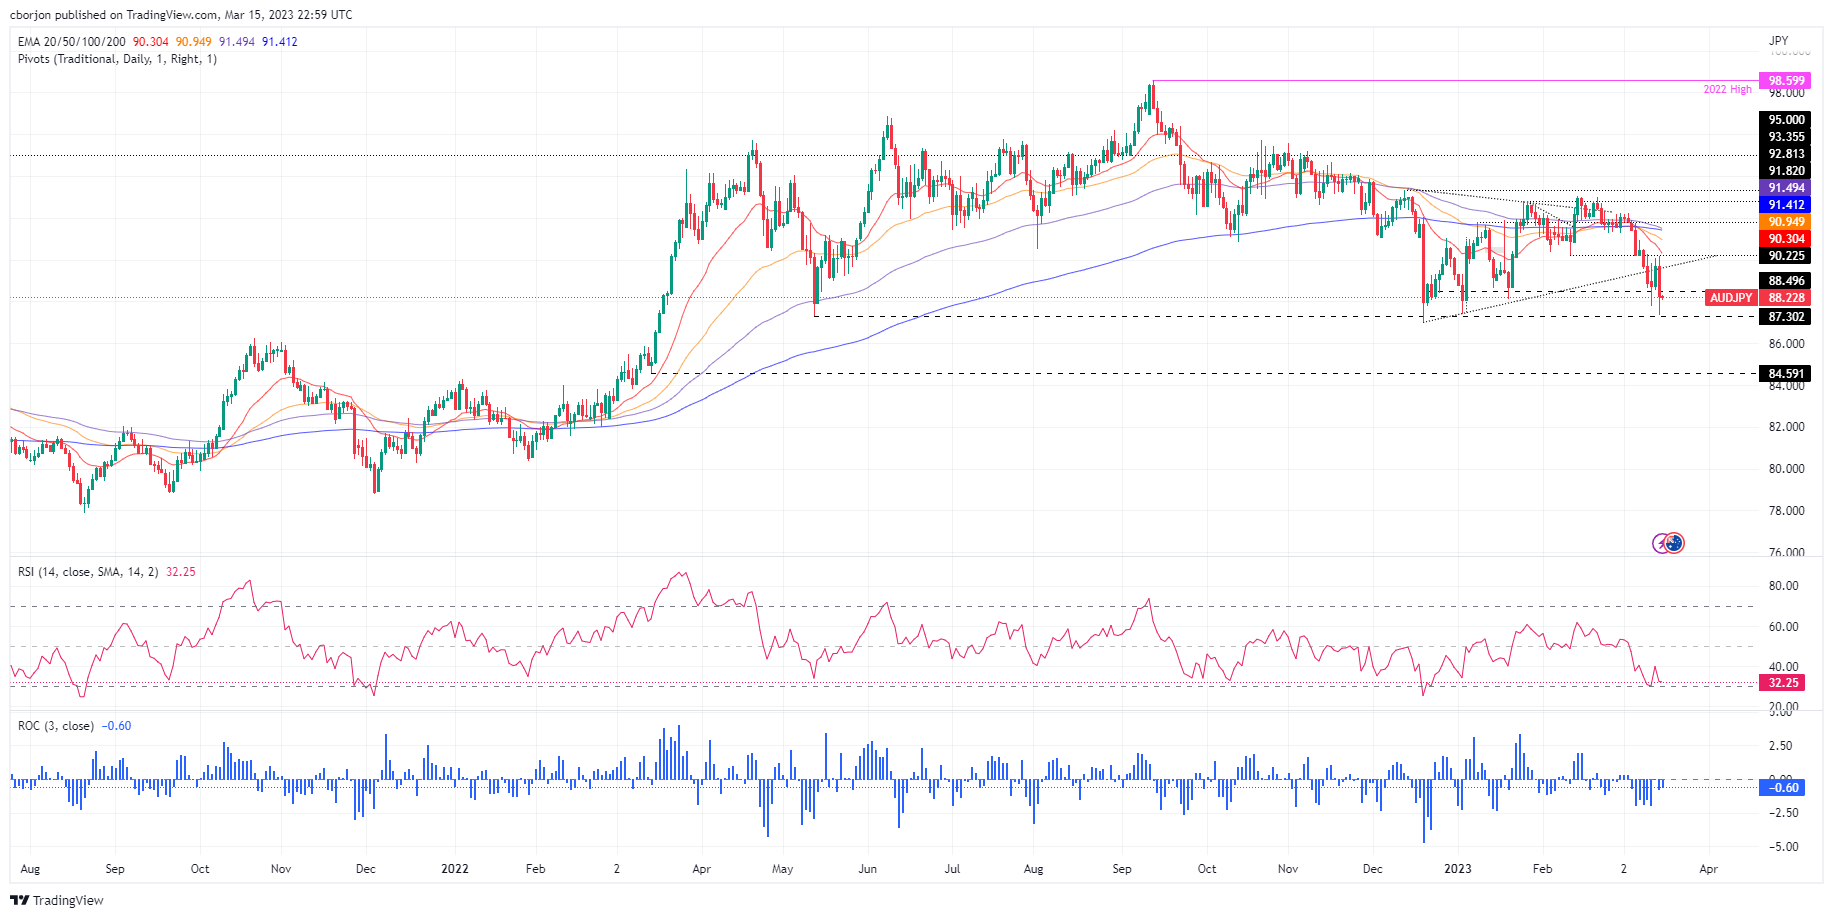
- AUD/JPY dipped below 88.00 and reached a YTD low at 87.35 on Wednesday.
- The cross-currency pair bias remains downwards, albeit reclaiming the 88.00 figure.
- AUD/JPY Price Analysis: Downward biased, though once 89.00 is reclaimed, a leg-up to 90.00 is on the cards.
The AUD/JPY tumbled sharply on Wednesday, more than 1.50%, spurred by a risk-off impulse. Fears around global bank contagion weighed on global bank stocks, particularly Credit Suisse (CS), which seeks support from Swiss authorities like FINMA and the Swiss National Bank (SNB). At the time of writing, the AUD/JPY exchanges hands at $88.19.
AUD/JPY Price action
After breaking a four-month-old upslope trendline, the AUD/JPY has fallen to new YTD lows reached on March 15 at 87.35. However, news from Switzerland sponsored a bounce off the lows, and the AUD/JPY pair closed above the 88.00 figure.
Oscillators remain bearish territory, but the Relative Strength Index (RSI) shifted flat, meaning consolidation lies ahead. In the meantime, the Rate of Change (RoC) portrays selling pressure as waning.
The AUD/JPY path of least resistance is downwards. Backed by the daily EMAs resting above the exchange rate and oscillators in bearish territory. Therefore, the AUD/JPY's first support would be the 88.00 figure. Once broken, the pair might test the YTD lows at 87.35, which, once cleared, the AUD/JPY would dive towards the December 20 swing low at 87.01, ahead of the figure.
As an alternate scenario, the AUD/JPY first resistance would be 89.00. A surge above the figure and the AUD/JPY could rally towards 90.00, ahead of testing the 20-day EMA at 90.30.
AUD/JPY Daily chart
AUD/JPY Technical levels
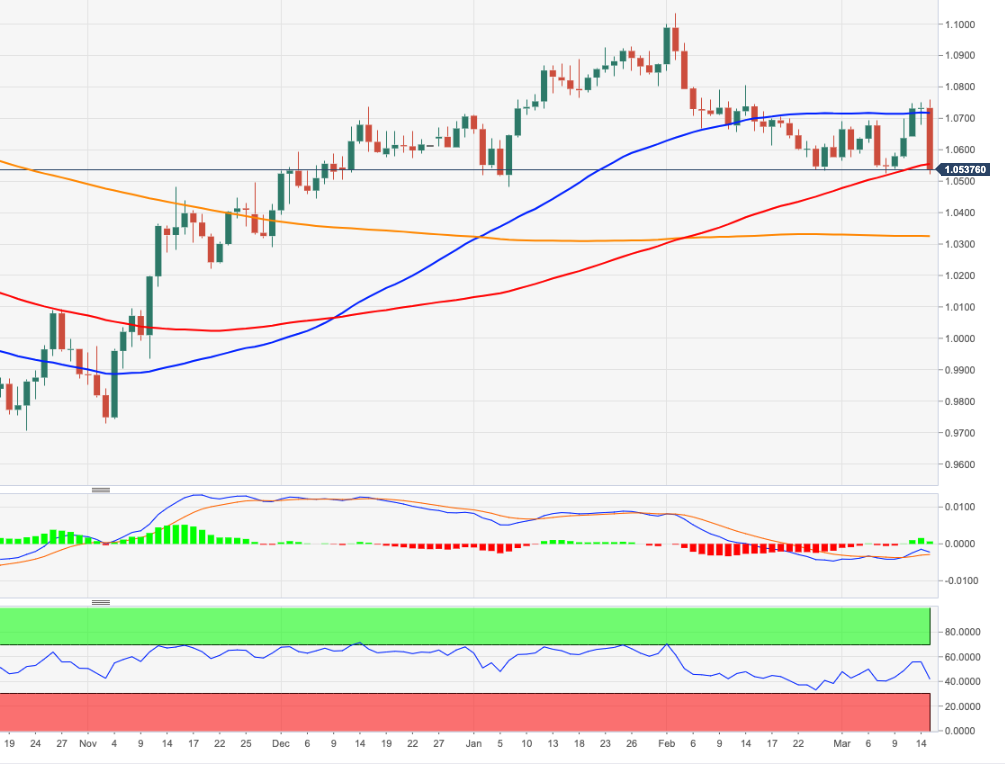
- EUR/USD is aiming to recapture the 1.0600 resistance as hawkish ECB bets are solid despite brewing Eurozone banking system troubles.
- Despite the turmoil in the banking sector, ECB policymakers expect inflation to remain too high in the Eurozone.
- Fed Powell is expected to halt the rate-hiking spell or to announce a small rate hike to keep pressure on US inflation.
The EUR/USD pair is juggling in a narrow range near 1.0580 in the early Tokyo session after a recovery move from below 1.0520. The major currency pair is likely to recapture the round-level resistance of 1.0600 as the European Central Bank (ECB) is expected to continue its 50 basis points (bps) rate hike spell.
It looks like ECB President Christine Lagarde would hike interest rates by 50 bps consecutively for the third time to 3.5% while ignoring the Credit Suisse fiasco as inflationary pressures in the Eurozone economy have not eased yet. Eurozone inflation is still operating at elevated levels and will take sufficient time in softening amid solid labor demand.
Reuters reported that “Despite the turmoil in the banking sector, policymakers expect inflation to remain too high in the Eurozone.” Additionally, the Governing Council doesn't want to damage its credibility by ditching the 50 bps rate increase after having repeatedly noted that this was their intention.
S&P500 futures are showing minor gains in early Asia after a sell-off on Wednesday, propelled by material weakness in Credit Suisse's internal financial reporting. A minor recovery in the 500-US stocks futures basket could be a dead cat bounce as the risk-aversion theme is quite healthy.
The US Dollar Index (DXY) has dropped to near 104.70 after facing barricades around 105.00, however, the upside seems favored amid the risk aversion theme. Good days for the USD Index look counted as the Federal Reserve (Fed) is expected to sound less hawkish while announcing its interest rate decision next week. After considering financial stress in the United States economy led by Silicon Valley Bank (SVB) collapse and softening of Consumer Price Index (CPI), Fed chair Jerome Powell is expected to halt the rate-hiking spell or announce a small rate hike to continue weighing pressure on the stubborn inflation.
Global rating giant Moody’s crossed wires, via Reuters, late Wednesday as it conveys the guidance for the global central banks, especially for the US Federal Reserve (Fed), amid the Credit Suisse turmoil.
“Expect the Federal Open Market Committee (FOMC) to raise the federal funds rate by 25 basis points at its March 22 meeting, said Moody’s per Reuters.
Additional comments
If banking stress intensifies, the Fed may well pause rate hikes to assess the situation.
Fed and other central banks could convene emergency meetings to provide guidance and stem the potential panic.
Financial markets are likely to remain volatile over the coming weeks.
Market reaction
The news tries to placate the risk-off mood and can do so during the generally inactive early Asian trading hours.
Also read: Sources: Large US banks view Credit Suisse exposure as manageable – Reuters
Reuters cites three anonymous industry sources on Wednesday to say, “Large US banks have managed their exposure to Credit Suisse in recent months and view risks from the lender as contained so far.”
The industry sources spoke before Swiss financial regulator Financial Market Supervisory Authority (FINMA) and the Swiss National Bank (SNB) said on Wednesday that the SNB would provide Credit Suisse liquidity "if necessary", a first for a global bank since the financial crisis, reported Reuters.
Additional quotes
Credit Suisse said in a statement that it welcomed the news.
Bankers were more concerned about contagion or unexpected effects of the Swiss lender's troubles that are not yet understood, one source said.
A top U.S. bank is still dealing with Credit Suisse as a counterparty, but is carefully managing its exposure, which is small, according to a source.
One asset manager in New York was assessing its trading counterparty risk with Credit Suisse, according to a source familiar with the situation.
People are all examining their books, what open positions we have with Credit Suisse.
The European Central Bank (ECB) had contacted banks on its watch to quiz them about their exposures to Credit Suisse, two supervisory sources told Reuters.
Also read: Forex Today: Dollar and Yen jump as panic takes over markets
- AUD/USD is facing the heat in extending its recovery above 0.6620 amid the risk-aversion theme.
- S&P500 futures tumbled as investors considered the Credit Suisse fiasco, after the SVB collapse, a blown out of the global banking system.
- An upbeat Australian labor market data could propel inflationary pressures again
The AUD/USD pair is facing barricades in extending its recovery move above the immediate resistance of 0.6620 in the early Asian session. The Aussie asset is sensing heat as investors are awaiting the release of the Australian Employment data before making any significant fresh position. The major was beaten down dramatically on Wednesday after the Credit Suisse fiasco, which squeezed the risk appetite of the market participants.
S&P500 futures tumbled on Wednesday as investors considered the Credit Suisse fiasco, after the Silicon Valley Bank (SVB) collapse, a blown out of the global banking system. The US Dollar Index (DXY) recovered firmly from 103.50 and challenged the elevated resistance of 105.00, portraying a risk aversion theme. Investors ran heavily for safe-haven assets to dodge sheer volatility due to which the alpha offered on US government bonds squeezed heavily. The 10-year US Treasury yields plummeted to 3.46%.
The Australian Dollar is expected to remain in action amid the release of the Employment data. As per the consensus, the Australian economy has added fresh 48.5K jobs in February vs. 11.5K lay-offs registered in January. And, the Unemployment Rate is expected to drop to 3.6% from the former release of 3.7%. Higher employment generation and a lower jobless rate are indicating an expression of higher forward earnings as upbeat demand for labor would be offset by bumper offerings from firms.
An upbeat Australian labor market data could propel the inflationary pressures again as households would be equipped with higher funds for disposal.
Apart from that, Consumer Inflation Expectations (Mar) data that demonstrate inflation projections for the next 12 months is expected to increase to 5.4% from the former release of 5.1%. An occurrence of the same would support more rates from the Reserve Bank of Australia (RBA).
The release of the downbeat US Retail Sales and lower-than-anticipated Producer Price Index (PPI) figures after inflation softening and higher Unemployment Rate have faded the expectations of bigger rates from the Federal Reserve (Fed). There is no denying the fact that Fed chair Jerome Powell could look for halting the rate-hiking spell for now considering escalating financial stress in the US economy.
- AUD/NZD picks up bids to rebound from 2.5-month low as NZ Q4 GDP disappoints.
- New Zealand Q4 GDP drops to -0.6% QoQ versus -0.2% expected and 2.0% prior.
- Credit Suisse turmoil previously weighed on the cross-currency pair.
- Australia employment report for February, RBA Bulletin eyed for fresh impulse.
AUD/NZD picks up bids to reverse from the lowest levels in a year, jumping nearly 50 pips to 1.0745 after New Zealand’s (NZ) fourth quarter (Q4) Gross Domestic Product (GDP) disappoints Kiwi traders during early Thursday. The figures become even more worrisome after the global rating giant S&P warned of an NZ rating cut.
NZ Q4 GDP slide to -0.6% QoQ versus -0.2% market forecasts and 2.0% previous readings. Further, the YoY figures also eased to 2.2% compared to 3.3% expected and 6.4% in previous readings.
Also read: Breaking: NZD/USD dumps on big miss in NZ GDP
On Wednesday, Bloomberg quoted Anthony Walker, a director of sovereign ratings for Australia, New Zealand and the Pacific at S&P to mention that "New Zealand’s credit grades with S&P Global Ratings could come under pressure if the nation’s current account deficit remains too big." It should be noted that the national Current Account Deficit shrank to $-9.45B in Q4, from $-10.2B in Q3. However, the Current Account – GDP Ratio slumped to -8.9% from -7.9% prior and -8.4% market forecasts.
Apart from the data at home and fears of the NZ rating cut, the market’s risk-off mood previously weighed on the AUD/NZD prices, mainly due to the Australia Dollar’s (AUD) risk-barometer status. The sentiment soured as the banking crisis reached Europe with a G-SIB – a global systemically important bank, namely Credit Suisse (CS), struggling with its Credit Default Swaps (CDS).
That said, the Yields slumped and the European stock market closed in the red but Wall Street closed mixed as the Swiss National Bank (SNB) stepped forward to help CS.
Looking ahead, AUD/NZD is likely to reverse amid broad risk-off mood and challenges for the AUD. However, today’s Aussie jobs report for February and the Reserve Bank of Australia’s (RBA) fourth-quarter (Q4) Bulletin will be important for the pair traders to watch for fresh impulse.
Technical analysis
Despite the latest rebound, a daily closing beyond a three-week-old resistance line, currently around 1.0735 appears necessary for the AUD/NZD bulls to keep the reins.
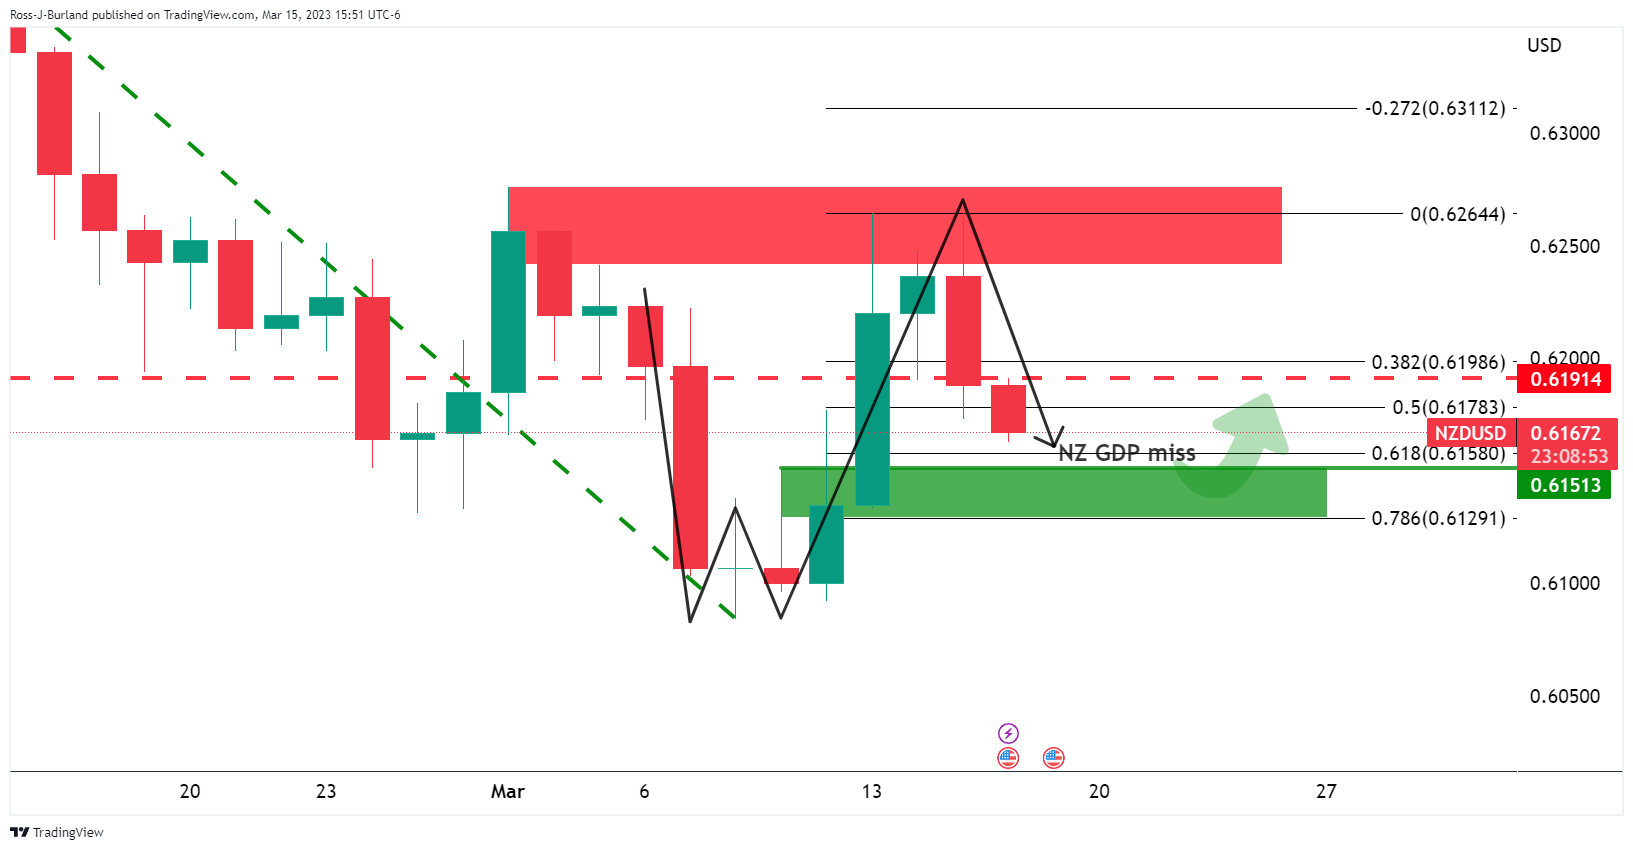
- NZD/USD has dropped sharply below 0.6160 on weaker NZ GDP figures.
- A catastrophic collapse of Credit Suisse forced investors to shift their funds into the USD Index.
- Fed Powell might consider a pause in the policy-tightening spell considering the deceleration in the US Inflation.
The NZD/USD pair has slipped firmer below 0.6160 as Statistics New Zealand has reported weak Gross Domestic Product (Q4) data. The economy contracted by 0.6% in the fourth quarter while the street was expecting a contraction of 0.2%. The New Zealand economy showed a growth rate of 1.7%.
On an annual basis, the NZ economy has expanded by 2.2%, lower than the estimates of 3.3% and the former release of 6.7%. A deteriorating economy demonstrates weakness in overall demand, which would also reduce inflationary pressures. In times when NZ inflation is extremely stubborn, the headline of economic contraction would delight the Reserve Bank of New Zealand (RBNZ).
The Kiwi asset remained solid on early Tuesday as China’s Retail Sales data justified the expectations from the street and the US Dollar Index (DXY) was beaten down by the declining United States Consumer Price Index (CPI) and the collapse of Silicon Valley Bank (SVB).
However, the ‘material weakness’ in internal controls of Credit Suisse’s financial reporting triggered demand for safe-haven assets. The stretch of banking system failure from the US to Europe deepened fears among market participants and they shift back to the USD Index to dodge liquidity.
A blunt decline by the Saudi National Bank for infusing more funds into Credit Suisse, the leading investor in the Swiss banking firm, raised alarms of some internal financial issues, which led to a nosedive move in the share price of Credit Suisse.
S&P500 futures failed to continue Tuesday’s upbeat recovery and were heavily sold by investors, portraying a risk-aversion theme. The demand for US government bonds rose dramatically as investors gung-ho for safe-haven appeal. This led to a sheer decline in the 10-year US Treasury yields to 3.46%.
Meanwhile, the odds for a 50 basis point (bps) interest rate hike by the Federal Reserve (Fed) has faded as US Producer Price Index (PPI) dropped lower than expected and Retail Sales contracted more than anticipation. There is no denying the fact that Fed chair Jerome Powell could also consider a pause in the policy-tightening spell considering the deceleration in the US Inflation and huge stress on the financial system.
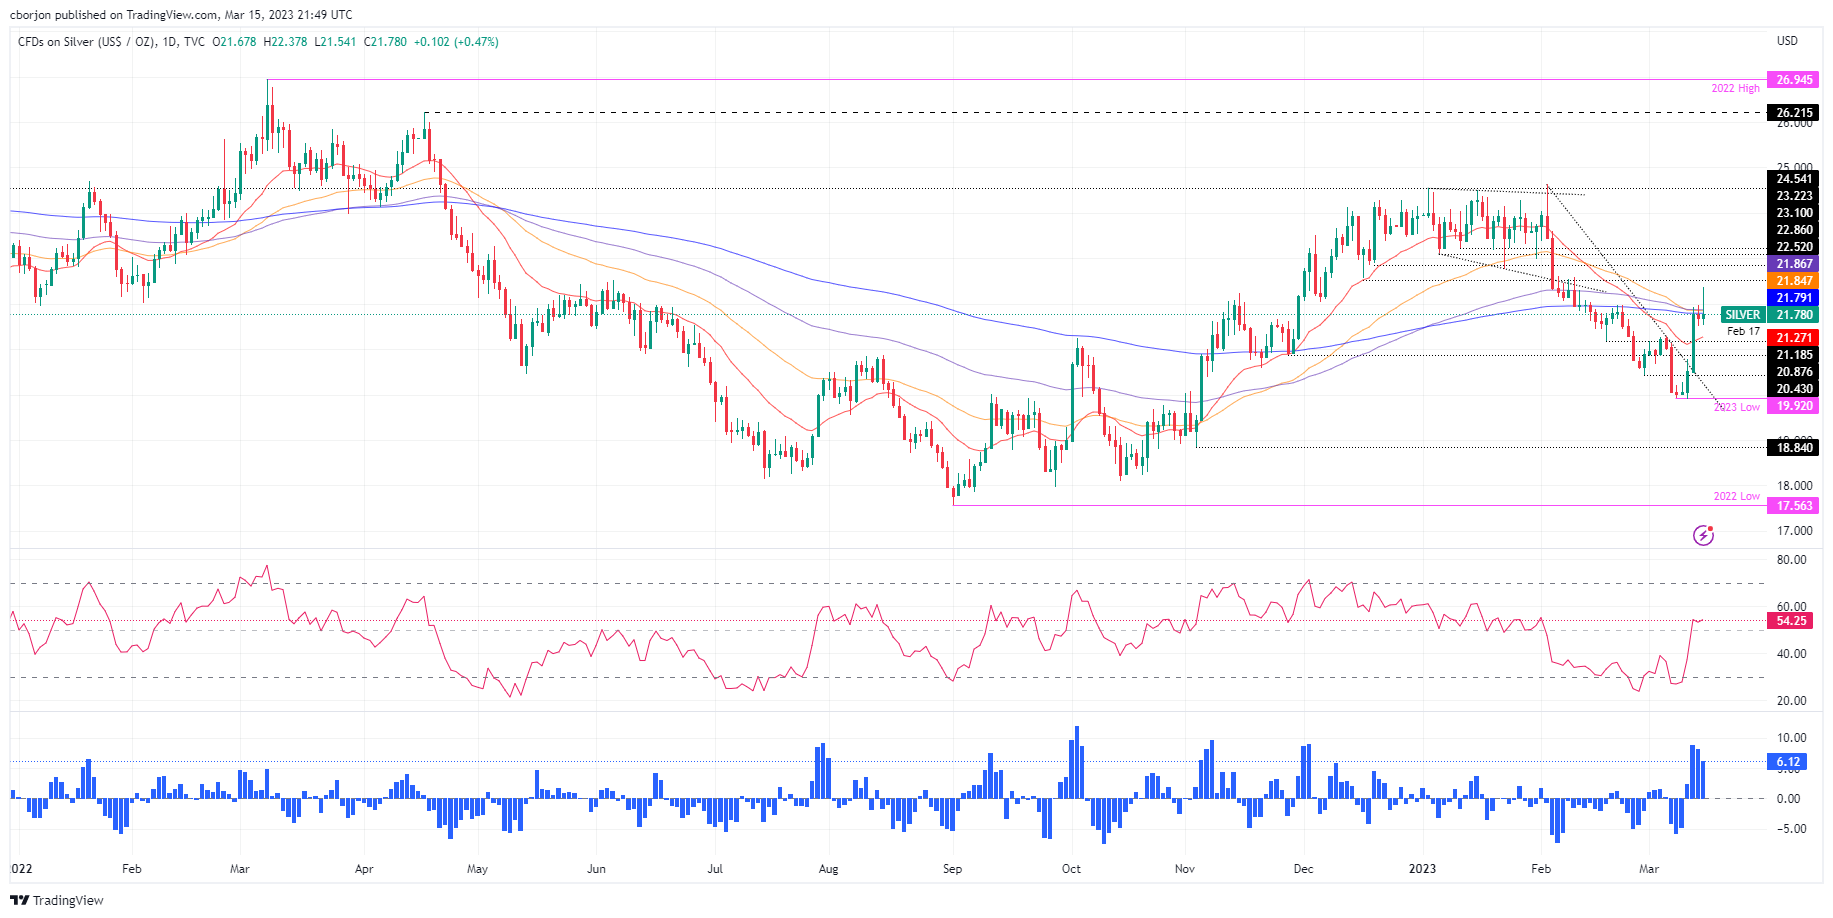
- XAG/USD clings to Wednesday’s gains of 0.36%, despite overall US Dollar strength.
- Silver dropped below the 200-day EMAs after reaching a daily high of $22.37.
- XAG/USD Price Analysis: Silver remains downward biased.
Silver price retraced some of its earlier gains after hitting a daily high of $22.37; a slight improvement in market sentiment strengthened the US Dollar (USD). Therefore, the XAG/USD is trading at $21.75, above its opening price by 0.36%, below the 200-day Exponential Moving Average (EMA).
XAG/USD Price action
After reaching a daily high, the XAG/USD retreated from levels around $22.30s and cleared the confluence of the 50, 100, and 200-day EMAs at around $21.79-86. Therefore, the bearish bias remains intact, as the XAG/USD is set to achieve a daily close below the 200-day EMA.
Although oscillators shifted bullish, price action is the leading indicator. The Relative Strength Index (RSI) turned flat in bullish territory, while the Rate of Change (RoC) portrays buying pressure is waning. Therefore, the XAG/USD would remain trading sideways in the near term.
For a bearish resumption, the XAG/USD needs to crack the March 14 low of $21.50. A breach of the latter will expose the February 17 daily low at $21.18, followed by the November 28 swing low at 20.87. Once those two areas are reclaimed, the YTD low would be for grabs.
In an alternate scenario, the XAG/USD first resistance would be the confluence of the 200/100/50-day EMAs, around $21.79-86. Once buyers reclaim that area, the $22.00 figure would be up for grabs, before testing the weekly high of $22.37.
XAG/USD Daily chart
XAG/USD Technical levels
Stats New Zealand released the further quarter Gross Domestic Product as follows:
- New Zealand GDP SA QoQ for Q4: -0.6% vs. est -0.2%; prev 2.0%.
- GDP +2.2% YoY vs. expected +3.3%, prior 6.4%.
NZD/USD has dropped around 25 pips on the data:
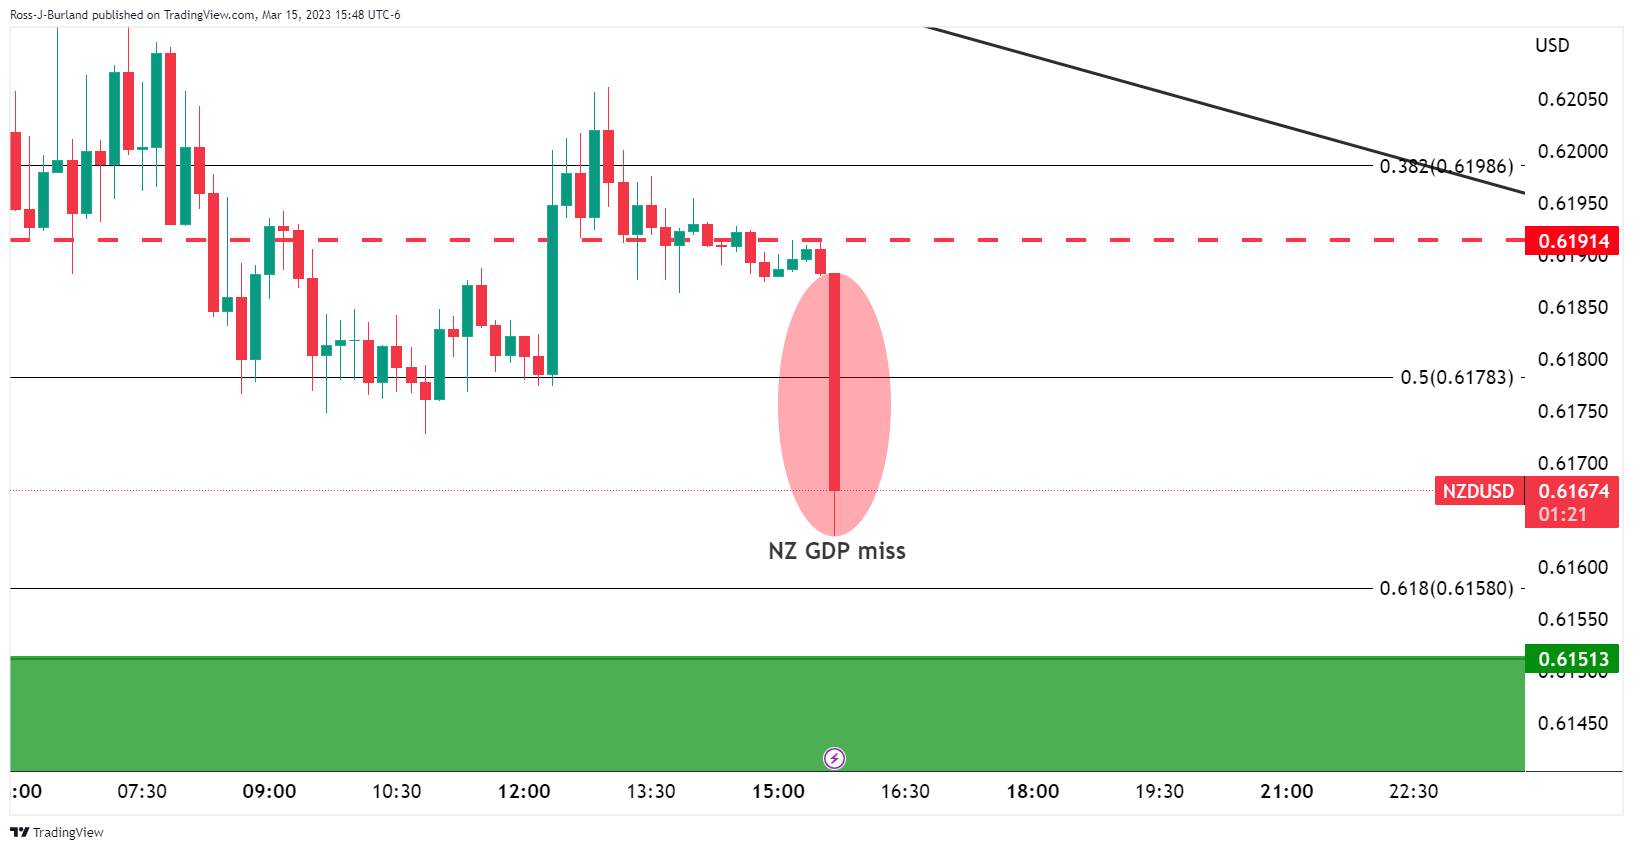
0.6150 support is eyed as a key level to the downside as per the daily chart´s M-formation pulling the price into the neckline:
About New Zealand´s GDP
The Gross Domestic Product released by the Statistics New Zealand is a measure of the total value of all goods and services produced by New Zealand. The GDP is considered as a broad measure of New Zealand economic activity and health. Generally speaking, a high reading is seen as positive (or bullish) for the NZD, while a falling trend is seen as negative (or bearish) for the NZD.
Stats New Zealand will release the further quarter Gross Domestic Product today at 21.45 GMT.
Analysts at ANZ Bank have penciled in a 0.3% QoQ contraction, which is weaker than their previous forecast of +0.3% QoQ, and the Reserve Bank of New Zealand February MPS forecast of +0.7% QoQ.
´´A 1.7% QoQ fall in goods-producing industries (led by weaker manufacturing and construction) is expected to offset a modest 0.3% q/q lift in services activity. Given the ongoing noise in the data, we’re not convinced a weak read in Q4 can be considered much more than payback from the whopper 2.0% q/q lift in GDP in Q3,´ the analysts said.
The analysts said that the RBNZ will likely to look through some of the weakness in Q4 if the data print broadly as expected.´´
How might it affect NZD/USD?
NZD/USD is lower on the day while the US Dollar, as measured by the DXY index, is recovering on contagion fears in a slight to safety as markets derisk due to the banking crisis. However, NZ GDP data today will be important, as analysts at ANZ Bank explained. ´´But local factors are being overshadowed by global events and generalised fear in global markets. Keep an open mind, be mindful of sinking risk appetite/safe haven appeal. Things are fluid, but not liquid.´´
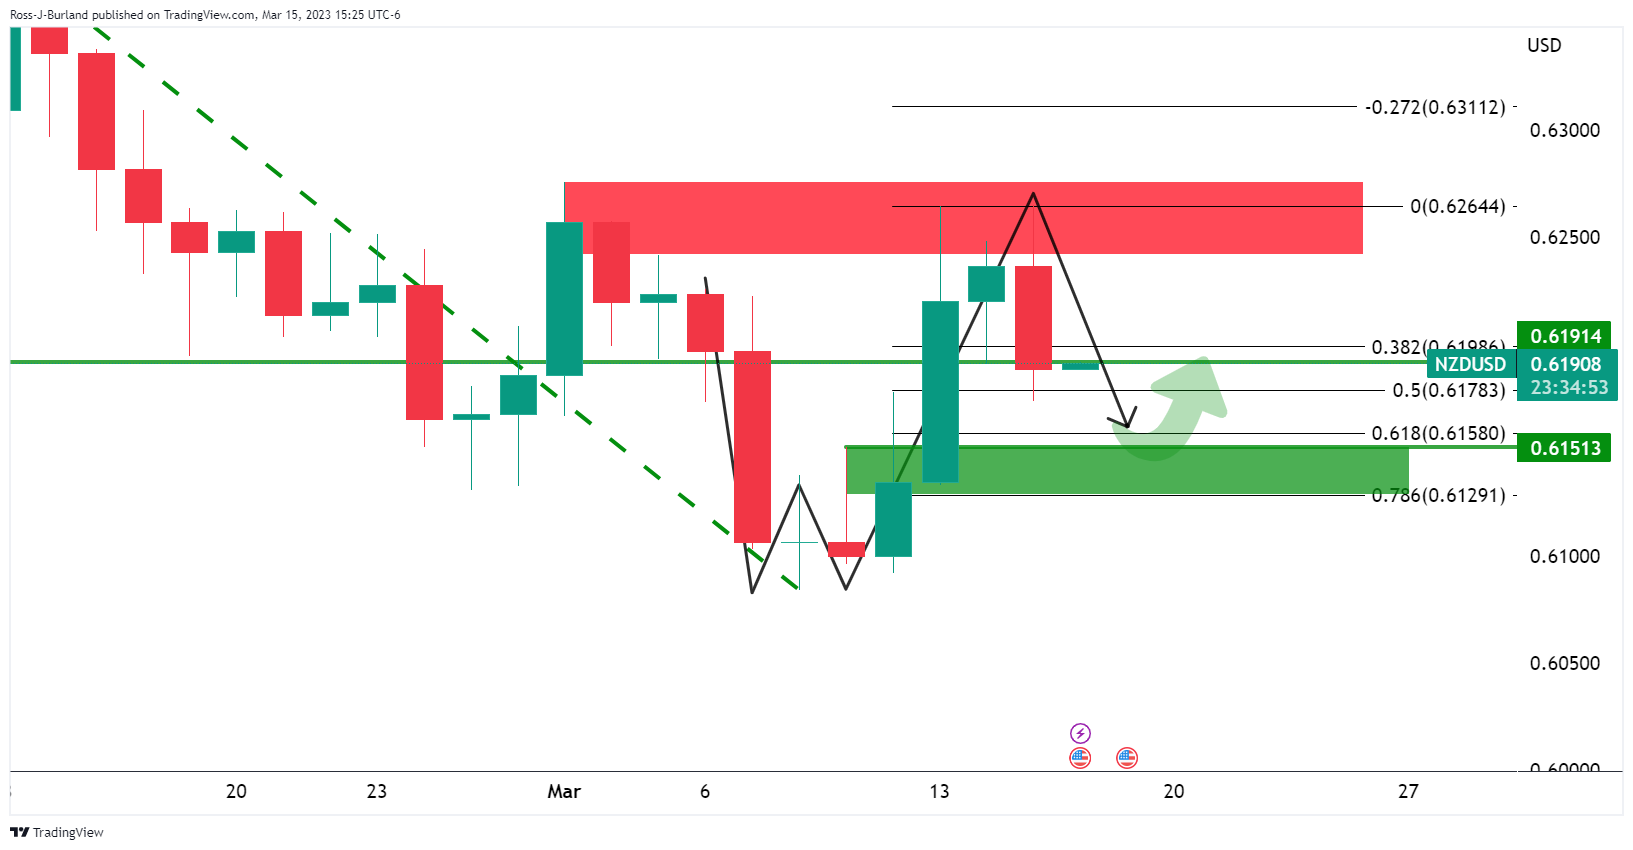
There is a downside bias currently that exposes the neckline of the W-formation near 0.6150.
About New Zealand´s GDP
The Gross Domestic Product released by the Statistics New Zealand is a measure of the total value of all goods and services produced by New Zealand. The GDP is considered as a broad measure of New Zealand economic activity and health. Generally speaking, a high reading is seen as positive (or bullish) for the NZD, while a falling trend is seen as negative (or bearish) for the NZD.
Here is what you need to know on Thursday, March 16:
Wall Street indexes finished far from the lows on a wild session that included moments of panic. The Nasdaq scratched a 0.05% gain while the Dow Jones lost 0.80%. Expectations of central bank tightening continue to ease, boosting government bonds. The banking crisis reached Europe, with focus on the health of Credit Suisse (CS). The DXY gained more than 1%, erasing weekly losses, boosted by the risk-off scenario. Emerging market currencies were under pressure.
EUR/USD tumbled toward 1.0500 and then trimmed losses, still posting the worst day in months. On Thursday, the European Central Bank (ECB) meets. A 50 bps hike is still expected amid elevated inflation but the current turmoil put all options on the table. Central banks are now in a more difficult position.
The Swiss Franc was among the worst performers, hit by the Credit Suisse drama. It even lost ground against the Euro. The Swiss National Bank (SNB) said it would provide liquidity to CS if necessary. USD/CHF jumped from near 0.9100 above 0.9300, while EUR/CHF rebounded from 0.9710 to 0.9850.
GBP/USD did not escape Dollar’s strength, falling toward 1.2000. The Pound however, held relatively well with EUR/GBP reaching three months lows at 0.8715 before rebounding to 0.8770.
USD/CAD soared, hitting levels above 1.3800 and then pulled back. NZD/USD fell modestly, losing 0.6200. New Zealand will report Q4 GDP on Thursday. AUD/USD gave up recent gains and is looking again at January lows (0.6580), although it climbed back above 0.6600 during the American afternoon. Australia will report February’s employment numbers.
Gold jumped to $1,937/oz, a one-month high amid lower US yields, and then trimmed gains. Silver reached monthly highs above $22.00 and then pulled back to end flat around $21.70.
Bitcoin held relatively well despite all the turmoil, with the price hovering around $24,000 after hitting on Tuesday $26,550, the highest level since June 2022. Ethereum dropped 5% to $1,630.
- USD/JPY sinks as US yields fall out of the sky.
- The Credit Suisse crisis is roiling markets and supporting the safe havens.
USD/JPY sank to a 4-week low on Wednesday while US and European yields tumble in the face of a slide in the European banking index that fell in its biggest one-day drop in nearly 13 months. Credit Suisse's 2022 annual report was published on Tuesday and it cited "material weaknesses" in its internal controls over financial reporting, noting that it had not yet stemmed customer outflows. This has provoked a flight to safety in financial markets, massaging the downside in USD/JPY.
At the time of writing, USD/JPY is done by over 0.7% but off the lows of the day that were printed at 132.21. The currency pair dropped from a high of 135.11 in the Europen session and is back to trading at around 133.30 at the time of writing. Two-year Treasury notes have dropped 98 basis points in the last five days, the biggest drop since the week of Black Monday on Oct. 19, 1987.
Markets are now pricing in an 80% chance of a 25 basis point Federal Reserve hike next week. Investors are also pricing in a 50% chance of no change. Moreover, the December Fed funds futures, which reflect the overnight rate that banks use to lend to each other has dropped to 3.62% in a sign market expect the Federal Reserve to be cutting interest rates by year's end, if not before.
USD/JPY weekly chart
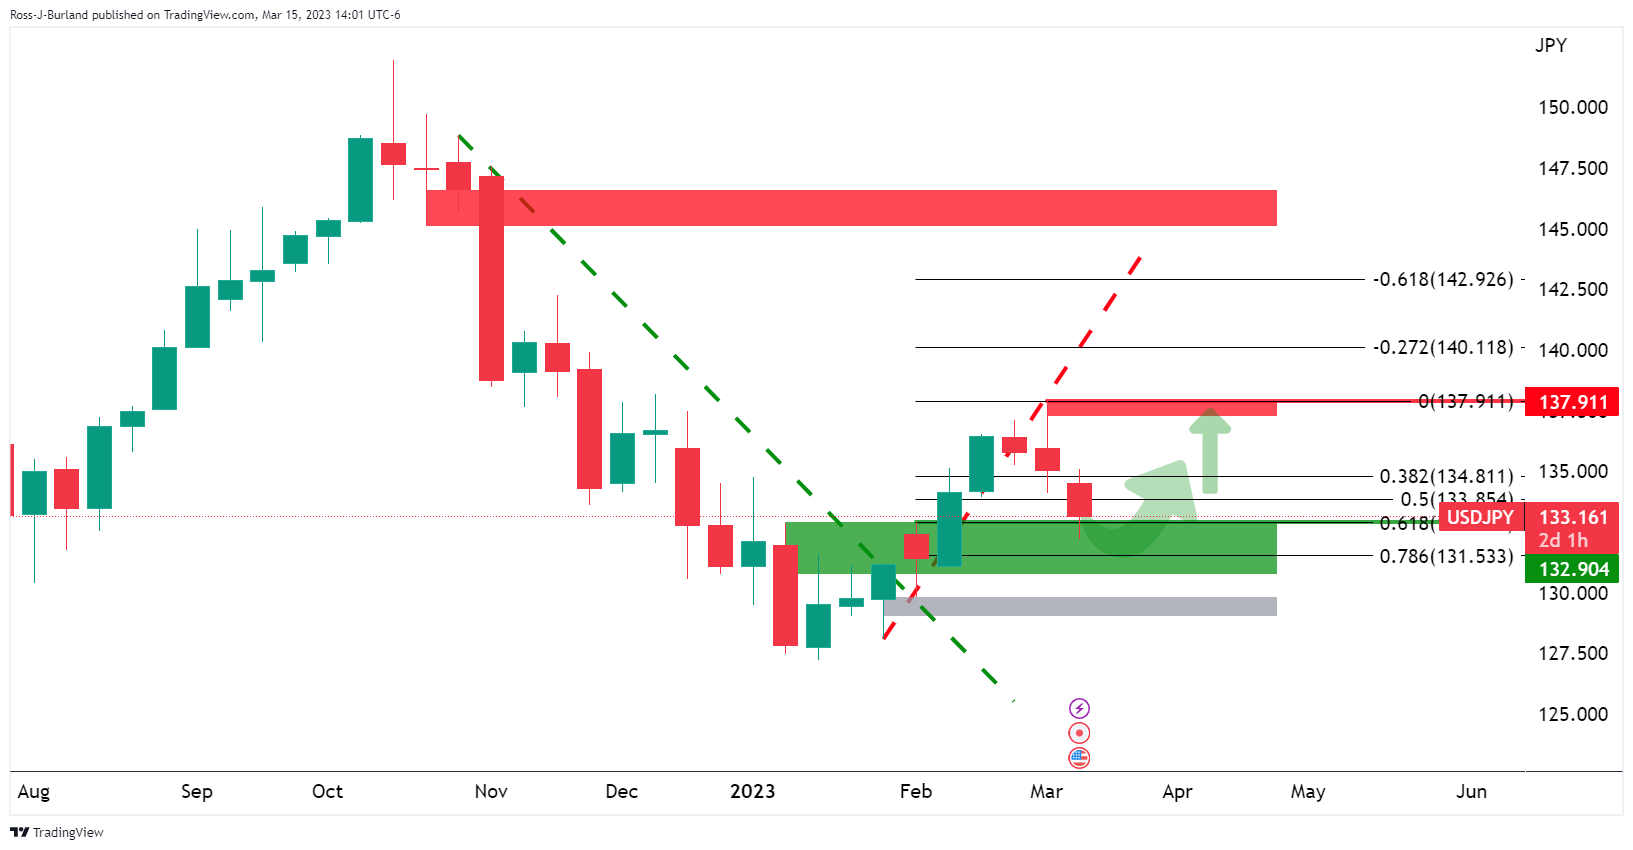
The price is meeting a potential support zone in this correction into the 61.8% Fibonacci retracement of the price´s bullish impulse. A bullish could be started to be built if a bullish structure should emerge on the lower time frame over the course of the next few sessions and/or days.
Credit Suisse shares tumbled on Wednesday amid increasing difficulties following the collapse of two US banks. The Swiss National Bank (SNB) and the Swiss Financial Market Supervisory Authority (FINMA) released a statement indicating that the “problems of certain banks in the USA do not pose a direct risk of contagion for the Swiss financial markets.”
According to the statement, Credit Suisse meets the capital requirements imposed on banks. It added, that the Swiss National Bank will provide liquidity to the bank if necessary.
Key quotes from the statement:
“The SNB and FINMA are pointing out in this joint statement that there are no indications of a direct risk of contagion for Swiss institutions due to the current turmoil in the US banking market.”
“Regulation in Switzerland requires all banks to maintain capital and liquidity buffers that meet or exceed the minimum requirements of the Basel standards. Furthermore, systemically important banks have to meet higher capital and liquidity requirements. This allows negative effects of major crises and shocks to be absorbed.”
“Credit Suisse’s stock exchange value and the value of its debt securities have been particularly affected by market reactions in recent days. FINMA is in very close contact with the bank and has access to all information relevant to supervisory law. Against this background, FINMA confirms that Credit Suisse meets the higher capital and liquidity requirements applicable to systemically important banks.”
“The SNB will provide liquidity to the globally active bank if necessary. FINMA and the SNB are following developments very closely and are in close contact with the Federal Department of Finance to ensure financial stability.”
The USD/CHF is trading slightly below 0.9300, after rising more than 150 pips. The Swiss Franc is among the worst performers on Wednesday.
- USD/CHF rallied on deteriorated market sentiment spurred by banking contagion fears.
- Retail Sales in the United States contracted while inflation on the producer side eased.
- IF needed, the Swiss National Bank would act as a liquidity provider for Credit Suisse.
USD/CHF soars sharply as sentiment shifts sour on fears that the United States (US) banking crisis could spread globally. On Wednesday, Credit Suisse (CS) stock plunged 24% in an interview with one of its top shareholders, saying they won’t increase their stake at the bank due to regulation. At the time of writing, the USD/CHF is trading at 0.9287, up by 1.61% or 145 pips.
Swiss Franc collapses on Credit Suisse fall
The market sentiment remains sour, as portrayed by Wall Street, extending its losses. Credit Suisse’s sell-off continued in the European session, while the bank’s Credit Default Swaps (CDS) “ spiked to levels that signal Credit Suisse is in deep financial distress,” according to Bloomberg. Therefore, the CBOE Volatility Index (VIX) increased and reached a high of 30.81 before easing to current levels of 27.16.
The US economic docket featured Retail Sales for February. Figures came at -0.4% MoM, exceeding estimates for a 0.3% contraction. Although the data was negative, data showed American consumers’ resilience to spend. On another tranche of data, the Department of Labor (DoL) revealed the Producer Price Index (PPI) for February, in headline and core figures, were below estimates. That shows that the cumulative tightening of the Federal Funds rate (FFR) is working, despite the tightness of the labor market.
Therefore, safe-haven flows bolstered the US Dollar (USD), with the US Dollar index advancing 1.13%, at 104.836. However, US Treasury bond yields have been punished by investors, with US 2s and 10s extending their losses, each down by 37 basis points (bps) and 24 bps, respectively, at 3.889% and 3.453%.
Aside from this, the latest news crossing wires said that the Swiss Regulator FINMA would likely make a statement on Credit Suisse soon.
As of typing, the Swiss National Bank and the Swiss Financial Market Supervisory Authority issued a statement. It says: “Credit Suisse meets the capital and liquidity requirements imposed on systemically important banks. If necessary, the SNB will provide Credit Suisse with liquidity.”
Also read: SNB and FINMA issue statement on market uncertainty.
USD/CHF Technical levels
- Gold price firmer on risk-off sentiment due to the Credit Suisse crisis.
- Investors question whether the Federal Reserve can keep hiking interest rates to curb inflation.
- On a weekly basis, a continuation in the Gold price opens the risk of a move to test $2,012.50 as the -272% Fibonacci.
Gold price soared from a low of $1,885.79 to a high of $1,937.39 on the day but has come under some selling pressure in recent trade. Gold price has fallen back to trade around $1,916 at the time of writing, reflecting the volatility in the market as a consequence of the Credit Suisse risk.
Credit Suisse is in crisis
Bank stocks, already reeling from two large bank failures in the past week, were under pressure on Wednesday as the sharp drop of Credit Suisse. Shares of the Swiss lender fell more than 20% after the chairman of its biggest backer — the Saudi National Bank — said it won’t provide further financial support. On Tuesday, the institution announced that it had found “material weakness” in its financial reporting process from prior years.
The Guardian reports,´´the bank is in the process of a major restructuring plan, meant to stem major losses, which ballooned to 7.3bn Swiss francs (£6.6bn) in 2022, and revive operations hampered by multiple scandals over the past decade involving alleged misconduct, sanctions busting, money laundering and tax evasion.´´
Long story short, there is a loss of confidence in the bank and this is leading to additional fears of contagion in the global banking arena which is benefitting the Gold price on derisking as well as dialed-back expectations for central bank tightening.
Federal Reserve rate hike expectations dialed back
As recently as last week, markets were getting set for the return of large Fed interest rate rises. However, concerns about the banking sector have triggered a sharp decline US bond yields as investors questioned if the Federal Reserve and other central banks can keep hiking interest rates to curb inflation.
Two-year Treasury notes, which move in step with interest rate expectations, have tumbled 98 basis points in the last five days, the biggest drop since the week of Black Monday on Oct. 19, 1987. On Wednesday, they have fallen from 4.413% to pay as low as 3.72%. Markets are now pricing in an 80% chance of a 25 basis point Federal Reserve hike next week and are pricing in a 50% chance of no change. Moreover, the December Fed funds futures, which reflect the overnight rate that banks use to lend to each other has dropped to 3.62% in a sign market expect the Federal Reserve to be cutting interest rates by year's end, if not before.
Gold price shines on falling US Treasury yields
Consequently to the turmoil, the Gold price is recovering and has rallied in four of the past five trading sessions. Last year, higher interest rates made it more appealing to hold government bonds over gold, since the latter doesn't pay any regular income. However, a jolt of uncertainty among investors is seeing the yields paid on government debt tanking. The yield curve, as a result, narrowed its inversion further, with the gap between two-year and 10-year yields contracting to -28.60 bps and the tightest spread since October.
Gold price technical analysis
From a daily perspective, the momentum is with the Gold price bulls and a bullish close on Wednesday opens prospects of a move to test the 2023 highs near $1,960.
On a weekly basis, the Gold price has recovered from support and a 78.6% Fibonacci correction. A continuation in the Gold price opens the risk of a move to test $2,012.50 as the -272% Fibonacci.
The EUR/USD lost more than 200 pips on Wednesday amid the turmoil around Credit Suisse. On Thursday, the European Central Bank will have it monetary policy meeting. Analysts at Rabobank warn that a 50 bps rate hike may fail to lift the Euro if investors assume that it is deepening the risk of a downturn.
Key quotes:
“The EUR has been impacted despite reports that the ECB will stay the course an announced the 50 bps move that its has already indicated.”
“Hiking rates by 50 bps against the backdrop of a jittery market and a tightening of financial conditions may fail to lift the EUR if investors assume that the central bank is deepening the risk of a downturn.”
“The best-case scenario is that jitters across the wider financial sector in Europe settle. This would allow the market to return its focus to economic fundamentals and specifically the risks around inflation. This would make it easier for the market to absorb a 50-bps rate hike from the ECB tomorrow and for EUR/USD to rally back above 1.06.”
“The market has already pared back expectations about how much further central banks can hike rates. Guidance offered by the ECB on this front tomorrow, and by the Fed and the BoE next week will be instrumental in setting the medium-term outlook for the FX market. Almost certainly further volatility is in store.”
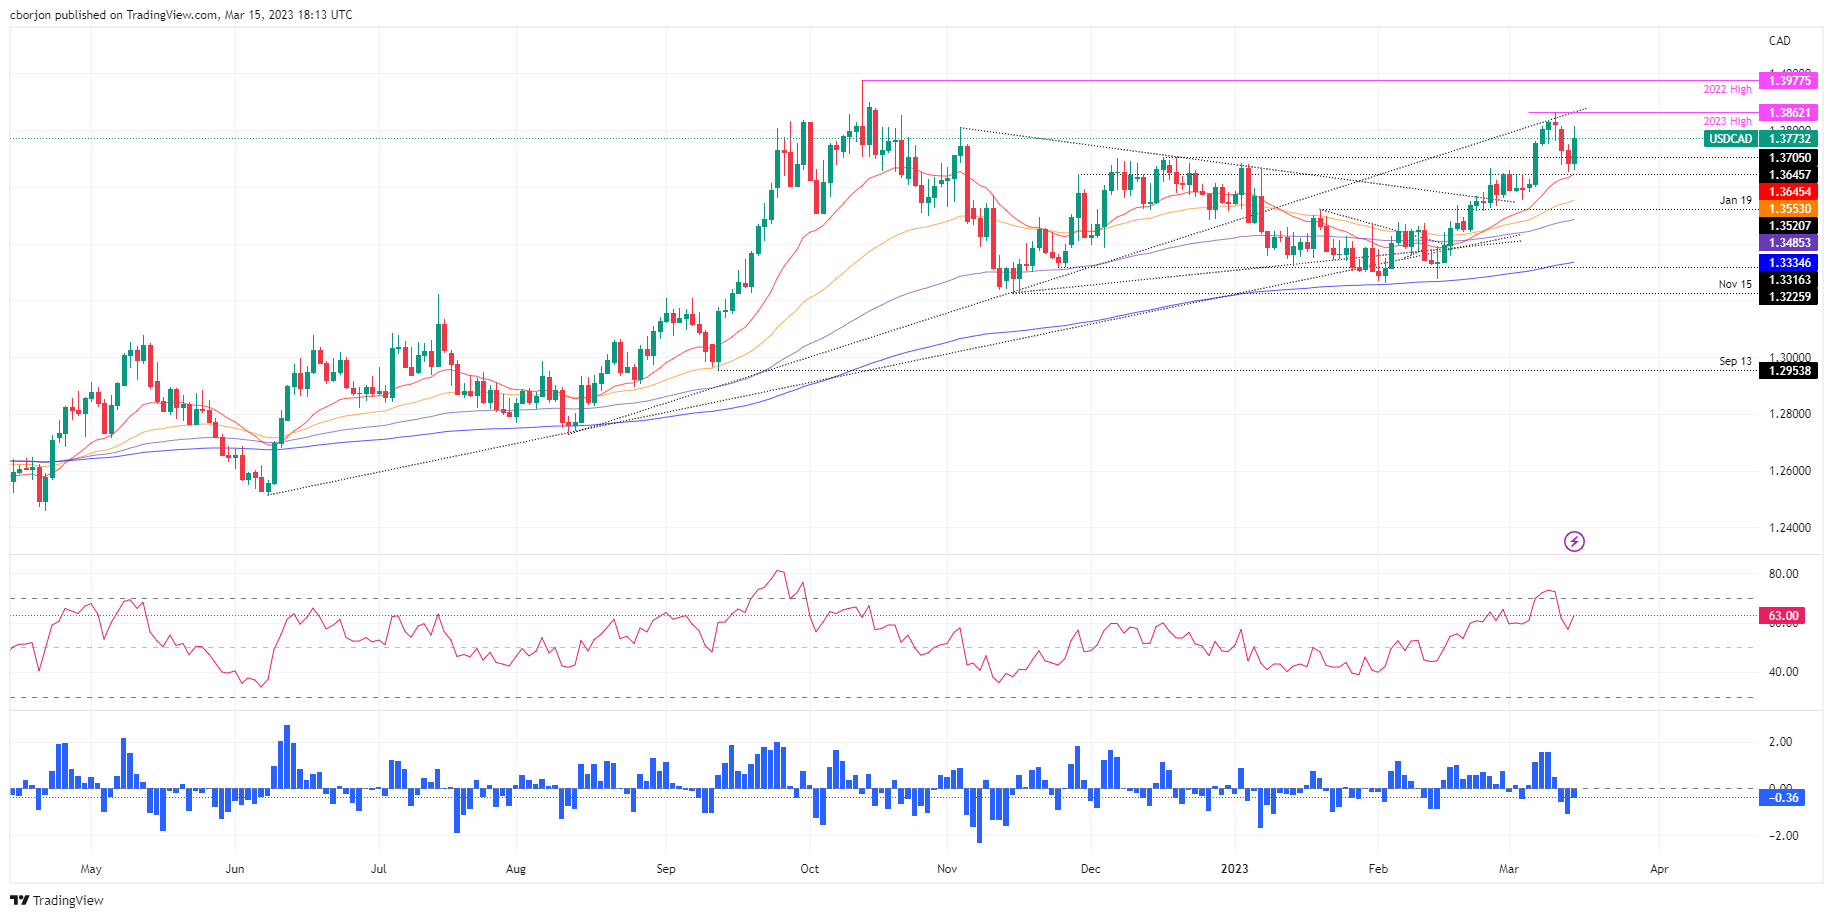
- USD/CAD climbs on market sentiment deterioration, as investors seeking safety bolstered the US Dollar.
- US Retail Sales were lower than expected, but prices paid by producers cooled.
- USD/CAD Price Analysis: To resume its uptrend, buyers are eyeing 1.3900.
USD/CAD rallies on safe-haven flows towards the greenback sponsored by the US financial banking crisis woes threatening to spread around the globe. The failure of two banks in the United States (US) spurred a sell-off in Credit Suisse’s (CS) stock, amongst increasing fears of a financial crisis. Therefore, the USD/CAD is trading at 1.3774 after hitting a low of 1.3659.
Sentiment shifts negative, bolstering the US Dollar
Investors’ mood remains deteriorated, as shown by global equities treading water. Wall Street continues to trade with losses amidst a possible default by Credit Suisse, as more banks take less exposure to the latter. The CBOE Volatility Index (VIX), known as the fear index, shot up and reached the 30.00 level, portraying the sour sentiment in the financial markets.
In the meantime, economic data from the United States (US) witnessed Retail Sales plunging 0.4% MoM vs. estimates of 0.3% contraction. Even though it’s a negative print, January’s 3.2% jump and February’s data still show that Americans are spending at a slower pace. At the same time, the US Bureau of Labor Statistics revealed that prices paid by producers in February, also known as the Producer Price Index (PPI), dropped 0.1% MoM, beneath forecasts of 0.3% expansion. Core PPI was 0%, below estimates for a 0.4% increase, showing signs that prices are heading downwards amidst the Fed’s aggressive tightening cycle of 20220.
Therefore, safe-haven flows bolstered the US Dollar (USD), with the US Dollar index advancing 1.13%, at 104.836. However, US Treasury bond yields have been punished by investors, with US 2s and 10s extending their losses, each down by 37 basis points (bps) and 24 bps, respectively, at 3.889% and 3.453%.
On the Canadian side, Housing Starts in February exceeded estimates of 220K, rising to 224K units from 216.5K revised in January, according to the Canadian Mortgage and Housing Corporation (CMHC).
Therefore, the USD/CAD would remain underpinned by market sentiment and flows toward safety. In addition, the Bank of Canada (BoC) pausing interest rate increases would keep the US Dollar underpinned by the interest rate differential. This means the USD/CAD bias remains upwards.
USD/CAD Technical analysis
The USD/CAD is still upward biased, snapping three days of consecutive losses. Although the pair tested the 20-day Exponential Moving Average (EMA) at 1.3645, it jumped from that area and formed a bullish engulfing candle chart pattern. Oscillators remain in bullish territory, except for the Rate of Change (RoC), which shows that selling pressure is waning, about to cross above neutral.
In case of a bullish continuation, the USD/CAD first resistance would be 1.3814, today’s high. A breach of the latter will expose the YTD high at 1.3862 before the pair edges to 1.3900. As an alternate scenario, the USD/CAD cracking the 20-day EMA at 1.3645 would pave the way toward the 50-day EMA At 1.3550.
- GBP/USD weighed by safe-haven US Dollar buying in face of a banking crisis.
- Bob Michele, JPMorgan Asset Management CIO and global head of fixed income said Credit Suisse is the tip of the iceberg.
GBP/USD continuation traders are in the market as renewed unease gripped world markets on Wednesday on the news that Credit Suisse's largest investor said it could not provide the Swiss bank with more financial assistance, prompting the Swiss bank's CEO to make new assurances on its financial strength.
Credit Suisse has been battling to recover from a string of scandals that have undermined the confidence of investors and clients and the institution´s plunging stock price has re-ignited jitters among investors about the resilience of the global banking system following the collapse of Silicon Valley Bank last week. Credit Suisse CEO Ulrich Koerner moved to calm nerves, saying the bank's liquidity base remained strong and was well above all regulatory requirements.
However, investors are worried that a full-blown global banking crisis may be brewing with some analysts saying that Credit Suisse is the tip of the iceberg. Bob Michele, JPMorgan Asset Management CIO and global head of fixed income, says Credit Suisse shows the lagged impact of central bank tightening have caught up during an interview with Jonathan Ferro on "Bloomberg The Open," saying that this is the tip of the iceberg with a lot more consolidation and pain to come, ´´so you put your money into the highest quality assets that you can find´´. He also says that the Federal Reserve should pause.
In this regard, concerns about the Swiss bank triggered a sharp decline in European and US bond yields as investors questioned if the Federal Reserve and other central banks can keep hiking interest rates to curb inflation. Two-year Treasury notes, which move in step with interest rate expectations, have tumbled 98 basis points in the last five days, the biggest drop since the week of Black Monday on Oct. 19, 1987. On Wednesday, they have fallen from 4.413% to pay as low as 3.72%. As recently as last week, markets braced for the return of large Fed interest rate rises but markets are now pricing in an 80% chance of a 25 basis point Federal Reserve hike next week and are pricing in a 50% chance of no change. Moreover, the December Fed funds futures, which reflect the overnight rate that banks use to lend to each other has dropped to 3.62% in a sign market expects the Fed to be cutting interest rates by year's end, if not before.
Safe haven USD buying overshadows UK budget
Nevertheless, the US Dollar has rallied on safe-haven buying. DXY, an index that measures the greenback vs. a basket of currencies, vaulted 104 the figure on a tear all the way to 105.103, in turn, crushing everything in its way, including GBP, and despite the UK government´s budget.
The measures announced by Chancellor Jeremy Hunt are seen as an effort to support productivity and investment without adding strain on public finances, which would otherwise see GBP should react well. However, the risk-off themes have ignored such positive implications for Sterling so far. The Chancellor says the UK economy is on the right track and the government’s plan for the economy was “working” as he announced what he called a “budget for growth”.
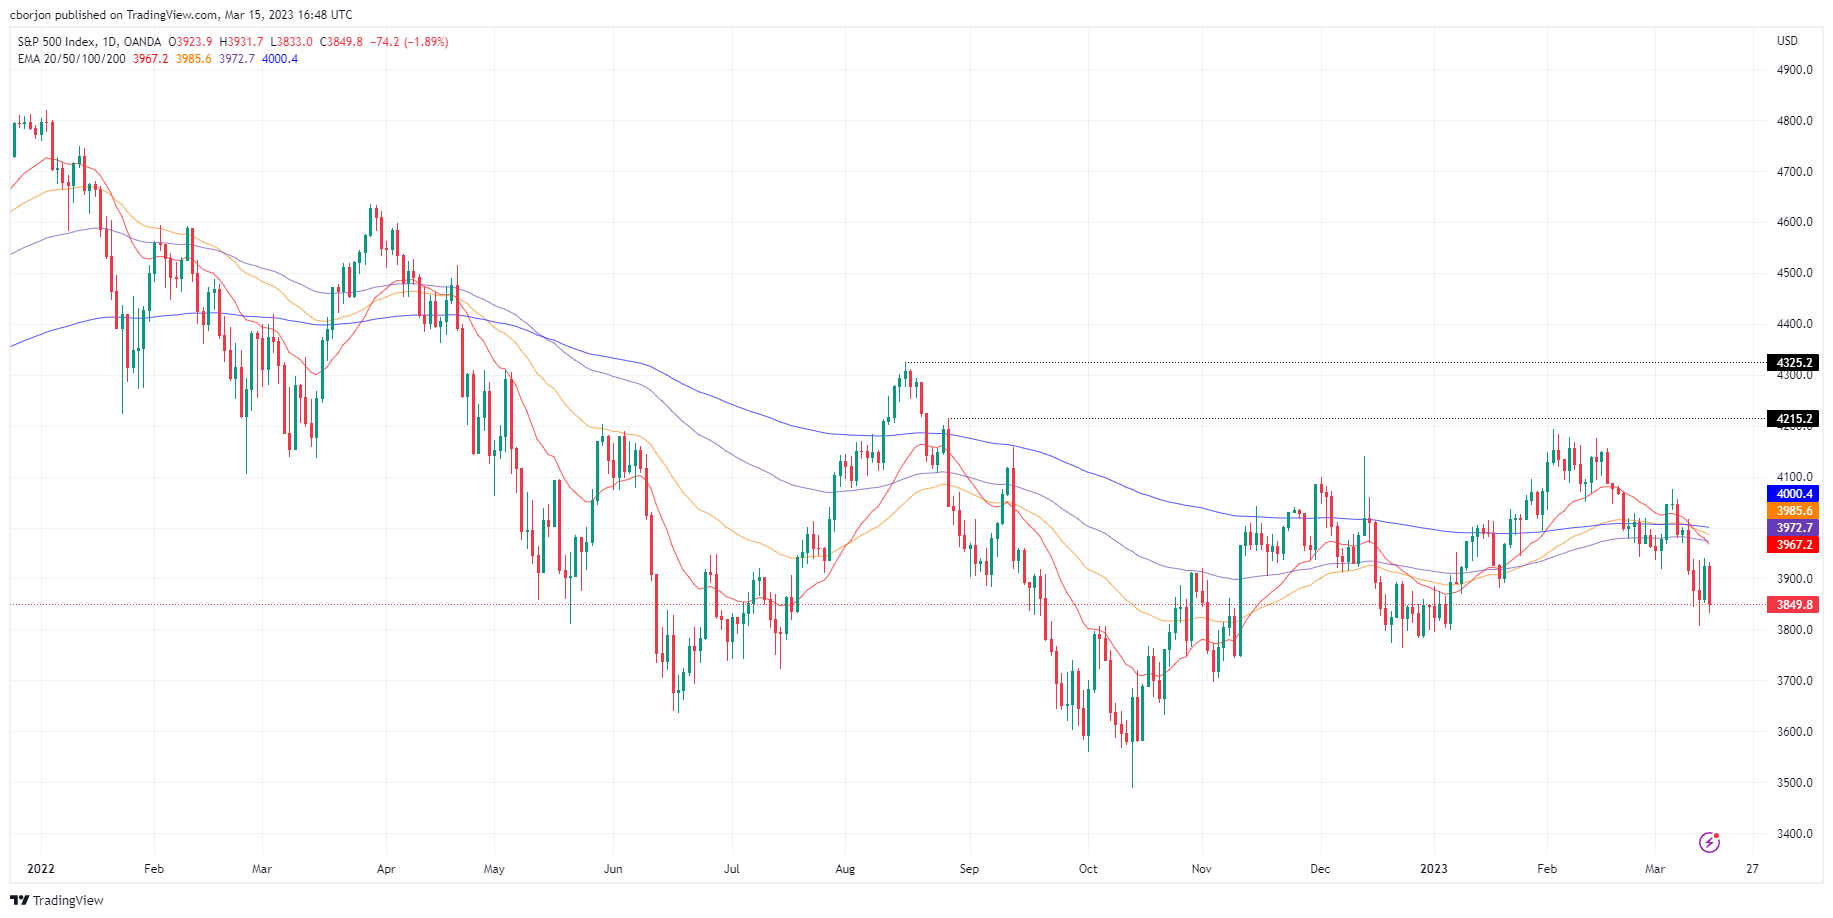
- The S&P 500, the Nasdaq 100, and the Dow Jones collapsed as the banking system crisis deepened.
- The US Producer Price Index cooled, while Retail Sales dropped after an outstanding January report.
- Investors expect the Federal Reserve to keep the Federal Funds Rate unchanged at the next meeting.
Wall Street collapsed as the banking crisis deepened, with Credit Suisse’s (CS) stock plunged 24% in the day amidst comments from its largest shareholder to not invest in the bank due to “regulatory and statutory reasons.” That has triggered a collapse in CS stock, while its Credit Default Swaps (CDS) are reaching levels last seen since the Global Financial Crisis (GFC).
Therefore, the S&P 500 is dropping 1.46%, at 3,862.14. Following suit is the heavy-tech Nasdaq 100, falling 0.76% at 11,342.55, while the Dow Jones is losing 1.74%, at 31,598.13.
Sentiment remains sour amidst the Credit Suisse panic sale. Bank’s shares across the board registered losses, while more than 80% of the S&P 500 stocks listed fell. Aside from this, the United States (US) economic calendar revealed the Retail Sales and Producer Price Index (PPI) for February. Retail Sales came lower than the expected plunge of 0.3% MoM, dropped 0.4%, in part blamed on the astonishing January report of 3.2%
The US Producer Price Index (PPI) dropped 0.1% MoM, the US Bureau of Labor Statistics reported today. Core PPI, which excludes volatile items like food and energy, cooled down from 0.4% estimates to 0%.
In the meantime, expectations for a 25 bps rate hike by the Federal Reserve (Fed) had waned. The CME FedWatch Tool odds for a 25 bps hike lie at 37%, with investors estimating no change to the Federal Funds rate (FFR) at next week’s meeting.
Sector-wise, Utilities and Communications Services are the two leaders of the pack, up 1.16% and 0.25%. The laggards are Energy and Materials, each losing 6.18% and 4.42%, respectively.
Meanwhile, the greenback is recovering after three days of consecutive losses, as the US Dollar Index shows, advancing 1.21% at 104.937. US Treasury bond yields continued to plunge across the curve, with 2s falling 43 bps, at 3.823%, while the 10-year dropping 28 bps at 3.410%.
What to watch
The US economic calendar will feature February Housing Starts, Building Permits, and Initial Jobless Claims.
S&P 500 Daily chart
- AUD/USD opens at 0.6679 and hits an intraday low of 0.6601 before settling at 0.6606.
- Critical concerns due to the Credit Suisse woes increase investor risk aversion.
- Traders await Australia’s Employment Change and Employment Rate data.
AUD/USD faces selling pressure on Wednesday as investors turned risk-averse amid growing concerns about recent catastrophic developments relating to Credit Suisse just after the collapse of Silicon Valley Bank (SVB).
Aussie prints an intraday low of 0.6601 before settling at 0.6606, down 1.09% on Wednesday at the press time.
The Credit Suisse predicament and expectations of a 25-basis-point (bps) hike – albeit lower than previously forecast – by the Federal Reserve (Fed) in March are still driving up the US Dollar's value.
The recent unsatisfactory macroeconomic reports from the US, which include a 0.1% decrease in the Producer Price Index (PPI) for February and a lower-than-expected core PPI rate, have not negatively impacted the US Dollar.
The US Retail Sales also falls by 0.4% in February, lower than the previous month's 3.2% increase and the anticipated 0.3% drop. In addition, the New York Fed's Empire State Manufacturing Index falls sharply to -24.6, below the predicted decrease to -8 from the previous -5.8.
However, concerns regarding a broader financial crisis continue to boost the US Dollar with safe-haven demand. Additionally, the Reserve Bank of Australia's (RBA) dovish shift, indicating that it might be nearing the end of its rate-hiking cycle, indicates that the AUD/USD pair is likely to trend downwards.
Key economic events:
Australia’s Employment Change s.a. (Feb) and Unemployment Rate s.a. (Feb), to be released at 00:30 GMT, is Thursday’s most critical vital data.
Additionally, traders will closely monitor the US Initial Job Claims data on Thursday at 12:30 GMT.
Technical View:
From a technical perspective, the AUD/USD pair remains in a downtrend, with the daily 20-SMA at 0.6747 acting as a significant resistance level.
Today’s high coincided with a major trendline joining the tops of the descending price trend since the start of February. The intraday decline that followed the retest of the trendline suggests the next move down in the bear trend may be unfolding. The March 10 lows are an obvious next target to the downside at 0.6565. A key support level also sits at 0.6580.
The daily 50-SMA at 0.6881 also adds to the downside pressure, indicating a bearish bias. The daily RSI(14) is currently at 36.970, suggesting that the pair is close to entering oversold territory, and there is an increased risk AUD/USD price may consolidate prior to further losses.
The pair's intraday high of 0.6712 forms the immediate resistance, followed by the 38.2% Fibonacci level at 0.6671, the daily pivot point at 0.6670, and the resistance levels at 0.6709, 0.6735, and 0.6773.
- Crude oil prices tumble on market jitters and inventories.
- Stocks indexes move sharply lower on banking concerns.
- WTI heads for the lowest close since December 2021.
Crude oil prices are falling sharply again on Wednesday as markets continue to be shaken by banking-industry concerns. Adding to the downside, the latest EIA weekly reports showed US inventories rose last week.
WTI in free fall
As of writing, WTI is trading at $67.40, at the lowest level since December 2021, down 5.45% for the day. Since the beginning of the week, it lost 11.5%.
Risk aversion is driving commodities and shares sharply lower on Wednesday. Concerns about the health of Credit Suisse spread fear across financial markets.
Adding weight to Crude Oil prices, the Energy Information Administration (EIA) informed that crude inventories rose by 1.55 million barrels last week, above expectations. It was the eleventh increase in inventories out of the past 12 weeks.
Technical factors contribute to the sharp decline in WTI. The price broke on Tuesday below the critical $73.00 support and on Wednesday fell below December 2022 lows and also cracked the $70.00 mark. The chart shows clearly oversold readings but, so far, no sign of an immediate pause. The next strong level emerges around $66.00/20.
WTI Technical levels
Gold has found a floor as expected above its 200-Day Moving Average (DMA), currently seen at $1,775. A weekly close above $1,890/1900 is needed to clear the way for a retest of $1,973/90, strategists at Credit Suisse report.
55-DMA at $1,869 now holds to keep XAU/USD within its range
“A solid weekly close above $1,890/1900 is needed to clear the way for a retest of $1,973/98. Beyond here stays seen needed to reassert an upward bias for a test of long-term resistance from the $2,070/72 record highs of 2020 and 2022.”
“Ideally, the 55-DMA, currently seen at $1,869 now holds to keep the precious metal within its range. Nevertheless, if this would break, we could see further weakness toward the recent range low at $1,804, before the crucial 200-DMA, currently seen at $1,775, which we would once more expect to provide a floor.”
- EUR/GBP extends its losses amidst fear of further contagion in the financial markets.
- Sentiment shifting sour punishes the Euro ahead of the European Central Bank interest rate decision.
- EUR/GBP Price Analysis: To extend its downtrend in the near term.
EUR/GBP dropped sharply from around two-day highs of 0.8843 as the UK Finance minister Jeremy Hunt unveiled the new budget that would get Britain out of stagnation. Therefore, the Pound Sterling (GBP) appreciates, even though an upcoming European Central Bank (ECB) interest rate decision is approaching. At the time of writing, the EUR/GBP trades at 0.8735, down by 0.93%.
EUR/GBP drops on expectations of a lower ECB rate hike
Market sentiment remains negative. The failure of some banks in the United States (US) has spread around the globe, with Credit Suisse (CS) sinking 13% after one of its top holders ruled out investing more. That has triggered the alarms around Europe, with traders expecting the European Central Bank (ECB) would hike rates by just 25 bps, as World Interest Rates Probabilities (WIRP) hinted.
In Eurozone (EU) data, Industrial Production recovered in January, as shown by official data on Wednesday. The report highlighted an improvement in manufacturing. EU’s Industrial Output rose 0.7% MoM vs. 0.4% estimated and exceeded the previous print of -1.3%. Annually based, exceeded forecasts of 0.2%, jumped 0.9%.
In the UK, the latest employment report was solid, with the economy adding more people to the workforce and wages cooled. That released some pressure on the Bank of England (BoE) to continue to increase rates amidst an ongoing economic deceleration.
However, the spotlight of the day turned to UK’s budget. The Chancellor of the Exchequer, Jeremy Hunt, announced a plan to increase the pace of growth in the UK, which includes childcare and tax reforms.
Jeremy Hunt has announced a plan to extend help for households struggling with high energy bills and freeze a tax on gasoline. The plan will cancel the planned £500 hike in average energy bills, which was due to come into force next month, in a move that would see bills for the average household staying at around £1,138 a year
What to watch?
The UK economic docket is absent. On the Eurozone front, the European Central Bank (ECB) will reveal its monetary policy decision, followed by President Christine Lagarde’s press conference on Thursday.
EUR/GBP Technical analysis
The EUR/GBP retraced after peaking at around 0.8925 last week. Additionally, the cross fell below the 20, 50, and 100-day Exponential Moving Averages (EMAs), exacerbating a fall to test the 200-day EMA at 0.8701. However, the EUR/GBP fell shy of reaching the latter, though it tested the YTD lows at 0.8718. With oscillators turning negative, a bearish continuation of the EUR/GBP is the path of least resistance.
Hence, the EUR/GBP first support would be 0.8718, followed by the 200-day EMA at 0.8701. Once those levels are cleared, the pair would be headed toward the December 13 low at 0.8558.

Australia is set to report its February employment figures on Thursday, March 16 at 00:30 GMT and as we get closer to the release time, here are forecasts from economists and researchers at five major banks regarding the upcoming employment data.
Australia is expected to have added 48.5K jobs vs. -11.5K in January, while the unemployment rate is seen falling a tick to 3.6% even as the participation rate is set to rise a tick to 66.6%.
ANZ
“Like the RBA, we think the labour market will rebound in February. Our forecast is very strong employment growth of 90K, enough to have pushed unemployment back down to 3.5%. But if there’s another soft labour market result or if the other aforementioned prints prove lacklustre, this could keep the RBA on hold in April.”
ING
“The upcoming labour data will give an indication as to whether the previous releases were arbitrary or if there is confirmation that the economy really is slowing down. With the RBA indicating that it is getting close to peak cash rates, a much weaker employment number could even give rise to thoughts that rates may have already peaked at 3.6%.”
TDS
“One of the most closely watched employment prints in a long time. The larger-than-usual increase in u/e people in Jan, and the larger-than-usual rise in the number of u/e people who had a job to go to in the future suggests a bounce is likely. We forecast 47K jobs were added in Feb, the participation rate rising to 66.6%, keeping the u/e rate unchanged at 3.7%.”
SocGen
“We expect February’s labour market data to show a sizeable gain (40K) in employment after seeing consecutive dips in the months of December and January. The contraction in employment during those months can partially be ascribed to the changing seasonal patterns in hiring. This would lead to a significant increase in February that will offset the seasonal anomaly. But we also believe that the slowdown in employment growth has materialised due to consumption weakness, which is likely to be seen in the sustained decline in three-month moving average of employment change (from 35 in November to 3 in February if our forecast is correct). The unemployment rate will likely decline a bit (3.6%), while the participation rate is likely to remain largely unchanged. Hours worked is also expected to pick up after experiencing contraction in three consecutive months, showing the underlying momentum in economic growth. In conclusion, we foresee that employment data will continue to show signs of an easing in labour market conditions. This would support our base scenario that the 25 bps hike in April will be the final one under the current tightening cycle.”
CitiBank
“Citi employment change forecast; 56K,, Citi unemployment rate forecast; 3.5%, Citi participation rate forecast; 66.6%. The February labour force survey will be crucial to determine whether the RBA hikes or pauses in April. Strong employment gains are a necessary condition for the RBA to hike in the April Policy Board meeting. If the unemployment rate remains unchanged at 3.7% because of softer job growth – rather than strong labour force participation – then the odds of an RBA pause in April will increase.”
Economists at Société Générale see the S&P 500 Index Index trading between 3,500 and 4,200.
Marginally down to 3,800 by the end of the year
“1Q23: 4,200 in the first quarter has seen the peak for this year (early China-boom than expected but not a straight-line growth).”
“2Q23: 3,500 on increased Fed expectations, inflation uncertainty from June onwards and EPS downturn.”
“3Q23 and 4Q23: should see 3,800 as Fed peaks, US 10y yield visibly down, timing rate-cuts talks pick-up again, jobless claims should rise.”
- GBP/USD comes under pressure after climbing to 1.2180.
- The strong rebound in the greenback weighs on the risk complex.
- UK Chancellor Hunt delivered the Spring Budget.
In line with the rest of the risk-linked assets, GBP/USD faces renewed and strong downside pressure and revisits the 1.2040 region on Wednesday.
GBP/USD weaker on risk-off mood
GBP/USD adds to Tuesday’s decline and probes the area of 3-day lows in the 1.2045/40 band midweek on the back of the acute move higher in the greenback, which appears propped up by increasing risk aversion in the global market.
Indeed, the bearish mood among investors remains on the rise following fears over the European banking system, all exacerbated in response to negative news from Swiss lender Credit Suisse.
On the domestic front, Chancellor J.Hunt delivered the Spring Budget. On this, the Office for Budget Responsibility (OBR) now sees the economy avoiding a technical recession this year and expects inflation to drop to 2.9% at some point by year end. The OBR also sees the economy contracting just 0.2% this year and expanding 1.8% in 2024 and 2.5% in 2025.
What to look for around GBP
Same as with the rest of the risk complex, the British pound is expected to track the dollar’s price action and the policy divergence between the Federal Reserve and the Bank of England when it comes to near-term direction.
Furthermore, the UK economy’s bleak outlook for the remainder of the year in combination with persistent elevated inflation leaves the prospects for further gains in the Sterling somewhat curtailed in the short term, while the BoE approaching its terminal rate does not look helpful for the quid either.
GBP/USD levels to consider
As of writing, the pair is retreating 0.90% at 1.2045 and faces the next support at 1.1891 (200-day SMA) followed by 1.1802 (2023 low March 8) and finally 1.1142 (monthly low November 4 2022). On the flip side, the breakout of 1.2203 (monthly high March 14) would open the door to 1.2269 (weekly high February 14) and then 1.2447 (2023 high January 23).
- US Dollar Index rises 1% even as US yields tumble.
- Risk-off sentiment dominates Wall Street opening, Dow Jones drops by more than 500 points.
- EUR/USD suffers worst day in months, tests crucial support area.
The EUR/USD is falling sharply on Wednesday and recently printed a fresh two-month low at 1.0521. It is hovering around 1.0550, after testing a critical level. The US Dollar rocketed as markets tumbled on banking concerns.
USD up on risk aversion, despite yields and data
Economic data from the US came in below expectations, adding to expectations of a softer Federal Reserve. The economic figures are offset by ongoing developments around the banking crisis that crossed the Atlantic on Wednesday.
Fears about the health of Credit Suisse (CS) triggered a sell-off in banking shares across the globe. CS shares are falling 13% in Wall Street; after being down by almost 30%. Its monn shareholder, the Saudi National Bank, ruled out providing more money.
Government bonds are rising considerably, with yields hitting fresh lows. In Wall Street, the Dow Jones tumbles 1.85% and the Nasdaq drops by 1.45%.
ECB Preview: Set for 50 bps rate hike, Lagarde holds the key
In the currency market, the Japanese Yen is the best performer followed by the US Dollar. The Euro is falling against it main European competitors. EUR/GBP dropped to the its lowest level in two months below 0.8730 while EUR/CHF fell toward 0.8700.
The EUR/USD is losing more than 200 pips, on the worst day in months.
So far, EUR/USD’s slide found support at the critical area between 1.0500 and 1.0525, the confluence of previous lows and the 100-day Simple Moving Average. A consolidation below would open the doors to more weakness for the euro.
Technical levels
EUR/USD needs to move back above 1.0806 to ease the pressure off the 1.0483/63 key support, economists at Credit Suisse report.
Break above 1.0806 needed to reassert an upward bias
“EUR/USD continues to hold above key support from the 38.2% retracement of the 2022/2023 rally and early January YTD low at 1.0483/63 and our bias remains for this to hold for a broad range.”
“Above 1.0806 remains seen needed to reassert an upward bias for strength back to the 50% retracement of the 2021/2022 fall at 1.0944, then a retest of the 1.1035 YTD high.”
“Below 1.0463 though would mark a ‘head and shoulders’ top and a potentially more significant downturn, although we would still need to see the 200-DMA at 1.0326 removed to suggest this is indeed the case for support next at 1.0223/1.0198.”
- NZD/USD trades at 0.6206, down 0.47% at the press time.
- US Retail Sales data declines by 0.4%, a little more than the 0.3% expected.
- DXY maintains significant daily gains after US Retail Sales data, remaining above the 104.90 level.
Daily price movements:
NZD/USD sees a bearish intraday movement on Wednesday, with the last recorded price at 0.6206 where it appears to be temporarily finding a floor. The currency pair started the session at 0.6235, and the overall intraday price change was -0.47% at press time.
Daily economic events:
New Zealand’s Gross Domestic Product (GDP) (QoQ & YoY for Q4) is to be released by Statistics New Zealand on Wednesday (21:45 GMT). It highlights the overall economic performance on a quarterly and yearly basis.
Already out is Retail Sales for February from the United States. This showed a fall of 0.4% MoM to $697.9 billion, according to data from the US Census Bureau report on Wednesday. This figure follows a 3.2% increase in January and was slightly below market expectations, which predicted a decline of 0.3%.
Following this data, the US Dollar Index (DXY) maintains its upward momentum, printing a 1.30% increase on the day, trading above 104.90 at the press time. A relatively more substantial DXY pressures the NZD/USD currency pair ahead of New Zealand’s GDP data releases on Wednesday at 21:45 GMT.
Technical View:
The NZD/USD pair trades just below its daily 20-SMA (0.6195) and significantly below its 50-SMA (0.6313), indicating a bearish bias in short to medium term.
The daily RSI(14) of 47.057 suggests a nearly neutral momentum as the pair trades close to the 50 mark. However, the market may encounter some resistance, as the daily resistance levels are at 0.6257, 0.6278, and 0.6308.
The daily pivot point for the NZD/USD pair is 0.6228, slightly above the last intraday price at press time. The daily support levels are found at 0.6207, 0.6177, and 0.6157. If the pair manages to break above the pivot point, it may test the resistance levels, while a break below the pivot point could trigger a test of the support levels.
- EUR/USD melts down and revisits the area of multi-week lows.
- A deeper drop to the 2023 low should not be ruled out now.
EUR/USD comes under heavy selling pressure and fully reverses last week’s strong rebound, revisiting at the same time the 1.0520 area on Wednesday.
The pronounced sell-off carries the potential to retest the 2023 low near 1.0480 (January 6) ahead of the key 200-day SMA, today at 1.0323.
Looking at the longer run, the constructive view remains unchanged while above the 200-day SMA.
EUR/USD daily chart
Gold has surged to $1,930, its highest level since February 2. The yellow metal could stage a significant race higher, strategists at TD Securities report.
Do not fade the rally in Gold
“The risk of a dash-for-cash is mitigated by substantial physical demand in Gold and by neutral discretionary trader positioning.”
“The yellow metal still appears to offer the most competitive risk/reward on our screen as strong physical demand driven by the East should keep losses subdued if central banks remain on the war path to combat inflation despite bank liquidity concerns.”
“Risks that the tightening cycle is coming to an end should also realign discretionary flows with strong physical flows, which could translate into substantial upside.”
- USD/JPY witnessed an intraday turnaround from a fresh weekly high touched earlier this Wednesday.
- Credit Suisse crisis triggers a massive sell-off in equities and boosts demand for the safe-haven JPY.
- A blowout intraday USD rally lends some support to the pair and helps limit losses, at least for now.
The USD/JPY pair retreats sharply from a fresh weekly high, levels just above the 135.00 psychological mark touched earlier this Wednesday and drops to a fresh one-month low during the North American session. Spot prices, however, manage to rebound a few pips in the last hour and now seem to have stabilized just below the 133.00 round-figure mark.
The global risk sentiment takes a turn for the worst in reaction to negative news surrounding the Swiss lender Credit Suisse, which, in turn, boosts the safe-haven Japanese Yen (JPY) and exerts heavy downward pressure on the USD/JPY pair. In fact, the top shareholder of the troubled Swiss bank said that it won’t provide further financial support as a bigger holding would bring additional regulatory hurdles. The development raises the risk of an eventual default by the bank and triggers a massive sell-off across the global equity markets.
The JPY draws additional support from the fact that BoJ board members debated the feasibility of making further tweaks to the bond yield control at the January policy meeting. The BoJ meeting minutes released this Wednesday also showed a general agreement among policymakers that inflation and wages could overshoot expectations, suggesting a phase-out of its massive stimulus remained on the cards. Investors, however, seem convinced that the Japanese central bank will stick to its dovish stance to support the fragile domestic economy.
It is worth recalling that the incoming BoJ Governor Kazuo Ueda recently stressed the need to maintain the ultra-loose policy settings and said that the central bank isn't seeking a quick move away from a decade of massive easing. Apart from this, a blowout intraday US Dollar rally of over 1% helps limit losses for the USD/JPY pair, at least for now. Hence, it will be prudent to wait for some follow-through selling before positioning for an extension of the recent rejection slide from a technically significant 200-day Simple Moving Average (SMA).
Technical levels to watch
- DXY regains unusually strong upside traction and targets 105.00.
- The 100-day SMA at 104.95 emerges as the initial hurdle.
DXY gathers intense buying interest and climbs to 3-day highs near the 105.00 region on Tuesday, an area also underpinned by the temporary 100-day SMA.
The continuation of the strong rebound is expected to challenge the so far 2023 high at 105.88 (March 8) prior to the key 200-day SMA, today at 106.64.
Looking at the broader picture, while below the 200-day SMA, the outlook for the greenback is expected to remain negative.
DXY daily chart
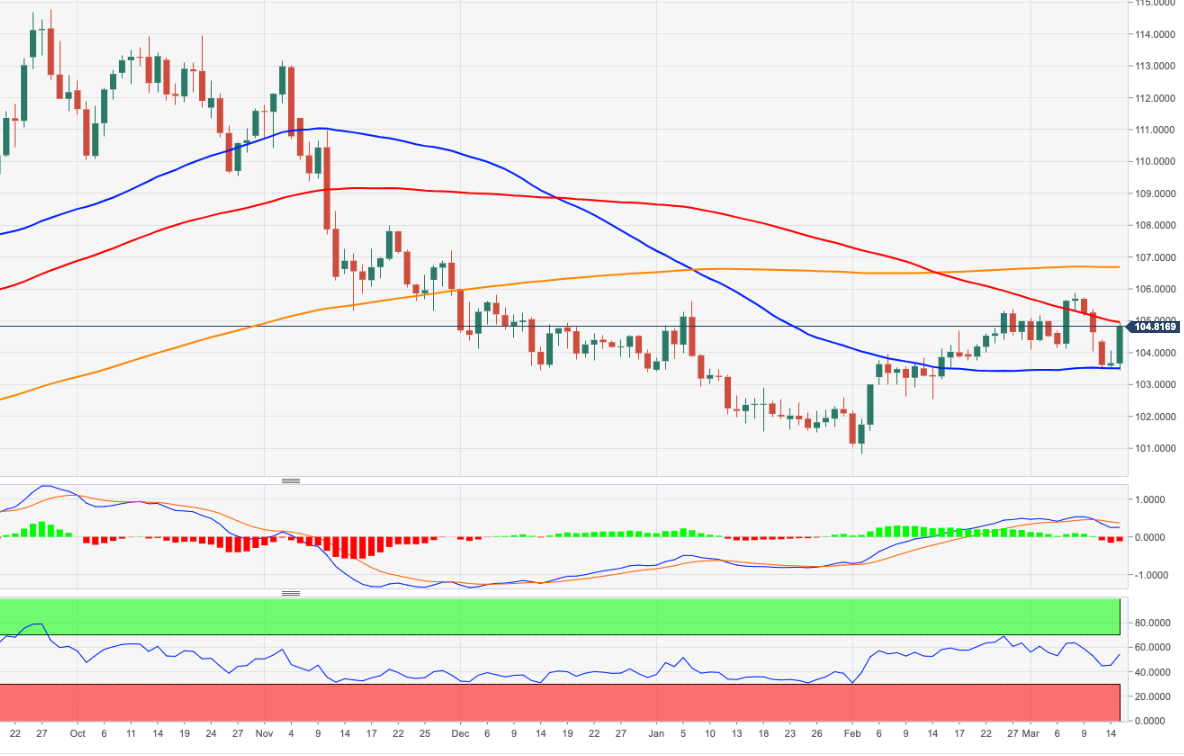
The US Dollar Index (DXY) has been capped at the 200-Day Moving Average (DMA) and 38.2% retracement of its fall from October at 106.15/62. Economists at Credit Suisse note that a retest of the 100.82 YTD low is on the cards.
Close above 200-DMA at 106.62 to warn of a more protracted phase of USD strength
“The DXY rally has been capped for from just ahead of the 38.2% retracement of the 2022/2023 fall and 200-DMA at 106.15/62 and our bias remains to view strength from January as corrective and we look for this to cap to define the top of a broader range.”
“A sustained close below the 55-DMA at 103.51 should add weight to our view but with a break below 102.59 still seen needed to clear the way for a retest of the 100.82 YTD low.”
“Should a close above the 200-DMA at 106.62 be seen this would warn of a more protracted phase of USD strength and a test of 107.80/99 next.”
- USD/CAD gains strong traction on Wednesday and draws support from a combination of factors.
- A fresh wave of the global risk-aversion trade, hawkish Fed expectations underpin the Greenback.
- A slump in Oil prices weighs heavily on the Loonie and remains supportive of the strong move up.
The USD/CAD pair attracts fresh buying near the 1.3660 region on Wednesday and snaps a three-day losing streak to a one-week low touched the previous day. The pair maintains its bid tone through the early North American session and is currently placed around the 1.3755-1.3760 area, just a few pips below the daily peak touched in the last hour.
A combination of supporting factors provides a strong boost to the US Dollar, which, in turn, is seen as a key factor acting as a tailwind for the USD/CAD pair. The US CPI report released on Tuesday indicated that inflation isn't coming down quite as fast as hoped and revived bets for at least a 25 bps rate hike by the Federal Reserve at its policy meeting on March 21-22. Apart from this, a fresh wave of the global risk-aversion trade, led by negative news surrounding the Swiss lender Credit Suisse, further benefits the Greenback's relative safe-haven status.
In fact, the top shareholder of the troubled Swiss bank said that it can't pump in any more money as a bigger holding would bring additional regulatory hurdles, fueling speculations that the bank will eventually default. This, in turn, triggered a massive sell-off across the global equity markets, which, to a larger extent, helps offset the mostly disappointing US macro data and continues to underpin the buck. the US Producer Price Index (PPI) unexpectedly declined by 0.1% in February and the yearly rate decelerated more than anticipated, to 4.6% from 5.7% in January.
Furthermore, the core PPI, which excludes food and energy prices, remained flat during the reported month and fell to a 4.4% YoY rate from 5.4% recorded in the previous month. Separately, the US monthly Retail Sales fell by 0.4% in February as compared to the strong 3.2% rise recorded in the previous month and the 0.3% decline expected. Adding to this, the New York Fed's Empire State Manufacturing Index plummets to -24.6 for the current month, missing estimates for a fall to -8 from the -5.8 previous, though does little to dent the intraday bullish sentiment around the USD.
Apart from this, a steep downfall in Crude Oil prices, to the lowest level since December 2021, is seen weighing heavily on the commodity-linked Loonie and extends additional support to the USD/CAD pair. This, along with the fact that the Bank of Canada (BoC) became the first major central bank to pause its rate-hiking cycle last week, suggests that the path of least resistance for spot prices is to the upside. Hence, a subsequent strength towards the 1.3800 mark, en route to the multi-month peak, around the 1.3860 touched earlier this March, looks like a distinct possibility.
Technical levels to watch
EUR’s gains have been tapped out around the mid-1.07s. Economists at Scotiabank believe that the EUR/USD pair could fall as low as 1.0500/50.
A clear technical peak looks to be developing
“Spot gains have faltered in the low/mid 1.07 area this week, reflecting resistance defined by the 40-DMA (1.0723) which EUR gains have failed to crack in a sustained manner.”
A clear technical peak looks to be developing; a low close for the pair today (at or near current levels) will form a bearish outside range day and the third leg of a bearish ‘evening star’ candle pattern. Combined, these pointers suggest more EUR losses ahead and a retracement in spot’s recent gains towards 1.0500/50 potentially.”
- US PPI drops unexpectable in February, Retail Sales decline more than expected.
- Credit Suisse shares hit new lows, tumbling by almost 30%.
- Gold bounces 2% from its daily low, and climbs to its highest since early February.
Gold price resume the upside on Wednesday, boosted by risk aversion across financial markets, triggered by worries about the health of Credit Suisse. The yellow metal rose further after the release of US data that came in below expectations, adding to speculations about a softer Federal Reserve.
XAU/USD peaked at $1,930, its highest level since February 2. From last week, gold has risen almost 8% supported by the sharp decline in global government bond yields.
Worries and data
The rally in gold has just receive another boost from US data. The US Producer Price Index dropped unexpectedly in February by 0.1%; market consensus was for a 0.3% increase. The core PPI stayed unchanged and the annual rate fell from 5.4% to 4.4%, well below the 5.2% expected. A different report showed retail sales fell by 0.4% in Febuary, more than the 0.3% estimated.
US economic numbers favors the scenario of a softer Fed that will have its meeting next week. US yield printed fresh lows, approaching to Monday’s bottom. The US 10-year yield is at 3.47% down 6% for the day; while the 2-year is at 3.90%.
Prior to US data, bonds were already on demand and gold was higher boosted by banking-industry jitters. Credit Suisse’s main shareholder, the Saudi National Bank ruled out providing more money and pushed banks stocks across the globe to the downside. Credit Suisse shares area falling almost 30%.
Technical levels
The VIX has surged higher after holding as expected its uptrend from 2017, but for now, the rise has been capped at the top of its broad range from January last year, seen starting at 32.35, economists at Credit Suisse report.
VIX is still in its broader sideways range
“The VIX has surged higher again after holding its long-term uptrend from late 2017 and recent low at 17.86/06 for a test of the top of its broader range from January 2022 at 32.35.”
“Only above 32.35 and then the 38.94 high of 2022 would warn this range has been resolved higher for a move to 50/53. Such a move though would be seen to likely accompany a sharp S&P 500 fall.”
- AUD/USD meets with a fresh supply on Wednesday amid a blowout intraday USD rally.
- Credit Suisse crisis, bets for a 25 bps Fed rate hike in March continue to boost the buck.
- The disappointing US macro data does little to influence the USD or provide any impetus.
The AUD/USD pair comes under fresh selling pressure on Wednesday, after failing to find acceptance above the 0.6700 mark, and continues to drift lower through the early North American session. The pair maintains its offered tone near the lower end of its daily range, around the 0.6640-0.6635 region and reacts little following the release of the US macro data.
The US Dollar catches aggressive bids in reaction to fresh worries about the European banking sector, fueled by negative news surrounding the Swiss lender Credit Suisse, and attracts some intraday sellers around the AUD/USD pair. In fact, the top shareholder of the troubled Swiss bank ruled out investing any more as a bigger holding would bring additional regulatory hurdles. The headwinds fuel speculations that the bank will indeed default and triggers a fresh wave of the global risk-aversion trade. This is evident from massive sell-off across the global equity markets, which, in turn, provides a strong boost to the safe-haven buck and weighs on the risk-sensitive Aussie.
Apart from this, reviving bets for at least a 25 bps rate hike by the Federal Reserve at its next meeting on March 21-23 seems to lend additional support to the Greenback, which remains unaffected by the disappointing US economic releases. In fact, the US Bureau of Labor Statistics reported that the Producer Price Index (PPI) unexpectedly declined by 0.1% in February and the yearly rate decelerated more than anticipated, to 4.6% from 5.7% in January. Furthermore, the core PPI, which excludes food and energy prices, fell short of market estimates, remaining flat during the reported month and falling to a 4.4% YoY rate from 5.4% recorded in the previous month.
Separately, the US monthly Retail Sales fell by 0.4% in February as compared to the strong 3.2% rise in the previous month and the 0.3% decline expected. Adding to this, the New York Fed's Empire State Manufacturing Index plunged to -24.6 for the current month, missing consensus estimates pointing to a fall to -8 from the -5.8 previous. The weaker data, however, is largely offset by fears about a broader systemic crisis, which continues to benefit the USD. This, along with the Reserve Bank of Australia's (RBA) dovish shift, signalling that it might be nearing the end of its rate-hiking cycle, suggests that the path of least resistance for the AUD/USD pair is to the downside.
Technical levels to watch
- EUR/JPY last trades at 140.68, down 2.34% from the previous close.
- The pair trades between 140.61 and 144.98 during Wednesday's session
- The short-term vital events are Japan’s export/import/trade balance and ECB’s rate decision.
Daily price movements:
EUR/JPY sees a strong bearish intraday movement on Wednesday and trades slightly above the lowest intraday price of 140.61 – spectacularly below the highest intraday price of 144.98. The overall intraday price change stands at -2.34% at press time.
Key economic events:
Fear of contagion within the European banking sector causes the sharp decline in the Euro, after the news on Wednesday that Credit Suisse’s largest investor has pulled its support for the Swiss lender.
The unexpected event, which follows on from the demise of Silicon Valley Bank over the weekend, suggests the European Central Bank (ECB) may be more accommodative at its monetary policy meeting on Thursday, March 16.
Previously economists had expected the central bank to raise interest rates by 50 basis points (bps) at the meeting to combat the effects of persistent inflation, however, given the risks this might cause to liquidity within the banking sector, it is more likely central bankers will opt for a smaller rate hike or none at all.
This is causing the current steep sell-off in the Euro since higher interest rates tend to support currencies and lower to weaken them. This is due to the effect of the carry trade, in which global investors borrow in a currency with a low interest rate to purchase a currency with a high interest rate.
Preciently, economists at German lender Commerzbank raised the risks of contagion to the Euro in a recent analyst’s note, "From the market's perspective, the ECB has unexpectedly emerged as one of the most hawkish central banks, which could bolster the Euro as long as there are no contagion effects in the European banking sector." Said the bank’s research.
For Yen traders it is also essential to closely follow the Japan Exports/Imports/Merchandise Trade Balance (23:50 GMT) on Wednesday. The ECB Monetary Policy Decision Statement, meanwhile, is scheduled for release on Thursday at 13:15 GMT.
Technical View:
The EUR/JPY pair is falling steeply, and has been trading below its daily 20-SMA (143.94) and daily 50-SMA (142.12), signaling a bearish trend in the short to medium-term. The currency pair also fell below the 38.2% Fibonacci level at 143.69 and the 61.8% Fibonacci level at 143.25, suggesting further bearish pressure.
The daily RSI(14) of 38.974 indicates a bearish momentum as the pair trades below the 50 mark. However, the market may encounter some resistance, as the daily resistance levels are 144.80, 145.54, and 146.67.
The daily pivot point for the EUR/JPY pair stands at 143.66, which is significantly above the last intraday price at press time. The daily support levels are found at 142.92, 141.79, and 141.04. If the pair manages to break above the pivot point, it may test the resistance levels, while a break below the pivot point could trigger a test of the support levels.
GBP/USD has managed to avoid a top but with a break above 1.2270 needed to reassert an upward bias, analysts at Credit Suisse report.
Sustained close below 1.898/41 would see a top established
“GBP/USD has reversed its albeit brief move below its 200-DMA and key 1.1841 January low and thereby avoiding a ‘double top’. Above the 1.2270 mid-February high and downtrend from February 2022 though is needed to clear the way for a fresh look at the 1.2447/49 YTD highs, where we would look for a fresh cap again.”
“Below 1.2028 is needed to warn of weakness back to the 200-DMA and price support at 1.1898/41. Only a sustained close below here in our view would see a top established.”
- US annual PPI in February declined at a faster pace than expected.
- US Dollar clings to strong daily gains at around 104.70.
The Producer Price Index (PPI) for final demand in the US declined to 4.6% on a yearly basis in February from 5.7% in January. the data published by the US Bureau of Labor Statistics revealed on Wednesday. This reading came in much lower than the market expectation of 5.4%.
The annual Core PPI dropped to 4.4% in the same period from 5.4%, compared to analysts' estimate of 5.2%. On a monthly basis, the Core PPI came in at 0%.
Market reaction
The US Dollar Index preserves its bullish momentum after this data and was last seen rising 1% on the day at 104.70.
- Retail Sales in the US declined more than expected in February.
- US Dollar Index clings to strong daily gains above 104.50.
Retail Sales in the United States declined by 0.4% on a monthly basis in February to $697.9 billion, the US Census Bureau reported on Wednesday. This reading followed January's expansion of 3.2% and came in slightly worse than the market expectation for a decrease of 0.3%.
"Total sales for the December 2022 through February 2023 period were up 6.4% from the same period a year ago," the press release further read. "The December 2022 to January 2023 percent change was revised from up 3.0 to up 3.2%."
Market reaction
This data failed to have a significant impact on the US Dollar's performance against its major rivals. As of writing, the US Dollar Index was up 0.9% on the day at 104.60.
- EUR/JPY drops heavily and breaks below the key 200-day SMA.
- Further weakness could see the February low revisited near term.
The abrupt sell-off forces EUR/JPY to break below the 141.00 mark and leave behind the key 200-day SMA at 141.77 at the same time.
The sharp retracement could now motivate the cross to challenge the February low at 139.54 (February 10), while the breach of the latter could put a potential drop to the 2023 low at 137.38 (January 3) back on the radar.
Below the 200-day SMA the outlook for the cross is expected to shift to negative.
EUR/JPY daily chart
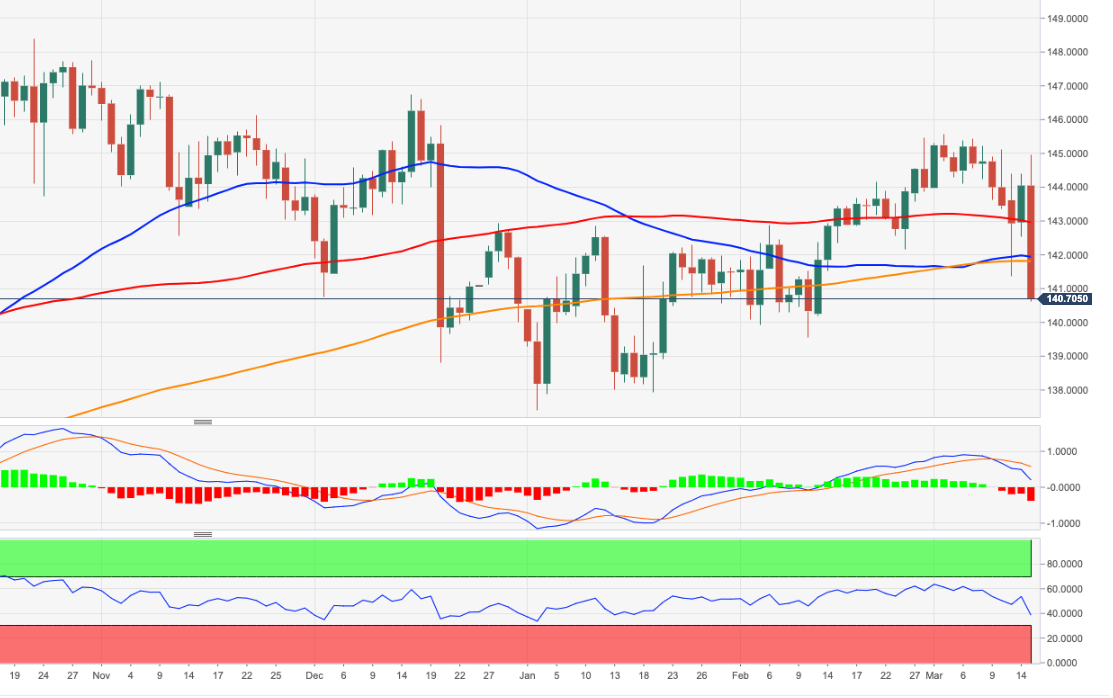
USD/JPY will likely remain volatile over the near term. Economists at HSBC modify their USD/JPY forecasts for the upcoming quarters but maintain their year-end 2023 view of 120.
The rationale supporting JPY’s appreciation in 2023 remains intact
“We expect USD/JPY to be quite volatile over the near term because of external uncertainties; however, a stock-take of the four domestic factors – the BoJ’s policy tweak, residents’ FX hedging, current account improvement, the JPY’s ‘safe haven status’ – we believe would support the JPY suggests that the rationale remains intact, even if some developments may be taking a longer time to materialise.”
“We make some small changes to our quarterly projections for USD/JPY and leave our year-end 2023 forecast unchanged at 120.”

Source: HSBC forecasts
USD trades broadly higher on weak risk appetite and continued focus on banks. Investors face another difficult day, economists at Scotiabank report.
Focus on European banks
“Weak Credit Suisse shares (down 21% to a new, record low following news that its top shareholder ruled out more assistance for the bank) has emerged as a key driver of sentiment.”
“The plunge in CS shares has prompted a drop in global stocks, particularly European banks, and a jump in the USD.”
“It looks like another difficult day for markets and investors.”
- USD/CHF gains strong positive traction on Wednesday amid a blowout intraday USD rally.
- Negative news surrounding Credit Suisse boosts the USD’s global reserve currency status.
- Bets for at least a 25 bps Fed rate hike in March support prospect for a further upside.
The USD/CHF pair catches aggressive bids during the mid-European session and rallies to a fresh weekly top, above mid-0.9200s in the last hour.
The latest leg of a sudden spike is led by negative news surrounding the Swiss lender Credit Suisse, In fact, the top shareholder of the Swiss bank ruled out investing any more in the troubled Swiss bank as a bigger holding would bring additional regulatory hurdles. Moreover, the Swiss National Bank (SNB) offers no comment on the Credit Suisse situation and fuels speculations that the bank will indeed default. This triggers a massive sell-off across the global equity markets, which boosts the US Dollar's status as the global reverse currency and turns out to be a key factor behind the USD/CHF pair's steep intraday rise.
The Greenback is drawing additional support from reviving bets for at least a 25 bps rate hike by the Federal Reserve at its next policy meeting on March 21-22. The market expectations were reaffirmed by the latest US CPI report released on Tuesday, which indicated that inflation isn't coming down quite as fast as hoped. This, in turn, favours the USD bulls and supports prospects for a further near-term appreciating move for the USD/CHF pair, which has now recovered nearly 200 pips from its lowest level since early February, around the 0.9070 region touched on Monday.
Market participants now look to the US economic docket - featuring the release of the Producer Price Index (PPI), monthly Retail Sales figures and the Empire State Manufacturing Index. The data might influence the USD price dynamics and provide a fresh impetus to the USD/CHF pair. The focus, however, will remain on the looming banking crisis, which should continue to infuse volatility in the financial markets and allow traders to grab short-term opportunities.
Technical levels to watch
GBP slips on stronger USD. Cable could extend its decline to the 1.1950 area, economists at Scotiabank report.
Losses through 1.2140/50 cast a shadow over near-term prospects
“Intraday losses for Cable through 1.2140/50 cast a shadow over near-term prospects.”
“GBP/USD failed around 1.22 twice over the past couple of weeks, setting up a minor double top, which has been triggered by the GBP’s losses through 1.2140 (now resistance).”
“Downside risks extend to 1.2080 (measured move potential) at least and could extend back to around 1.1950.”
USD/JPY looks to be staging a more decisive rejection from the 137.10/40 recovery target as looked for. Economists at Credit Suisse expect the broader downtrend to reassert itself.
Weekly close above 137.51 to open up next resistance at 139.54/59
“USD/JPY looks to have finally seen a more decisive rejection of our recovery target of the 200-DMA and 38.2% retracement of the 2022/2023 fall at 136.67/137.40 and we continue to look for the broader downtrend to reassert itself.”
“A close below the 55-DMA at 132.50 is needed to add weight to our view for a fall to support next at 129.80 and eventually the 127.53/23 lows again.”
“Above 137.51 on a weekly closing basis would suggest a more important low was established in January and strength can extend further with resistance next at the 50% retracement of the fall from October at 139.54/59.”
- Silver (XAG/USD) price extends its recent rises following SVB’s collapse.
- The pair trades between $21.55 and $21.92 on Wednesday.
- Daily RSI(14) at 55.369, indicating slightly bullish momentum.
Daily price movements:
XAG/USD (Silver) sees a modestly bullish intraday movement on Wednesday, with the last recorded price at $21.81. The commodity starts the session at $21.69, the previous close, and fluctuates between the lowest intraday price of $21.55 and the highest intraday price of $21.92. The overall intraday price change stands at +0.55% at press time.
Daily economic events:
On Wednesday, USD/JPY traders should closely monitor the US February Retail Sales (12:30 GMT) and the US Producer Price Index (excluding food and energy at 12:30 GMT) data.
Technical View:
XAG/USD pair has been trading above its daily 20-SMA ($21.11) but below its 50-SMA ($22.38), indicating mixed signals in short to medium term. Silver price has broken above the $21.30 highs, the last lower high of the previous downtrend, which is a bullish signal and increases the probabilities the trend may be reversing.
Daily RSI(14) of 55.369 indicates a slightly bullish momentum as the pair trades above the 50 mark. However, the market may encounter some resistance, as the daily resistance levels are $21.96, $22.22, and $22.46.
The daily pivot point for the XAG/USD pair is $21.72, close to the last intraday price at press time. The daily support levels are $21.46, $21.22, and $20.96. If the pair manages to break above the pivot point, it may test the resistance levels, while a break below the pivot point could trigger a test of the support levels.
EUR/CHF has broken key support at 0.9837/16. The pair could suffer a substantial drop to the 0.9411 lows, analysts at Credit Suisse report.
Key resistance moves to 0.9858/90
“Next key support is seen at 0.9714/12, then 0.9643. However, we certainly do not rule out a move all the way to the 0.9411 lows if risk sentiment deteriorates more sharply.”
“Key resistance moves to 0.9858/90, which is the 200-DMA and broken trendline, which now ideally caps to keep the risks skewed lower.”
US Monthly Retail Sales Overview
Wednesday's US economic docket highlights the release of monthly Retail Sales figures for February, due later during the early North American session at 12:30 GMT. The headline sales are expected to decline by 0.3% during the reported month, partly reversing a strong 3% increase recorded in January. Excluding autos, core retail sales probably fell by a modest 0.1% in February, as compared to the 2.3% rise in the previous month.
Analysts at NBF offer a brief preview of the report and write: “Car dealers likely contributed negatively to the headline number, as auto sales fell during the month. Gasoline station receipts, meanwhile, could have stayed more or less unchanged judging by the stagnation in pump prices. All told, headline sales could have contracted 0.7%, erasing only a fraction of January’s gain. Spending on items other than vehicles could have fared a little better, retreating just 0.5%.”
How Could it Affect EUR/USD?
Ahead of the key release, reviving bets for at least a 25 bps Fed rate hike at the March policy meeting act as a tailwind for the US Dollar. A stronger US macro data will reaffirm hawkish Fed expectations and provide an additional boost to the buck. Conversely, any disappointment is more likely to be offset by a fresh wave of the global risk-aversion trade, led by worries that Credit Suisse will indeed default, which should continue to benefit the Greenback's safe-haven status. This, in turn, suggests that the path of least resistance for the EUR/USD pair is to the downside. Traders, however, might refrain from placing fresh bearish bets heading into the crucial European Central Bank (ECB) meeting on Thursday.
Meanwhile, Eren Sengezer, Editor at FXStreet, offers a brief technical outlook and outlines important technical levels: “EUR/USD's action on Tuesday confirmed that static resistance area have formed at 1.0750/60. A four-hour close above that hurdle could open the door for a leg higher toward 1.0800 (psychological level, static level) and 1.0850 (static level from January).”
“On the downside, 1.0700 (static level, psychological level, 200-period Simple Moving Average (SMA) on the four-hour chart) aligns as key support. If that level fails, sellers could show interest and drag EUR/USD down to 1.0640 (50-period SMA) and 1.0620 (100-period SMA),” Eren adds further.
Key Notes
• US Retail Sales Forecast: Correction following January surge – Previews by eight banks
• EUR/USD Forecast: Euro likely to hold its ground ahead of ECB
• EUR/USD nose-dives to 3-day lows and threatens 1.0600
About US Retail Sales
The Retail Sales released by the US Census Bureau measures the total receipts of retail stores. Monthly per cent changes reflect the rate of changes in such sales. Changes in Retail Sales are widely followed as an indicator of consumer spending. Generally speaking, a high reading is seen as positive (or bullish) for the USD, while a low reading is seen as negative (or bearish).
The Pound remains the second best performing G10 currency on a year-to-date basis, with only the Swiss Franc outperforming. Today, Chancellor Hunt will present his first scheduled budget following his emergency budget last November. Economists at MUFG Bank expect GBP to perform better ahead.
Budget in focus
“Much of the focus will be on trying to expand the potential growth rate of the economy. The budget is expected to include capital allowances to encourage business investment. There will also be changes to the taxation of pensions that will allow higher pension pots to be built without being taxed more onerously. The current framework is being blamed for curtailing labour supply in the 50-64 age bracket.”
“The budget is unlikely to be a market-mover (unless there are some growth-positive surprises) but today could serve as a reminder that the high and sustained level of uncertainty and pessimism linked to the UK in recent years has passed and that certainly points to the potential for better GBP performance ahead.”
- EUR/USD rapidly leaves behind monthly highs near 1.0760.
- Final February CPI in France surpassed the advanced prints.
- Risk aversion picks up pace on renewed concerns around banks.
The sharp resurgence of the risk aversion forced EUR/USD to quickly correct lower and trade at shouting distance from the key 1.0600 neighbourhood on Wednesday.
EUR/USD weaker on USD-buying
EUR/USD came under renewed and quite heavy selling pressure after negative news surrounding the Swiss lender Credit Suisse reignited the interest for the safe haven universe.
Against that, the demand for the greenback gathered renewed impulse and lifted the USD Index (DXY) to new highs north of the 104.00 barrier in a context where US and German yields resumed the downtrend.
Data wise in the region, final inflation figures in France came in a tad above the preliminary readings for the month of February and showed the CPI rising 1.0% MoM and 6.3% over the last twelve months. In the euro bloc, the Industrial Production expanded at a monthly 0.7% in January and 0.9% from a year earlier.
Across the ocean, all the attention will be on Producer Prices and Retail Sales seconded by MBA Mortgage Applications, the NY Empire State Manufacturing Index, Business Inventories, the NAHB Housing Market Index and TIC Flows.
What to look for around EUR
EUR/USD comes under intense downside pressure as concerns (this time) surrounding the European banking sector picked up pace and triggered a flight-to-safety mood among market participants.
In the meantime, price action around the European currency should continue to closely follow dollar dynamics, as well as the potential next moves from the ECB past the March meeting, when the bank has already anticipated another 50 bps rate hike.
Key events in the euro area this week: EMU Industrial Production (Wednesday) – ECB Interest Rate decision, ECB Lagarde (Thursday) – EMU Final Inflation Rate (Friday).
Eminent issues on the back boiler: Continuation of the ECB hiking cycle amidst dwindling bets for a recession in the region and still elevated inflation. Impact of the Russia-Ukraine war on the growth prospects and inflation outlook in the region. Risks of inflation becoming entrenched.
EUR/USD levels to watch
So far, the pair is retreating 1.01% at 1.0626 and faces the next contention at 1.0555 (100-day SMA) seconded by 1.0524 (monthly low March 8) and finally 1.0481 (2023 low January 6). On the upside, the breakout of 1.0759 (monthly high March 15) would target 1.0804 (weekly high February 14) en route to 1.1032 (2023 high February 2).
The US Dollar has weakened in response to lower Fed rate expectations following the recent events. Economists at UBS expect the greenback to lose ground against most G10 peers in the long run.
Investors worried about the risk of a financial crisis can consider CHF and Gold
“In the near term, the Dollar’s status as a safe-haven could help keep it relatively highly valued. But for the longer term, we continue to believe that the USD will weaken against most G10 peers and think that investors can use periods of dollar strength to reduce allocations to the currency.”
“Investors worried about the risk of a financial crisis can consider diversifying into traditional safe havens like the Swiss Franc and Gold.”
“For those with more risk appetite, the prospect of the Fed tightening policy less aggressively than the ECB should favor the Euro. And for investors who believe that China’s domestically driven consumption recovery can continue despite the events in the US banking system, we recommend the Australian Dollar, where we have a most preferred view.”
Economist at UOB Group Lee Sue Ann comments on the imminent interest rate decision by the ECB (March 16).
Key Quotes
“How far and how fast the ECB will hike interest rates is still unclear. For now, we expect the ECB to hike by another 50bps at this meeting. This will bring the refinancing rate to 3.50% and the deposit rate to 3.00% by 1Q23.”
“The Mar meeting will also feature a new set of economic forecasts that should heavily influence the ECB’s decision going forward, and we will update our ECB forecasts accordingly then.”
- A combination of factors drag GBP/USD away from a one-month high touched on Tuesday.
- Bets that the BoE might pause its rate-hiking cycle and a stronger USD exert some pressure.
- Investors now look to the UK budget and important US macro releases for a fresh impetus.
The GBP/USD pair comes under some renewed selling pressure following an early uptick to the 1.2180 region and turns lower for the second successive day on Wednesday. Spot prices slide below the 1.2100 mark during the first half of the European session, with bears now looking to extend the overnight retracement slide from the 1.2200 round figure, or a one-month high.
The British Pound's relative underperformance comes on the back of expectations that the Bank of England (BoE) will pause its rate-hiking cycle, which, in turn, acts as a headwind for the GBP/USD pair. In fact, the UK Office for National Statistics reported on Tuesday that annual growth in average total pay — including bonuses — slowed to 5.7% during the three months to January from 6% the previous month. Excluding bonuses, pay growth eased from 6.7% to 6.5%. This is seen as the first sign that UK wages are cooling and should allow the central bank to adopt a cautious approach amid a gloomy economic outlook.
The US Dollar, on the other hand, draws support from a further rise in the US Treasury bond yields, bolstered by reviving bets for at least a 25 bps rate hike by the Federal Reserve at its meeting on March 21-22. The expectations were fueled by the US CPI report released on Tuesday, which indicated that inflation isn't coming down quite as fast as hoped. Adding to this, a fresh leg down in the US equity futures, amid concerns over a banking crisis in the US, provides a strong boost to the safe-haven buck. This, in turn, supports prospects for an extension of the GBP/USD pair's retracement slide from the 1.2200 round figure.
Traders, however, seem reluctant to place aggressive bets and might prefer to wait for the UK government's Spring Budget amid soaring inflation and a cost of living crisis. Apart from this, the US economic docket - featuring the release of the Producer Price Index (PPI), monthly Retail Sales figures and the Empire State Manufacturing Index - might provide some impetus to the GBP/USD pair later during the early North American session. Nevertheless, the aforementioned fundamental backdrop seems tilted firmly in favour of bears and suggests that the path of least resistance for spot prices is to the downside.
Technical levels to watch
S&P 500 has now seen a break below key support at 3940/27 to warn of a more important turn lower.
Weekly close below 3730 to reexpose 3505/3492
“S&P 500 has broken key support from at 3940/27 on increased volume to mark in our view an important break lower. We look for this to clear the way for support next at the 61.8% retracement at 3764/60 and then we think the 200-week average at 3730. Our bias would then be to look for the market to stabilize around 3730.”
“A weekly close below 3730 would be seen to reexpose the 2022 low and 50% retracement of the 2020/2022 bull trend at 3505/3492.”
“Back above 4018 is needed to suggest we may have seen a ‘false’ break lower but with a break above 4078 needed to reassert an upward bias for strength back to 4195.”
The resumption of the downside in USD/CNH should meet initial support around 6.8350 ahead of 6.8000, note UOB Group’s Economist Lee Sue Ann and Markets Strategist Quek Ser Leang.
Key Quotes
24-hour view: “We expected further USD weakness yesterday but we were of the view that deeply oversold conditions could ‘limit’ any further losses to 6.8350. USD did not weaken further as it rebounded from a low of 6.8510. USD appears to have moved into a consolidation phase and it is likely to trade between 6.8650 and 6.9050 today.”
Next 1-3 weeks: “We highlighted yesterday (14 Mar, spot at 6.8600) that the impulsive drop in USD is likely to continue. There is no change in our view. Only a breach of 6.9300 (no change in ‘strong resistance’ level) would invalidate our view. Looking ahead, support levels are at 6.8350, followed by 6.8000.”
- USD/JPY trades close to session lows of 133.82 at the time of press.
- Global markets stay unpredictable even as concerns over US inflation and SVB troubles subside.
- US Retail Sales/PPI and Japan Imports/Exports/Merchandise Trade Balance data are to be followed on Wednesday.
Daily price movements:
USD/JPY prints a slightly negative intraday movement on Wednesday, with the last recorded price at 133.88. The currency pair started the session at 134.22, the previous close, and fluctuated between the lowest intraday price of 133.82 and the highest intraday price of 135.10. The overall intraday price change stands at -0.03% at press time.
The US 10-year Treasury bond yield hovers around 3.67%, diminishing the prior day's rebound, while the two-year bond yield climbs to 4.32% at press time. Notably, the US 10-year Treasury bond yield recorded its most significant daily increase in five weeks on Tuesday, while the two-year counterpart rebounded from a six-month low.
The Bank of Japan's (BoJ) mildly dovish Monetary Policy Meeting Minutes support the USD/JPY's upward movement. According to the BoJ Minutes statement, "It is important to continue with monetary easing."
Furthermore, the BoJ Minutes revealed that members concurred that Japan's inflation would decelerate during the latter part of the upcoming fiscal year.
Daily economic events:
USD/JPY traders should closely monitor the below data:
- US February Retail Sales (12:30 GMT)
- US Producer Price Index (excluding Food and energy at 12:30 GMT)
- Japan Import/Export/Merchandise Trade Balance (23:50 GMT)
Meanwhile, bond yields and ‘shunto’ negotiations may provide further guidance for traders of the Yen pair.
Technical View:
The USD/JPY pair trades just above its daily 50-SMA (133.87), signaling a bullish trend in short to medium term. The currency pair surpassed the 38.2% Fibonacci level at 134.19 but did not reach the 61.8% Fibonacci level at 133.74, suggesting some support near the latter level.
The daily RSI(14) of 48.128 indicates a neutral momentum as the pair hovers around the 50 mark. However, the market may encounter some resistance, as the daily resistance levels are 135.08, 135.93, and 136.95.
The daily pivot point for the USD/JPY pair is 134.05. The daily support levels are found at 133.20, 132.18, and 131.33. If the pair manages to break above the pivot point, it may test the resistance levels, while a break below the pivot point could trigger a test of the support levels.
Open interest in natural gas futures markets shrank by nearly 3K contracts on Tuesday after two straight daily builds according to preliminary readings from CME Group. In the same line, volume resumed the downtrend and dropped by around 137.5K contracts.
Natural Gas: Gains remain limited by $3.00 so far
Tuesday’s small retracement in prices of natural gas was came amidst declining open interest and volume and is indicative that a deeper drop still looks not favoured for the time being. Occasional bullish attempts, in the meantime, appears limited by the March peak around the $3.00 mark per MMBtu (March 3).
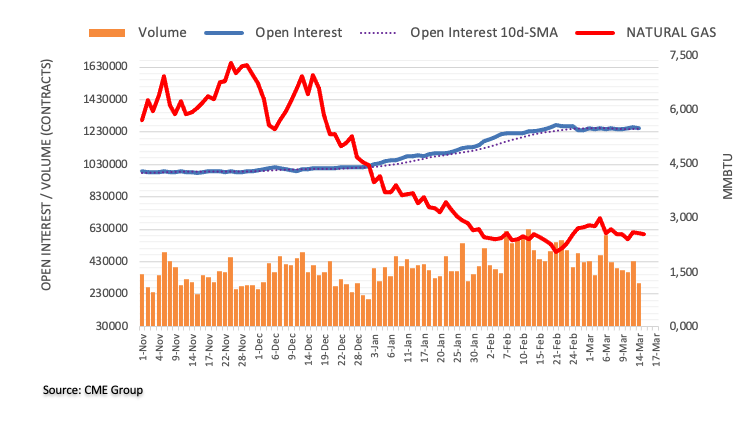
Economists at Rabobank maintain the view that Cable is at risk of further dips below 1.20, despite its current resilience.
Back from the brink?
“Almost irrespective of UK fundamentals, the biggest driver of cable in the coming weeks is still likely to be the USD. Despite the market’s current doubts about the ability of the Fed to hike rates in March, we remain of the view that the USD will remain well supported in the weeks ahead.”
“The break above the 50-Day SMA at 1.2135 is a bullish near-term signal. That said, we see room for the USD to reverse this week’s losses and would look for a move back to GBP/USD 1.19 on a one-month view.”
Eurozone Industrial Production saw an upturn in January, the official data showed on Wednesday, suggesting that the manufacturing sector recovery is gaining traction.
Eurozone’s Industrial Output jumped by 0.7% MoM, the Eurostats said in its latest publication, vs. a 0.4% expected and -1.3% previous print.
On an annualized basis, the old continent’s Industrial Production arrived at 0.9% in January versus a -2.0% figure registered in December and 0.2% estimates.
FX implications
The shared currency failed to derive any comfort from the upbeat German industrial figures amid a broad US Dollar rebound. At the time of writing, EUR/USD is trading at around 1.0676, losing 0.50% on the day.
- Gold price drifts lower for the second straight day and retreats further from a multi-week high.
- Bets for additional rate hikes by major central banks weigh on the non-yielding yellow metal.
- Rallying US bond yields underpins the US Dollar and further contributes to the selling pressure.
Gold price remains under some selling pressure for the second straight day on Wednesday and extends the overnight pullback from the $1,914-$1,915 area, or its highest level since early February. The intraday downfall remains uninterrupted through the first half of the European session and drags the XAU/USD to a two-day low, around the $1,885 region in the last hour.
Hawkish Federal Reserve expectations exert pressure on Gold price
Despite concerns over a banking crisis in the United States (US), investors seem convinced that the Federal Reserve (Fed) might still go ahead with a smaller 25 basis point (bps) rate hike at its upcoming policy meeting on March 21-22. The bets were lifted by the latest US Consumer Price Index (CPI) report released on Tuesday, which showed that inflation isn't coming down quite as fast as hoped. This, in turn, is seen as a key factor weighing on the non-yielding Gold price.
Rising US bond yields, stronger US Dollar further weigh on Gold price
The prospect for further policy tightening by the Fed is reinforced by the ongoing rally in the US Treasury bond yields, which, in turn, lends support to the US Dollar (USD). This further contributes to driving flows away from the non-yielding Gold price. Apart from this, a generally positive risk tone, amid easing fears about a broader systemic crisis from the sudden collapse of Silicon Valley Bank (SVB), is seen denting demand for the safe-haven precious metal.
Bets for more rate hikes by other major central banks favour bearish traders
The markets, meanwhile, have been pricing in the possibility of additional jumbo interest rate hikes by the European Central Bank (ECB) beyond the March meeting, due on Thursday. Moreover, the Bank of England (BoE) is also anticipated to stick to its rate-hiking cycle next week. This, in turn, suggests that the recent recovery in Gold prices from the vicinity of the 100-day Simple Moving Average (SMA) might have run its course and favours bearish traders.
Traders look to macro data from United States for some impetus
That said, it will still be prudent to wait for some follow-through selling below the $1,880 resistance breakpoint turned support before positioning for any further losses. Traders now look to the US economic docket, featuring the release of the Producer Price Index (PPI), monthly Retail Sales figures and the Empire State Manufacturing Index. This, along with the US bond yields, the USD price dynamics and the broader risk sentiment, should provide a fresh impetus.
Gold price technical outlook
From a technical perspective, the aforementioned resistance-turned-support near the $1,880 level should protect the immediate downside for Gold price. A convincing break below might prompt some technical selling and drag the XAU/USD towards the next relevant support near the $1,856-$1,855 zone. Some follow-through selling will expose the 100-day SMA support, currently around the $1,817 region, which if broken decisively will be seen as a fresh trigger for bearish traders.
On the flip side, the weekly swing high, around the $1,914-$1,915 region, now seems to act as an immediate strong resistance. Bulls might now wait for a sustained move beyond the said barrier before positioning for the resumption of the recent upward trajectory witnessed over the past week or so. The Gold price might then accelerate the momentum towards retesting the ten-month peak, around the $1,959-$1,960 region touched in February.
Key levels to watch
Following the highly-anticipated "shunto" spring wage negotiations on Wednesday, Japan’s PM Fumio Kishida said that they are aiming to raise minimum wages beyond JPY¥1,000 nationwide.
Additional comments
“Government to mobilize all measures available to prepare the environment for wage hikes.”
“This spring marks a turning point for growth and wealth distribution.”
Market reaction
USD/JPY is defending minor bids, trading at around 134.30, having briefly topped 135.00.
A nervous calm returns to FX markets. Softer US Retail Sales data could weigh on the Dollar, economists at ING report.
DXY could nudge down to 102.75
“For the Dollar – more settled financial conditions should allow it to reconnect with softer rate differentials and leave the Dollar slightly offered. Our concern is, however, that the USD could easily cross its 'smile curve' should US banking sector stress re-appear and banks want to hoard Dollars – that is why we should focus on the EUR cross-currency basis swap now.”
“Expect a further day of consolidation in the Dollar, although softer US retail sales figures could give it a gentle downside bias.”
“DXY could nudge down to 102.75 should conditions allow.”
See – US Retail Sales Forecast: Correction following January surge – Previews by eight banks
The selling pressure in USD/JPY is expected to alleviate once the pair surpasses the 135.10 level, comment UOB Group’s Economist Lee Sue Ann and Markets Strategist Quek Ser Leang.
Key Quotes
24-hour view: “Yesterday, we expected USD to trade in a range between 132.70 and 134.50. USD subsequently dipped to 133.02 before rebounding to 134.89. We view the price actions as part of a broad consolidation and expect USD trade between 133.50 and 135.00 today.”
Next 1-3 weeks: “We highlighted yesterday (14 Mar, spot at 133.20) that the sharp increase in downward momentum is likely to lead to further USD weakness. We added, a breach of 135.10 (‘strong resistance’ level) would indicate that USD is not weakening further. In NY trade, USD rebounded to 134.89. While downward pressure has waned somewhat, only a breach of 135.10 would invalidate our view.”
CME Group’s flash data for crude oil futures markets noted traders trimmed their open interest positions by around 3.7K contracts on Tuesday, leaving behind five consecutive daily builds. Volume, instead, increased for the second session in a row, this time by around 73.1K contracts.
WTI risks a drop to $70.00
Prices of the barrel of the WTI dropped markedly and printed new 2023 lows near $70.80 on Tuesday. The acute pullback, however, was on the back of dwindling open interest and opens the door to a probable rebound in the very near term. The bearish view in the commodity maintains a potential drop to the $70.00 mark for the time being.
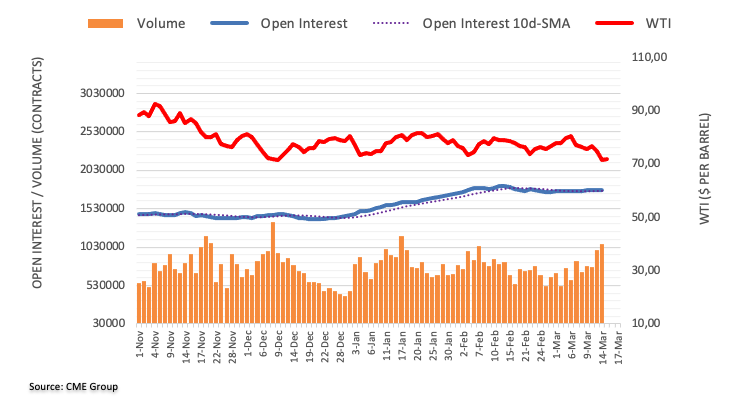
In its latest oil market report published on Wednesday, the International Energy Agency (IEA) said that “rebounding air traffic and the release of pent-up Chinese demand dominate the recovery” in global oil demand.
Additional takeaways
Russia’s oil exports fell by more than 500,000 bpd to 7.5 mln bpd in Feb.
Russia’s oil export revenue in Feb fell $2.7 bln m/m to $11.6 bln, or nearly half pre-war levels.
Russian oil production remained near pre-war levels in Feb..
Much of supply overhang reflects russian supply seeking new destinations after EU bans.
Global oil stocks at nearly 7.8 billion barrels, highest level since Sept 2021.
Global oil stocks have built to levels not seen in 18 months.
World oil supply is outstripping lacklustre demand but markets will balance in middle of year.
Global oil demand is set to rise by 2 mln bpd in 2023 to 102 mln bpd.
Market reaction
WTI is unable to capitalize from the upbeat IEA’s oil market outlook. The US oil is trading back near $71.90, down from daily highs of $72.69, still up 0.31% on the day.
In light of the recent events in financial markets, economists at Credit Suisse think the SNB will only hike 25 bps at the upcoming meeting. They expect EUR/CHF to trade in a 0.9700-1.000 range.
Hawkish SNB surprise becomes less likely
“Considering the recent turmoil in financial markets, the 25 bps SNB rate hike scenario seems the most likely. Given that the market also expects at least another 25 bps rate hike for the June meeting, it is difficult to construe an overly hawkish outcome that could strengthen the Franc significantly. We think EUR/CHF won't fall much in this scenario, and we can see the pair trading in a 0.9700-1.0000 range following the meeting.”
“We would expect EUR/CHF to fall towards 0.9600 in case of a 50 bps rate hike or even more towards 0.9500 if the SNB hikes 75bps.”
“In the no-hike scenario, we expect the franc to weaken and EUR/CHF to move back above parity, towards 1.0100.”
- EUR/USD looks to extend the ongoing recovery north of 1.0750/60.
- Final Inflation Rate in France revised up in February.
- US Producer Prices, Retail Sales will be the salient releases later.
The European currency alternates gains with losses vs. the greenback and prompts EUR/USD to keep hovering around the 1.0750/60 band on Wednesday.
EUR/USD looks at data, ECB
EUR/USD maintains the recovery from last week’s 2-month lows near 1.0520 well in place and on the back of the renewed bearishness surrounding the greenback, particularly following last Friday’s Non-farm Payrolls and exacerbated after the SVB collapse and February disinflation reignited speculation of a pause in the Fed’s hiking cycle.
In the meantime, the euro is expected to trade with a prudent note ahead of the ECB meeting on Thursday and with still firmer expectations pointing to a 50 bps interest rate hike.
In the docket, final inflation figures in France came in a tad above the preliminary readings for the month of February and showed the CPI rising 1.0% MoM and 6.3% over the last twelve months. Later in the session, the Industrial Production in the broader Euroland is also due.
Across the ocean, all the attention will be on Producer Prices and Retail Sales seconded by MBA Mortgage Applications, the NY Empire State Manufacturing Index, Business Inventories, the NAHB Housing Market Index and TIC Flows.
What to look for around EUR
EUR/USD struggles to advance further north of the 1.0750/60 band amidst increasing prudence among investors ahead of the ECB monetary policy meeting on Thursday.
In the meantime, price action around the European currency should continue to closely follow dollar dynamics, as well as the potential next moves from the ECB past the March meeting, when the bank has already anticipated another 50 bps rate hike.
Key events in the euro area this week: EMU Industrial Production (Wednesday) – ECB Interest Rate decision, ECB Lagarde (Thursday) – EMU Final Inflation Rate (Friday).
Eminent issues on the back boiler: Continuation of the ECB hiking cycle amidst dwindling bets for a recession in the region and still elevated inflation. Impact of the Russia-Ukraine war on the growth prospects and inflation outlook in the region. Risks of inflation becoming entrenched.
EUR/USD levels to watch
So far, the pair is retreating 0.01% at 1.0731 and faces the next contention at 1.0555 (100-day SMA) seconded by 1.0524 (monthly low March 8) and finally 1.0481 (2023 low January 6). On the upside, the breakout of 1.0759 (monthly high March 15) would target 1.0804 (weekly high February 14) en route to 1.1032 (2023 high February 2).
- USD/CAD trades between 1.3660 and 1.3705 during Wednesday's session.
- Cautious optimism in the market, and a pullback in yields weigh on the US Dollar.
- Daily RSI(14) at 58.392, suggests a moderate bullish momentum for USD/CAD.
Daily price movements:
USD/CAD sees a slightly positive intraday movement on Wednesday, with the last recorded price at 1.3686 at the time of press. The currency pair started the session at 1.3684, the previous close, and oscillated between the lowest intraday price of 1.3660 and the highest intraday price of 1.3705. The overall intraday price change stands at +0.02% at press time.
Key economic events:
Focusing on the US February Retail Sales report on Wednesday at 12:30 GMT is critical.
Additionally, February's upcoming Canadian Housing Starts data will influence short-term USD/CAD fluctuations. The official crude oil inventory report from the US Energy Information Administration will also play a crucial role for the USD/CAD pair.
In light of the Silicon Valley Bank’s (SVB) catastrophic failure, market participants expect the Federal Reserve (Fed) to take a more cautious approach to monetary policy. This expectation arises from the possibility that the Fed may seek to avert further rate hikes to minimize the risk of additional bank collapses.
Recently, officials from Japan, Canada, and the US have dismissed rumors regarding the bleak state of their respective banks in the wake of the recent fallout involving Silicon Valley Bank (SVB) and Signature Bank.
Technical View:
USD/CAD pair has been trading above its daily 20-SMA (1.3613) and 50-SMA (1.3483), indicating a bullish short- to medium-term trend. The currency pair tested the 38.2% Fibonacci level at 1.3689 but failed to reach the 61.8% Fibonacci level at 1.3713, suggesting some resistance near the latter level.
The daily RSI(14) of 57.709 indicates a moderately bullish momentum as the pair continues to trade above the 50 mark. However, the market may face some resistance, as the daily resistance levels are 1.3740, 1.3794, and 1.3838.
The daily pivot point for the USD/CAD pair is 1.3696, almost equal to the last intraday price at press time. The daily support levels are found at 1.3641, 1.3597, and 1.3543. If the pair manages to break above the pivot point, it may test the resistance levels, while a break below the pivot point could trigger a test of the support levels.
- GBP/JPY scales higher for the second straight day and touches a fresh weekly high.
- The heavily offered tone surrounding the JPY remains supportive of the move up.
- Traders now look forward to the UK government’s budget report for some impetus.
The GBP/JPY cross builds on this week's solid bounce from the 160.00 psychological mark, or a one-month low touched earlier this week and gains traction for the second successive day on Wednesday. The momentum lifts spot prices to a fresh weekly high during the first half of the European session, though bulls seem to struggle to find acceptance above the 164.00 round figure.
A combination of factors continues to weigh heavily on the Japanese Yen (JPY), which, in turn, is seen acting as a tailwind for the GBP/JPY cross. Market participants seem convinced that the Bank of Japan (BoJ) will stick to its dovish stance to support the fragile domestic economy. In fact, the incoming BoJ Governor Kazuo Ueda recently stressed the need to maintain the ultra-loose policy settings and said that the central bank isn't seeking a quick move away from a decade of massive easing. Apart from this, a generally positive risk tone further contributes to driving flows away from the safe-haven JPY.
Investors turned optimistic amid easing fears about a broader systemic crisis from the sudden collapse of Silicon Valley Bank (SVB). This led to the overnight relief rally on Wall Street and is evident from a stable performance around the European equity markets. That said, the BoJ meeting minutes released earlier this Wednesday showed that policymakers debated the feasibility of making further tweaks to the bond yield control in January. Moreover, the board also agreed that inflation and wages could overshoot expectations, suggesting a phase-out of its massive stimulus remained on the cards.
Apart from this, expectations that the Bank of England (BoE) could pause its rate-hiking cycle next week, amid signs that the UK wages are cooling, hold back bullish traders from placing aggressive bets around the British Pound. This, in turn, might keep a lid on any meaningful appreciating move for the GBP/JPY cross, at least for the time being. Traders now look to the UK government's Spring Budget amidst the gloom in the UK economy owing to soaring inflation and a cost of living crisis. This will play a key role in influencing the Sterling Pound and provide some meaningful impetus to the GBP/JPY cross.
Technical levels to watch
In its spring forecast released on Wednesday, Germany's IfW economic institute raised its growth forecast for 2023 from 0.3% to 0.5%.
Additional takeaways
“The German government is predicting growth of 0.2%. For 2024, the institute upgraded its growth forecast from 1.3% to 1.4%.”
"The German economy is struggling to emerge from the energy crisis.”
"The economic consequences of the war in Ukraine have stalled the recovery from the pandemic and noticeably depressed the level of gross domestic product."
“Consumer prices are set to rise by 5.4% this year, and by 2.1% in 2024.“
"High inflation is reducing households' disposable incomes and leading to a decline in private consumer spending in the current year."
Market reaction
EUR/USD is struggling to gain upside traction in the European session this Wednesday, currently trading at 1.0735, modestly flat on the day.
EUR/USD touched a fresh multi-week high of 1.0760. The world's most popular pair could test the 1.08 level, economists at ING report.
Settling in for the ECB
“Should equities settle down a little, EUR/USD could start to reconnect a little with yield differentials and head up to the 1.08 area.”
“Any severe signs of US money market stress could easily see these EUR/USD gains reverse.”
“The mood in EUR/USD may also be subdued ahead of the European Central Bank's expected 50 bps hike tomorrow.”
In the opinion of UOB Group’s Economist Lee Sue Ann and Markets Strategist Quek Ser Leang, AUD/USD is predicted to keep the 0.6570-0.6770 range unchanged for the time being.
Key Quotes
24-hour view: “After AUD soared on Monday, we highlighted yesterday that ‘the rapid rise appears to be overdone and AUD is unlikely to advance much further’. We expected AUD to trade in a range between 0.6615 and 0.6715. AUD did not strengthen further as it traded in a range of 0.6633/0.6696. Upward momentum appears to be building, albeit tentatively. Today, AUD is likely to edge higher but a sustained rise above 0.6715 is unlikely (next resistance is at 0.6770). On the downside, a breach of 0.6630 (minor support is at 0.6650) would indicate that the build-up in momentum has fizzled out.”
Next 1-3 weeks: “There is not much to add to our update from yesterday (14 Mar, spot at 0.6665). As highlighted, AUD appears to have moved into a consolidation phase and it is likely to trade in a range between 0.6570 and 0.6770 for the time being.”
Gold price is consolidating the previous decline so far this Wednesday. However, economists at ANZ Bank expect US banking stress to reinvigorate investor demand over the longer term.
Investor allocation to Gold remains low
“The market’s expectation of a smaller Fed rate hike was supported by inflation data that came in as expected at 0.5% MoM for June. Nevertheless, demand for the safe haven asset remained strong.”
“Even with these gains, investor allocation to gold remains low. We expect this banking turmoil to reinvigorate investor demand over the longer term.”
- AUD/USD fails to preserve/capitalize on its intraday uptick amid a modest USD strength.
- Hawkish Fed expectations push the US bond yields higher and underpin the Greenback.
- The RBA’s dovish shift supports prospects for some meaningful downside for the pair.
- Traders now look forward to important US macro releases for short-term opportunities.
The AUD/USD pair continues with its struggle to find acceptance above the 0.6700 round-figure mark and trims a part of its modest intraday gains back closer to the weekly high. The pair retreats to the lower end of its daily trading range during the early European session and is currently placed around the 0.6675-0.6670 region, nearly unchanged for the day.
The US Dollar attracts fresh buying amid reviving bets for a further policy tightening by the Federal Reserve and turns out to be a key factor acting as a headwind for the AUD/USD pair. Despite uncertainties over the US banking system, investors seem convinced that the Fed might still go ahead with a smaller 25 bps rate hike at its March policy meeting. The expectations were reaffirmed by the crucial US CPI report on Tuesday, which showed that inflation isn't coming down quite as fast as hoped.
This, in turn, continues to push the US Treasury bond yields and lend some support to the Greenback. The AUD/USD bulls, meanwhile, seem rather unimpressed by the better-than-expected Chinese Retail Sales and Fixed Asset Investment data, indicating that certain facets of the world's second-largest economy were on a steady path towards recovery. Even a generally positive risk tone, which tends to undermine the safe-haven buck, does little to benefit the risk-sensitive Australian Dollar.
Investors turned optimistic amid easing fears about a broader systemic crisis from the sudden collapse of Silicon Valley Bank (SVB). This led to the overnight relief rally on Wall Street and is evident from a stable performance around the European equity markets. The intraday price action, along with the Reserve Bank of Australia's (RBA) dovish shift, signalling that it might be nearing the end of its rate-hiking cycle, suggests that the path of least resistance for the AUD/USD pair is to the downside.
Traders now look forward to the US economic docket, featuring the release of the Producer Price Index (PPI), monthly Retail Sales figures and the Empire State Manufacturing Index later during the early North American session. Apart from this, the US bond yields and the broader risk sentiment might influence the USD price dynamics, which, in turn, should produce short-term opportunities around the AUD/USD pair. The key focus, however, will remain on the FOMC monetary policy meeting, starting next Tuesday.
Technical levels to watch
EUR/USD is glued to 50-Day Moving Average (DMA) at 1.0730 for third day. Only a move above 1.08, then 1.0910/40 would open up 1.10, economists at Société Générale report.
Any ECB confusion could send FX participants scrambling for cover
“ECB president Lagarde has struggled to get the message across in the past, so any confusion tomorrow, at what will be a crucial meeting that resets inflation and rate expectations, could send FX participants scrambling for cover.”
“Selling rallies in February turned into tentative buying of dips in March but progress has been slow.”
“Only a break of 1.08 followed by 1.0910/1.0940 would clear the path for a return to 1.10.”
Today, UK Chancellor Jeremy Hunt will present what has been billed as a 'budget for growth'. Economists at ING expect GBP/USD to remain under 1.22.
EUR/GBP can reclaim recent losses and head back to 0.89
“We doubt anything in the Budget will be Sterling negative – after all taxation levels are near the limit – but equally we do not see it as especially Sterling positive either.”
“With the Bank of England nearer to a pause than most, we think EUR/GBP can reclaim recent losses and head back to 0.89, while cable may struggle to break 1.22.”
- USD/CHF reverses an intraday dip and turns positive for the second successive day on Wednesday.
- A further rise in the US bond yields lends support to the USD and remains supportive of the uptick.
- Signs of stability in the equity markets undermine the safe-haven CHF and further act as a tailwind.
The USD/CHF pair attracts fresh buying following an early dip to the 0.9115 area and turns positive for the second successive day on Wednesday. The pair climbs back above mid-0.9100s during the early European session and looks to build on its recovery from a six-week low touched on Monday.
A further rise in the US Treasury bond yields lends some support to the US Dollar, which, in turn, is seen acting as a tailwind for the USD/CHF pair. Despite uncertainties over the US banking system, investors seem convinced that the Federal Reserve might still go ahead with a smaller 25 bps rate hike at its next policy meeting on March 21-22. The bets were lifted by the US consumer inflation figures released on Tuesday and continue to push the US bond yields higher.
Furthermore, signs of stability in the financial markets seem to undermine the safe-haven Swiss Franc (CHF) and turn out to be another factor offering support to the USD/CHF pair. Investors piled back into stocks, which led to the overnight relief rally on Wall Street, amid easing fears about a broader systemic crisis from the sudden collapse of Silicon Valley Bank (SVB). The spillover effect remains supportive of a generally positive tone around the equity markets.
The aforementioned fundamental backdrop favours the USD bulls and supports prospects for some meaningful appreciating move for the USD/CHF pair. Market participants now look to the US economic docket, featuring the release of the Producer Price Index (PPI), monthly Retail Sales figures and the Empire State Manufacturing Index later during the early North American session. Apart from this, the US bond yields might influence the USD price dynamics.
Traders will further take cues from the broader risk sentiment to grab short-term opportunities around the USD/CHF pair. The market focus, however, will remain glued to a two-day FOMC monetary policy meeting, starting next Tuesday, which will drive the USD in the near term and determine the next leg of a directional move for the major. Hence, it will be prudent to wait for strong follow-through buying before confirming that spot prices have bottomed out.
Technical levels to watch
Citing a source familiar with the matter, Reuters reported on Wednesday that European Central Bank (ECB) policymakers are leaning toward a 50 basis points (bps) rate hike on Thursday.
Despite turmoil in the banking sector, policymakers expect inflation to remain too high in the Eurozone. Additionally, the Governing Council doesn't want to damage its credibility by ditching the 50 bps rate increase after having repeatedly noted that this was their intention.
Market reaction
EUR/USD showed no immediate reaction to this headline and the pair was last seen trading virtually unchanged on the day at 1.0735.
Bank Indonesia (BI) will hold its monthly governor board meeting on Thursday, March 16. Here you can find the expectations as forecast by the economists and researchers of four major banks regarding the upcoming central bank's rate decision.
BI is expected to keep rates steady at 5.75%. At the last meeting on February 16, the bank also stayed on hold. However, BI could keep an option to increase rates again in order to stabilize the Indonesian Rupiah (IDR).
ANZ
“We expect BI to hold the 7-day reverse repo rate at 5.75%. IDR volatility has risen lately, but even so, is not an outlier in the broader regional context. Overall, there is little reason for BI to detract from its earlier indication that the rate-hike cycle has concluded.”
Standard Chartered
“We expect BI to keep the 7-day reverse repo rate unchanged at 5.75%, thus maintaining an attractive interest rate spread against USD rates, in order to keep the IDR stable. Stronger-than-expected US economic data and recent hawkish statements by the Fed have increased pressure on EM currencies. However, we think BI will keep policy rates on hold, as the IDR is still strong compared to currencies in the Asian region. BI has said that a total 225 bps of policy rate increases since last August will be enough to return core and headline inflation to its 2-4% target this year. We think BI will stick with the forward guidance but strengthen FX stabilisation policy through market intervention – i.e., spot and domestic non-deliverable forwards (DNDFs) – and selling short-tenor government bonds to maintain interest rate attractiveness.”
ING
“BI recently declared victory over inflation with Governor Perry Warjiyo indicating that he need not hike rates anymore this year. Decelerating core inflation could give BI a reason to keep rates untouched although recent pressure on the Indonesian Rupiah (IDR) could force the central bank to take a hard look at a potential rate hike.”
SocGen
“We expect the BI to again keep the policy rate (7-day Reverse Repo Rate) at 5.75%. While we believe that BI might have come to the end of its rate hike cycle, there is now a great deal of uncertainty as to its future course of action. A rather hawkish statement by Fed Chair Powell suggesting rates moving higher and faster and remaining elevated for longer raises the possibility of the bank eventually deciding to go further. There is, therefore, a possibility of BI going further and higher for longer. We believe that the monetary policy divergence between Bank Indonesia and the Fed should add to the depreciation pressure on the IDR. However, this time around the depreciation pressure could be partly offset by reduced external vulnerabilities. The adoption of alternative policies to protect the currency could see the IDR weather the storm for a while. However, the risk of a further hawkish repricing of Fed policy could eventually expose the IDR to further weakness. Recent hawkish remarks by Chair Powell solidified expectations of a 50 bps hike in the March meeting. This does not bode well for risk appetite and the IDR. The only other counteracting global macro factor is the China recovery story, which should remain supportive of the IDR in the medium term.”
Economist at UOB Group Lee Sue Ann expects the RBI to maintain its policy rate unchanged for the remainder of the year.
Key Quotes
“BI’s decision to keep its benchmark policy rate (7-Day Reverse Repo) unchanged at 5.75% in Feb marked the end of the current hiking cycle, which begun in Aug 2022.”
“Our forecast is for the policy rate to remain unchanged at 5.75% for the rest of this year and for BI to potentially embark on an asymmetric rate cut cycle in 1H24.”
Here is what you need to know on Wednesday, March 15:
The US Dollar managed to shake off the selling pressure on Tuesday after the inflation data from the US revived expectations for a 25 basis points Fed rate hike in March and fueled a rebound in the US Treasury bond yields. Markets remain calm early Wednesday as focus shifts to February Retail Sales and Producer Price Index data from the US. In the early Asian session, fourth-quarter Gross Domestic Product data from New Zealand will be watched closely by investors.
The US Bureau of Labor Statistics reported on Tuesday that the annual Consumer Price Index edged lower to 6% in February from 6.4% as expected. More importantly, Core CPI rose by 0.5% on a monthly basis following the 0.4% growth recorded in January. This reading came in slightly higher than the market expectation of 0.4%. In turn, US Treasury bond yields gained traction and the benchmark 10-year reference gained more than 3% on a daily basis. According to the CME Group FedWatch Tool, markets are currently pricing in an 82% probability of a 25 bps rate hike at the upcoming meeting.
Meanwhile, the new Bank Term Funding Program (BTFP) facility introduced by the Fed in response to the collapse of Silicon Valley Bank and Signature Bank seems to have helped to calm markets down. On Tuesday, Wall Street's three main indexes closed with strong gains.
During the Asian trading hours, the data from China revealed that Retail Sales expanded by 3.5% on a yearly basis in February, matching the market consensus. Industrial Production in the same period grew by 2.4%, compared to analysts' estimate of 2.7%.
EUR/USD continued to stretch higher on Tuesday but seems to have lost its bullish momentum after having touched a fresh multi-week high of 1.0760. In the European morning, the pair trades below 1.0750.
Following the impressive rally witnessed on Monday, GBP/USD closed modestly lower on Tuesday. The pair manages to hold above 1.2150 early Wednesday.
NZD/USD came under modest bearish pressure and declined toward 0.6200 during the Asian trading hours on Wednesday. The data from New Zealand revealed that the Current Account - GDP ratio was -8.9% in the fourth quarter, compared to -7.9% in the third quarter. Citing a comment from Anthony Walker, a director of sovereign ratings for Australia, New Zealand and the Pacific at S&P, Bloomberg reported that New Zealand’s credit grades with S&P Global Ratings could come under pressure if the nation’s current account deficit remains too big. On a quarterly basis, the country's real Gross Domestic Product is forecast to contract by 0.2% in the fourth quarter.
AUD/USD fluctuates slightly below 0.6700 on Wednesday. In the Asian session, February jobs report data and Consumer Inflation Expectations for March from Australia will be looked upon for fresh impetus. The Reserve Bank of Australia (RBA) will release its quarterly Bulletin as well.
The Bank of Japan's January meeting minutes revealed on Wednesday that members shared the view that the underlying rise in inflation was likely to lead to sustained price rise backed by wage hikes. Following Tuesday's rebound, USD/JPY continued to push higher early Wednesday and was last seen trading above 134.60.
Pressured by rising US T-bond yields, XAU/USD snapped a three-day winning streak on Tuesday. Gold price was last seen trading in a tight range at around $1,900.
Bitcoin retreated below $25,000 early Wednesday after having spiked to its highest level since June above $26,500 on Tuesday. Ethereum also touched a fresh multi-month high near $1,800 before pulling back toward $1,700.
- EUR/GBP edges higher for the second straight day, though lacks follow-through buying.
- Bets that the BoE could pause its rate-hiking cycle undermine the GBP and lend support.
- Investors now look to the UK budget for some impetus ahead of the ECB on Thursday.
The EUR/GBP cross edges higher for the second straight day on Wednesday and looks to build on the previous day's goodish rebound from the 0.8775 area, or over a one-week low. The cross trades with a mild positive bias through the early European session and is currently placed around the 0.8830 region, up less than 0.05% for the day.
Expectations that the Bank of England (BoE) could pause its rate-hiking cycle next week turns out to be a key factor behind the British Pound's relative underperformance, which, in turn, lends support to the EUR/GBP cross. The markets are now pricing in around a lower 40% chance that the BoE will leave interest rates unchanged on March 23 amid signs that UK wages are cooling. The bets fell after the UK Office for National Statistics reported on Tuesday that annual growth in average total pay — including bonuses — slowed to 5.7% during the three months to January from 6% the previous month. Excluding bonuses, pay growth eased from 6.7% to 6.5%.
In contrast, several European Central Bank (ECB) policymakers recently backed the case for additional jumbo rate hikes beyond the March meeting. This, in turn, continues to underpin the shared currency and further seems to act as a tailwind for the EUR/GBP cross. Bullish traders, however, seem reluctant to place aggressive bets and prefer to wait on the sidelines ahead of the crucial ECB monetary policy meeting on Thursday. Heading into the key central bank event risk, the UK government's new budget is due to be presented on Wednesday, which might influence the Sterling Pound and provide some impetus to the cross in the absence of any relevant macro data.
Nevertheless, the abovementioned fundamental backdrop supports prospects for some meaningful upside for the EUR/GBP cross. Even from a technical perspective, the overnight recovery reaffirmed strong support near the 100-day Simple Moving Average (SMA) at 0.8770, which should now act as a pivotal point and a strong near-term base for spot prices. A convincing break below, however, will negate the positive outlook and shift the bias in favour of bearish traders, paving the way for an extension of the recent pullback down to a possible target at around 0.8680 where the 200-day SMA and a major trendline align.
Technical levels to watch
- GBP/USD rebounds from intraday low, stays indecisive after reversing from one-month high the previous day.
- One-week-old ascending trend line, weekly range’s lower band strengthens 1.2140-35 support confluence.
- Bulls need validation from 1.2205 to probe mid-February highs.
GBP/USD reverses from the intraday low surrounding 1.2145 amid the initial hour of Wednesday’s London open. The Cable pair, however, stays within a week-long trading range between 1.2135 and 1.2205.
The quote’s latest rebound could be linked to its U-turn from the 50-Hour Moving Average (HMA), around 1.2150 by the press time. However, the sluggish MACD signals suggest the continuation of the grind inside the aforementioned 70-pip range established since Monday.
That said, an upward-sloping trend line from the last Wednesday adds strength to the 1.2135 support.
It should be noted that the 100-HMA and the 200-HMA, respectively near 1.2060 and 1.2000 in that order, act as additional downside filters before giving control to the GBP/USD bears.
Alternatively, a successful break of 1.2205 enables the Cable pair buyers to challenge the mid-February high surrounding 1.2270.
In a case where the GBP/USD price remains firmer past 1.2270, the 1.2300 can act as an intermediate halt before highlighting the 1.2445-50 key horizontal hurdle that restricted the pair’s upside during late 2022 and early 2023.
Overall GBP/USD remains on the bull’s radar despite the previous day’s pullback from a one-month high.
GBP/USD: Hourly chart

Trend: Limited downside expected
Sustainable gains in GBP/USD are likely above 1.2440 according to UOB Group’s Economist Lee Sue Ann and Markets Strategist Quek Ser Leang.
Key Quotes
24-hour view: “We highlighted yesterday that ‘further GBP strength appears likely even though it remains to be seen if GBP can clearly break above 1.2240’. However, GBP did not strengthen further as it traded in a relatively quiet manner between 1.2139 and 1.2203. The price movements are likely part of a consolidation phase and today, GBP is likely to trade in a range of 1.2100/1.2200.”
Next 1-3 weeks: “Yesterday (14 Mar, spot at 1.2185), we highlighted that upward momentum is beginning to build but GBP has to break clearly above 1.2440 before a sustained advance is likely. There is no change in our view. In the next few days, the chance of a clear break above 1.2440 will remain intact as long as GBP stays above 1.2040 (no change in ‘strong support’ level).”
- The index navigates within a narrow range around 103.70.
- US yields remain mixed following the recent shar pullback.
- Producer Prices, Retail Sales take centre stage later on Tuesday.
The greenback, in terms of the USD Index (DXY), advances marginally and hovers around the 103.70/80 band ahead of the opening bell in the euro area.
USD Index now looks at data
The index keeps the inconclusive trade in the lower end of the weekly range south of 104.00 the figure amidst some tepid recovery in yields in the short end of the curve amidst firmer bets of a 25 bps rate hike by the Fed at the March 22 event.
On the latter, CME Group’s FedWatch Tool sees the probability of a 25 bps rate raise at nearly 82%, from around 215 a week ago.
In the meantime, investors remain cautious and continue to closely follow the aftermath of the SVB collapse and its potential effects on the Fed’s decision on interest rates next week.
In the US docket, Producer Prices and Retail Sales will be in the limelight followed by MBA Mortgage Applications, the NY Empire State Manufacturing Index, Business Inventories, the NAHB Housing Market Index and TIC Flows.
What to look for around USD
The index remains under pressure and attempts to put further distance from recent multi-week lows near 103.50 seen earlier in the week.
The latest results from the US jobs report coupled with the ongoing effervescence around the US banking system threat the greenback and collaborate with investors’ view of a 25 bps rate hike at the March gathering, all sponsoring the corrective decline in the USD Index (DXY) from last week’s 2023 highs in the boundaries of the 106.00 region to Monday’s 103.50 zone.
So far, the index remains under pressure against the backdrop of reinvigorated bets of a Fed’s pivot in the short-term horizon. However, the still elevated inflation and the resilience of the US economy continue to play against that view.
Key events in the US this week: MBA Mortgage Applications, Producer Prices, Retail Sales, Business Inventories, NAHB Housing Market Index, TIC Flows (Wednesday) – Initial Jobless Claims, Housing Starts, Building Permits, Philly Fed Manufacturing Index (Thursday) – Industrial Production, Flash Michigan Consumer Sentiment, CB Leading Index (Friday).
Eminent issues on the back boiler: Rising conviction of a soft landing of the US economy. Persistent narrative for a Fed’s tighter-for-longer stance. Terminal rates near 5.5%? Fed’s pivot. Geopolitical effervescence vs. Russia and China. US-China trade conflict.
USD Index relevant levels
Now, the index is advancing 0.05% at 103.73 and faces the next hurdle at 105.88 (2023 high March 8) seconded by 106.63 (200-day SMA) and then 107.19 (weekly high November 30 2022). On the flip side, the breakdown of 103.48 (monthly low March 13) would open the door to 102.58 (weekly low February 14) and finally 100.82 (2023 low February 2).
Citing former senior Bank for International Settlements official and ex-New York Fed research director Stephen Cecchetti, MNI reported on Wednesday, “the Federal Reserve will likely approve a quarter-point interest rate increase next week as focus shifts from strong economic data to restoring confidence in the banking system.”
Additional comments
"I would try to get that message out as broadly, clearly and quickly as possible, and then I would raise interest rates. Does that mean you're probably going to go 25 now instead of 50 and then postpone further increases? Probably yes.”
Pausing would be a "very bad signal. It would be read as you're really worried about the financial stability consequences of further interest rate increases and you're willing to compromise your inflation objective."
- Gold price extends pullback from six-week high as yield curve inversion defends US Dollar bulls.
- XAU/USD clings to $1,900 confluence, failure to cross $1,925 hurdle keep bears hopeful.
- Mixed headlines surrounding SVB, Fed bets challenge Gold traders ahead of second-tier US data.
Gold price (XAU/USD) takes offers to renew intraday low around $1,900, sticking to short-term key support during the mid-week inaction. In doing so, the bright metal takes clues from the recently widening difference between the US 10-year and two-year Treasury bond yields. Also exerting downside pressure on the XAU/USD price could be the global policymakers’ inability to convince the market of the risks emanating from the latest fallouts of the Silicon Valley Bank (SVB) and Signature Bank. Furthermore, the recent run-up in the Fed fund futures favoring a 0.25% rate hike in March also put a floor under the US Dollar, which in turn weighs on the Gold price.
It should be noted that the XAU/USD traders seem to have a limited upside room amid brighter odds favoring the downbeat US data relating to Retail Sales, Industrial Production and Producer Price Index. Above all, risk catalysts and the next week’s Federal Open Market Committee (FOMC) Monetary Policy Meeting is the key catalyst for Gold traders to watch for clear directions.
Also read: Gold Price Forecast: XAU/USD appears ‘buy the dips’ trade amid dovish Fed bets
Gold Price: Key levels to watch
As per the Technical Confluence Detector, the Gold price recently slipped beneath the key $1,901-1900 support-turned-resistance including Fibonacci 161.8% on one-month and 23.6% on one-day.
With this, the XAU/USD appears well-set to drop further towards the convergence of the Pivot Point one-day S1 and the previous daily low surrounding $1,895.
Following that, Pivot Point one-week R1 could act as the last defense of the Gold buyers near $1,890.
Alternatively, a clear upside break of $1,901 isn’t an open invitation to the Gold buyers as Fibonacci 38.2% on one-day and middle band of the Bollinger on Hourly play probes further upside near $1,905.
Even if the XAU/USD crosses the $1,905 hurdle, Pivot Point one-week R2 and Pivot Point one-day R1 can challenge the metal’s further upside near $1,910 and $1,914 levels respectively.
Above all, the Gold price remains bearish unless it stays beyond the $1,924 hurdle comprising Pivot Point one-month R1 and one-day R2.
Here is how it looks on the tool
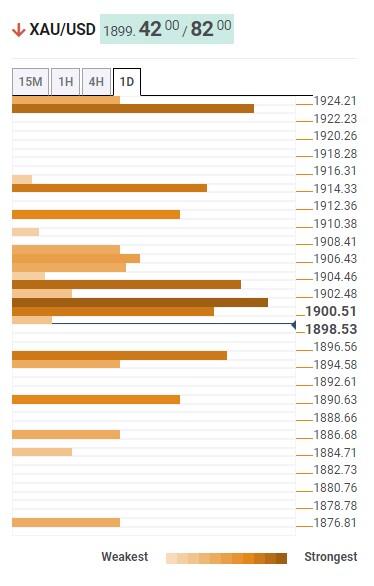
About Technical Confluences Detector
The TCD (Technical Confluences Detector) is a tool to locate and point out those price levels where there is a congestion of indicators, moving averages, Fibonacci levels, Pivot Points, etc. If you are a short-term trader, you will find entry points for counter-trend strategies and hunt a few points at a time. If you are a medium-to-long-term trader, this tool will allow you to know in advance the price levels where a medium-to-long-term trend may stop and rest, where to unwind positions, or where to increase your position size.
FX option expiries for Mar 15 NY cut at 10:00 Eastern Time, via DTCC, can be found below.
- EUR/USD: EUR amounts
- 1.0500 1.7b
- 1.0700 1.8b
- 1.0750 3.5b
- 1.0800 932m
- 1.0830 1.8b
- GBP/USD: GBP amounts
- 1.1900 1b
- USD/JPY: USD amounts
- 133.00 1.6b
- 134.00 541m
- 135.00 668m
- AUD/USD: AUD amounts
- 0.6675 502m
- 0.6720 926m
- USD/CAD: USD amounts
- 1.3500 744m
- 1.3575 1.5b
- 1.3725 837m
- 1.3945 1.1b
Considering advanced figures from CME Group for gold futures markets, open interest shrank for the second session in a row on Tuesday, this time by more than 8K contracts. Volume followed suit and dropped by around 274.5K contracts, reversing at the same time three consecutive daily builds.
Gold continues to target $1960
Tuesday’s downtick in gold prices was on the back of shrinking open interest and volume, hinting at the view that the current decline is unlikely to extend further in the very near term. In the meantime, the recovery in the precious metal keeps the immediate target at the 2023 high at $1960 per ounce troy (February 2).
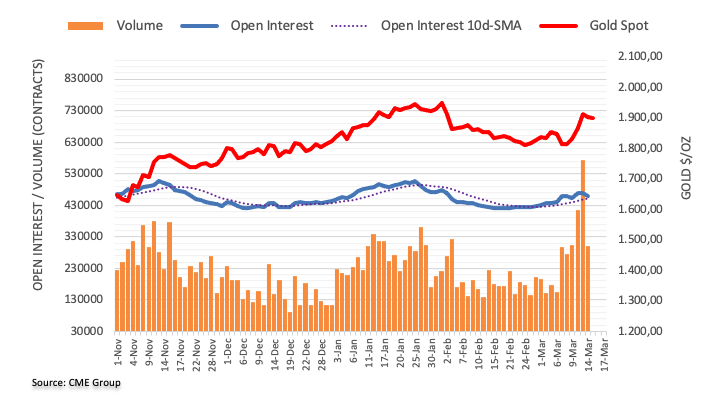
- Asian equities are mixed, searching for the next directional bias.
- US CPI was in line with expectations but risk assets failed to cheer.
- Investors are moving away from Asia in search of better alpha trades.
The Asian equity complexes are trading mix in the late hours of the Asian trading session. The ChinaA50 is down about 0.38% and HK50 is down about 0.35% while KOSPI is up about 1.44% and ASX200 is almost flat on the day, at the time of writing.
The Chinese data released earlier in the day have supported the risk tone, the Industrial Productions for February came in at 2.4% (YoY) vs. 2.7% expected, and the Retail Sales for the same month came in at the expected 3.5% (YoY).
Earlier in the Asian session, the Bank of Japan (BoJ) released its minutes, which were the same as expected accompanied by a bearish tone and as usual no impact on the market.
The US Consumer Price Index (CPI) data, released on Tuesday prompted a milder risk-on tone among equity complexes, in the wake of smaller Federal Reserve (Fed) rate hike expectations for the March meeting. The sticky part of the inflationary matrix signaled more tightening ahead. Despite that, the market finds some comfort.,
Meanwhile, some report has suggested that many Indian startups and tech companies were linked to Silicon Valley Bank’s (SVB) fallouts. One might argue that it’s hard to remain isolated in the globalization era. But nothing is officially announced yet.
Moving on to the next, many emerging markets are heavily correlated to the Chinese economy. Since China has lowered its growth forecast, investors are moving away from Asian powerhouses and searching for new destinations for alpha.
EUR/USD is expected to maintain the trade within 1.0560-1.0800 in the next few weeks, suggest UOB Group’s Economist Lee Sue Ann and Markets Strategist Quek Ser Leang.
Key Quotes
24-hour view: “Our expectations for EUR to edge higher did not materialize as it traded in a 1.0677/1.0749 range before closing largely unchanged at 1.0732 (+0.03%). The underlying tone still appears to be slightly firm and we continue to see room for EUR to edge higher. That said, the major resistance at 1.0800 is not expected to come under threat (there is another resistance level at 1.0770). Support is at 1.0705, a breach of 1.0680 would indicate that the current mild upward pressure has eased.”
Next 1-3 weeks: “On Monday (13 Mar, spot at 1.0685), we highlighted that the current price action is likely part of a consolidation range and we held the view that EUR is likely to trade between 1.0560 and 1.0800 for the time being. We continue to hold the same view. That said, the short-term underlying tone appears to be firm and in the next 1-2 days, the risk is for EUR to edge higher and test 1.0800. At this stage, a sustained rise above 1.0800 is unlikely.”
- NZD/USD has sensed heat while attempting to surpass the 0.6250 resistance despite the risk-on impulse.
- Declining US CPI, higher jobless rate, and the SVB collapse might force the Federal Reserve (Fed) to remain less hawkish on interest rates.
- A weak NZ growth rate might delight Reserve Bank of New Zealand policymakers as inflationary pressures could come down ahead.
- NZD/USD is expected to deliver some downside as it has surrendered the 20-EMA support.
NZD/USD is facing hurdles in stretching its recovery above the immediate resistance of 0.6250 in the early European session. The Kiwi asset has sensed barricades near 0.6250 as the recovery attempt by the US Dollar Index (DXY) has trimmed the pace of the upside move.
After printing a fresh monthly low at 103.44, the USD Index has attracted bids and has scaled above 103.60. The downside bias for the USD Index looks solid as the Federal Reserve (Fed) is likely to avoid the option of bigger rate announcement as the United States inflation has softened, the Unemployment Rate has increased, and the US economy’s confidence has been hit hard after the catastrophic collapse of Silicon Valley Bank (SVB).
S&P500 futures have turned positive after reporting marginal losses in early Asia. The 500-US stocks basket printed superlative gains on Tuesday as investors cheered the declining inflation spell, which resulted in easing odds of 50 basis points (bps) rate hike from the Federal Reserve. Meanwhile, the return offered on 10-year US Treasury yields is still solid above 3.67% as the street has mixed views on US Consumer Price Index (CPI).
Mixed view on US CPI
Tuesday’s US CPI release unleashed bulls linked to risk-sensitive assets as a decline in the headline inflation to 6.0%, as anticipated, bolstered the chances of a smaller rate hike from Federal Reserve chair Jerome Powell for his next monetary policy meeting, scheduled for next week.
A scrutiny of the US inflation report dictated that prices of used cars continued to decline, however, house rent climbed higher, weighing immense pressure on households.
Analysts at Wells Fargo believe “Core CPI inflation remained entrenched at uncomfortably high levels. With core CPI up 0.5% in February, it is rising at an annualized rate of more than 5% whether measured on a 1-month, 3-month, or 12-month basis.” However, the agency cited that the 25 bps rate hike is still a distinct possibility if financial stresses ease.”
US Retail Sales and PPI to provide more clarity
After US inflation softening and mixed Employment data, investors are shifting their focus toward the release of the Retail Sales and Producer Price Index (PPI) data. Economists from NBF are of the view that “Car dealers likely contributed negatively to the headline number, as auto sales fell during the month. Gasoline station receipts, meanwhile, could have stayed more or less unchanged judging by the stagnation in pump prices. All told, headline sales could have contracted 0.7%, erasing only a fraction of January’s gain. Spending on items other than vehicles could have fared a little better, retreating just 0.5%.”
A deceleration in consumer resilience would further add to the expectations of a smaller rate hike by the Federal Reserve.
Furthermore, the release of the US PPI data will be keenly watched. Consensus says an expansion in the monthly US PPI by 0.3%, lower than the former release of 0.7%. While the annual figure would soften to 5.4% from the prior release of 6%. A decline in the PPI figures would indicate that producers are struggling to expand the prices of goods and services at factory gates due to a decline in the overall demand. Eventually, it would trim the demand for labor and the overall inflation ahead.
New Zealand Dollar to remain volatile ahead of GDP numbers
Investors are keenly awaiting the release of the New Zealand Gross Domestic Product (GDP) (Q4) for fresh impetus. As per the estimates, the NZ economy has contracted by 0.2% vs. a growth of 2.0% witnessed in the third quarter. The annual GDP (Q4) has expanded by 3.3%, lower than the prior expansion of 6.4%. A decline in the growth rate indicates subdued demand from households, which will relieve the stress of Reserve Bank of New Zealand (RBNZ) policymakers, which are making efforts in decelerating inflation expectations.
Meanwhile, Bloomberg reported, "New Zealand’s credit grades with S&P Global Ratings could come under pressure if the nation’s current account deficit remains too big.”. Data released on Wednesday in early Asia showed the current account deficit blew out to 8.9% of Gross Domestic Product (GDP) in 2022 as the nation imported more goods and services than it exported.
NZD/USD technical outlook
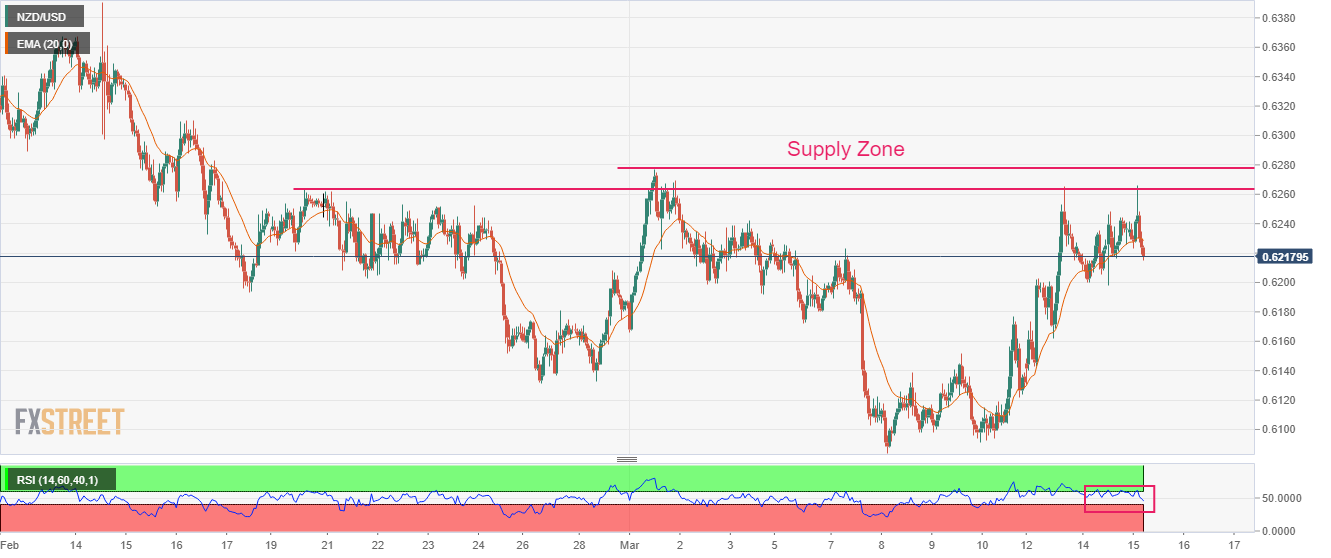
NZD/USD has faced immense heat near the supply zone placed in a range of 0.6264-0.6278 on an hourly scale. Anticipation for further downside has solidified as the Kiwi asset has surrendered the support of the 20-period Exponential Moving Average (EMA), which is currently near 0.6227.
Failure of the Relative Strength Index (RSI) (14) in recapturing the bullish range of 60.00-80.00, indicates a loss in the upside momentum.
- USD/JPY picks up bids to extend the previous day’s rebound from one-month low.
- US 10-year Treasury bond yields remain pressured but two-year counterpart increase.
- Global markets remain dicey despite cooling US inflation fears, easing SVB woes.
- Major Japanese companies promise fastest pace of pay hike since 1997 to meet PM Kishida's call for 3% increase.
USD/JPY seesaws around intraday high as it extends the previous day’s recovery from the monthly low to 134.55 during early Wednesday. In doing so, the Yen pair cheers the recently widening difference between the US 10-year and two-year Treasury bond yields. Adding strength to the upside momentum could be the fears of a less efficient wage increase in Japan and the Bank of Japan (BoJ) policymakers’ rejection of the tighter monetary policy.
The US 10-year Treasury bond stays mostly pressured around 3.68%, fading the previous day’s bounce, but the two-year bond coupons rise to 4.33% by the press time. It’s worth noting that the US 10-year Treasury bond yields, marked the biggest daily gain in five weeks the previous day whereas the two-year counterpart recovered from the six-month low.
Earlier in the day, the Bank of Japan’s (BoJ) slightly dovish Monetary Policy Meeting Minutes underpinned the USD/JPY upside. “It is important to continue with monetary easing,” said the Bank of Japan (BoJ) Minutes statement. The BoJ Minutes also stated that the members agreed Japan's inflation is likely to slow toward the latter half of the next fiscal year.
On the other hand, Japan witnesses positive results from the initial rounds of annual wage discussions, prominently called ‘shunto’ talks, as the Asian major looks to control inflation while also want to stay far from deflation conditions. “Some of Japan's biggest firms have already promised large pay hikes including auto giant Toyota Motor Corp. and fashion brand Uniqlo parent Fast Retailing,” reported Reuters. The news mentioned that the anticipated 3.0% hike in wages would meet Kishida's call for 3% rise but fall short of the ambitious 5% demanded by the Rengo labor umbrella group.
Elsewhere, downbeat US inflation data, increasing optimism towards Fed’s 0.25% rate hike in March and mixed sentiment entertain USD/JPY traders of late. On Tuesday, the US Consumer Price Index (CPI) and CPI ex Food and Energy both matched 6.0% and 5.5% YoY market forecasts, versus 6.4% and 5.6% respective previous readings. “The Federal Reserve is seen raising its benchmark rate a quarter of a percentage point next week and again in May, as a government report showed U.S. inflation remained high in February, and concerns of a long-lasting banking crisis eased,” said Reuters following the US inflation data release.
Alternatively, the global policymakers’ inability to convince the market of the risks emanating from the latest fallouts of the Silicon Valley Bank (SVB) and Signature Bank seem to help the USD/JPY pair to remain firmer.
While portraying the mood, the S&P 500 Futures remain sidelined despite Wall Street’s upbeat closing but MSCI’s Index of Asia-Pacific shares ex-Japan rise 1.19% by the press time.
Looking ahead, US Producer Price Index, NY Empire State Manufacturing Index and Retail Sales for February will be important for USD/JPY traders to watch while yields and shunto talks may offer additional directives to the Yen pair traders.
Technical analysis
An area comprising multiple tops marked since February 17, near 135.05-15, restricts immediate USD/JPY upside. Even if the quote traces the bullish MACD signals and crosses the 135.15 resistance, a convergence of the 50-SMA and the 100-SMA, around 135.65-70 by the press time, will be crucial to watch.
Meanwhile, a five-week-old horizontal support area near 133.90-85 appears a tough nut to crack for the Yen pair bears.
- Silver price prints minor gains inside immediate trading range established from Monday.
- 200-EMA, three-week-old horizontal resistance restricts short-term XAG/USD moves.
- RSI’s retreat from overbought territory, looming bear cross on MACD lure the Silver sellers.
- Road towards the south appears bumpier; bulls need validation from $22.60.
Silver price (XAG/USD) eases to $21.70 as it pares the intraday gains heading into Wednesday’s European session. In doing so, the bright metal defends a three-day-old trading range even as the bearish signals have recently gained momentum.
That said, the 200-bar Exponential Moving Average (EMA) puts a floor under the XAG/USD price of around $21.60 while a three-week-long horizontal line, around $22.00, restricts the metal’s short-term upside since the last Monday.
It should, however, be noted that the RSI line, placed at 14, eases from the overbought territory and joins the impending bear cross on the MACD signals to tease the Silver sellers.
A horizontal support comprising multiple levels marked since February 17, close to $21.20, could lure the XAG/USD bears on the break of $22.00.
In a case where the bullion remains bearish past $21.20, a fortnight-long broad support zone between $20.30 and $20.40, could challenge the sellers.
Alternatively, a clear upside break of the $22.00 hurdle will need validation from multiple tops marked during early February around $22.60 to convince the Silver buyers.
Overall, the Silver price remains sidelined but the bears are lurking behind the immediate support.
Silver price: Four-hour chart
-15032023-638144548537828630.png)
Trend: Limited downside expected
- The Indian Rupee failed to show strength on the softish US CPI release.
- The US macro framework is diluting aggressive Fed rate hiking.
- RBI looks to remain hawkish despite easing inflation.
USD/INR is not trading in line with its counterparts. The pair is not catching up with the US Dollar weakness. Falling US Treasury bond yields have led the US Dollar to lower. Despite that, the Indian Rupee failed to capitalize.
The United States Consumer Price Index (CPI) released on Tuesday had put the US Dollar on the sideline, as the inflationary matrix comes in line with expectations. The headlines MoM reading came in at 0.4% as expected, from the prior 0.5%, and YoY came in at 6.0% as expected, from the prior 6.4%. The core matrix MoM came in at 0.5% slightly higher than the 0.4% expected, and YoY came in at 5.5% in line with expectation.
The ex-shelter component signaled a slowdown, which is a beneficiary for the Federal Reserve (Fed). Starting this week, the Silicon Valley Bank’s (SVB) fallout has thrown a fresh wave of pessimism among investors, as the US banking regulators intervene to tackle the situation through a backstop as a rescue plan. But this situation has prompted a pessimistic mindset among investors for possible contagion risks.
Moving on to the US macro release, the calendar is due for US Retails Sales and Producer Price Index (PPI) on Wednesday, as well as the Empire State Manufacturing Index. It will be important to watch the Control Group from US retail sales as an impetus prior to the March FOMC meeting.
On the other hand, India’s Consumer Price Index (CPI) for February rose 6.44% YoY versus 6.35% expected and 6.52% prior. The aforementioned data will provide the Reserve Bank of India (RBI) to tick down on the hawkish bias, even though the market is still expecting a 25 basis point hike (bps) hike from the RBI. Despite of positive growth outlook and RBI’s hawkish stance, the Indian Rupee has failed to show strength.
Levels to watch
- AUD/USD is facing barricades near 0.6700 as USD Index has attempted a recovery.
- Sheer volatility is expected from the USD Index as investors are awaiting the US Retail Sales and PPI data.
- The Australian Dollar is likely to dance to the tunes of the Employment data, which will release on Thursday.
The AUD/USD pair has recovered to near the round-level resistance of 0.6700 in the Asian session. The Aussie asset is struggling to extend its gains ahead, however, the upside seems favored as the US Dollar Index (DXY) has lost its charm further after the decline in the United States Consumer Price Index (CPI) matched expectations.
The US Dollar Index (DXY) has shown a recovery move after printing a fresh monthly low at 103.44. Sheer volatility is expected from the USD Index as investors are awaiting the release of the US Retail Sales and Producer Price Index (PPI) data.
Meanwhile, the Australian Dollar is likely to dance to the tunes of the Employment data, which will release on Thursday. As per the consensus, the Australian economy has added fresh 48.5K jobs in February vs. 11.5K lay-offs registered in January. And, the Unemployment Rate is expected to drop to 3.6% from the former release of 3.7%.
AUD/USD has scaled to near the horizontal resistance plotted from February 27 low at 0.6700. The Aussie asset is facing selling pressure from the market participants and investors should build positions after a decisive move.
Advancing 20-period Exponential Moving Average (EMA) at 0.6680 is providing a cushion to the Australian Dollar.
Meanwhile, the Relative Strength Index (RSI) (14) is hovering near 60.00. A break into the bullish range of 60.00-80.00 will trigger the upside momentum.
Should the asset break above March 13 high at 0.6717, Aussie bulls would drive the asset toward March 03 high at 0.6775. A breach above the latter would expose the asset to further upside toward February 17 low at 0.6821.
On the contrary, a breakdown of Wednesday’s low at 0.6568 will drag the asset toward the horizontal support plotted from October 4 high at 0.6547 followed by the round-level support at 0.6500.
AUD/USD hourly chart
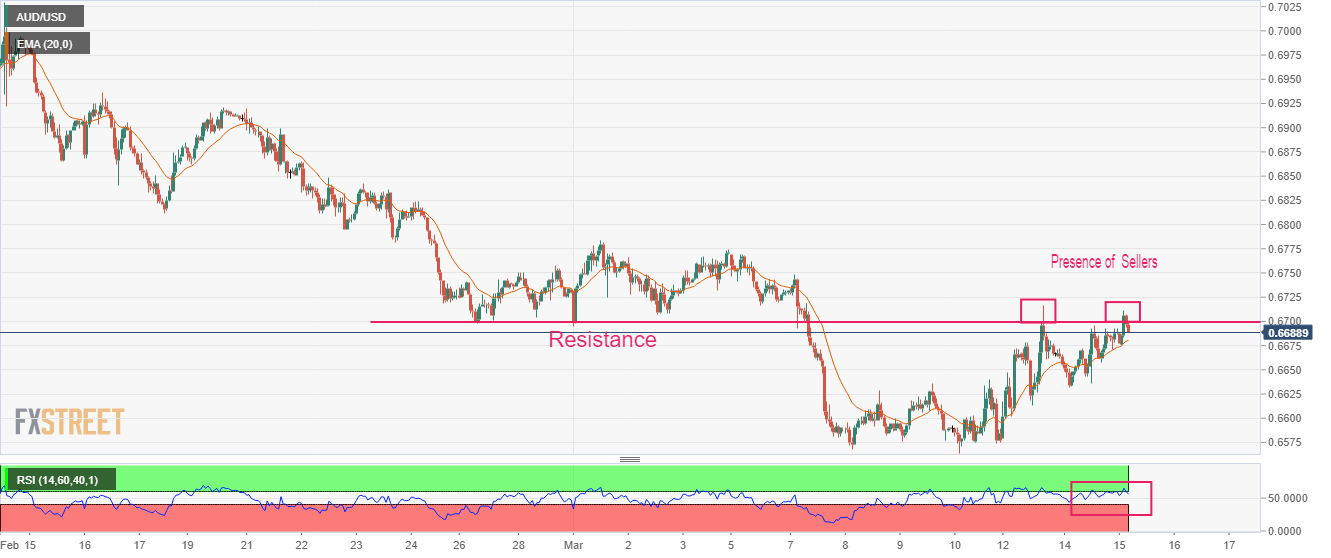
- EUR/USD clings to mild gains near one-month high, grinds near multi-day top of late.
- US Dollar traces downbeat Treasury bond yields as inflation data failed to bolster hawkish Fed bets.
- Receding fears of SVB, Signature Bank fallout also propel Euro prices.
- EU Industrial Production, US Retail Sales eyed for fresh impulse.
EUR/USD pares intraday gains from the highest levels in one month as it slides to 1.0745 heading into Wednesday’s European session. In doing so, the Euro pair struggles for clear directions even as the broadly weaker US Treasury bond yields and the US Dollar keep the bulls hopeful ahead of the key statistics from the Eurozone and the US.
The Euro pair’s latest weakness could be linked to the widening difference between the 10-year and two-year Treasury bond yields as the former stays mostly pressured around 3.68%, fading the previous day’s bounce, but the two-year bond coupons rise to 4.33% by the press time. It’s worth noting that the US 10-year Treasury bond yields, marked the biggest daily gain in five weeks the previous day whereas the two-year counterpart recovered from the six-month low.
Apart from the yields, the mixed sentiment in the market also tests the EUR/USD bulls of late. That said, the S&P 500 Futures remain sidelined despite Wall Street’s upbeat closing but MSCI’s Index of Asia-Pacific shares ex-Japan rise 1.19% by the press time.
While tracing the moves, downbeat US inflation data, increasing optimism towards Fed’s 0.25% rate hike in March and mixed sentiment major attention. On Tuesday, the US Consumer Price Index (CPI) and CPI ex Food and Energy both matched 6.0% and 5.5% YoY market forecasts, versus 6.4% and 5.6% respective previous readings. “The Federal Reserve is seen raising its benchmark rate a quarter of a percentage point next week and again in May, as a government report showed U.S. inflation remained high in February, and concerns of a long-lasting banking crisis eased,” said Reuters following the US inflation data release.
Alternatively, the European and the US policymakers’ inability to convince the market of the risks emanating from the latest fallouts of the Silicon Valley Bank (SVB) and Signature Bank seem to challenge the EUR/USD upside.
US Senate Banking Committee Chairman Sherrod Brown and Federal Reserve Governor Michelle Bowman ruled out chatters suggesting the grim conditions of the US banking industry late Tuesday. However, Wall Street Journal (WSJ) reported that a raft of tougher capital and liquidity requirements are under review, as well as steps to beef up annual “stress tests” that assess banks’ ability to weather a hypothetical recession, according to a person familiar with the latest thinking among U.S. regulators.
On the other hand, European Central Bank (ECB) policymaker Yannis Stournaras said, during an interview with a Greek newspaper, that he doesn’t see any impact from the collapse of Silicon Valley Bank (SVB) on Eurozone banks. Previously, Eurogroup's President Paschal Donohoe mentioned, “Euro-area has very limited exposure to SVB.”
Hence, the mostly softer US Treasury bond yields exert downside pressure on the US Dollar, especially after the previous day’s downbeat inflation data. However, Eurozone Industrial Production for January, expected 0.4% MoM versus -1.1% prior, will precede the US Producer Price Index, NY Empire State Manufacturing Index and Retail Sales for February to direct short-term EUR/USD moves.
Technical analysis
A daily closing beyond 50-DMA keeps EUR/USD bulls hopeful of poking the mid-February highs surrounding 1.0805.
"New Zealand’s credit grades with S&P Global Ratings could come under pressure if the nation’s current account deficit remains too big," reported Bloomberg early Wednesday morning in Europe.
More to come
- GBP/USD has continued to oscillate in the 50-pip range as investors await the UK budget for fresh impetus.
- The USD Index has printed a fresh monthly low at 104.33 as the odds of bigger rates announcement by the Fed have faded.
- UK’s tax-free pension allowances would favor less early retirement.
The GBP/USD pair has managed to defend its cushion around 1.2150 in the Asian session. The Cable is inside the woods, auctioning in a range of 1.2150-1.2200 for the past two trading sessions. A sheer volatility is expected from the cable as United Kingdom Finance Minister (FM) will announce the fiscal budget for CY2023.
The UK economy has operated under the clouds of uncertainty in the past year due to double-digit inflation, shortage of labor, supply chain bottlenecks, a pile-up of debt, political instability, and subdued activity. Therefore, a promising budget is expected from UK Hunt ahead.
Financial Times reported that UK FM is expected to raise UK tax-free pension allowances to discourage early retirement. The UK economy has been facing an extreme shortage of labor, which has been a major factor behind the double-digit inflation figure. Therefore, the tax-free pension allowances will also the working labor force to make more savings than usual and they might avoid early retirement.
Apart from them, discussions on energy support and the declaration of investment zones will be major agendas in the financial budget.
Meanwhile, the recording of fresh monthly lows by the US Dollar Index (DXY) has also provided a cushion to the Cable. The USD Index has printed a fresh monthly low at 104.33 as the odds of bigger rates announcement by the Federal Reserve (Fed) have faded. S&P500 futures have recovered early morning losses, portraying a significant improvement in the risk appetite of the market participants.
For further guidance, the United States Retail Sales data will be keenly watched. Monthly Retail Sales data is expected to contract by 0.3% vs. the former release of 3% expansion. This indicates that resilience in consumer spending is easing and the Fed is on track of achieving the 2% inflation target.
- USD/IDR keeps bounce off one-week low, snaps three-day downtrend, after Indonesia foreign trade numbers.
- Indonesia Exports drop 4.51% in February versus 5.0% expected, 16.37% prior.
- Cautious optimism in Asia fails to favor Rupiah bulls amid sluggish session.
- US Retail Sales, risk catalysts eyed for clear directions.
USD/IDR stays defensive near 15,375-80, fading the bounce off intraday low, after Indonesia released downbeat prints of foreign trade numbers early Wednesday. However, cautious optimism in Asia and the US Dollar’s failure to keep the previous day’s corrective run-up seem to put a floor under the Indonesia Rupiah (IDR) Pair.
Indonesia's Exports nosedive to 4.51% in February from 16.37% growth marked in the last month, versus 5.0% market forecasts. Further, Imports slump to -4.32% versus 9.74% market forecasts and 1.27% prior while the Trade Balance improves to $5.48B from $3.87B prior and $3.27B expected.
Elsewhere, the market’s mixed feelings amid indecision over the risks emanating from the latest fallouts of the Silicon Valley Bank (SVB) and Signature Bank join downbeat Treasury bond yields restrict the USD/IDR pair moves. It should be noted, however, that the mildly bid Asian market seems to keep the pair sellers hopeful.
That said, the S&P 500 Futures remain sidelined despite Wall Street’s upbeat closing but MSCI’s Index of Asia-Pacific shares ex-Japan rise 1.19% by the press time. Further, the US 10-year Treasury bond yields grind near 3.68% by the press time, after posting the biggest daily gain in five weeks the previous day, whereas the two-year bond coupons struggle to extend the previous day’s recovery from the six-month low, mildly bid near 4.30% at the latest.
If we analyze the latest weakness in the US Treasury bond yields, downbeat US inflation data, increasing optimism towards Fed’s 0.25% rate hike in March and mixed sentiment major attention. On Tuesday, the US Consumer Price Index (CPI) and CPI ex Food and Energy both matched 6.0% and 5.5% YoY market forecasts, versus 6.4% and 5.6% respective previous readings. “The Federal Reserve is seen raising its benchmark rate a quarter of a percentage point next week and again in May, as a government report showed U.S. inflation remained high in February, and concerns of a long-lasting banking crisis eased,” said Reuters following the US inflation data release.
Having witnessed the initial market reaction to Indonesia’s foreign trade numbers, the USD/IDR pair traders should keep their eyes on the US Producer Price Index, NY Empire State Manufacturing Index and Retail Sales for February for clear directions.
Technical analysis
A daily closing beyond the six-week-old ascending trend line, previous support near 15,385, becomes necessary to convince USD/IDR bulls. Otherwise, a gradual south-run towards the 200-DMA support of near 15,215 can’t be ruled out.
- Gold price eyes March high at the $1,915 mark amid falling yields.
- US CPI release looks pessimistic for the US Dollar.
- US Retail Sales and PPI data are the highlights for the day.
Gold price is consolidating above the $1,900 mark amid a softer US Dollar and positive risk sentiment. The US Consumer Price Index (CPI) released on Tuesday relaxed investors as the data came in line with expectations.
The US CPI headlines MoM reading came in at 0.4% from the prior 0.5%, and the YoY reading came in at 6.0% from the prior 6.4%. The core component MoM came in at 0.5%, slightly higher than the prior 0.4%, and YoY variant came in at 5.5% from 5.6%. The service, excluding the shelter component, came in softer than expected. The aforementioned data has been perceived positively by investors and as a result, a surge has been seen in US equity complexes on Tuesday.
Investors have become increasingly cautious and concerned about Tuesday's US CPI release due to the fallout from Silicon Valley Bank (SVB), which has highlighted the underlying damage within the US banking and financial system. As a result, the Federal Reserve (Fed) may need to halt its rate-hiking cycle sooner than expected to address the situation. However, a stronger US CPI release could pose a challenge to this plan.
Nevertheless, a relatively calm US CPI release has made Fed’s job a little easy, as the most concerning part of the inflationary matrix, ex-shelter, had signaled some easing.
Regarding current market dynamics, the March FOMC meeting could be a one and done deal for the rate hiking cycle, and the market could speculate on the possibility for a rate cut at the end of 2023. However, more clarity is needed on that front.
Moving on to the economic calendar, US Retails Sales data and Producer Price Index (PPI) is on the docket for Wednesday.
It will be important to watch the US Retail Sales data if it signals any muted retail activity prior to the FOMC meeting on March 22.
Levels to watch
- Oil price has gradually scaled to near $72.50, further upside looks capped ahead of oil inventory data.
- A fresh monthly low by the USD Index at 103.44 has infused fresh blood into the oil price.
- Declining 20-period EMA and weak RSI (14) are indicating further downside for black gold.
West Texas Intermediate (WTI), futures on NYMEX, had shown a recovery move from $71.00. The recovery move has gradually moved to near $72.26. Further upside in the oil price looks restricted as investors are still worried about global demand amid rising rates by western central banks.
The recovery move in the oil price is backed by a sell-off in the US Dollar Index (DXY). The USD Index has refreshed its monthly low at 103.44 as the declining US Consumer Price Index (CPI), higher Unemployment Rate, and the catastrophic collapse of Silicon Valley Bank (SVB) are compelling for a less hawkish interest rate hike from the Federal Reserve (Fed) in its monetary policy meeting scheduled for next week.
Going forward, the release of the weekly oil inventory data by the US Energy Information Administration (EIA) will be of utmost importance.
After a responsive buying move from March 14 low at $71.00, the oil price is challenging the critical resistance plotted from February 6 low at $72.60. It would be better to adopt a ‘wait and watch’ approach before making any position as the recovery move looks solid on the two-hour scale and carries the potential of delivering a breakout above the same.
The declining 20-period Exponential Moving Average (EMA) at $73.56 still favors the downside bias.
Adding to that, the Relative Strength Index (RSI) (14) is also oscillating in the bearish range of 20.00-40.00, which indicates that the downside momentum is not over yet.
Should the oil price decisively breaks above the 73.00 resistance, bulls will drive the asset toward March 10 low around $75.00 and March 12 high at $77.50.
Alternatively, a breakdown of March 14 low at $71.00 will expose the asset to a fresh 15-month low at $66.10, which is 20 December 2021 low followed by 30 November 2021 low at $64.40.
WTI two-hour chart
-638144488823162668.png)
- USD/MXN remains sidelined near one-week-old ascending support line after falling the most since March 2022.
- Clear U-turn from 2.5-month-old descending resistance line, bearish MACD signals keep sellers hopeful.
- 200-SMA acts as an extra filter towards the south.
USD/MXN holds lower ground near 18.61 as bears poke one-week-old ascending support line during early Wednesday. In doing so, the Mexican Peso (MXN) pair justifies the bearish MACD signals, as well as the quote’s U-turn from a downward-sloping resistance line from December 30, 2022.
It’s worth noting that the 200-SMA level surrounding 18.50 acts as additional support, other than the aforementioned trend line of near 18.60.
In a case where USD/MXN remains weak past 18.50, the odds of witnessing a slump towards the weekly low near 18.20 and then to the March 07 peak of 18.17 can’t be ruled out.
Should the MXN pair manage to conquer the 18.17 support, the bears can quickly approach the 18.00 psychological magnet before eyeing the monthly low of 17.90, also the lowest levels since October 2018.
On the contrary, USD/MXN recovery could initially aim for the 50% and 61.8% Fibonacci retracement level of the pair’s declines from late December 2022 to early March 2023, respectively near 18.75 and 18.95 in that order.
However, the pair buyers remain off the table unless successfully cross the multi-day-old resistance line, around the 19.00 round figure.
Overall, USD/MXN is likely to remain bearish even as the downside room appears limited.
USD/MXN: Four-hour chart
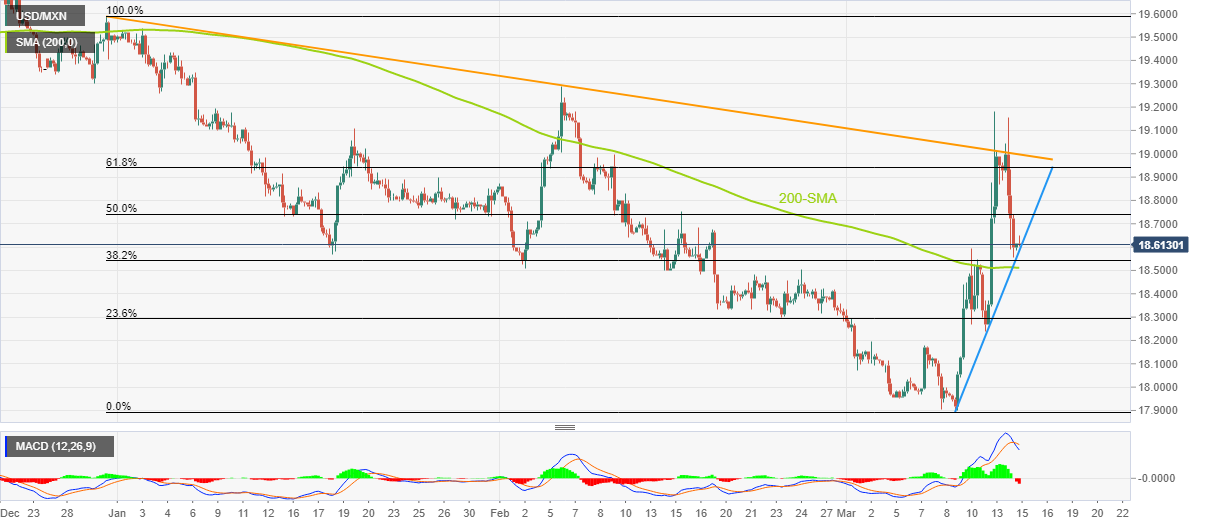
Trend: Further downside expected
- USD/CAD renews intraday low during four-day losing streak.
- Cautious optimism in the market, pullback in yields weigh on US Dollar.
- Hopes of more energy demand, no change in OPEC supply cut agreement trigger Oil price rebound.
- US Retail Sales, Canada Housing Starts can direct intraday traders.
USD/CAD holds lower grounds near the one-week bottom, marked the previous day, as it prints mild losses near 1.3670 during a four-day south-run amid early Wednesday in Europe. In doing so, the Loonie pair cheers the broad US Dollar weakness and the latest recovery in Canada’s key export item WTI crude oil.
US Dollar Index (DXY) reverses the previous day’s corrective bounce as it prints 0.16% intraday losses near 103.50 while tracing the latest pullback in the US Treasury bond yields. That said, the US 10-year Treasury bond yields slip to 3.66%, after posting the biggest daily gain in five weeks on Tuesday, whereas the two-year bond coupons struggle to defend the previous day’s recovery from the six-month low near 4.27% at the latest.
On the other hand, WTI crude oil portrays the first daily gain in three while extending the bounce off a three-month low to $72.40 by the press time. While the US Dollar’s weakness could be linked to the black gold’s latest gains, upbeat China Retail Sales and Industrial Production joins the hopes of more energy demand, backed by the OPEC forecasts, keep the energy buyers positive. On the same line, Saudi Arabia’s Energy Minister Prince Abdulaziz bin Salman said that “the OPEC+ alliance will stick to production cuts to the end of 2023.”
While tracing the latest weakness in the yields, downbeat US inflation data and cautious optimism gain major attention. On Tuesday, the US Consumer Price Index (CPI) and CPI ex Food and Energy both matched 6.0% and 5.5% YoY market forecasts, versus 6.4% and 5.6% respective previous readings. “The Federal Reserve is seen raising its benchmark rate a quarter of a percentage point next week and again in May, as a government report showed U.S. inflation remained high in February, and concerns of a long-lasting banking crisis eased,” said Reuters following the US inflation data release.
Elsewhere, policymakers from Japan, Canada and the US have recently ruled out chatters suggesting the grim conditions of their respective banks after the latest fallouts of the Silicon Valley Bank (SVB) and Signature Bank.
While portraying the mood, S&P 500 Future print mild gains by tracing the upbeat performance of Wall Street.
Looking ahead, Canadian Housing Starts for February precede the US Producer Price Index, NY Empire State Manufacturing Index and Retail Sales for February to direct short-term USD/CAD moves. Also important will be the official crude oil inventory from the US Energy Information Administration.
Technical analysis
A daily closing below the one-month-old ascending trend line, now immediate resistance near 1.3735, directs USD/CAD bears toward the 21-DMA support of 1.3615.
In an interview with Energy Intelligence on Tuesday, Saudi Arabia’s Energy Minister Prince Abdulaziz bin Salman said that “the OPEC+ alliance will stick to production cuts to the end of 2023.”
“There are those who continue to think we would adjust the agreement ... I say they need to wait until Friday, Dec 29 2023 to demonstrate to them our commitment to the current agreement,” he added.
Market reaction
Following these comments, WTI is challenging daily highs near $72.50, adding 1.04% on the day.
Having attended the Bank for International Settlements (BIS) meeting earlier this week, Bank of Japan’s (BoJ) outgoing Governor Haruhiko Kuroda said that “there was a debate on SVB collapse mainly around the impact on global markets.”
“Participants at BIS meetings appeared relieved to see US authorities act swiftly to contain the damage from the collapse of SVB,” he added.
On monetary policy, Kuroda said,
BoJ must maintain current monetary easing, but there will also likely be scope to consider steps to address side-effects of easy policy.
By maintaining current easy policy, it's possible to sustainably, stably achieve our price target, accompanied by wage growth, while looking after side-effects of our policy.
Related reads
- Japan’s Suzuki: It's goal of government to achieve pace of wage rises higher than that of inflation
- USD/JPY Price Analysis: Justifies bear cross with mild losses near 134.00
- USD/JPY retreats from intraday high, reverses the previous day’s bounce off one-month low.
- 50-SMA pierces off 100-SMA from above to portray bearish signal.
- Downbeat RSI, failure to cross three-week-old horizontal resistance keep sellers hopeful.
- Multiple tops marked since early February, two-month-long ascending support line challenge Yen pair bears.
USD/JPY takes offers to renew intraday low around 134.00 during early Wednesday as the Yen pair sellers reverse the previous day’s corrective bounce off a one-month low. In doing so, the quote justifies the bearish signals from the moving average crossover, as well as the downbeat Relative Strength Index (RSI) line, placed at 14.
That said, the 50-SMA prods the 100-SMA from above and joins the downbeat RSI line to suggest the USD/JPY pair’s further declines.
However, a five-week-old horizontal support area near 135.90-85 appears a tough nut to crack for the Yen pair bears.
In a case where the USD/JPY slips beneath the 135.85 support, the odds of witnessing an extended south-run towards a two-month-old ascending support line, close to 130.55 by the press time, can’t be ruled out.
Meanwhile, an area comprising multiple tops marked since February 17, near 135.05-15, restricts immediate USD/JPY upside.
Even if the quote traces the bullish MACD signals and crosses the 135.15 resistance, a convergence of the 50-SMA and the 100-SMA, around 135.65-70 by the press time, will be crucial to watch as it holds the key for the USD/JPY run-up towards the monthly high of 137.91.
USD/JPY: Four-hour chart
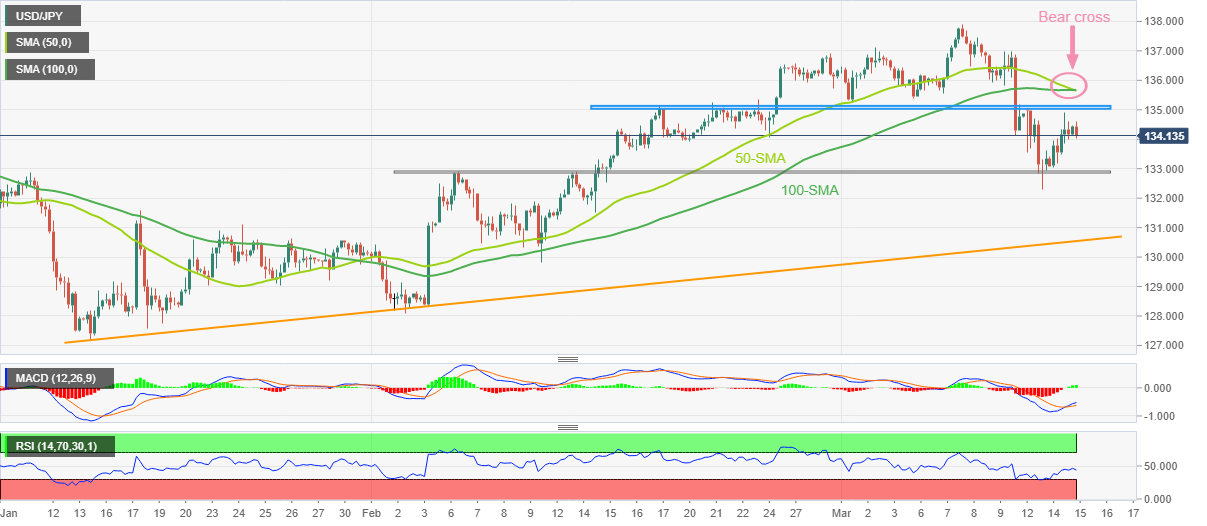
Trend: Further downside expected
| Raw materials | Closed | Change, % |
|---|---|---|
| Silver | 21.688 | -0.46 |
| Gold | 1903.72 | -0.43 |
| Palladium | 1507.59 | 2.69 |
Japanese Finance Minister Shunichi Suzuki said on Wednesday that “it's the goal of the government to achieve the pace of wage rises higher than that of inflation.”
Additional comments
Govt will debate fate of BoJ-govt joint statement with new BoJ governor, so premature to comment on specifics.
Govt, BoJ share view achieving wage hikes important.
Current joint statement stipulates BoJ goal of achieving price rises accompanied by wage hike.
Meanwhile, Japan’s Chief Cabinet Secretary Hirokazu Matsuno said that they “hope the move of wage hikes among big companies would influence small, mid-sized and regional firms.”
Market reaction
USD/JPY is down to testing the 134.00 level once again, tracking the renewed weakness in the US Dollar, despite firmer US Treasury bond yields. The pair is shedding 0.12% on the day to trade at 134.07, as of writing.
Following the release of the key economic data from China, the country’s National Bureau of Statistics (NBS) released a statement, via Reuters, expressing their outlook on the economy.
Key quotes
Economic operations show stabilizing and recovery.
Foundation of economic recovery not solid yet.
China's employment basically stable, rise in Feb jobless rate due to seasonable factors.
China's economy still faces many difficulties this year, including global risks.
2023 growth target of around 5% in line with economic reality.
Setting excessively high growth target unfavourable for higher quality growth.
Faces pressure and challenges in achieving 2023 growth target.
Expects continued policy tightening in some countries as inflation stays high.
Related reads
- China’s Jan-Feb Retail Sales jump 3.5%, Industrial Output grows 2.4%
- USD/CNH seeks support around 6.8800 as Chinese Retail Sales justify expectations
- USD/CNH is gauging support around 6.8800 as China’s retail demand matches consensus.
- S&P500 futures have registered marginal losses in the Asian session after truck-load gains on Tuesday.
- Weak auto sales numbers and stagnant gasoline demand indicate a contraction in US Retail Sales figures.
The USD/CNH pair is gauging a cushion around 6.8800 as China’s National Bureau of Statistics (NBS) has reported flat Retail Sales (Feb) data. The economic data has expanded by 3.5%, in line with the consensus and solid than the prior contraction of 1.8% on an annual basis. It looks like retail demand is recovering after the rollback of pandemic controls by the Chinese administration.
Apart from that, annual Industrial production (Feb) has landed at 2.4%, lower than the estimates of 2.7% but higher than the former release of 1.3%.
The US Dollar Index (DXY) has failed in extending its recovery above 103.80 and has dropped again, portraying a capped upside amid the risk-appetite theme. A spree of United States inflation softening has trimmed the appeal for the USD Index dramatically. The USD Index looks vulnerable above 103.50 and soaring expectations for a less-hawkish monetary policy by the Federal Reserve (Fed) would drag it further for fresh lows.
S&P500 futures have registered marginal losses in the Asian session after truck-load gains on Tuesday as investors cheered the declining US inflationary pressures. Also, accelerating odds of a smaller rate hike from Fed chair Jerome Powell has trimmed fears of a recession in the US economy.
Meanwhile, the return on 10-year US Treasury bonds has trimmed marginally to 3.67% as odds for a 25 basis point (bps) rate hike have escalated further. As per the CME FedWatch tool, more than 82% chances indicate a push in the interest rate to 4.75-5.00%.
For further guidance, monthly US Retail Sales (Feb) data will be keenly watched. According to the estimates from NBF, “Car dealers likely contributed negatively to the headline number, as auto sales fell during the month. Gasoline station receipts, meanwhile, could have stayed more or less unchanged judging by the stagnation in pump prices. All told, headline sales could have contracted 0.7%, erasing only a fraction of January’s gain. Spending on items other than vehicles could have fared a little better, retreating just 0.5%.”
- EUR/USD bulls are tiring as the US dollar finds its footing.
- US CPI was hot and has kept the Fed rate hike thesis alive and kicking.
EUR/USD is flat on the day so far and trading near 1.0742 and staying within a range of 1.0725 and 1.0742. Overnight, banking stocks surged back and bonds and interest rate futures despite the collapse of some US banks over the past few days. Instead, fears of contagion in the U.S. banking system have reduced and the US Dollar has found its footing again.
US CPI supports US Dollar
Investors are treading cautiously ahead of next week´s Federal Open Market Committee meeting. The US Consumer Price Index (CPI) rose 0.4% last month after accelerating 0.5% in January. In the 12 months through February, the CPI increased by 6.0%, a slower pace than the 6.4% annualized gain in January, however, this was still above the Federal Reserve's 2% target, as such, the US Dollar found some demand on the data and printed the session high in the US but it has since turned lower while futures priced in a Fed rate cut by year's end.
Fed expectations
There are mixed sentiments on whether the still solid rise in inflation will push the Fed to raise rates again next week.
The banking sector concerns due to the collapse of Silicon Valley Bank and Signature Bank have caused turmoil in financial markets. Markets are in anticipation of a terminal rate of 4.45% for December, down from more than 5% last week. Fed funds futures also reveal a change in sentiment with regard to this month's FOMC meeting. However, the CME´s Fed Watch Tool shows a 28.4% likelihood the Fed would stand pat at the end of its two-day policy meeting on March 22, slightly down from the prior day following the CPI data.
Looking ahead, the Europen Central Bank will be key. Analysts at TD Securities explained that they expect the central bank to hike rates by 50bps and drop its one-meeting-ahead forward guidance, emphasizing data dependency from here. ´´But during the press conference,´´ they said, ´´Lagarde is likely to keep a 50bps hike on the table for May's meeting. Projections are likely to show weaker headline inflation and stronger core inflation and growth.´´
- AUD/USD extends bounce off intraday low after China data, PBOC news.
- China Industrial Production, Retail Sales improved in February, PBOC keeps one-year MLF unchanged.
- Market sentiment stays dicey amid mixed signals surrounding Fed and Silicon Valley Bank (SVB) fallout risks.
- US Retail Sales, Australia employment figures eyed for clear directions.
AUD/USD picks up bids to extend the recovery from the intraday low towards 0.6700 even as markets remain dicey Australia’s biggest customer, namely China, prints mixed data during early Wednesday.
That said, China’s Industrial Production 2.4% during January-February period versus 2.6% expected and 1.3% prior whereas the Retail Sales matches 3.5% forecasts during the stated period compared to -1.8% prior. Earlier in the day, the People’s Bank of China (PBOC) held its one-year benchmark rate, namely the one-year Medium-term Lending Facility (MLF) rate, unchanged at 2.75%.
Also read: China’s Jan-Feb Retail Sales jump 3.5%, Industrial Output grows 2.4%
Apart from the data, the market’s mixed feelings surrounding the risks emanating from the latest fallouts of the SVB and Signature Bank also seem to challenge AUD/USD buyers. That said, US Senate Banking Committee Chairman Sherrod Brown and Federal Reserve Governor Michelle Bowman ruled out chatters suggesting the grim conditions of the US banking industry late Tuesday. However, Wall Street Journal (WSJ) reported that a raft of tougher capital and liquidity requirements are under review, as well as steps to beef up annual “stress tests” that assess banks’ ability to weather a hypothetical recession, according to a person familiar with the latest thinking among U.S. regulators.
On a different page, recently increasing optimism for the US Federal Reserve’s (Fed) 0.25% rate hike in March should have prodded the AUD/USD bulls but could not.
On Tuesday, the US Consumer Price Index (CPI) and CPI ex Food and Energy both matched 6.0% and 5.5% YoY market forecasts, versus 6.4% and 5.6% respective previous readings. “The Federal Reserve is seen raising its benchmark rate a quarter of a percentage point next week and again in May, as a government report showed U.S. inflation remained high in February, and concerns of a long-lasting banking crisis eased,” said Reuters following the US inflation data release. At home, downbeat Aussie Westpac Consumer Confidence for March and softer prints of the National Australia Bank’s sentiment data for February, published the previous day, keep the AUD/USD bears hopeful.
Against this backdrop, S&P 500 Futures remain sidelined despite Wall Street’s upbeat closing. Further, the US 10-year Treasury bond yields grind near 3.68% by the press time, after posting the biggest daily gain in five weeks the previous day, while the two-year bond coupons extend the previous day’s recovery from the six-month low to 4.31% at the latest.
Looking ahead, US Retail Sales for February, expected -0.3% MoM versus 3.0% prior, will be important for intraday directions. However, major attention will be given to Thursday’s Australia jobs report for February and the Reserve Bank of Australia (RBA) Bulletin for the fourth quarter (Q4).
Technical analysis
A six-week-old descending resistance line, around 0.6700 by the press time, joins sluggish RSI (14) and indecisive MACD signals to challenge the AUD/USD pair buyers.
China’s January-February Retail Sales YoY, jumped 3.5% vs. 3.5% expected and -1.8% previous while the country’s Industrial Production came in at 2.4% YoY vs. 2.7% estimated and 1.3% prior.
Meanwhile, the Fixed Asset Investment increased to 5.5% YTD YoY in January-February vs 4.5% expected and 5.1% last.
Market reaction
The Australian Dollar is finding some support from the mixed Chinese data release. The AUD/USD pair is looking to regain 0.6700, adding 0.18% on the day, as of writing.
- NZD/USD is on a bullish ride in a relaxed market mood.
- US CPI comes in almost in line with softening service-led inflation.
- The New Zealand GDP data is in focus on measuring the cyclone impact.
NZD/USD is keeping its bullish momentum intact after hitting the low near0.6220 level. The NZD/USD advance comes on the back of US Dollar weakness amid falling US Treasury bond yields. The high beta currency was also kicked up by firmer equity complexes from the last three days.
The US Dollar-driven move underpinned the pair, earlier in the week, after the recent fallout of Silicon Valley Bank (SVB) and Signature Bank. The aforementioned incident made a direct impact on US Treasury yield complexes.
The shorter end of the yield curve has come under considerable pressure after the SVB fallout and prompted investors to price out for a 50 basis point (bps) rate hike expectation for the March FOMC meeting.
Even though the worsening underlying financial ecosystem has prompted the market participants to range from no Fed rate hike to a 25 bps hike.
Meanwhile, the US Consumer Price Index (CPI) released on Tuesday came in line with expectations. The headline MoM figure came in at 0.4% as expected, from the prior 0.5%, and the YoY figure came in at 6% in line with expectation, from the prior 6.4%. The MoM core reading came in slightly higher at 0.5% vs. 0.4% expected, from the prior 0.4% and core YoY 5.5% in line with the expectation from the prior 5.6%.
On the other hand, the economic calendar will feature the Gross Domestic Product (GDP) data for New Zealand on Thursday. The quarterly reading for Q4, 2022 is expected around -0.2%, QoQ, and 3.3% YoY from the prior 2% and 6.4%, respectively. The expected slowdown is attributed to Cyclone Gabrielle, which has affected at least a third of New Zealand's population of five million. Any significant deviation on the downside may prompt the Reserve Bank of New Zealand (RBNZ) to take a pause in the rate hiking cycle.
The immediate focus now remains on the Chinese activity data for fresh trading impetus on the Kiwi pair.
Levels to watch
- EUR/JPY is facing hurdles in extending its recovery move above 144.40, upside bias still intact.
- Hawkish ECB bets have supported the Euro amid an absence of contagion effects in the European banking sector.
- The RSI (14) is on the verge of shifting into the bullish range of 60.00-80.00.
The EUR/JPY pair is struggling to extend its gains above the immediate resistance of 144.40 in the Asian session. The cross is expected to extend its upside journey as the release of the dovish Bank of Japan (BoJ) minutes has impacted the Japanese Yen.
Ex-BoJ Governor Haruhiko Kuroda maintained its expansionary stance on monetary policy in order to stabilize inflation above the 2% target for a sustained period. Japan’s domestic demand has not picked up yet and wages are still vulnerable to trigger price pressures.
On the Eurozone front, the European Central Bank (ECB) is expected to continue its 50 basis points (bps) interest rate hike spell as inflation has spiked again and restrictive monetary policy could support in taming the persistent inflation.
Economists at Commerzbank are of the view that “From the market’s point of view, the ECB has suddenly become one of the most hawkish central banks, which might support the Euro as long as there are no contagion effects in the European banking sector.”
A V-shape recovery demonstrated by EUR/JPY on March 13 low at 141.37 amid hawkish ECB bets has pushed it back into the long consolidation formed on an hourly scale. The consolidation has formed in a wide range of 143.87-145.57 and a break into the same indicates solid strength in the Euro bulls.
The 20-period Exponential Moving Average (EMA) at 143.93 would continue to provide a cushion to the Euro.
Meanwhile, the Relative Strength Index (RSI) (14) is on the verge of shifting into the bullish range of 60.00-80.00. An occurrence of the same would trigger the upside momentum.
Going forward, an upside move above the round-level barricade of 145.00 will drive the cross toward March 02 high at 145.57, followed by November 23 high at 146.14.
On the flip side, a downside move below March 14 low at 142.53 would negate the bullish reversal and will expose the cross to February 24 low at 142.13. A slippage below the latter would further drag the asset toward March 13 low at 141.37.
EUR/JPY hourly chart
-638144407488181898.png)
- GBP/USD remains sidelined after reversing from one-month high.
- Hopes of growth-oriented UK budget underpins Cable’s rebound but BoE concerns weigh on prices.
- US Dollar traces firmer yields as Fed bets regain hawkish bias even as US inflation failed to impress traders.
- SVB headlines, bond market moves should also be watched for fresh impulse.
GBP/USD portrays the typical pre-data anxiety as it seesaws around 1.2150-60 during early Wednesday. That said, the Cable pair traders await the key UK Budget Report, as well as the US Retail Sales for February, amid mixed sentiment and sluggish markets.
It should be noted that the mostly mixed UK data and a lack of hawkish bias surrounding the Bank of England (BoE) seem to weigh on the GBP/USD prices amid the cautious mood ahead of an important event.
On Tuesday, UK’s headline ILO Unemployment Rate reprinted 3.7% for three months to January versus 3.8% expected whereas the Claimant Count Change improved to -11.2K in February from -30.3K (revised) prior and -12.4K market forecasts. Further details suggest that the Average Earnings Including Bonus matched 5.7% analysts’ estimations for three months to January, versus an upwardly revised 6.0% prior, whereas the ex-Bonus figures came in as 6.5% compared to 6.6% expected and 6.7% previous readings. Following the UK data, the odds of the Bank of England’s (BoE) easy rate hikes, or policy pivot, gained attention. “Growth in pay in Britain - which the Bank of England is watching closely as it weighs up whether to pause its run of interest rate hikes next week - lost pace in the three months to January, official data showed on Tuesday,” said Reuters.
Additionally, the latest survey details from the UK Incomes Data Research (IDR) suggests that British employers agreed on pay rises averaging 5.0% during the three months to the end of January, well above historic norms, and a tight labor market means pay settlements are likely to remain high.
On the other hand, the US Consumer Price Index (CPI) and CPI ex Food and Energy both matched 6.0% and 5.5% YoY market forecasts, versus 6.4% and 5.6% respective previous readings. It should be noted that the market consensus of 0.4% MoM for the CPI, versus 0.5% prior, also proved right but the CPI ex Food & Energy rose to 0.5% compared to 0.4% analysts’ estimates and prior. “The Federal Reserve is seen raising its benchmark rate a quarter of a percentage point next week and again in May, as a government report showed U.S. inflation remained high in February, and concerns of a long-lasting banking crisis eased,” said Reuters following the US inflation data release.
Talking about the risks, the US policymakers’ rejections of fears emanating from the latest fallouts of the Silicon Valley Bank (SVB) and Signature Bank seem to help the US Dollar regain its upside bias, especially amid recently firmer Fed bets. Late on Tuesday, US Senate Banking Committee Chairman Sherrod Brown and Federal Reserve Governor Michelle Bowman ruled out chatters suggesting the grim conditions of the US banking industry. However, Wall Street Journal (WSJ) reported that a raft of tougher capital and liquidity requirements are under review, as well as steps to beef up annual “stress tests” that assess banks’ ability to weather a hypothetical recession, according to a person familiar with the latest thinking among U.S. regulators. “The rules could target firms with between $100 billion to $250 billion in assets, which at present escape some of the toughest requirements,” per WSJ.
Amid these plays, S&P 500 Futures remain sidelined despite Wall Street’s upbeat closing. Further, the US 10-year Treasury bond yields grind near 3.68% by the press time, after posting the biggest daily gain in five weeks the previous day, while the two-year bond coupons extend the previous day’s recovery from the six-month low to 4.31% at the latest.
Looking ahead, UK Finance Minister Jeremy Hunt will announce the British budget in the Parliament around 12:30 GMT on Wednesday and will be able to propel the GBP/USD prices if matching the upbeat forecasts. Ahead of the event, Reuters quoted the Guardian newspaper as saying that UK Finance Minister Hunt would announce a 4 billion-pound childcare expansion for one and two-year olds in England. The news also added that UK’s Hunt is also expected to announce measures to improve skills training and give a green light to 12 investment zones.
Apart from the UK budget, US Retail Sales for February, expected -0.3% MoM versus 3.0% prior, will be important to watch for clear directions.
Technical analysis
A convergence of the 50-DMA and 23.6% Fibonacci retracement level of the GBP/USD pair’s upside from November 2022 to February 2023, around 1.2135, joins the bullish MACD signals and upbeat RSI (14), not overbought, to favor the Cable pair buyers.
China´s central bank has injected 481 billion Yuan via 1-year MLF at 2.75% vs prior 2.75% and injects 104 billion Yuan via 7-day reverse repos at 2.00% vs prior 2.00%.
More to come...
In recent trade today, the People’s Bank of China (PBOC) set the yuan at 6.8680 vs. the prior close of 6.8795.
About the fix
China maintains strict control of the yuan’s rate on the mainland.
The onshore yuan (CNY) differs from the offshore one (CNH) in trading restrictions, this last one is not as tightly controlled.
Each morning, the People’s Bank of China (PBOC) sets a so-called daily midpoint fix, based on the yuan’s previous day's closing level and quotations taken from the inter-bank dealer.
- USD/CHF struggles to extend recovery from six-week low, eases from intraday high of late.
- Market sentiment dwindles amid mixed concerns over SVB fallout, Fed.
- Treasury bond yields defend the previous day’s rebound, US stock futures print mild losses.
USD/CHF reverses from the intraday high to 0.9140 as it fades the previous day’s recovery from a six-week low during early Wednesday. Even so, the Swiss Franc (CHF) pair remains indecisive on a day while tracing the sluggish markets amid mixed clues.
Recently increasing calls of the Fed’s 0.25% rate hike, versus fears of no move due to the challenges for the US banks emanating from the fallouts of the Silicon Valley Bank (SVB) and Signature Bank, seem to underpin the US Dollar’s run-up even as the inflation data eased. Also supporting the greenback could be the latest recovery in the US Treasury bond yields.
That said, US Dollar Index (DXY) picks up bids bid to refresh the intraday high near 103.75 during the two-day rebound from a one-month low. It should be noted that the US 10-year Treasury bond yields grind near 3.68% by the press time, after posting the biggest daily gain in five weeks the previous day, while the two-year bond coupons extend the previous day’s recovery from the six-month low to 4.31% at the latest.
On Tuesday, the US Consumer Price Index (CPI) and CPI ex Food and Energy both matched 6.0% and 5.5% YoY market forecasts, versus 6.4% and 5.6% respective previous readings. It should be noted that the market consensus of 0.4% MoM for the CPI, versus 0.5% prior, also proved right but the CPI ex Food & Energy rose to 0.5% compared to 0.4% analysts’ estimates and prior. “The Federal Reserve is seen raising its benchmark rate a quarter of a percentage point next week and again in May, as a government report showed U.S. inflation remained high in February, and concerns of a long-lasting banking crisis eased,” said Reuters following the US inflation data release.
Elsewhere, Swiss Producer and Import Prices eased in February to -0.2% MoM versus -0.1% expected and 0.7% prior.
While talking about the SVB risk, US Senate Banking Committee Chairman Sherrod Brown and Federal Reserve Governor Michelle Bowman ruled out chatters suggesting the grim conditions of the US banking industry. On the contrary, Wall Street Journal (WSJ) reported that a raft of tougher capital and liquidity requirements are under review, as well as steps to beef up annual “stress tests” that assess banks’ ability to weather a hypothetical recession, according to a person familiar with the latest thinking among U.S. regulators. “The rules could target firms with between $100 billion to $250 billion in assets, which at present escape some of the toughest requirements,” per WSJ.
Hence, the market’s indecision challenges the USD/CHF buyers even as the US Dollar manages to defend the previous day’s gains ahead of the key US data. That said, today’s US Retail Sales for February, expected -0.3% MoM versus 3.0% prior, will be important to watch as the hawkish bets on the Federal Reserve’s (Fed) 25 basis points (bps) rate hike in the next week’s Federal Open Market Committee (FOMC) improve lately.
Technical analysis
USD/CHF is likely to refresh 2023 low, currently near 0.9060 unless rising back beyond the support-turned-resistance line from early February, around 0.9345 by the press time.
- AUD/NZD has failed to sustain above 1.0730 as investors turn anxious ahead of NZ and Australian data.
- Higher Australian employment generation and a lower jobless rate are indicating an expression of higher forward earnings.
- Australian Consumer Inflation Expectations at 5.4% indicate that chances are few that the RBA would restore price stability.
The AUD/NZD pair has sensed selling pressure while attempting to sustain above the critical resistance of 1.0730 in the Asian session. The cross is struggling in extending its recovery as investors are getting anxious ahead of the release of New Zealand’s Gross Domestic Product (GDP) and Australian Employment data, which will release on Thursday.
According to the estimates, the NZ economy has contracted by 0.2% vs. a growth of 2.0% witnessed in the third quarter. The annual GDP (Q4) has expanded by 3.3%, lower than the prior expansion of 6.4%. A decline in the growth rate indicates subdued demand from households, which will relieve the stress of Reserve Bank of New Zealand (RBNZ) policymakers, which are making efforts in decelerating inflation expectations.
Meanwhile, the release of the Australian Employment data would bring a power-pack action to the Australian Dollar. As per the consensus, the Australian economy has added fresh 48.5K jobs in February vs. a lay-off registered in January of 11.5K. And, the Unemployment Rate is expected to drop to 3.6% from the former release of 3.7%. Higher employment generation and a lower jobless rate are indicating an expression of higher forward earnings as upbeat demand for labor would be offset by bumper offerings from firms.
An upbeat Australian labor market data could propel the inflationary pressures again as households would be equipped with higher funds for disposal.
Apart from that, Consumer Inflation Expectations (Mar) data that demonstrate inflation projections for the next 12 months is expected to increase to 5.4% from the former release of 5.1%. An occurrence of the same would support more rates from the Reserve Bank of Australia (RBA).
- AUD/USD retreats from intraday high, struggles to extend two-day uptrend.
- Steady RSI, looming bull cross on MACD and multi-day-old descending resistance line challenge Aussie buyers.
- AUD/USD bears need validation from 61.8% Fibonacci retracement level; key DMA confluence adds to the upside filters.
AUD/USD takes offers to 0.6680 as it drops towards refreshing the intraday low of 0.6671 during early Thursday. In doing so, the Aussie pair prints the first daily loss in three as the bulls flirt with a downward-sloping resistance line from early February.
In addition to the six-week-old descending resistance line, sluggish RSI (14) and indecisive MACD signals also challenge the AUD/USD pair buyers unless the quote stays below the 0.6700 trend line resistance.
Even if the Aussie pair crosses the 0.6700 round figure, a convergence of the 100-DMA and the 200-DMA, around .6770-75 at the latest, appears a tough nut to crack for the bulls.
In a case where the AUD/USD price remains firmer past 0.6775, the December 2022 high near 0.6895 and the 0.6900 round figure may act as the last defenses of the pair bears.
On the flip side, pullback remains elusive beyond the 50% Fibonacci retracement level of the risk-barometer pair’s upside from October 2022 to February 2023, close to 0.6655 by the press time.
Following that, the latest swing low and the 61.8% Fibonacci retracement level, also known as the golden Fibonacci ratio, respectively around 0.6565 and 0.6550 in that order, could probe the AUD/USD bears before giving them control.
Overall, AUD/USD is likely to witness a pullback as China data looms but the downside room appears limited.
AUD/USD: Daily chart
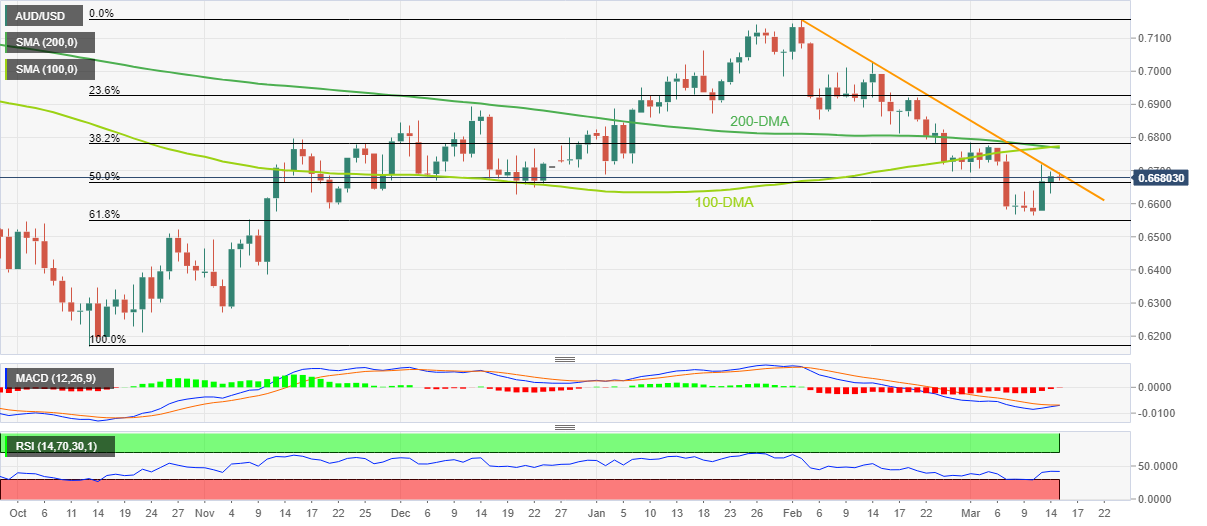
Trend: Pullback expected
| Index | Change, points | Closed | Change, % |
|---|---|---|---|
| NIKKEI 225 | -610.92 | 27222.04 | -2.19 |
| Hang Seng | -448.01 | 19247.96 | -2.27 |
| KOSPI | -61.63 | 2348.97 | -2.56 |
| ASX 200 | -99.9 | 7008.9 | -1.41 |
| FTSE 100 | 88.51 | 7637.11 | 1.17 |
| DAX | 273.36 | 15232.83 | 1.83 |
| CAC 40 | 130.07 | 7141.57 | 1.86 |
| Dow Jones | 336.26 | 32155.4 | 1.06 |
| S&P 500 | 63.53 | 3919.29 | 1.65 |
| NASDAQ Composite | 239.31 | 11428.15 | 2.14 |
- OPEC's stance will be important to watch, as the oil prices are below the expected $80 mark.
- SVB fallout dents the global growth outlook.
- Easing inflation is putting pressure on oil prices.
WTI is facing a corrective downfall, starting around the $81 mark, and is currently sitting just beneath the $72 mark. The receding expectation around a cumulative global growth story is denting the oil demand. Despite tighter oil supply from the Organization of the Petroleum Exporting Countries (OPEC), WTI price struggles to remain elevated.
OPEC wants to keep oil prices above the $80 mark, therefore many voluntary cuts have been imposed, but the oil prices are keener to play the global growth weakening story instead of the law of supply and demand.
The global inflationary outlook, which is an important driving force behind commodities prices, is falling on the back of rising borrowing costs across the globe. The aforementioned effect has been seen in many commodities like Copper and Iron-ore.
The recent fallout of Silicon Valley Bank (SVB) and Signature Bank has dented investors' sentiment around underlying financial conditions. If we add recent layoffs across many developed nations, it portrays a blurred picture of the global growth outlook.
The recent data showed that the Chinese reopening story is not as optimistic as previously assumed. Given the fact that after the 2008 Great Financial Crisis (GFC), China was one of the countries that helped to rewrite the global growth story. But it's not the case this time.
Meanwhile, on Tuesday, the US Consumer Price Index (CPI) was released in line with expectations, with the headline MoM figure coming in at 0.4% as expected, from the prior 0.5%, the YoY figure coming in at 6% in line with expectation, from prior 6.4%. The MoM core reading came in slightly higher at 0.5% vs. 0.4% expected, from the prior 0.4% and core YoY 5.5% in line with the expectation from the prior 5.6%.
In conclusion, the downside bias for WTI remains intact.
Levels to watch
- Gold price remains depressed after snapping three-day uptrend the previous day.
- Recovery in United States yields, US Dollar weighs on XAU/USD price.
- Mixed signals from US Consumer Price Index failed to entertain Gold traders.
- US Retail Sales, China data dump eyed for fresh impulse.
Gold price (XAU/USD) extends the previous day’s pullback from a five-week high as it drops to $1,901 during early Wednesday. In doing so, the bright metal remains down for the second consecutive day in the last five as the US Dollar traces upbeat Treasury bond yields to pare the week-start losses ahead of the key United States data.
Gold price ease as US Dollar traces United States Treasury yields’ rebound
US Dollar Index (DXY) picks up bids bid to refresh the intraday high near 103.75 during the two-day rebound from a one-month low, which in turn exerts downside pressure on the Gold price. In doing so, the greenback’s gauge versus the six major currencies traces the latest recovery in the United States Treasury bond yields amid further building up of the bets suggesting the Federal Reserve’s (Fed) 0.25% rate hike in March.
That said, the US 10-year Treasury bond yields rose two basis points (bps) to 3.70% by the press time, after posting the biggest daily gain in five weeks the previous day. On the same line, the two-year bond coupons also extend the previous day’s recovery from the six-month low to 4.31% at the latest.
It should be noted that the US Consumer Price Index (CPI) and CPI ex Food and Energy both matched 6.0% and 5.5% YoY market forecasts, versus 6.4% and 5.6% respective previous readings. It should be noted that the market consensus of 0.4% MoM for the CPI, versus 0.5% prior, also proved right but the CPI ex Food & Energy rose to 0.5% compared to 0.4% analysts’ estimates and prior.
“The Federal Reserve is seen raising its benchmark rate a quarter of a percentage point next week and again in May, as a government report showed U.S. inflation remained high in February, and concerns of a long-lasting banking crisis eased,” said Reuters following the US inflation data release.
Hence, hawkish Fed bets and upbeat US Treasury bond yields allow the US Dollar to remain firmer and keep the XAU/USD bears hopeful.
Easing of SVB, Signature Bank fallout risk also weighs on XAU/USD
fears from the latest fallouts of the Silicon Valley Bank (SVB) and Signature Bank also favor the Gold bears.
Recently, US Senate Banking Committee Chairman Sherrod Brown and Federal Reserve Governor Michelle Bowman ruled out chatters suggesting the grim conditions of the US banking industry.
Alternatively, Wall Street Journal (WSJ) reported that a raft of tougher capital and liquidity requirements are under review, as well as steps to beef up annual “stress tests” that assess banks’ ability to weather a hypothetical recession, according to a person familiar with the latest thinking among U.S. regulators. “The rules could target firms with between $100 billion to $250 billion in assets, which at present escape some of the toughest requirements,” per WSJ.
That said, the Gold bears seem convinced of the latest cautious optimism in the market and the US Dollar rebound. However, the key statistics from the United States and China need to validate the XAU/USD's fall.
Gold bears need validation
Although the Gold price triggered the first bearish signal in four the previous day, mixed figures of the United States Consumer Price Index (CPI) push the metal sellers to reconfirm the bounce in the US Treasury bond yields and the US Dollar.
As a result, today’s US Retail Sales for February, expected -0.3% MoM versus 3.0% prior, will be important to watch. Ahead of that, China’s February month data dump, including the Fixed Asset Investment, Industrial Production and Retail Sales could direct immediate moves in the Gold price. That said, China’s Retail Sales is expected to improve to 3.5% versus -1.8% prior while the Industrial Production growth could also rise to 2.6% from 1.3% in the previous readings. However, the Fixed Asset Investment is likely to have eased to 4.4% YoY so far in 2023, till February, versus 5.1% prior.
Gold price technical analysis
Despite successfully crossing the 200-bar Simple Moving Average (SMA), the Gold price failed to rise past a two-month-old previous support, around $1,913 by the press time.
The XAU/USD pullback also takes clues from the overbought conditions of the Relative Strength Index (RSI) line, placed at 14, as well as receding bullish signals from the Moving Average Convergence and Divergence (MACD) indicator.
It should be noted that the Gold bears have so far been struggling with the $1,900 threshold. That said, the 50% Fibonacci retracement level of the metal’s February month downturn, around $1,880, can act as an extra downside filter before directing the XAU/USD towards the 200 and 50 SMAs, respectively near $1,860 and $1,850.
On the contrary, a clear upside break of the immediate support-turned-resistance line, around $1,913, could quickly propel the Gold price towards the $1,950 hurdle that holds the key to the metal’s fresh 2023 high, currently around $1,960.
Overall, the Gold price has fewer hurdles to the north but the buyers need to re-charge their batteries for further run-up, which in turn suggests further pullback of the bullion before the next swing towards the north.
Gold price: Four-hour chart
-15032023-638144363714273365.png)
Trend: Further downside expected
- The recovery move from USD/CAD to near 1.3700 seems to lack confidence amid the risk-on mood.
- Softening US inflation is favoring a continuation of a lower pace by the Fed in hiking rates further.
- The 20-period EMA at 1.3710 might continue to act as a barricade for the US Dollar.
The USD/CAD pair has delivered a less-confident rebound move after dropping to near 1.3650. The Loonie asset seems vulnerable near 1.3700 as a deceleration in the United States inflation is indicating a further decline in appeal for safe-haven assets after the Silicon Valley Bank (SVB) collapse.
S&P500 futures have discovered some losses in the early Asian session as Moody’s Investors Service has cut its view on the entire banking system to negative from stable, as reported by CNBC. The situation is portraying a minor pessimism in the overall risk-on mood.
Softening US inflation is favoring a continuation of a lower pace by the Federal Reserve (Fed) in hiking rates further. Fed chair Jerome Powell should be in no hurry in further policy-tightening as the US inflation is declining according to the directed plans.
USD/CAD has rebounded after sensing a cushion near the horizontal support plotted from March 01 high at 1.3659 on a two-hour scale. The recovery move by the US Dollar seems to lack confidence and strength, which bolsters the odds of further downside in the asset.
The 20-period Exponential Moving Average (EMA) at 1.3710 might continue to act as a barricade for the US Dollar.
Meanwhile, the Relative Strength Index (RSI) (14) has defended the downside move into the bearish range of 20.00-40.00. However, the downside bias is still intact.
A decisive breakdown of March 14 low at 1.3652 would drag the loonie asset toward March 07 low at 1.3600, followed by March 03 low at 1.3555.
In an alternate scenario, a confident recovery above March 14 high at 1.3750 would drive the major toward March 13 high above 1.3800 and March 09 high at 1.3835.
USD/CAD two-hour chart
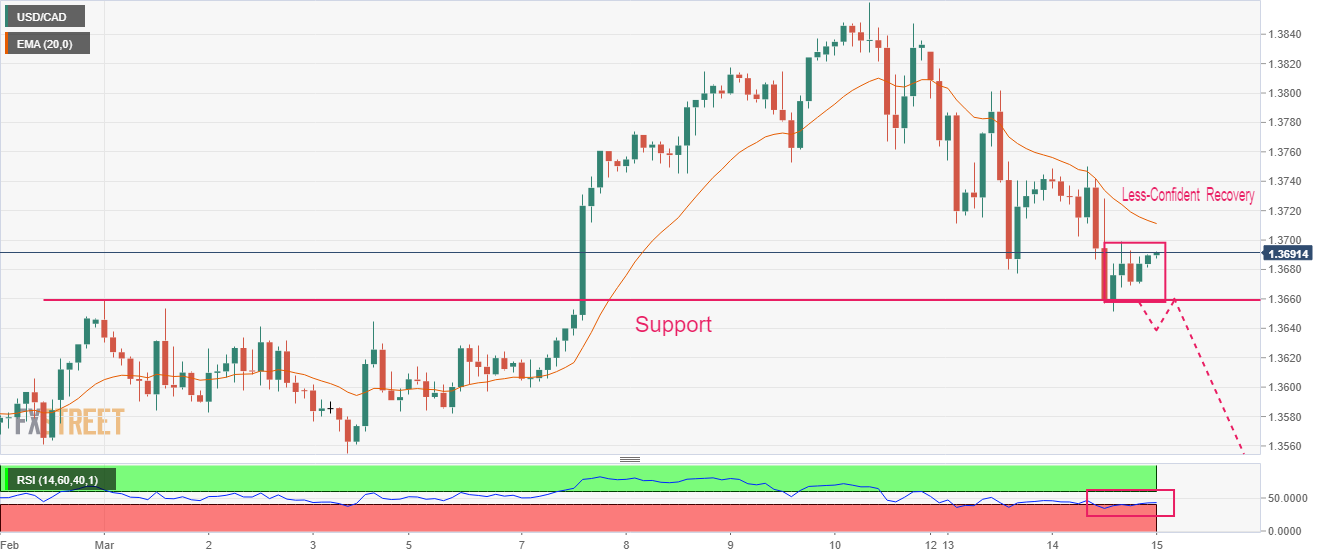
| Pare | Closed | Change, % |
|---|---|---|
| AUDUSD | 0.66791 | 0.21 |
| EURJPY | 144.042 | 0.79 |
| EURUSD | 1.07315 | 0.03 |
| GBPJPY | 163.134 | 0.49 |
| GBPUSD | 1.21537 | -0.27 |
| NZDUSD | 0.62328 | 0.28 |
| USDCAD | 1.36847 | -0.32 |
| USDCHF | 0.91368 | 0.24 |
| USDJPY | 134.233 | 0.78 |


© 2000-2026. All rights reserved.
This site is managed by Teletrade D.J. LLC 2351 LLC 2022 (Euro House, Richmond Hill Road, Kingstown, VC0100, St. Vincent and the Grenadines).
The information on this website is for informational purposes only and does not constitute any investment advice.
The company does not serve or provide services to customers who are residents of the US, Canada, Iran, The Democratic People's Republic of Korea, Yemen and FATF blacklisted countries.
Making transactions on financial markets with marginal financial instruments opens up wide possibilities and allows investors who are willing to take risks to earn high profits, carrying a potentially high risk of losses at the same time. Therefore you should responsibly approach the issue of choosing the appropriate investment strategy, taking the available resources into account, before starting trading.
Use of the information: full or partial use of materials from this website must always be referenced to TeleTrade as the source of information. Use of the materials on the Internet must be accompanied by a hyperlink to teletrade.org. Automatic import of materials and information from this website is prohibited.
Please contact our PR department if you have any questions or need assistance at pr@teletrade.global.
transfers