- Analytics
- News and Tools
- Market News
CFD Markets News and Forecasts — 13-03-2023
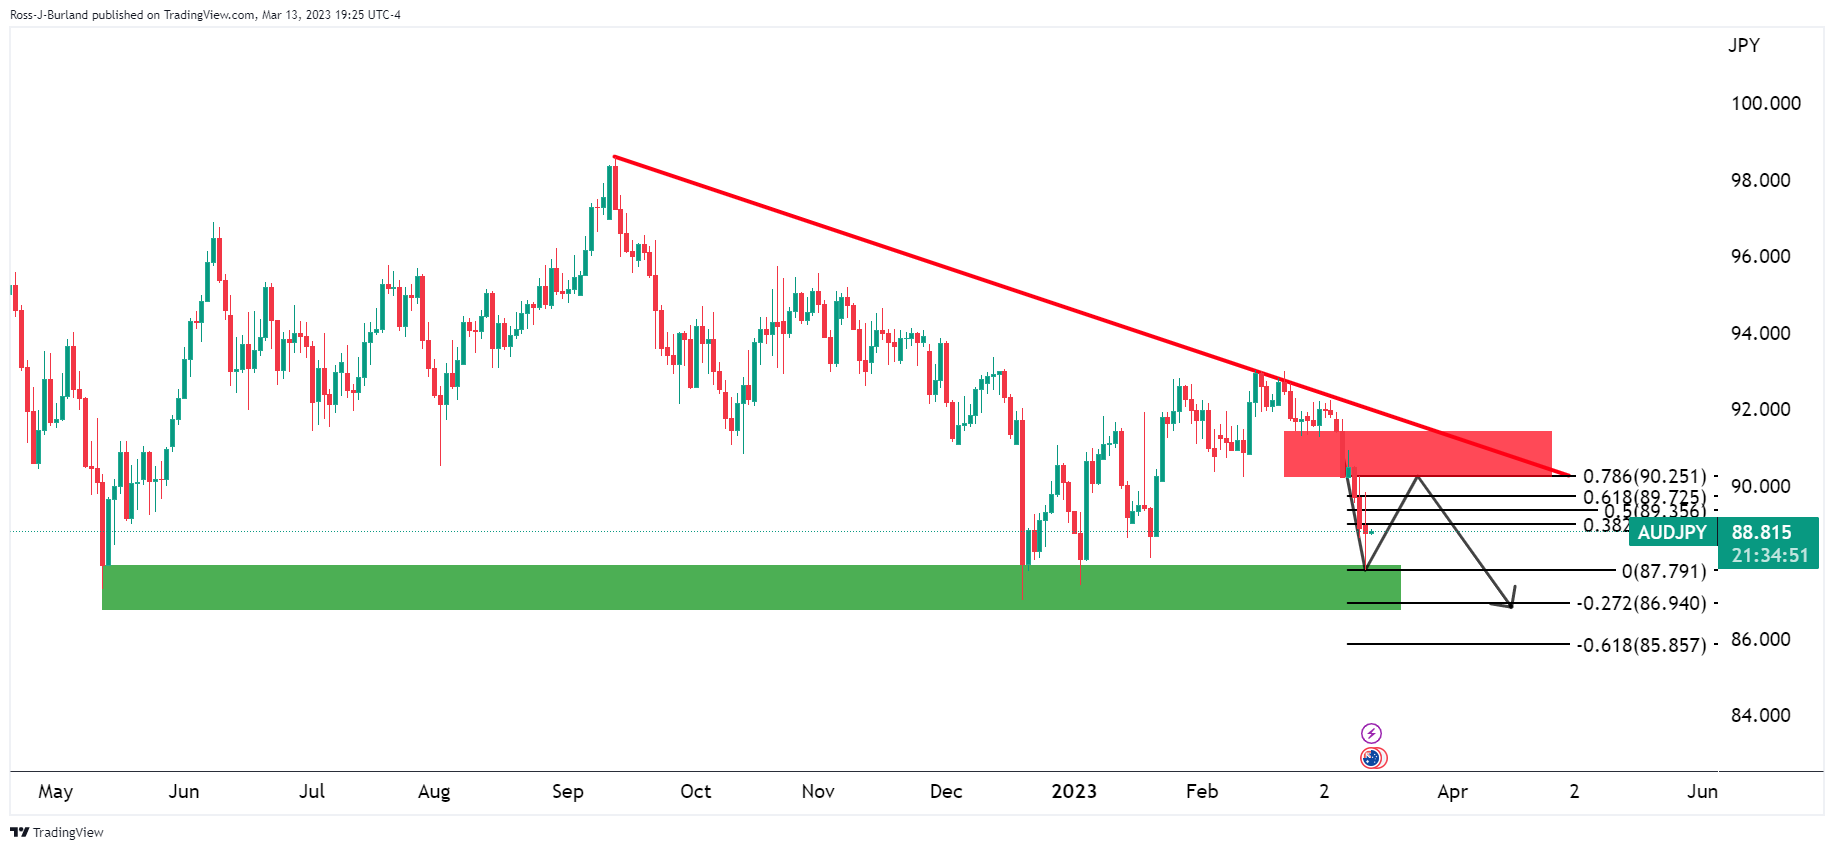
- AUD/JPY bulls are defending support on the daily chart but bears are stepping up again.
- A deeper correlation of the bullish recovery is eyed for the immediate future.
AUD/JPY is flat on the day so far approaching the Tokyo open, trading at 88.67 and sticking to a 20 pip range so far. The bulls are stepping in from daily support with prospects of a bullish correction towards prior support that would now be regarded as resistance. Pulling up the Fibonacci scale, there is an alignment with the 78.6% Fibonacci resistance near to 90.25:
AUD/JPY daily chart
AUD/JPY H4 chart
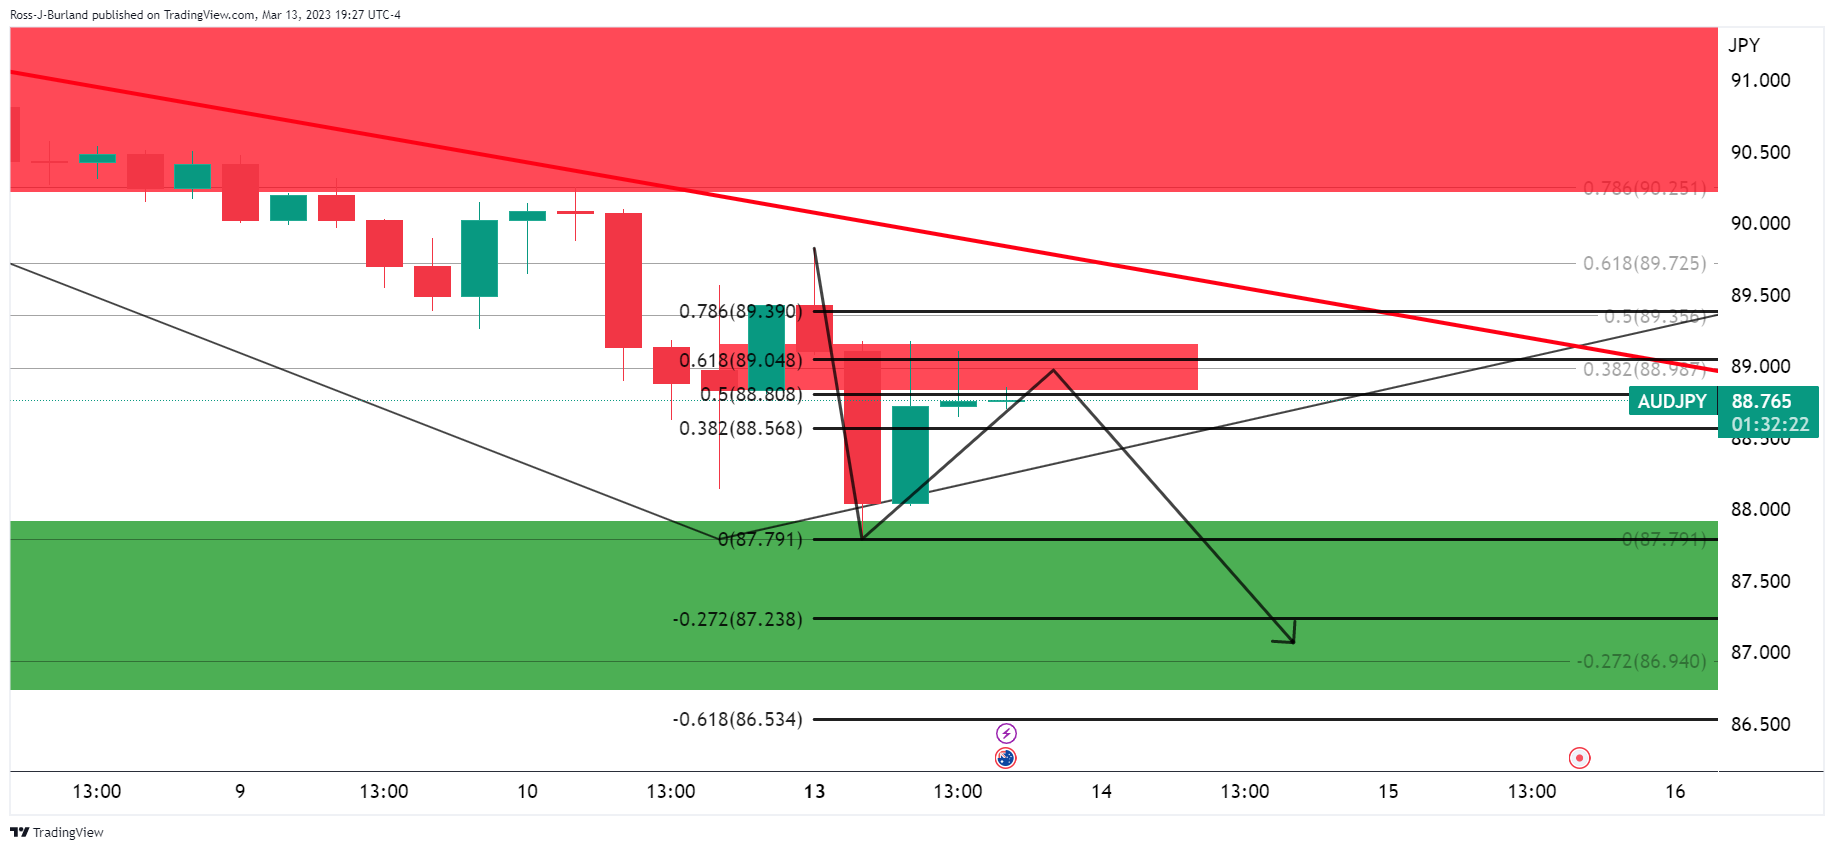
However, moving down to the 4-hour time frame, we can see plenty of resistance near 89.00 and the fact that the price is stalling here, in a confluence with the 61.8% ratio, a downside case can be built, until a break of the resistance structure. We are still on the front side of the bear trend so a bullish thesis is not as easy to make.
AUD/JPY H1 chart
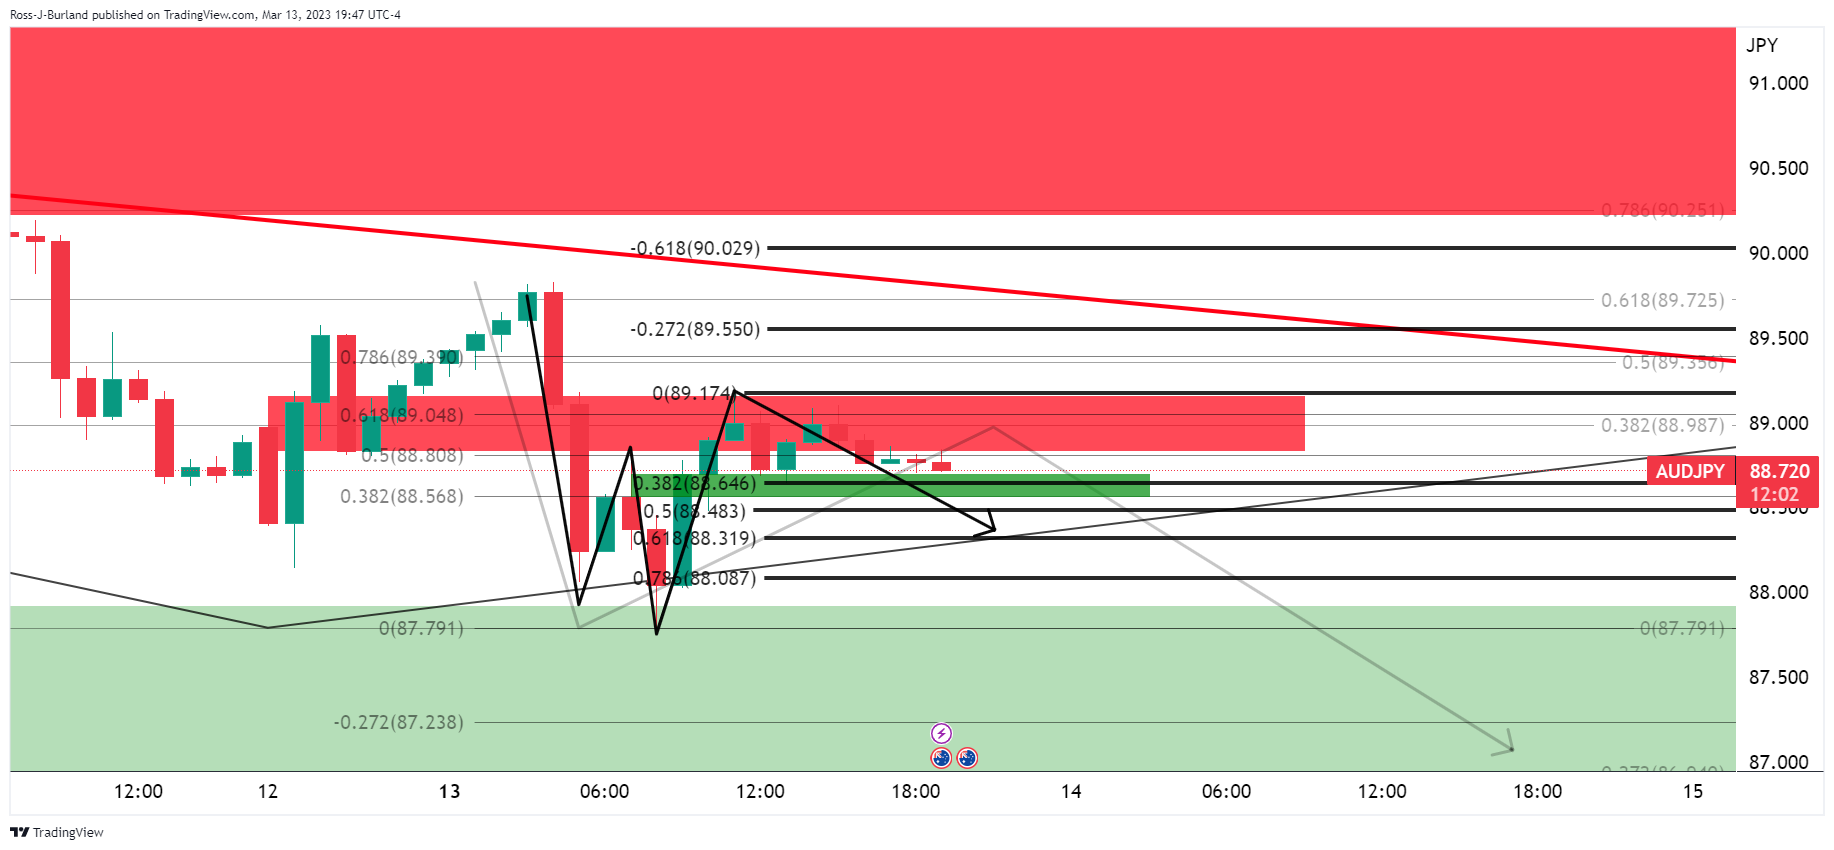
The W-formation on the hourly chart sees the price drawn to the neckline and testing the 38.2% Fibonacci of the prior bullish impulse currently. A break here opens the risk of a deeper correction further into the Fibonacci scale where the 787.6% Fibo meets 88.00 the figure or thereabouts as the likely last line of defense before a bullish thesis can be made for the forthcoming sessions.
- GBP/JPY is eyeing a fresh upside above 163.00 as the focus shifts to UK labor market data.
- A decline in the UK Employment cost index and a higher Unemployment Rate would trim inflation expectations.
- BoJ Ueda is expected to scrap Yield Curve Control (YCC) and ultra-loos monetary policy gradually.
The GBP/JPY pair is gauging an intermediate cushion above 162.00 in the early Asian session after sensing restrictions in the upside momentum above 163.00. The cross is expected to resume its upside journey as investors are worried about the United Kingdom’s labor cost index, which has kept the Bank of England (BoE) busy with high inflation affairs for the past one year.
The release of the UK’s Employment data will be the key trigger for the Pound Sterling ahead. As per the consensus, the Claimant Count Change (Feb) will drop by 12.4K, lower than the former release of 12.9K. Three-month Unemployment Rate is expected to increase to 3.8% from the prior release of 3.7%.
The major catalyst will be the Average Earnings data, which is expected to decline to 5.7% vs. the prior release of 5.9%. Investors should be aware of the fact that higher employment costs and stubborn food price inflation in the UK economy have been driving inflationary pressures. And, now a decline in the labor cost index will delight BoE Governor Andrew Bailey, who is going through sleepless nights in designing a roadmap for decelerating the double-digit figure inflation.
It is worth noting that the impact of the Silicon Valley Bank (SVB) collapse is not restricted to the United States. In a joint statement from the UK Treasury and the Bank of England (BOE), the UK Finance Minister, Jeremy Hunt, said on Monday that the “deposits will be protected, with no taxpayer support.” The UK authorities confirmed that HSBC bank agreed to rescue the Silicon Valley Bank’s (SVB) UK arm. UK Hunt further added, "No other UK banks are directly materially affected by these actions."
On the Tokyo front, after an unchanged monetary policy announcement by ex-Bank of Japan (BoJ) Governor Haruhiko Kuroda, investors are shifting their focus toward the commentary from BoJ Kazuo Ueda over the Yield Curve Control (YCC) and a shift to restrictive monetary policy.
Senior Economist at UOB Group Alvin Liew is of the view that “An exit from the YCC and negative interest rates is inevitable for Japan, the question is how Ueda will execute his plan. We believe Ueda will proceed at a gradual, well-telegraphed pace, and not a sharp and sudden reversal. We see it in two broad steps, 1) Protracted adjustment to its forward guidance on YCC and interest rates (Apr to Dec 2023) and 2) Scrapping of YCC and lifting of the negative policy rate in early 2024.”
- EUR/GBP remains sidelined around the key support line after refreshing two-week low.
- Downbeat oscillators favor bears but 100-DMA acts as an extra filter towards the south.
- Double tops around 0.8925-30 appear important hurdle towards the north.
EUR/GBP portrays the pair trader's cautious mood ahead of the key UK employment data during early Tuesday. In doing so, the cross-currency pair makes rounds to 0.8900 while probing a three-day downtrend near the lowest levels in two weeks, marked the previous day.
Also read: GBP/USD grinds near one-month high below 1.2200 ahead of UK employment, US CPI
It’s worth noting that an upward-sloping support line from mid-December 2022 challenges the EUR/GBP bears as traders brace for the key UK data. However, the bearish MACD signals and the downbeat RSI (14) line, not oversold, keeps the pair sellers hopeful.
Adding strength to the downside bias is the quote’s double top formation around the 0.8930-25 area.
That said, the EUR/GBP bears need a sustained downside break of the aforementioned support line, near 0.8910 at the latest, to aim for the 100-DMA support surrounding 0.8765.
Following that, the lows marked during February and January, respectively near 0.8755 and 0.8740, will be the focus of the sellers.
On the contrary, recovery moves may initially aim for the month-start peak surrounding the 0.8900 threshold ahead of challenging the “double top” bearish formation near 0.8930.
In a case where EUR/GBP bulls surpass the 0.8930 hurdle, the odds of witnessing a fresh 2023 high, currently around 0.8980, can’t be ruled out.
EUR/GBP: Daily chart
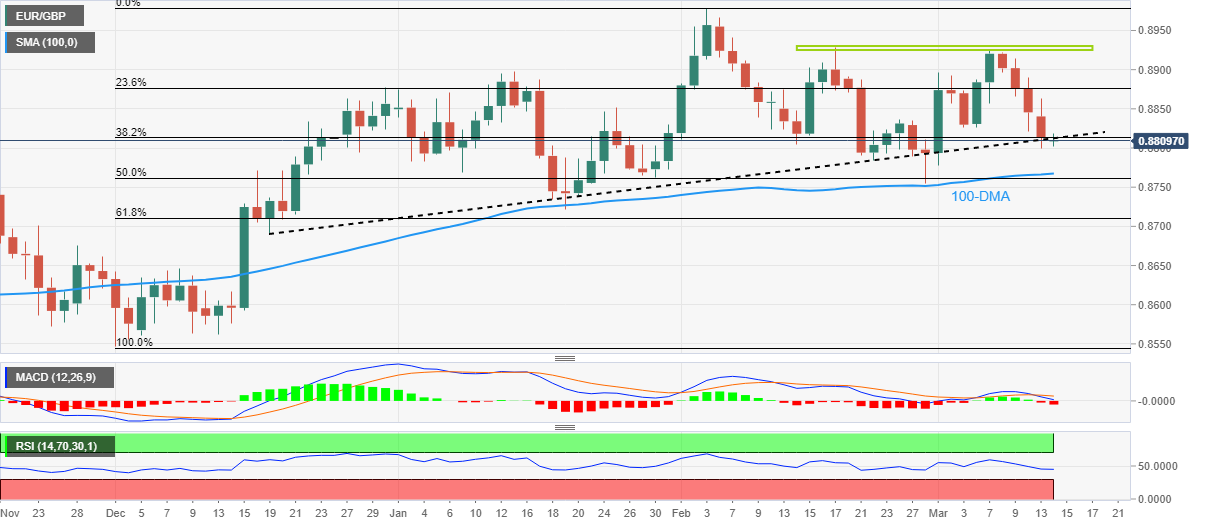
Trend: Further downside expected
- AUD/USD looks cautious prior to the US CPI release, as the downside bias is intact.
- Fed is in a tricky situation, what next for a rate hiking plan?
- Market forecasters are abating for a massive rate hike from the Fed.
AUD/USD is treading water in the early Asian session after hitting the 0.6700 mark in the last trading session. US Dollar Index (DXY) is on the softer side in early Asian hours, as the market awaits the United States (US) Consumer Price Index (CPI) data release on Tuesday.
AUD/USD has not capitalized much on the previous trading day in wake of the backstop provided by the Federal Reserve (Fed) and US Treasury. On Silicon Valley Bank’s (SVB) fallout and to cement any dent over the US banking system, the Fed came up with a backstop plan on Sunday, which prompted milder risk on the market environment during New York (NY) session on Monday.
Looking ahead, the market is heading into US CPI data with caution due to the numerous dynamic changes that occurred on Monday after the SVB fallout event. Many key market forecasters are rolling back their 50 basis points (bps) Fed rate hike expectation for 22 March.
Given the fact that higher borrowing cost across the globe is putting pressure on high-leverage business like tech companies, which are struggling to keep on with repayments on their debt amidst higher interest rate, therefore the banking system is facing a big problem with their non-performing assets.
Moreover, a continuously rising interest rate will likely hammer the banking system as per the aforementioned analogy. Hence the market is expecting no overstretching on the rate fronts.
However, elevated inflation levels are putting central banks into a tricky situation and acting like a double whammy for central banks.
The upcoming US CPI will be interesting to watch as it's only going to add more complexity for the Federal Reserve.
Levels to watch.
- USD/CAD keeps recent bounce off one-week low after falling the most in a month.
- WTI refreshed three-month low before making rounds to $75.00.
- Market sentiment dwindles amid SVB, Signature Bank fallout but US Dollar bears the burden of the downbeat Treasury yields.
- Risk catalysts eyed closely ahead of US CPI for February.
USD/CAD licks its wounds around 1.3740, after marking the biggest daily slump in a month the previous day. In doing so, the Loonie pair portrays the market’s positioning for the US Consumer Price Index (CPI) data while struggling to cheer the latest rebound in the Oil price, Canada’s main export item.
The quote ignored the WTI crude oil’s slump towards refreshing a three-month low to $72.42, before a rebound to $74.90 at the latest, amid the broad US Dollar weakness due to the reduction in the hawkish Federal Reserve (Fed) bets.
That said, the US Dollar Index (DXY) began the week’s trading on a back foot by printing a three-day south-run while declining the most in two months on Monday, licking its wounds near 103.68 at the latest. With this, the greenback’s gauge versus the six major currencies traced the US Treasury bond yields as hawkish bets on the Federal Reserve (Fed) reverberate.
US two-year Treasury bond yields marked the biggest daily slump since October 1987 by declining more than 13.0% on a day as US banking regulators rushed to defend the Silicon Valley Bank (SVB) and the Signature Bank. Further, the US 10-year Treasury bond yields slumped to the monthly low amid a sudden shift in the market’s Fed bets due to the financial market risks emanating from the stated banks.
While portraying the latest shift in the US Fed Fund Futures, Reuters said that the US rate futures on Monday have priced in a 69% chance of a 25-bps hike at next week's Fed policy meeting, with a more than 30% probability of a pause. The market last week was poised for a 50-bps increase prior to the SVB collapse.
Looking ahead, the US inflation data for February will be important to watch for clear directions. Forecasts suggest the US CPI is likely to ease to 6.0% YoY versus 6.4% prior while CPI ex Food & Energy may slide to 5.5% YoY from 5.6% prior. It’s worth noting that Canada Manufacturing Sales for January, around 3.9% versus -1.5% prior, will also be important to better predict the USD/CAD pair’s immediate moves. However, major attention should be given to the yields and the market’s risk catalysts for better directions.
Also read: US Inflation Preview: Five scenarios for trading the Core CPI whipsaw within the SVB storm
Technical analysis
A daily closing below a one-month-old ascending support line, around 1.3705 by the press time, becomes necessary for the USD/CAD bears to take control.
- USD/CHF is gauged as an intermediate cushion around 0.9100 ahead of US Inflation.
- The Fed might look for a small rate hike to restore the confidence of US households and firms.
- Only a sheer surprise upside could provide decent support to the USD index ahead.
The USD/CHF pair has sensed an intermediate cushion near the round-level support of 0.9100 in the early Asian session. The Swiss franc asset is gathering strength to extend its recovery above the immediate resistance of 0.9127. However, the upside looks capped as the collapse of Silicon Valley Bank (SVB) has limited the expectations of a bumper pace in the policy-tightening regime by the Federal Reserve (Fed), as expected earlier, to tame the stubborn inflation.
The Fed on Sunday announced it would make additional funding available through a new Bank Term Funding Program, which would offer loans of up to one year to depository institutions, backed by Treasuries and other assets these institutions hold, as reported by Reuters.
In times, when firms and households are losing confidence in the United States banking system, the street considers that a halt or a continuation of the slowdown in the policy-tightening pace by Fed chair Jerome Powell would be prudent to restore confidence.
After the catastrophic collapse of SVB, investors are shifting their focus on the US Consumer Price index (CPI) data, which will provide direction to the FX domain ahead.
Analysts at CIBC are of the view that “A further increase in prices at the pump and continued pressure in core categories suggest that prices rose by an uncomfortably fast 0.4% in February. Looking at core (ex. food and energy) categories, shelter prices are set to peak imminently as the typical lags with new leases that are resetting at lower rates kick in, but continued pressure in core services outside of the shelter, in line with the tight labor market, will keep the Fed on a tightening path.
The US Dollar Index (DXY) has shown some tough fight after dropping to near 103.50 as bulls are reluctant to go downside further ahead of the US inflation release.
S&P500 futures have shown some decent gains after a choppy session that ended with marginal losses. This shows a recovery in the risk appetite theme but a broad-based caution cannot be ruled out. The return offered on 10-year US Treasury yields has dropped sharply to 3.54%.
On the Swiss Franc front, the monthly Producer Price Index (PPI) (Feb) is expected to show a deceleration of 0.1%, which indicates a decline in the households’ demand that has forced producers to trim prices of goods and services offered at factory gates. A decline in the monthly PPI figure will be music to the ears of the Swiss National Bank (SNB) as Swiss inflationary pressures have gone beyond its control.
“Britain's Finance Minister Jeremy Hunt announced on Monday he would create 12 ‘investment zones’ in England to spur the regional economy outside London, a scaled-back version of a policy announced under former Prime Minister Liz Truss,” reported Reuters during the initial hours of Tuesday’s Asian session.
Key quotes
Ahead of Hunt's annual budget on Wednesday, the finance ministry said each of the zones will be backed by 80 million pounds spread over five years that can be directed towards tax relief for businesses, training and infrastructure.
Hunt also announced 100 million pounds ($122 million) of funds to be shared across Glasgow, Manchester and part of central England to improve their research and development centers.
Hunt looks set to keep his grip on public finances in the budget, holding off on any big tax cuts or spending increases until the next election comes closer into view.
GBP/USD grinds
Despite the price-positive news and the broad-based US Dollar weakness, the GBP/USD pair remains sidelined near the highest levels in a month, recently around 1.2770-80, after rising the most since early January the previous day.
Also read: GBP/USD grinds near one-month high below 1.2200 ahead of UK employment, US CPI
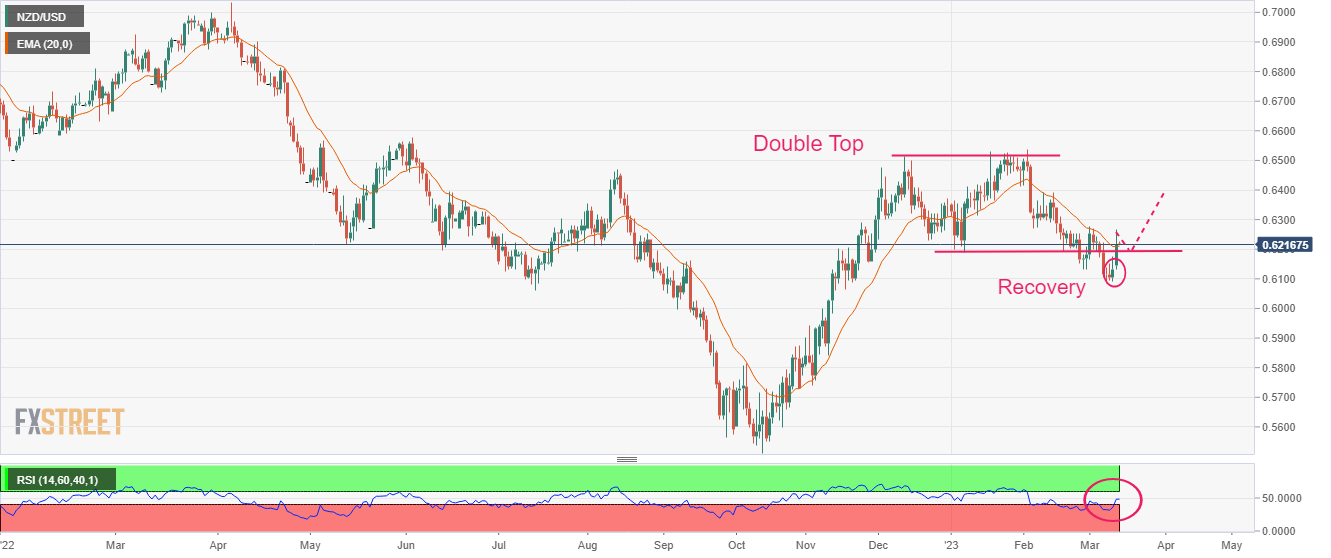
- NZD/USD is oscillating around 0.6220, resumption in the upside is expected ahead of US CPI.
- After a responsive buying, NZD/USD has negated the breakdown of the Double Top chart pattern.
- A decent recovery from the RSI (14) into the 40.00-60.00 range indicates that the presence of responsive buyers.
The NZD/USD pair has turned sideways around 0.6220 in the early Tokyo session after a corrective move from 0.6260. A resumption in the upside momentum is expected from the Kiwi asset as the catastrophic collapse of Silicon Valley Bank (SVB) has faded the hopes of a hawkish stance on the interest rates by the Federal Reserve (Fed).
On the interest rate hike outlook, Goldman Sachs believes "In light of recent stress in the banking system, we no longer expect the FOMC to deliver a rate hike at its March 22 meeting with considerable uncertainty about the path beyond March."
A decent rebound is shown by the S&P500 futures, indicating an improvement in the risk appetite of the market participants. However, caution on a broad basis cannot be ruled out.
The US Dollar Index (DXY) has shown a less-confident recovery from 103.50 and is expected to remain volatile ahead of the release of the Consumer Price Index (CPI) ahead.
NZD/USD has negated the breakdown of the Double Top chart pattern formed on a daily scale. A responsive buying in the Kiwi asset has pushed it above the critical resistance plotted from January 06 low at 0.6190.
The asset is attempting to shift its auction above the 20-period Exponential Moving Average (EMA) at 0.6207, which will improve the short-term upside bias.
A decent recovery from the Relative Strength Index (RSI (14) into the 40.00-60.00 range indicates that the presence of responsive buyers at lower levels.
A buying opportunity in the Kiwi asset will emerge it will surpass March 1 high at 0.6276, which will drive the pair toward the round-level resistance at 0.6300 followed by February 14 high at 0.6389.
In an alternate scenario, a breakdown of January 6 low at 0.6193 will drag the asset toward November 28 low at 0.6155. A slippage below the latter will expose the asset for more downside toward the round-level support at 0.6100.
NZD/USD daily chart
- GBP/USD buyers take a breather at one-month high, probing four-day uptrend.
- Broad-based US Dollar weakness propels Cable pair despite geopolitical, Brexit uncertainty in the UK.
- US Treasury bond yields, Fed Fund Futures slumps as US regulators rescue SVB, Signature Bank.
- UK jobs report, US CPI will be crucial but risk catalysts may gain major attention.
GBP/USD prods a four-day winning streak near 1.2180, after poking the highest level in a month to 1.2199 the previous day. In doing so, the Cable pair takes a breather ahead of the key statistics from the UK and the US. Apart from the pre-data anxiety, mixed concerns surrounding UK politics and Brexit also probe the momentum traders of the pair, after witnessing the biggest daily jump in nine weeks.
That said, the quote’s previous losses could be linked to the broad-based US Dollar slump. US Dollar Index (DXY) began the week’s trading on a back foot, printing a three-day south-run while declining the most in two months on Monday. With this, the greenback’s gauge versus the six major currencies traced the US Treasury bond yields as hawkish bets on the Federal Reserve (Fed) reverberate.
It should be noted that the US two-year Treasury bond yields marked the biggest daily slump since October 1987 by declining more than 13.0% on a day as US banking regulators rushed to defend the Silicon Valley Bank (SVB) and the Signature Bank. Further, the US 10-year Treasury bond yields slumped to the monthly low amid a sudden shift in the market’s Fed bets due to the financial market risks emanating from the stated banks.
US banking regulators undertook joint actions to tame the risks emanating from SVB and Signature Bank during the weekend. While announcing the plan, US President Joe Biden noted on Monday that investors in those banks will not be protected and reminded that "no one is above the law." However, the US President also vowed to take whatever action was needed to ensure the safety of the US banking system, per Reuters.
While portraying the latest shift in the US Fed Fund Futures, Reuters said that the US rate futures on Monday have priced in a 69% chance of a 25-bps hike at next week's Fed policy meeting, with a more than 30% probability of a pause. The market last week was poised for a 50-bps increase prior to the SVB collapse.
Elsewhere, the US-China tussles escalate while the UK joins hands with the US and Australia to provide Canberra with nuclear-powered attack submarines, a major step involving an investment of hundreds of billions of dollars aimed at countering China's ambitions in the Indo-Pacific, reported Reuters. Further, Brexit optimism fades amid the broad market anxiety. While portraying the mood, Wall Street closed mixed while Gold managed to remain firmer amid broad US Dollar weakness, as well as due to the metal’s traditional safe-haven status.
It’s worth noting that news conveying Britain's Finance Minister Jeremy Hunt, as he announces a plan to create 12 "investment zones" in England also favors the GBP/USD buyers. “Ahead of Hunt's annual budget on Wednesday, the finance ministry said each of the zones will be backed by 80 million pounds spread over five years that can be directed towards tax relief for businesses, training and infrastructure,” stated Reuters.
Looking ahead, the UK employment report will be crucial to watch for immediate directions as the central bank haws retreat. Following that, the US Consumer Price Index (CPI) for February will be important to watch for clear directions. Forecasts suggest a slight reduction in the UK’s Claimant Count Change and Unemployment Rate jostling with a minor fall in the Average Earnings. On the other hand, the US CPI is likely to ease to 6.0% YoY versus 6.4% prior while CPI ex Food & Energy may slide to 5.5% YoY from 5.6% prior.
To sum up, the mixed expectations from the UK and the US data join the market’s latest attention on the financial risks and a fall in the Treasury bond yields to dim the importance of today’s economic calendar for the GBP/USD pair traders. Even so, the quote is likely to remain firmer amid broad US Dollar weakness.
Also read: US Inflation Preview: Five scenarios for trading the Core CPI whipsaw within the SVB storm
Technical analysis
The first daily closing above the 50-DMA in five weeks, enables the GBP/USD bulls to aim for the mid-February swing high surrounding 1.2270.
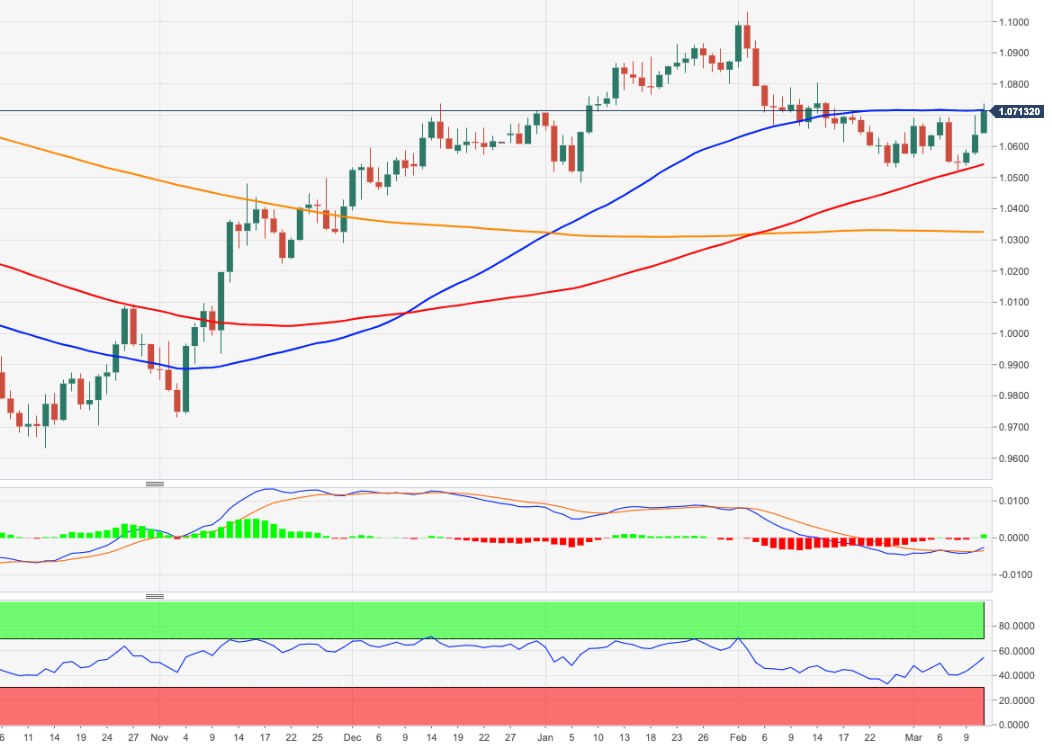
- EUR/USD seesaws near one-month high after rising the most in two weeks the previous day.
- US Dollar traces downbeat Treasury bond yields as SVB, Signature Bank fallout weigh on Fed bets.
- Market sentiment dwindles amid fears of looming financial market crisis.
- US inflation could offer immediate directions, firmer prints can put a floor under Euro prices.
EUR/USD grinds near the highest level in a month, after posting the biggest daily gains in a fortnight, as the US inflation data loom. That said, the Euro pair cheered the broad US Dollar strength to rally to 1.0741 the previous day before portraying the market’s cautious mood while making rounds to 1.0720-30 at the latest.
US Dollar Index (DXY) began the week’s trading on a back foot, printing a three-day south-run while declining the most in two months on Monday. In doing so, the greenback’s gauge versus the six major currencies traced the US Treasury bond yields as hawkish bets on the Federal Reserve (Fed) reverberates.
US 10-year Treasury bond yields slumped to the monthly low whereas the two-year counterpart marked above 13.0% daily slump amid a sudden shift in the market’s Fed bets due to the fallout of the Silicon Valley Bank (SVB) and the Signature Bank. “The two-year note's yield, which reflects interest rate move expectations, was on track for the biggest one-day drop since October 1987 in the wake of that fateful Black Monday stock market crash,” said Reuters.
That said, the Fed Fund Futures suggest the 80 basis points (bps) of rate cuts by the end of 2023, versus a 50 bps rate hike in the next meeting expected previously. With this, the interest rate futures seem to ignore the latest jump in the US employment data and rather bear the burden of the position unwinding amid fears of another financial market crackdown.
Elsewhere, Wall Street closed mixed while Gold managed to remain firmer amid broad US Dollar weakness, as well as due to the metal’s traditional safe-haven status.
It should be noted that the US Treasury Department, Federal Reserve and the Federal Deposit Insurance Corporation (FDIC) undertook joint actions to tame the risks emanating from SVB and Signature Bank during the weekend. While announcing the plan, US President Joe Biden noted on Monday that investors in those banks will not be protected and reminded that "no one is above the law."
Moving on, US Consumer Price Index (CPI) for February will be important to watch for clear directions. However, major attention will be on the SVB and Signature Bank updates. “Amid this financial uncertainty, US February CPI data will be out tonight. The consensus is for core CPI to slow just 0.1ppt to 5.5% y/y. That would indicate progress in bringing inflation back to target is proving very slow. Combined with a hot February Nonfarm Payrolls print, and we retain our forecast for a 25bp FFR hike next week (and a peak of 5.5% in June),” said Analysts at the ANZ ahead of the US CPI release.
Also raed: US Inflation Preview: Five scenarios for trading the Core CPI whipsaw within the SVB storm
Technical analysis
The first daily closing beyond the 50-DMA, around 1.0725 by the press time, keeps EUR/USD buyers hopeful of poking the mid-February swing high surrounding 1.0805.
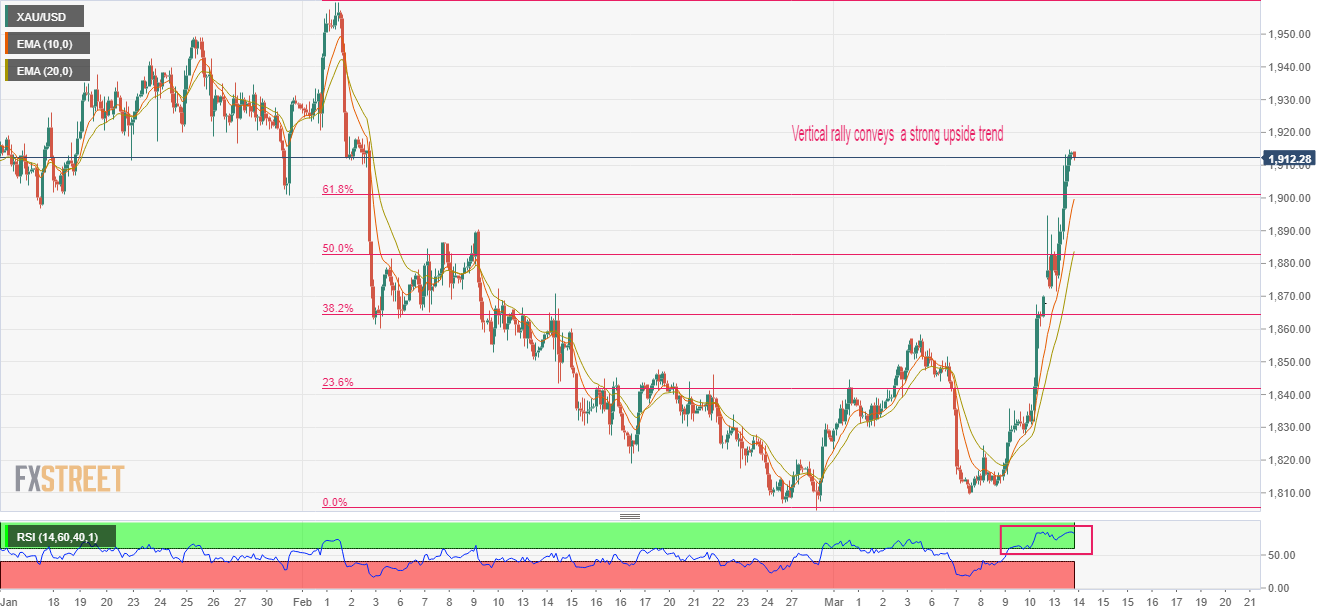
- Gold price has delivered a three-day winning streak on hopes of a slowdown in the Fed’s policy tightening pace.
- Going forward, a sheer volatility is expected ahead of the US inflation data.
- A decisive break above 61.8% Fibo indicates that the asset will recapture the previous swing high ahead.
Gold price (XAU/USD) has refreshed its five-week high at $1,914.70 in the early Asian session. The precious metal has delivered a three-day winning streak and is expected to continue its upside momentum as a sudden collapse of Silicon Valley Bank (SVB) might force the Federal Reserve (Fed) to continue a lower pace of policy tightening if not halt the restrictive regime.
President Joe Biden said the administration's swift actions to ensure depositors can access their funds in Silicon Valley Bank (SVB) and Signature Bank (SBNY) should give Americans confidence that the U.S. banking system was safe, as reported by Reuters.
The US Dollar Index (DXY) has sensed an intermediate cushion around 103.50, however, sheer volatility is expected ahead as investors will keep an eye on the United States Consumer Price Index (CPI) data.
Analysts at Credit Suisse expect “Expect core CPI inflation to remain steady at 0.4% MoM in February, causing the YoY reading to tick down to 5.5%. Energy and food prices are likely to moderate, with headline inflation also coming in at 0.4% MoM. A reading in-line with our expectations would be uncomfortably high for the Fed, but still consistent with gradual disinflation this year.”
S&P500 futures are showing marginal gains after a subdued Monday, a case of a dead cat bounce, however, the risk sentiment is still negative. The 10-year US Treasury yields dropped to 3.54% as Fed chair Jerome Powell won’t go heavy on interest rates to maintain consumer confidence in the economy.
Gold technical analysis
Gold price has scaled above the 61.8% Fibonacci retracement (placed from February 2 high at $1,959.71 to February 28 low at $1,804.76) at $1.901.24. A decisive break above 61.8% Fibo indicates that the asset will recapture the previous swing high ahead.
Upward-sloping 20-and 50-period Exponential Moving Averages (EMAs) at $1,900 and $1,883.00 add to the upside filters.
The Relative Strength Index (RSI) (14) oscillates in the bullish range of 60.00-80.00, which indicates an upside momentum is already active. However, some corrections due to an overbought situation cannot be ruled out.
Gold two-hour chart
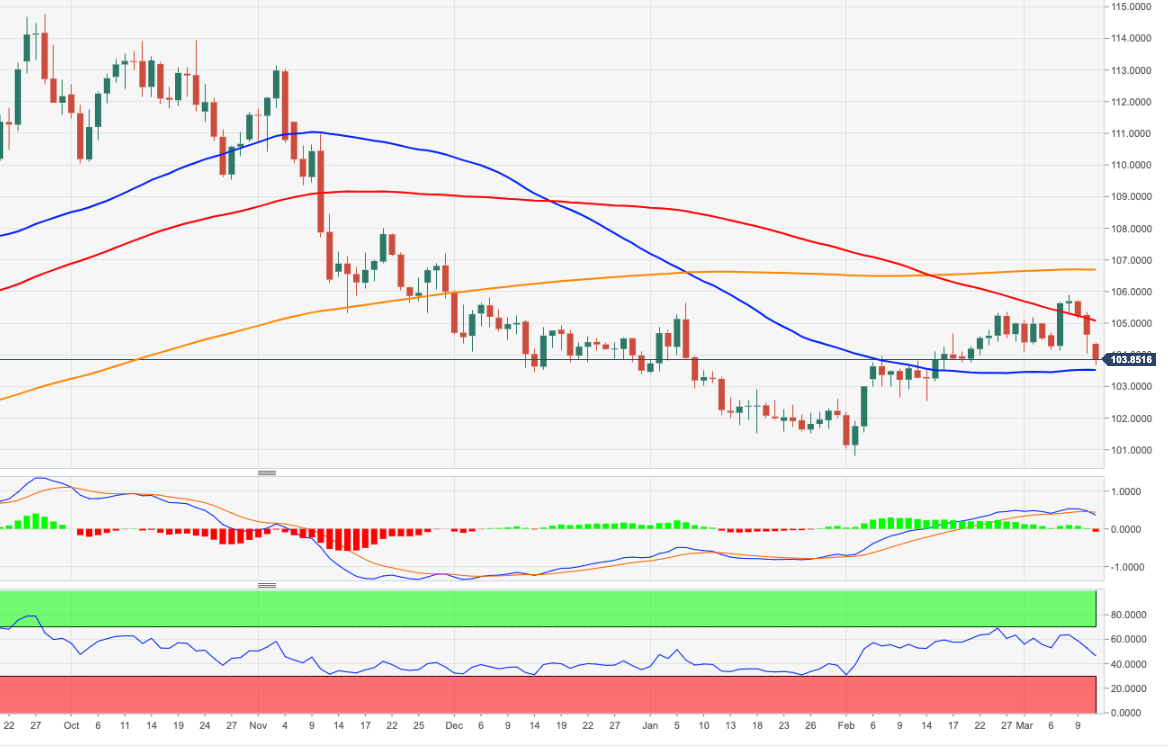
- USD/JPY is pressured to daily support near 132.90.
- All eyes are on US CPI for the day ahead.
USD/JPY is down some 1.3% on the day and has fallen from a high of 135.05 to a low of 132.28 ahead of what will be critical data in the US Consumer Price Index on Tuesday. The US Dollar was pressured at the start of the week and in a continuation to the fallout from the Nonfarm Payrolls.
While the Nonfarm Payrolls showed robust jobs growth, the rise in the Unemployment Rate and signs of cooling wage inflation sent the greenback lower as investors started to trim bets that the Federal Reserve will raise interest rates as sharply. The United States added 311,000 payrolls in February and the unemployment rate rose to 3.6%. However, a survey of economists polled by Reuters expected the United States to have added 205,000 jobs last month and the unemployment rate to hold steady at 3.4%. Average hourly earnings rose 0.2% last month after gaining 0.3% in January, below expectations of 0.3%.
On Monday, more fuel was added to the fire when markets priced in a Federal Reserve that will slow if not halt its raising of interest rates after US authorities moved to limit the fallout from the sudden collapse of Silicon Valley Bank. A new Bank Term Funding Program will offer loans from the Federal Reserve of up to one year to depository institutions, backed by United States Treasuries and other assets these institutions hold.
Consequently to all of the above, the US Dollar index, or DXY, which measures the greenback vs. a basket of major currencies, has dropped heavily benefitting the Yen. DXY has printed a fresh low of 103.484, tracking the fall in short-dated Treasury yields. The two-year note was paying as low as 3.997% at one point in New York trade early in the day. In fact, the yield dropped hard from the week´s highs of 4.534% in the biggest one-day drop since the financial crisis of 2008, on track for its biggest three-day decline since the Black Monday crash of 1987.
Also supporting the bid in the Yen is the fact that the Fed funds futures have been repriced as traders expect that the Fed's terminal rate will be lower. Investors are now expecting that to come in as low as 4.14% for December which was originally priced above 5% on Friday. Additionally, futures are showing a 21% chance of no hikes in rates from the Federal Open Market Committee when announcements will be made on March 22. A week ago futures were pricing about the same probability of a 50 basis point rate hike by policymakers.
US CPI eyed
Analysts at TD Securities explained that the US core prices likely gained momentum in February with the index rising a strong 0.5% MoM, as we look for the recent large relief from goods deflation to start normalizing. ´´Shelter inflation likely remained the key wildcard, while slowing gasoline and food prices will likely dent non-core CPI inflation. Our m/m forecasts imply 6.1%/5.5% YoY for total/core prices.´´
USD/JPY technical analysis
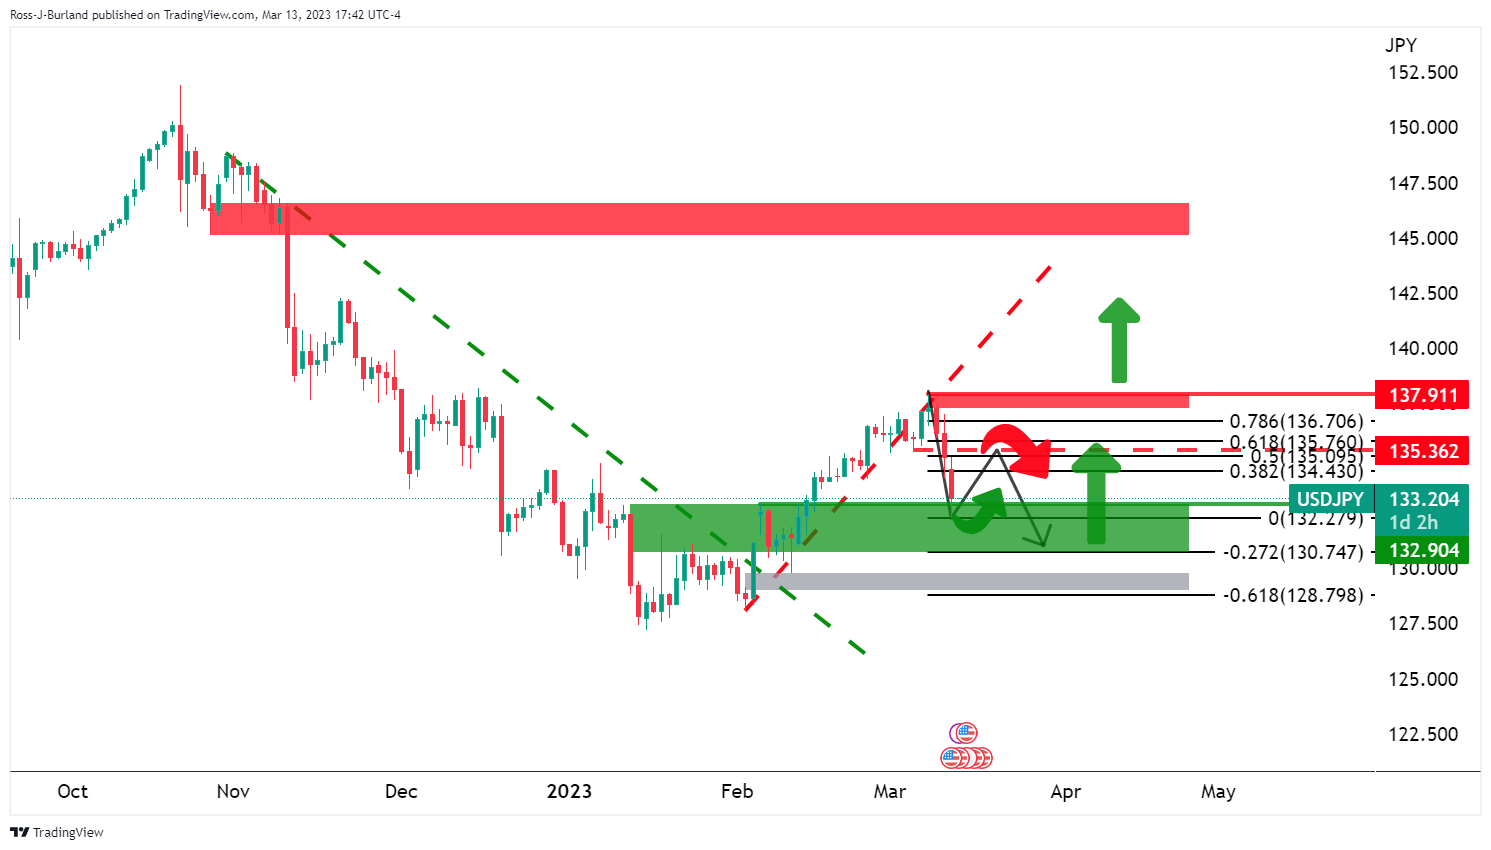
On a daily basis, USD/JPY is moving into a support zone that could result in a correction ahead of the US CPI data with the 134.50-70 eyed as per the daily Fibonacci scale as illustrated above. However, on a lower time frame:
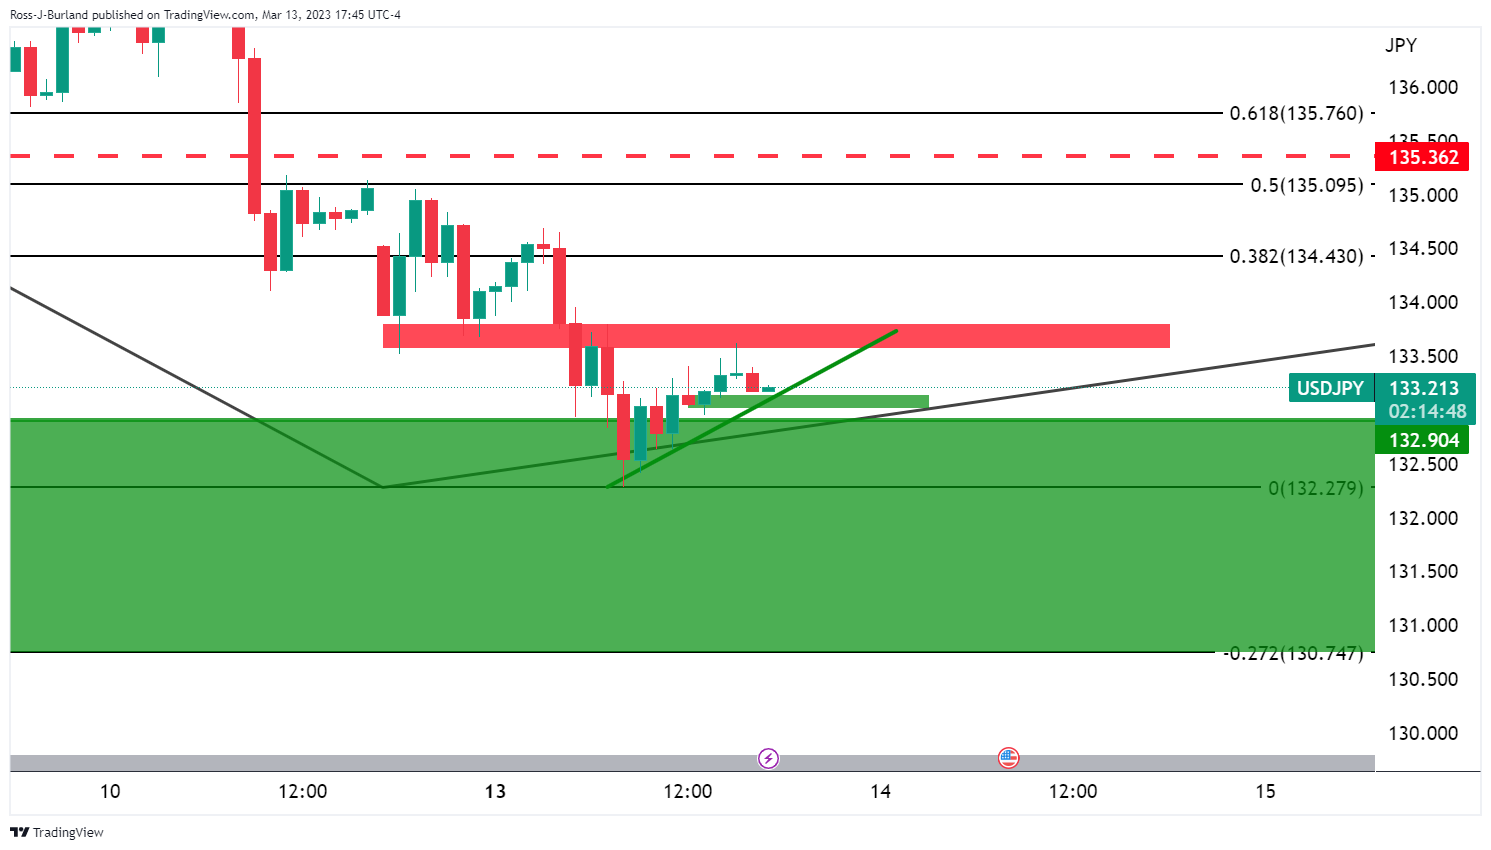
There is a lot of resistance between 133.70 and 134.00 that the bulls will need to volt first.
Here is what you need to know on Tuesday, March 14:
The collapse of Silicon Valley Bank (SVB) and Signature Bank hit markets unexpectedly, creating a confidence crisis that continues to spread. The Federal Reserve announced it will make available additional funding to help assure banks have the ability to meet the needs of all their depositors. US President Biden spoke on Monday and said that no taxpayer money would be used to bail out banks. The impact has been large enough that a 50 basis point hike from the Federal Reserve at the March 21-22 meeting now seems unlikely.
The SVB collapse drove US stock markets to monthly lows. The Nasdaq managed to recover and gained 0.45%, while the Dow Jones lost 0.28% and the S&P 500 fell by 0.15%. The VIX rose 6% after pulling back during the second half of the American session.
The US Dollar dropped sharply at the beginning of the week, hit by the decline in US yields as markets consider the possibility of no interest rate hike from the Fed at the March meeting. As a result, US yields suffered the biggest three-day slide in three decades.
On Tuesday, the US Consumer Price Index (CPI) is due at 12:30 GMT (Daylight Saving Time began on Sunday, so the time of main US releases has changed). The numbers will be watched closely to see how the fight against inflation is going. Prior to the SVB crisis, the US CPI was seen as a critical report for the upcoming Fed’s monetary policy decision. At current hours, markets are seeing a softer Fed, as their focus is on the impact of the banking crisis.
USD/JPY fell for the third consecutive day, trimming losses during the American session after recovering above 133.00. EUR/USD broke above 1.0700, hitting the strongest level in a month. Reports suggest the European Central Bank will raise rates by 50 basis points on Thursday despite SVB turmoil. EUR/GBP pulled back to 0.8800. GBP/USD rose sharply from near 1.2050 toward 1.2200.
AUD/USD and NZD/USD took advantage of the weaker Dollar and rose to 0.6700 and 0.6250, respectively. The risk-off environment is not affecting commodity currencies so far. Latin American currencies dropped again, with USD/MXN hitting levels above 19.00.
Crude Oil prices fell more than 2%. WTI finished around $74.50, avoiding a daily close under January or February lows that would have increased the bearish pressure. Bitcoin surged, gaining more than 10%, surpassing $24,000.
Gold jumped above $1,900 to the highest since early February, boosted by the rally in the bond market. Silver rocketed by more than 6%, approaching $22.00.
Like this article? Help us with some feedback by answering this survey:
- GBP/USD bulls could be tiring at this juncture.
- Bears need to break the 1.2140 structure to cement the bearish case for the day ahead.
GBP/USD has run up towards an area of potential resistance area on the daily chart as the following will illustrate. This gives rise to the prospects of a significant correction over the coming week:
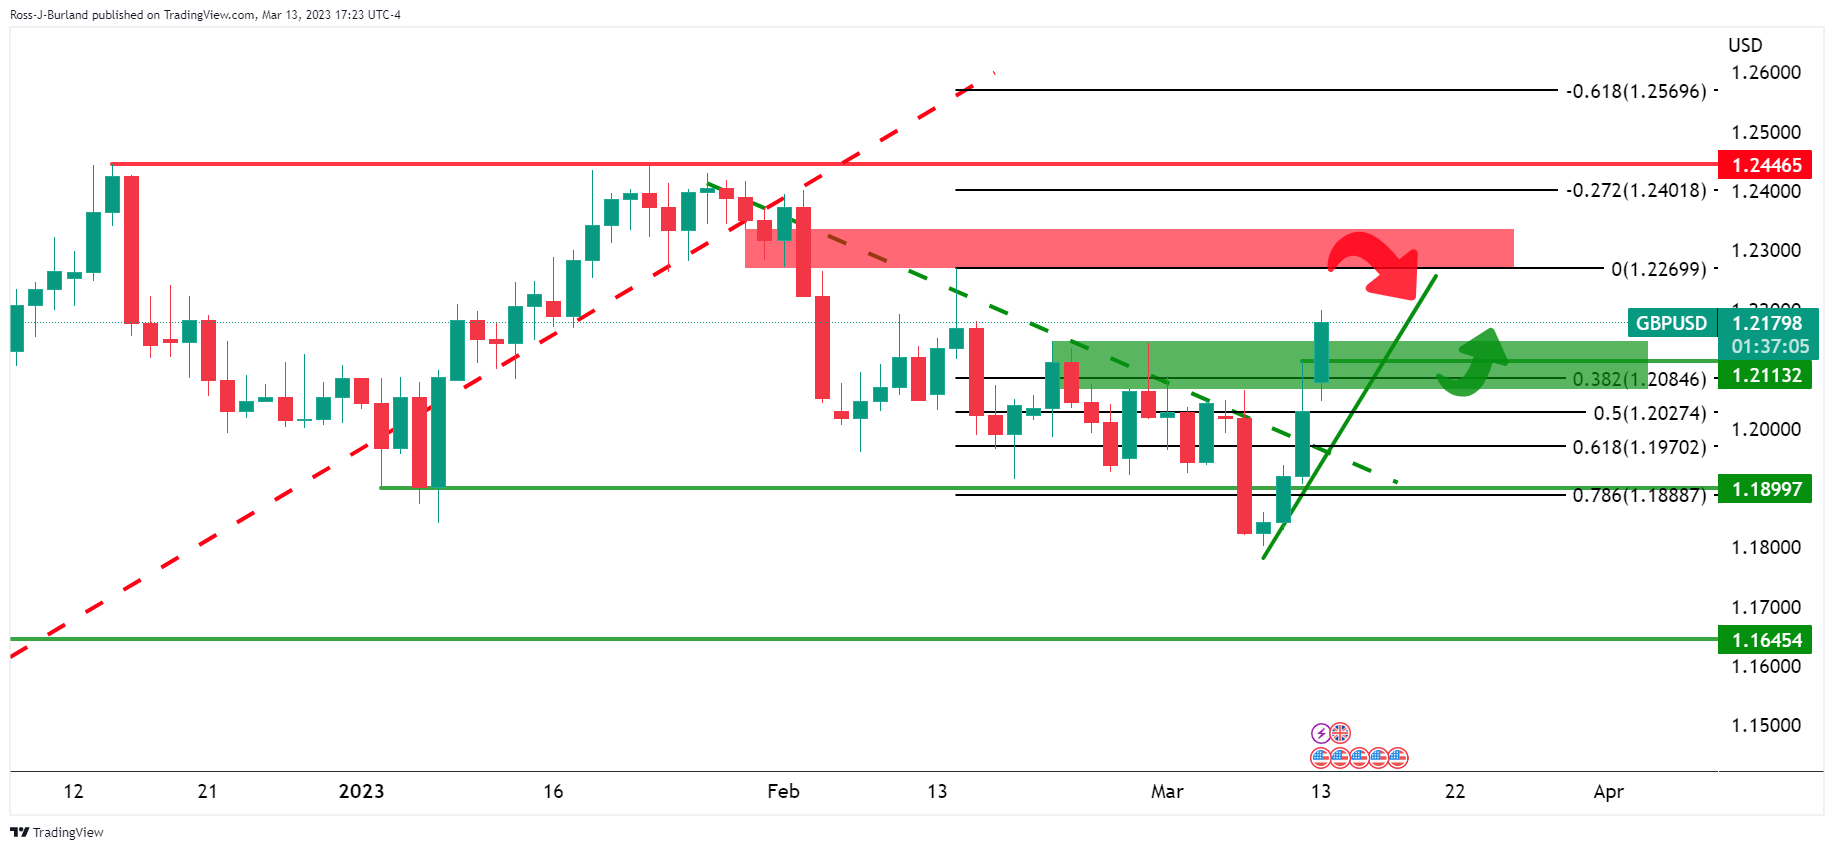
Drawing the Fibonacci from a presumed level where there could be resistance if the price were to continue higher over the next day or so, a 38.2% Fibonacci retracement level comes in near the 1.2080s as potential support.

At this point, however, drawing the Fib from current highs, the 38.2% comes in at 1.2050.
GBP/USD H4 chart
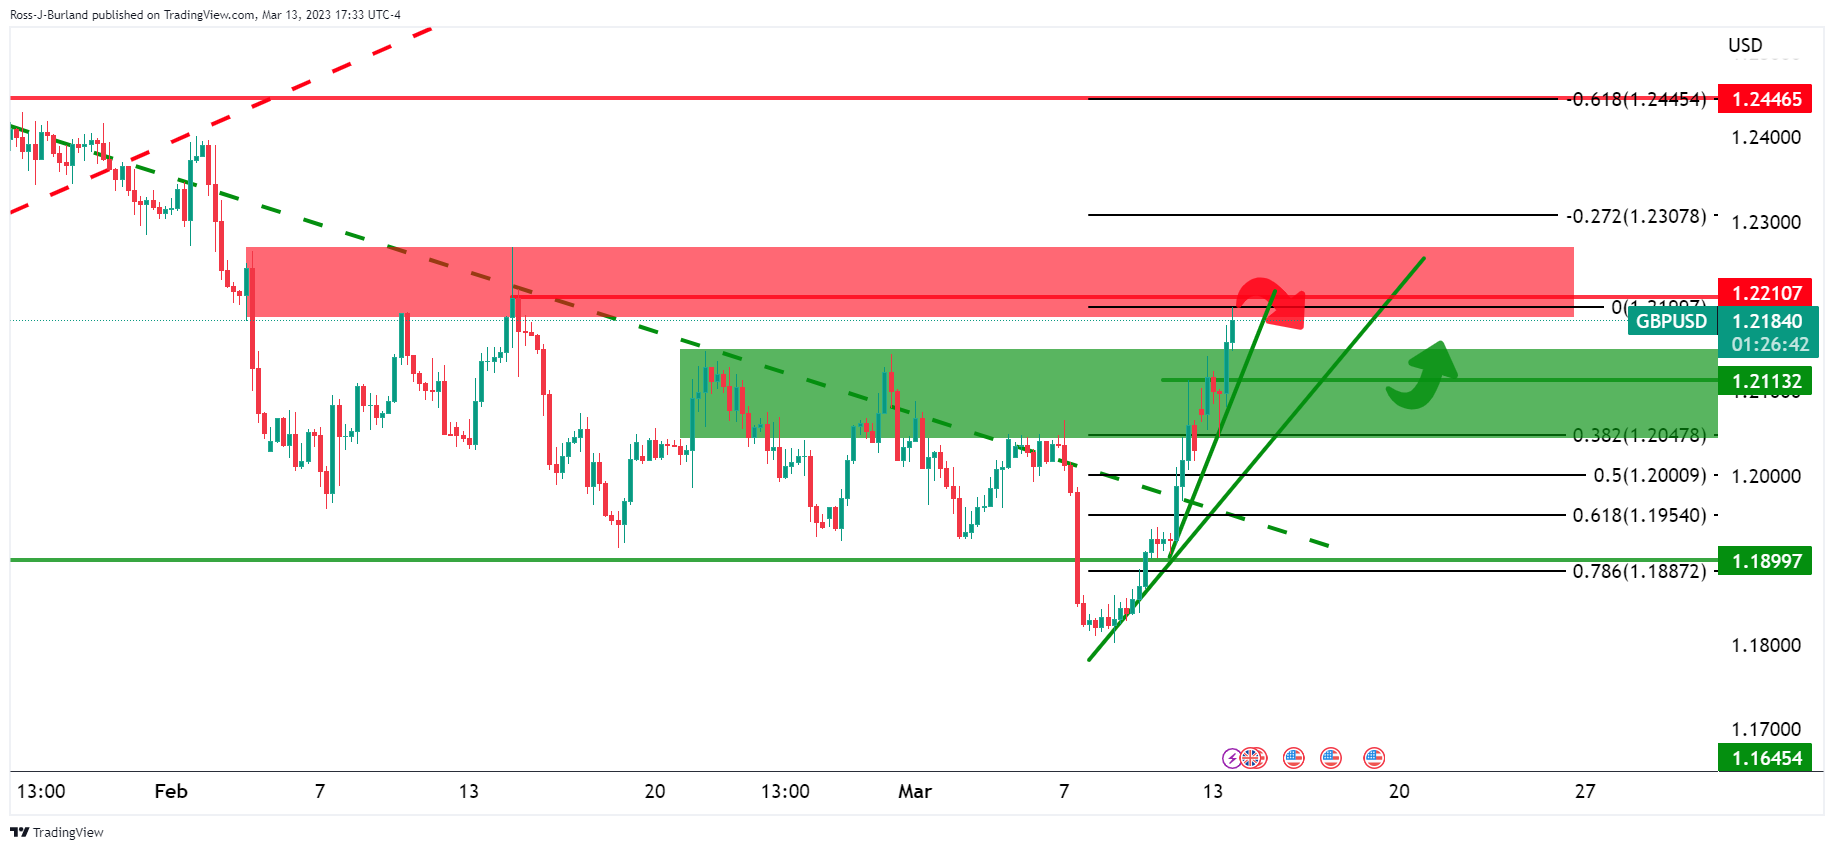
Drilling down to the 4-hour chart, above, there could be a pop to test 1.2200-1.2250 but a subsequent failure and break of the micro-dynamic support will possibly lay the foundations for the anticipated correction.
GBP/USD H1 chart
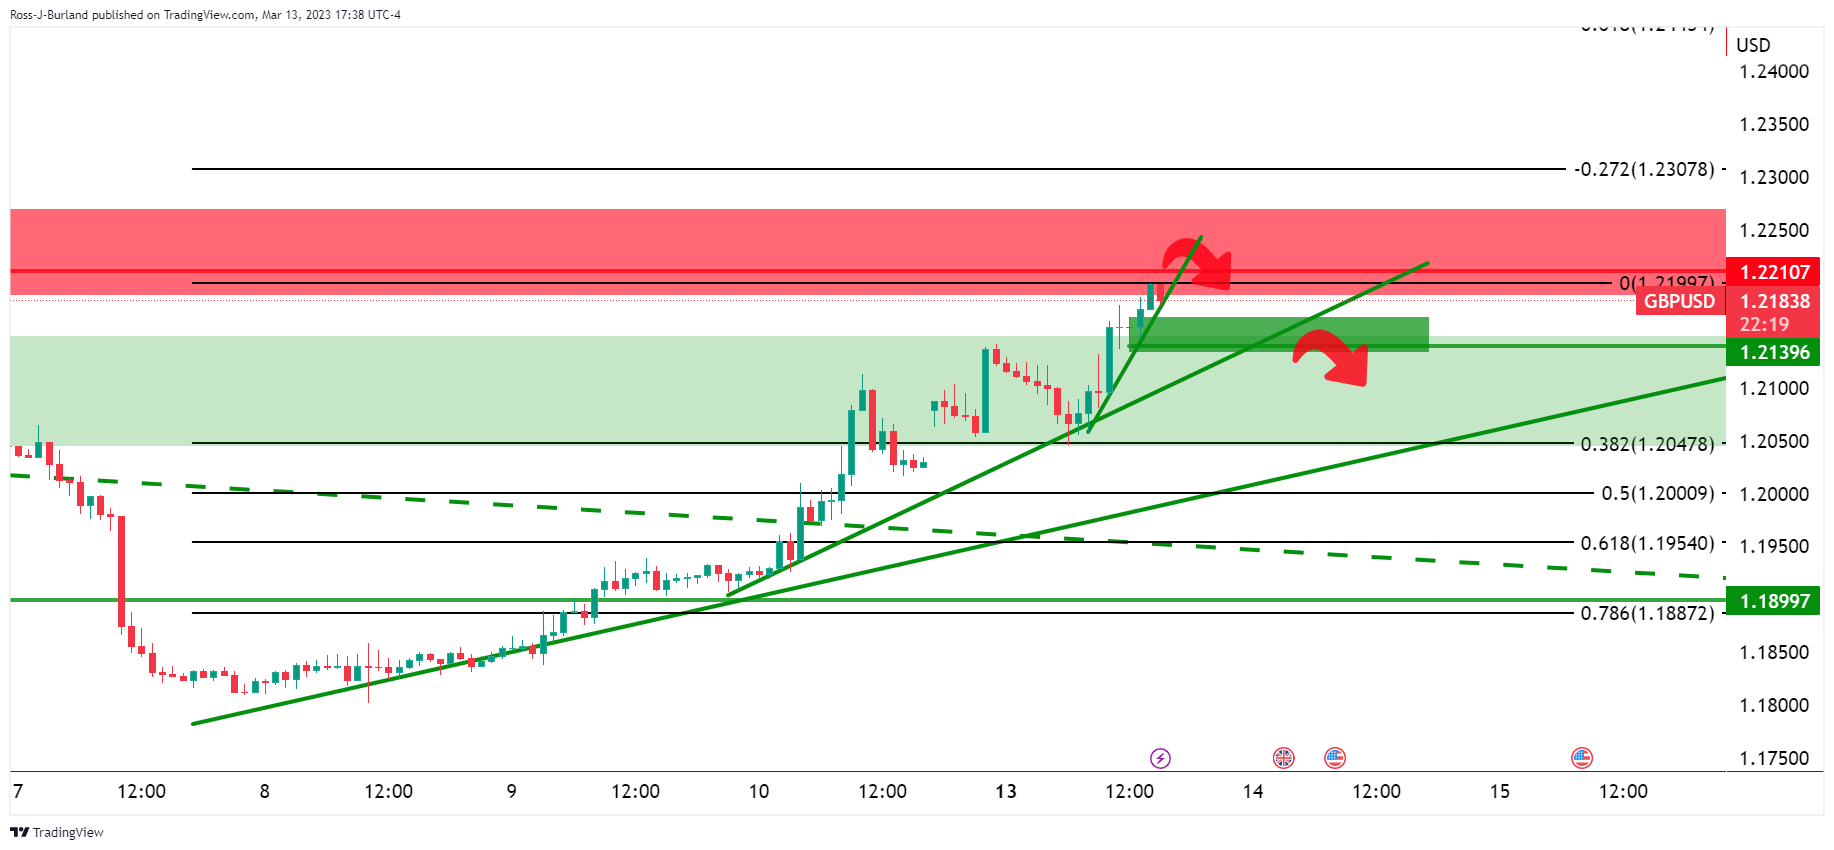
Meanwhile, the price is still very much on the front side of the trend. However, the hourly micro trendline is now under some pressure adding substance to the corrective bias at this point. A break of the 1.2140 structure is needed to cement the bearish case for the day ahead.
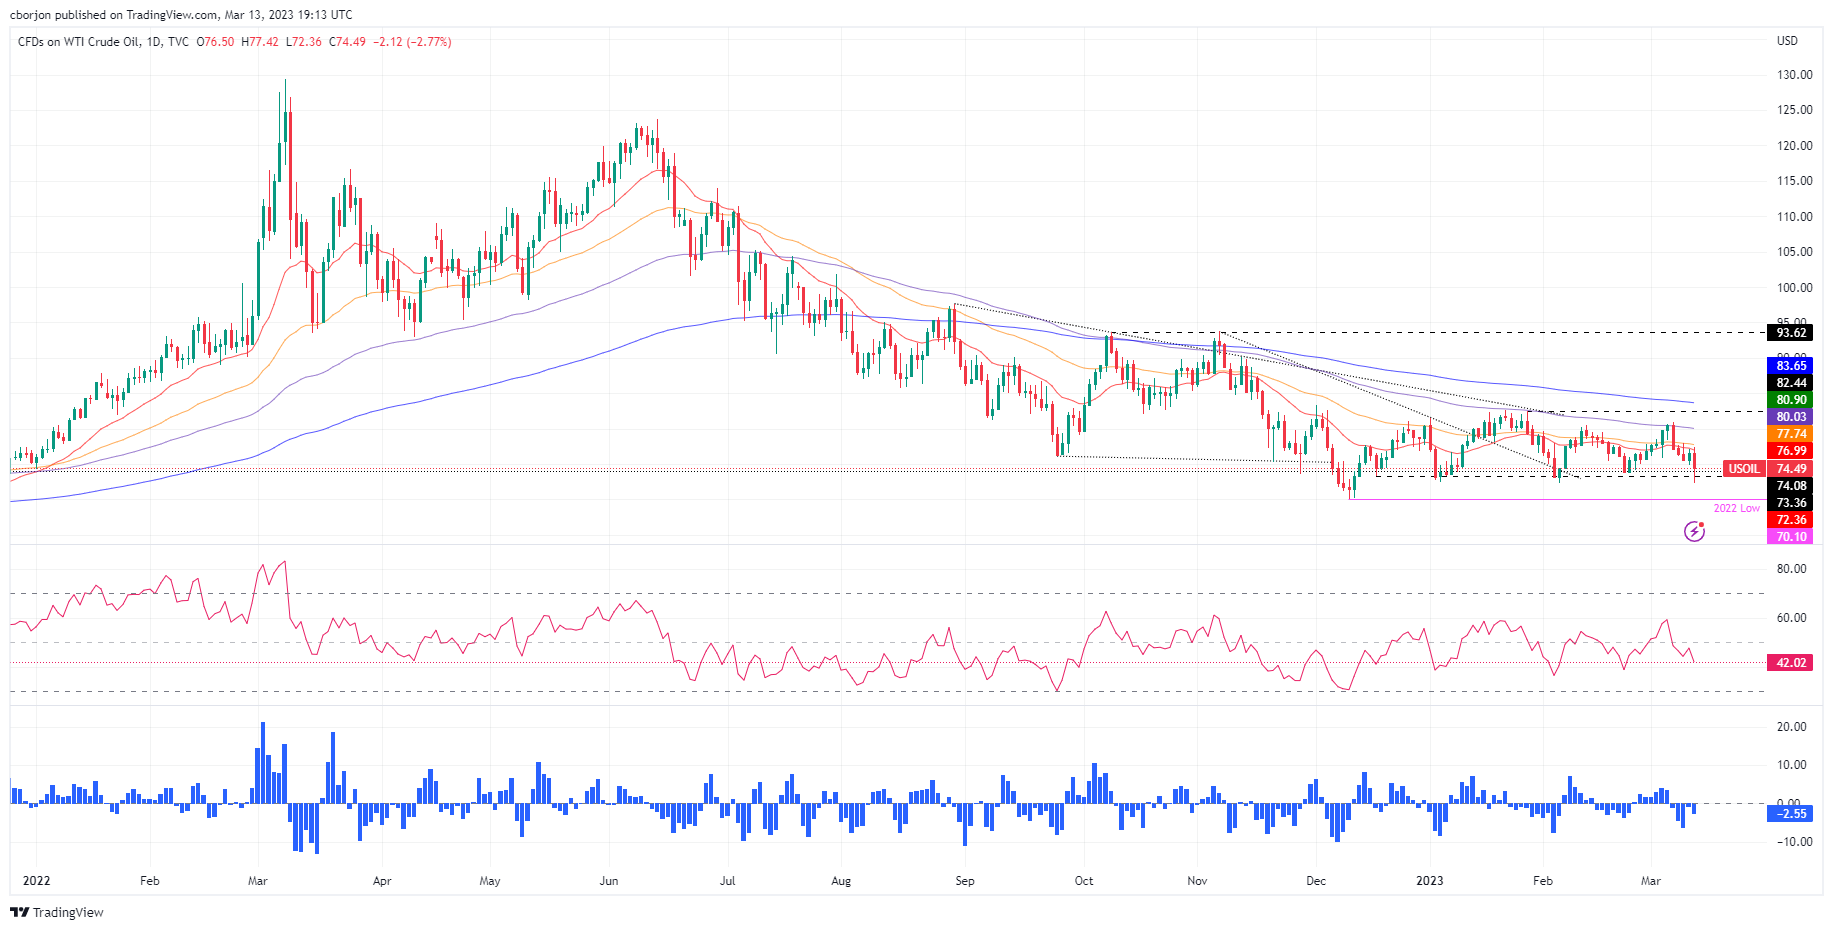
- Western Texas Intermediate drops almost 3% on possible US financial crisis risks.
- A weaker US Dollar put a lid on WTI’s price.
- WTI Price Analysis: Can test March’s lows around $72.30s.
Western Texas Intermediate (WTI), the US crude oil benchmark, dropped more than 2% on risk-off impulse, with a bank crisis in the United States (US) raising fears for a possible contagion. Nevertheless, a recovery in Chinese demand put a lid on WTI’s fall. At the time of writing, WTI is trading at $74.54 after hitting a high of $77.42.
US assets dropped in value last week due to worries about the impact of Silicon Valley Bank’s collapse, and regulators shut down another bank in New York on Sunday.
On Monday, U.S. stocks were mostly up but volatile as investors wondered if the Fed would stop raising interest rates in March. The government took urgent steps on Sunday to boost trust in the banks. [.N]
The sudden closure of SVB Financial raised questions about how other banks were affected by the Fed’s fast rate increases in the past year. It also made investors think the central bank might slow down its monetary policy.
Oil prices fluctuated on Monday as investors assessed how the news would affect the market. WTI price usually increases with a weaker US Dollar because oil becomes more affordable for people who use other currencies.
High US oil stockpiles have also pressured oil prices, which indicates weak demand.
Oil’s decline came after a positive day on Friday when US job data was better than expected. The number of jobs added in February was 311,000, much higher than the predicted 205,000 by market participants.
WTI Technical Analysis
When sentiment shifted sour, the US crude oil benchmark fell toward its daily low of $72.36. Buyers stepped in and dragged prices up, but buyers failed to reclaim the 20-day EMA at $77.01. WTI’s bias remains downward biased, and it might retest March lows, but it would need to clear support areas. The first support would be $74.00. A break below will expose the February 22 low of $73.83, followed by the $73.00, and then the YTD lows.
- NZD/USD is a touch off the highs but buoyed by US Dollar softness.
- US CPI is the next key data event with eyes on the Fed next week.
NZD/USD is higher at the start of the week, up some 1.65% at the time of writing after climbing from a low of 0.6134 and reaching a high of 0.6264 on the day so far. Risk currencies that are high beta to equities such as the antipodeans have been rebounding sharply from their four-month lows as the collapse of Silicon Valley Bank has been met by resolve from the US regulators and Federal Reserve in order to safeguard depositors.
As a consequence, the US Dollar has struggled in the face of sinking bond yields amid the SVB fallout. The two-year note was paying as low as 3.997% at one point in New York trade and fell from the start of the week´s highs of 4.534% in the most significant one-day drop since the financial crisis of 2008.
Additionally, Fed funds futures have been repriced as traders expect that the Fed's terminal rate will be lower. Markets are now pricing as low as 4.14% for December which was originally priced above 5% on Friday. Moreover, futures are showing a 21% chance of no hikes in rates from the Federal Open Market Committee when announcements will be made on March 22.
´´Contagion fears are high and bond markets have taken the view that the Fed will hike just once more, and then start cutting by September, presumably on the view that confidence and spending will hit a brick wall,´´ analysts at ANZ bank explained.
´´That’s possible, but of course, the inflation starting point is problematic. The point is there are a lot of ifs and buts, and more volatility seems likely in Consumer Price Index data tonight. New Zealand considerations have been well and truly relegated to the background, and this is the USD show. Positioning, and the need to be nimble, are likely to dominate the economics for now.´´
It is worth noting that the Reserve Bank of New Zealand raised interest rates by 50 basis points in a widely anticipated move at its February meeting. The RBNZ has hiked the OCR by a total of 450 basis points in ten consecutive meetings and the rate now stands at a 41-year record of 4.75%.
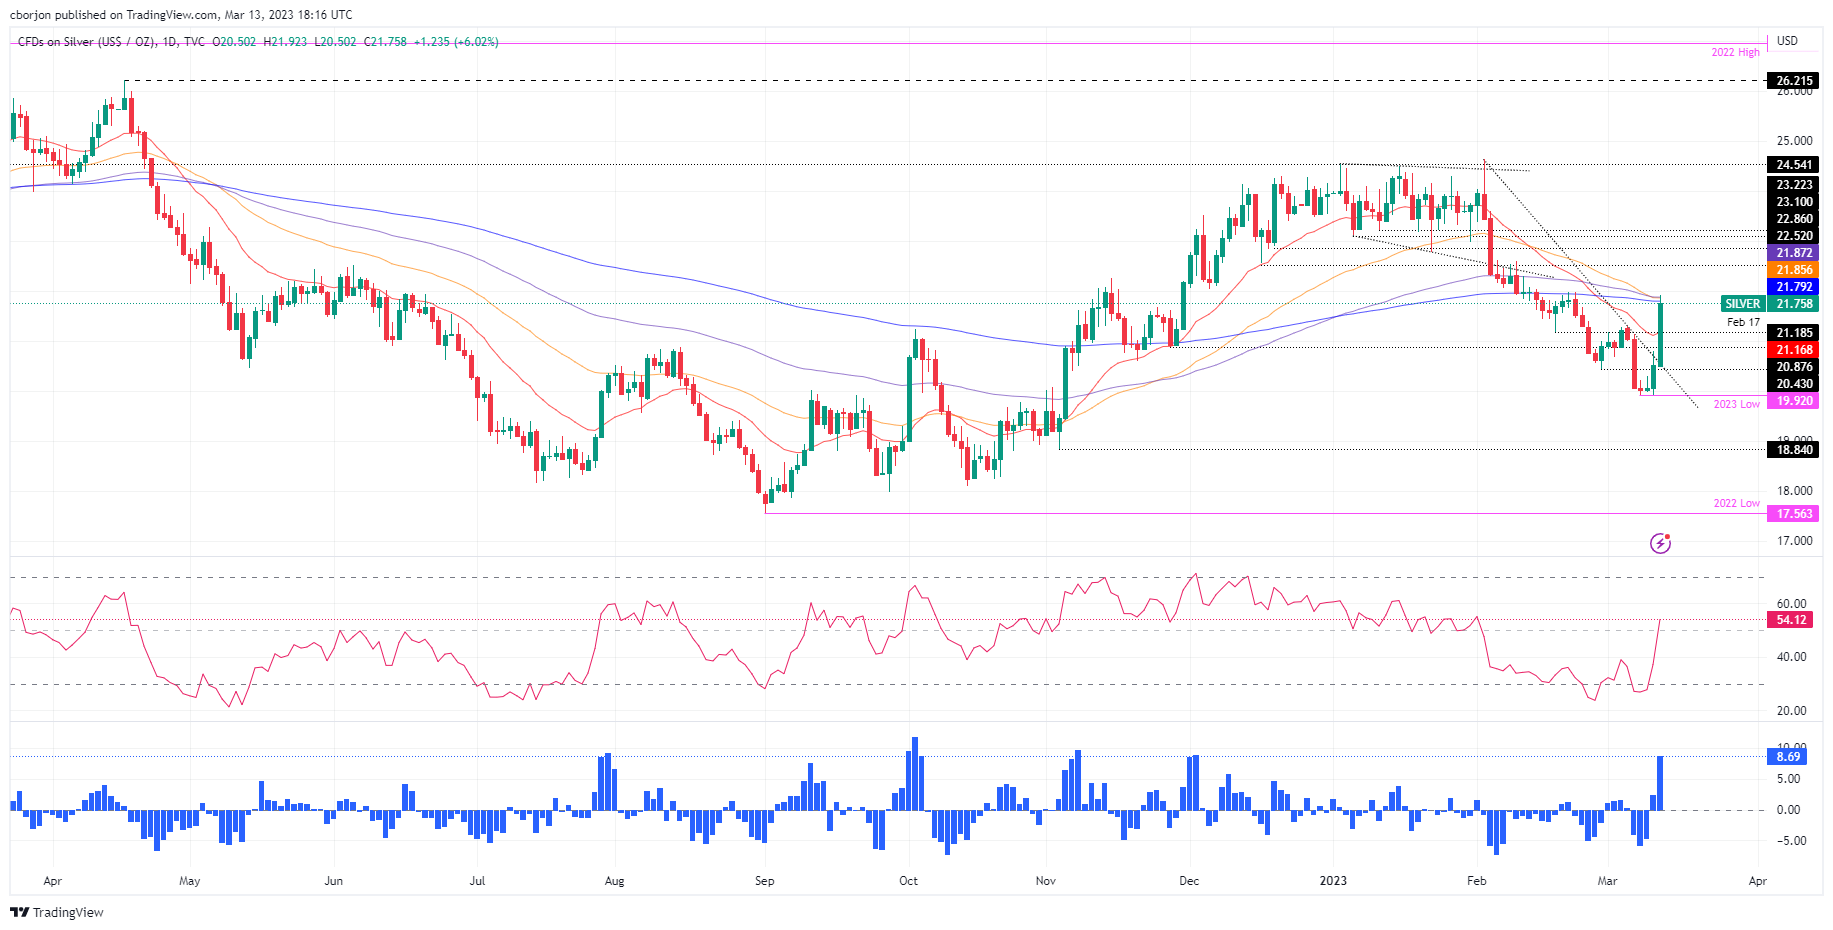
- XAG/USD advances as US Treasury bond yields undermine the US Dollar.
- The XAG/USD is testing the confluence of the 50/100/200-day EMAs.
- XAG/USD Price Analysis: To remain upwards in the short term, though the rally’s size suggests a mean reversion correction.
XAG/USD surges sharply in Monday’s session, up by more than 6% on investors flying to safety. US Treasury bond yields collapsed due to regional bank failure in the United States (US) blamed on higher rates. Therefore, US bond yields collapsing are a tailwind for the white metal prices. At the time of writing, the XAG/USD is trading at $21.76.
XAG/USD Price Action
The white metal is testing solid resistance in the confluence of the 200, 50, and 100-day Exponential Moving Averages (EMAs), each at $21.79, $21.85, and $21.87, respectively. In addition, the Relative Strength Index (RSI) broke above the 50 neutral lines, portraying buying pressure strength. The Rate of Change (RoC) suggests buyers moved aggressively, which could open the door for a mean reversion move. Therefore, traders should be careful.
With XAG/USD breaking above the 200-day EMA would pave the way toward $22.00 a troy ounce. Once done, the XAG/USD next resistance would be $23.00 before testing the February 23 high at $23.59.
In an alternate scenario, the XAG/USD first support would be the 20-day EMA at $21.16. A breach of the latter will expose the $21.00 figure, followed by the March 13 low of $20.50, before falling to YTD lows at $19.92.
XAG/USD Daily Chart
XAG/USD Technical Levels
- EUR/USD bulls are running higher into potential resistance.
- All eyes are on the Federal Reserve, European Central Bank, and Tuesday´s US Consumer Price Index, CPI.
EUR/USD is up by over 0.9% in midday trade on Wall Street aided by a weaker US Dollar and ahead of the European Central Bank's policy meeting on Thursday. Expectations call for the ECB to deliver a 50-basis point hike and hawkish rhetoric is assumed which is buoying the Single Currency which has traveled from a low of 1.0650 to a high of 1.0748 so far.
Meanwhile, the US Dollar continued to bleed heavily on Monday as markets bet the Federal Reserve will be less aggressive in raising interest rates to curb inflation. US authorities have made moves to try to lessen the damage from the recent collapse of Silicon Valley Bank.
A new Bank Term Funding Program will offer loans from the Federal Reserve of up to one year to depository institutions, backed by United States Treasuries and other assets these institutions hold.
Consequently, the US dollar index, or DXY, which measures the greenback vs. a basket of major currencies, has dropped to a fresh low of 103.484, tracking the fall in short-dated Treasury yields. The two-year note was paying as low as 3.997% at one point in New York trade and tumbled from the start of the week´s highs of 4.534% in the biggest one-day drop since the financial crisis of 2008, on track for its biggest three-day decline since the Black Monday crash of 1987. Meanwhile, Fed funds futures have been repriced as traders expect that the Fed's terminal rate will be lower. Markets are now pricing as low as 4.14% for December which was originally priced above 5% on Friday. Moreover, futures are showing a 21% chance of no hikes in rates from the Federal Open Market Committee when announcements will be made on March 22.
US Consumer Price Index will be key
This all makes for a very important red calendar event this week in the US Consumer Price Index data. This will be released on Tuesday morning in the US session and traders will use the data to speculate how the Federal Reserve will react later this month when the central bank will meet to decide on its interest rate setting.
´´The release of US CPI inflation data tomorrow is expected to show headline price pressures remains elevated at 6% YoY, well above the Fed’s 2% Inflation forecast,´´ analysts at Rabobank said. ´´If the Fed were to back away from its tightening cycle, it may have a credibility issue on its hands. Additionally, for some years Fed officials have argued that monetary policy is not the right tool to tackle financial stability,´´ the analysts noted.
´´Given the announcement that the Fed has made over the weekend in conjunction with the Treasury to stop contagion risks from the SVB crisis, the FOMC may favor continuing to hike rates next week with a focus on the inflation risks,´´ the analysts at Rabobank argued.
´´We maintain our 1- and 3-month forecasts of EUR/USD 1.06 and 1.06 respectively, though clearly, we will be watching the forward guidance at this month’s Federal Reserve (and ECB) policy meetings closely,´´ the analysts explained.
EUR/USD technical analysis
There appears to be more gas in the tank for the Euro at this stage but it is running low. EUR/USD approaches a key resistance area and has left territory behind hastily that might require a correction in order to mitigate uneven grounds in EUR/USD´s bids and offers between 1.0600-1.0650 on the daily chart:
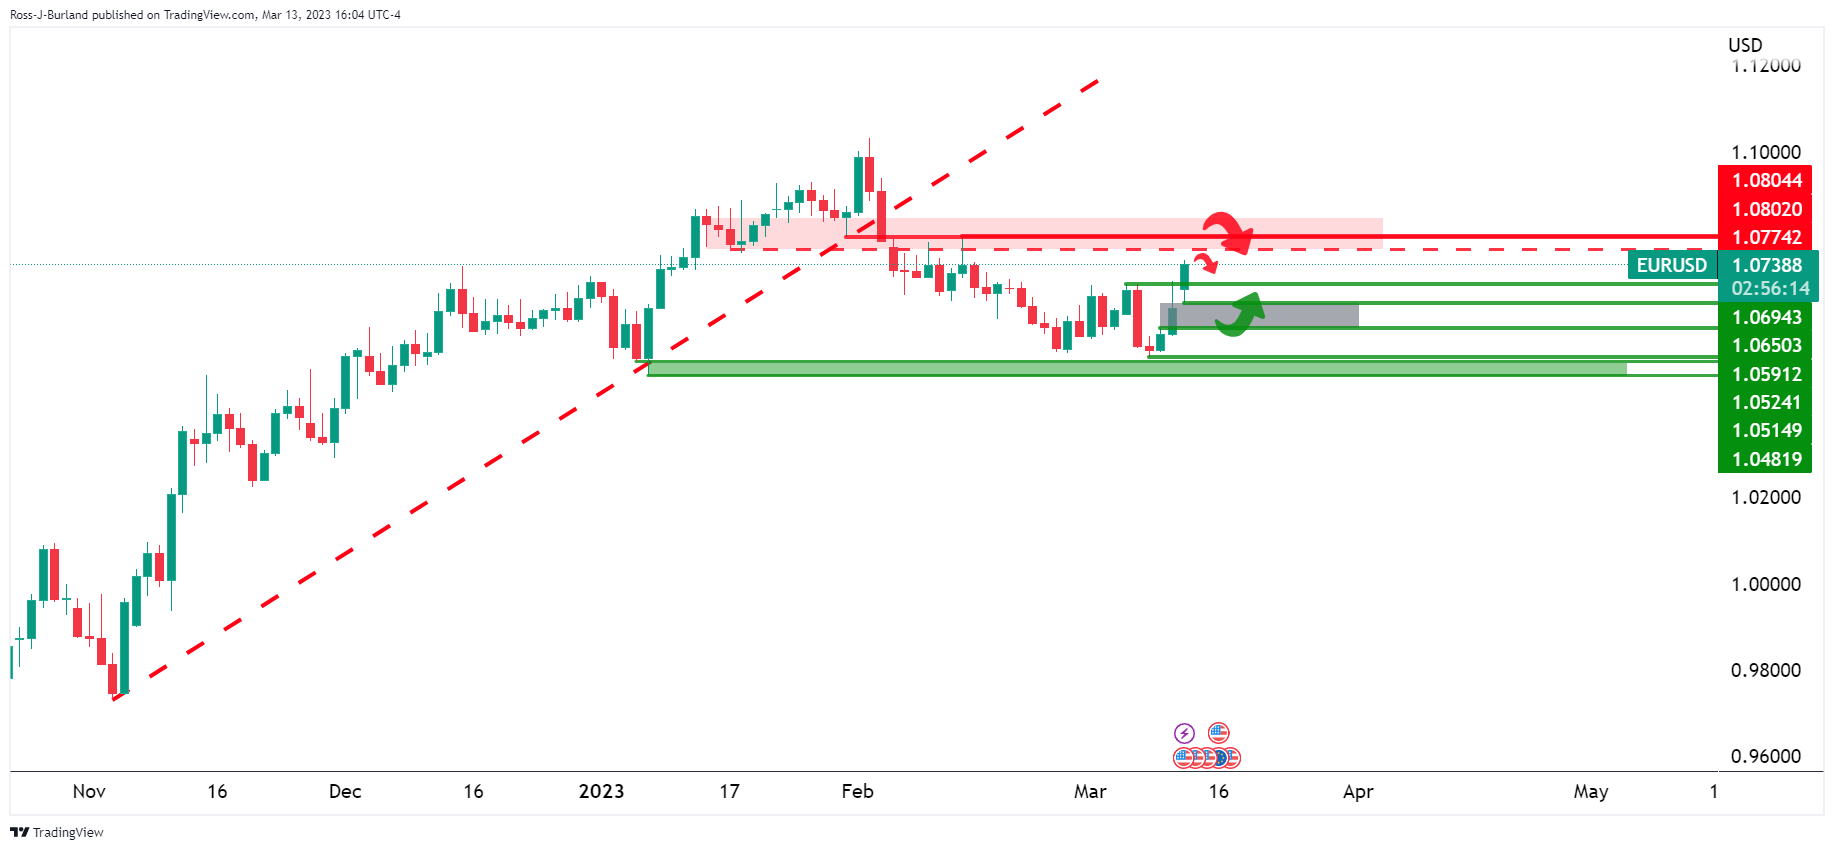
On the EUR/USD hourly chart, a 50% mean reversion of the prior bullish impulse meets the trendline support near 1.07 the figure:
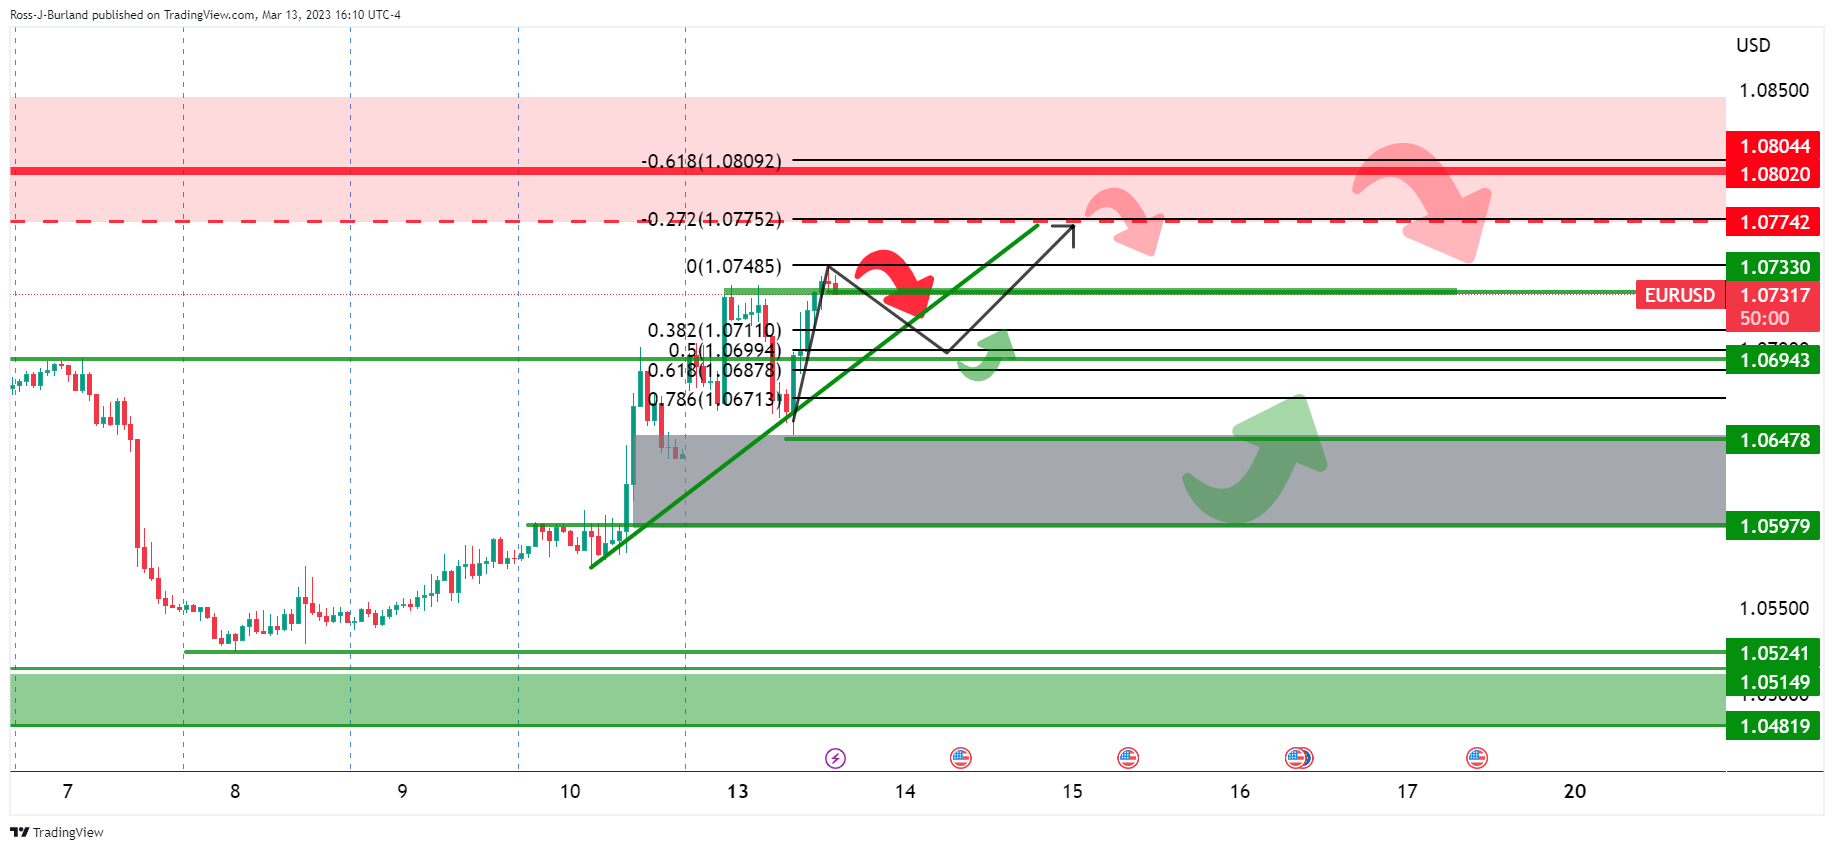
A break of the EUR/USD trendline could be the makings for the continuation of the distribution that appears to be taking place on the daily chart with the price on the backside of the prior dominant bullish trend.
- The XAU/USD (Gold) commodity starts the week positively, trading at $1,906.70, up by 2.11% on the day.
- Increased market volatility and rising risk led to a surge in demand for safe-haven assets like Gold.
- Technical indicators, such as the daily 20-SMA and 50-SMA, suggest a potential bullish outlook for gold.
- Due to risk aversion, US yields have reached their lowest levels in recent months.
Daily price movements:
XAU/USD (Gold) commodity opens the first day of the week at $1,867.24, with an intraday high of $1,913.13 and a low of $1,867.24. Gold trades at $1,906.70 at the press time for the first time since February 3rd, 2023, up by 2.11% on Monday.
The sharp drop in US yields is considered the primary catalyst for the rise in the price of Gold. The US 10-year yield has fallen to 3.41%, approaching its year-to-date lows from its previous level above 4.0%. Meanwhile, the 2-year yield reached its highest since 2008 and fell to its lowest intraday level since October 2022, at 4.00%.
Following the collapse of Silicon Valley Bank (SVB), concerns have arisen about the state of the banking sector, which has caused a decrease in expectations for a rate hike by the Federal Reserve (Fed). Investors are watching the potential impact of this crisis on economic data.
Key economic events:
The upcoming US February Consumer Price Index (Feb) on Tuesday and US Retail Sales (Feb) on Wednesday are expected to be critical for monetary expectations and is also closely monitored.
However, following the unexpected SVB collapse, markets are now pricing in a more relaxed stance by the Fed.
Technical view:
Technical indicators suggest a potential bullish outlook for Gold in the short term. The daily 20-SMA and 50-SMA are at $1,838.83 and $1,873.21, respectively, indicating a possible bullish trend. The RSI(14) is at 64.970, indicating potential bullish momentum.
Resistance levels for Gold are at $1,884.08, $1,898.25, and $1,926.40, while support levels stand at $1,841.76, $1,813.61, and $1,799.44. The daily pivot point is $1,855.93.
Citing eurosystem sources, MNI reported on Monday that the European Central Bank was planning to go ahead with the 50 basis points (bps) rate hike at its upcoming meeting despite sliding market rate expectations amid Silicon Bank Valley turmoil.
MNI further explained that dovish policymakers were likely to argue that the changing economic environment would warrant more caution in regard to policy tightening.
Market reaction
EUR/USD showed no immediate reaction to this headline and was last seen rising 0.8% on a daily basis at 1.0725.
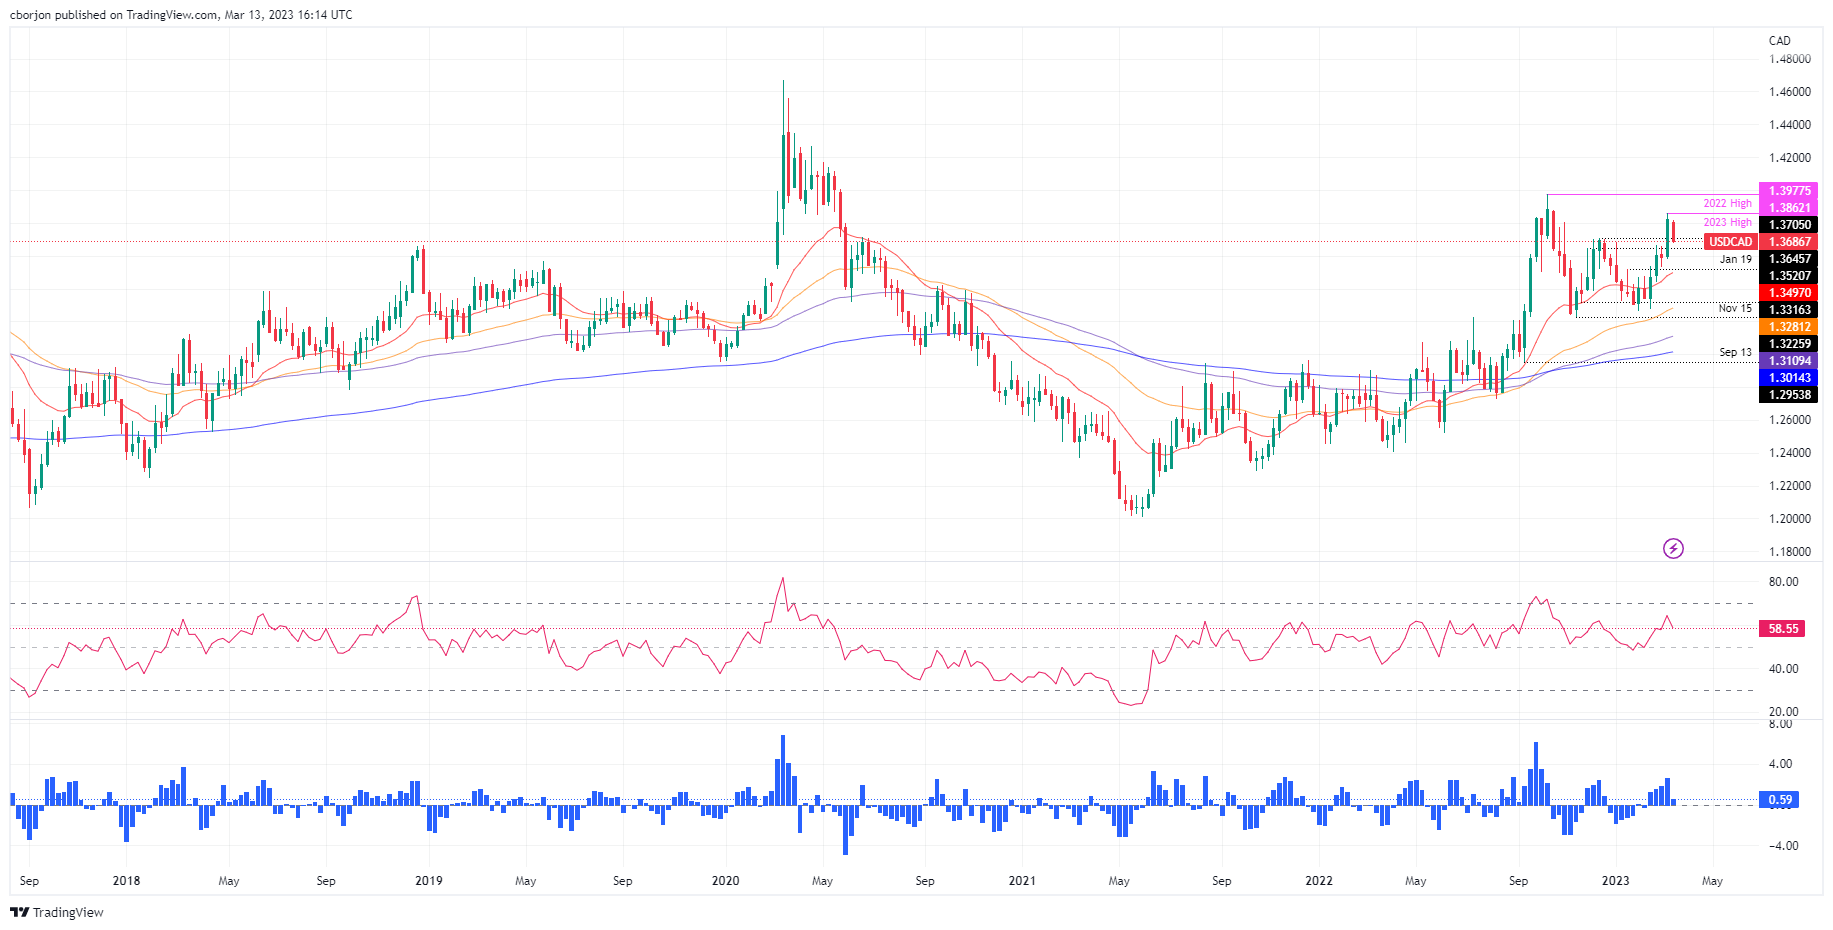
- USD/CAD falls amidst broad US Dollar weakness across the board.
- The SVB crisis in the United States sent ripples in the financial markets, with UST bond yields plummeting.
- USD/CAD Price Analysis: In the near term, neutral to downward biased.
USD/CAD drops from around daily highs of 1.3815, falls 0.90% on overall US Dollar (USD) weakness, spurred on an ongoing Regional Bank crisis in the US. Therefore, UST bond yields plunge; consequently, the buck is down. At the time of writing, the USD/CAD is trading at 1.3692.
USD/CAD Price Action
After rallying to YTD highs of 1.3862, the Canadian dollar (CAD) is recovering some ground, eyeing a daily close below the December 12 high at 1.3705. Even though the financial markets are punishing the US Dollar (USD), safe-haven flows would increase volatility in USD-denominated currency pairs. If the banking crisis ease, traders should expect a repricing of the Fed, meaning further upside in the USD/CAD is expected.
In the short term, the USD/CAD might fall toward 1.3600, but solid support areas would face it. The first support would be the February 20 daily high at 1.3665, followed by the 1.3600 figure. A breach of the latter will expose the 20-day Exponential Moving Average (EMA) at 1.3496 before testing the 50-day EMA at 1.3280.
In an alternate scenario, the USD/CAD first resistance would be 1.3700. Once cleared, the pair could rally towards the 1.3800 area, ahead of testing the YTD high at 1.3862.
Oscillators like the Relative Strength Index (RSI) at 58.22 aiming lower suggests that sellers are gathering momentum. The Rate of Change (RoC), shifted toward neutral territory, displaying that buying pressure is waning.
Trend: In the near term, neutral to downwards.
USD/CAD Daily Chart
USD/CAD Technical Levels
Strategists at ANZ Bank are raising Gold forecasts. They see limited downside, with a 0-3 month target of $1,800. Meanwhile, they have lifted their year-end forecast by $100 to $2,000.
Upside bias remains intact
“We see the Gold price holding above $1,800 in the short-term. Any dips below this should be short-lived, as opportunistic buying would likely emerge.”
“As the macro backdrop becomes more supportive later in the year, we see the price trending higher. We have lifted our quarterly forecasts, targeting $2,000 towards year-end.”
- The AUD/USD currency pair starts the week positively, trading at 0.6716 at the press time, up by 2.11% on the day.
- Technical indicators, such as the daily 20-SMA and 50-SMA, suggest a potential bullish outlook for AUD/USD.
- SVB banking catastrophe’s ripple effects and the consequences of the Fed’s rate hike decision support the pair.
Daily price movements:
AUD/USD currency pair opens the first day of a new week at 0.6575, with an intraday high of 0.6718 and a low of 0.6577. The pair trades at 0.6716 at the press time, up by 2.11% on the day, just below Monday’s ATH price.
The recent issues with Silicon Valley Bank (SVB) and Signature Bank have highlighted the vulnerable state of US banks, which has dampened expectations for additional interest rate increases from the Federal Reserve (Fed). As a result, Goldman Sachs now predicts a delay in rate hikes in March, and the Fed Fund futures (*) have reduced the likelihood of a 0.50% increase in the Fed rate.
Consequently, the US Dollar Index (DXY) has fallen to its lowest level in a month, trading near 103.60 at the press time.
* Fed Fund futures directly reflect collective marketplace insight regarding the future course of the Federal Reserve's monetary policy. (Source: CME Group’s website)
Key economic events:
Investors will be closely watching the US Consumer Price Index (CPI) (excluding Food and Energy) data for February, set to be released on Tuesday, to gain a better understanding of potential Federal Reserve (Fed) actions on the pace of interest rate increases, which could impact the strength of the US Dollar.
Additionally, both the Employment Change s.a. (Feb) and Unemployment Rate s.a. (Feb) released by the Australian Bureau of Statistics on Thursday will be the key economic events for AUD this week.
Technical view:
Technical indicators suggest a potential bullish outlook for the AUD/USD in the short term. The 20-day SMA and 50-day SMA are at 0.6777 and 0.6885, respectively, indicating a possible bullish trend. The daily 38.2% Fibonacci level is at 0.6593, with the 61.8% Fibonacci level at 0.6611. The RSI(14) is at 44.516, indicating potential bullish momentum. Resistance levels for AUD/USD are at 0.6623, 0.6670, and 0.6699, while support levels stand at 0.6547, 0.6517, and 0.6471. The daily pivot point is at 0.6594.
If the economy slips into a mild – but still traumatic – recession, the Yen will benefit, and so will the Euro, but the biggest winners may be the NZD and the AUD, according to Kit Juckes, Chief Global FX Strategist at Société Générale.
USD/JPY is still following yields, EUR/USD has more complicated drivers but should rise
“We may need clear evidence that the crisis won’t be contagious, and that it won’t alter the path of ECB rates, before the Euro makes new cycle highs, but USD/JPY continues to track yield differentials and history tells us that USD/JPY hit 160 in April 1990, fell to 120 as rates fell to 3%, and kept on going, falling below 80 1995.”
“Continued FX volatility is assured as the markets fret about contagion, and if that were to emerge, the Dollar can turn higher very quickly. But if this event validates the signals from the yield curve and leads to a 1990s-style mild recession, the Dollar will fall further. The Yen will benefit, and so will the Euro, but the biggest G10FX winners in the short run may be the NZD and even the AUD.”
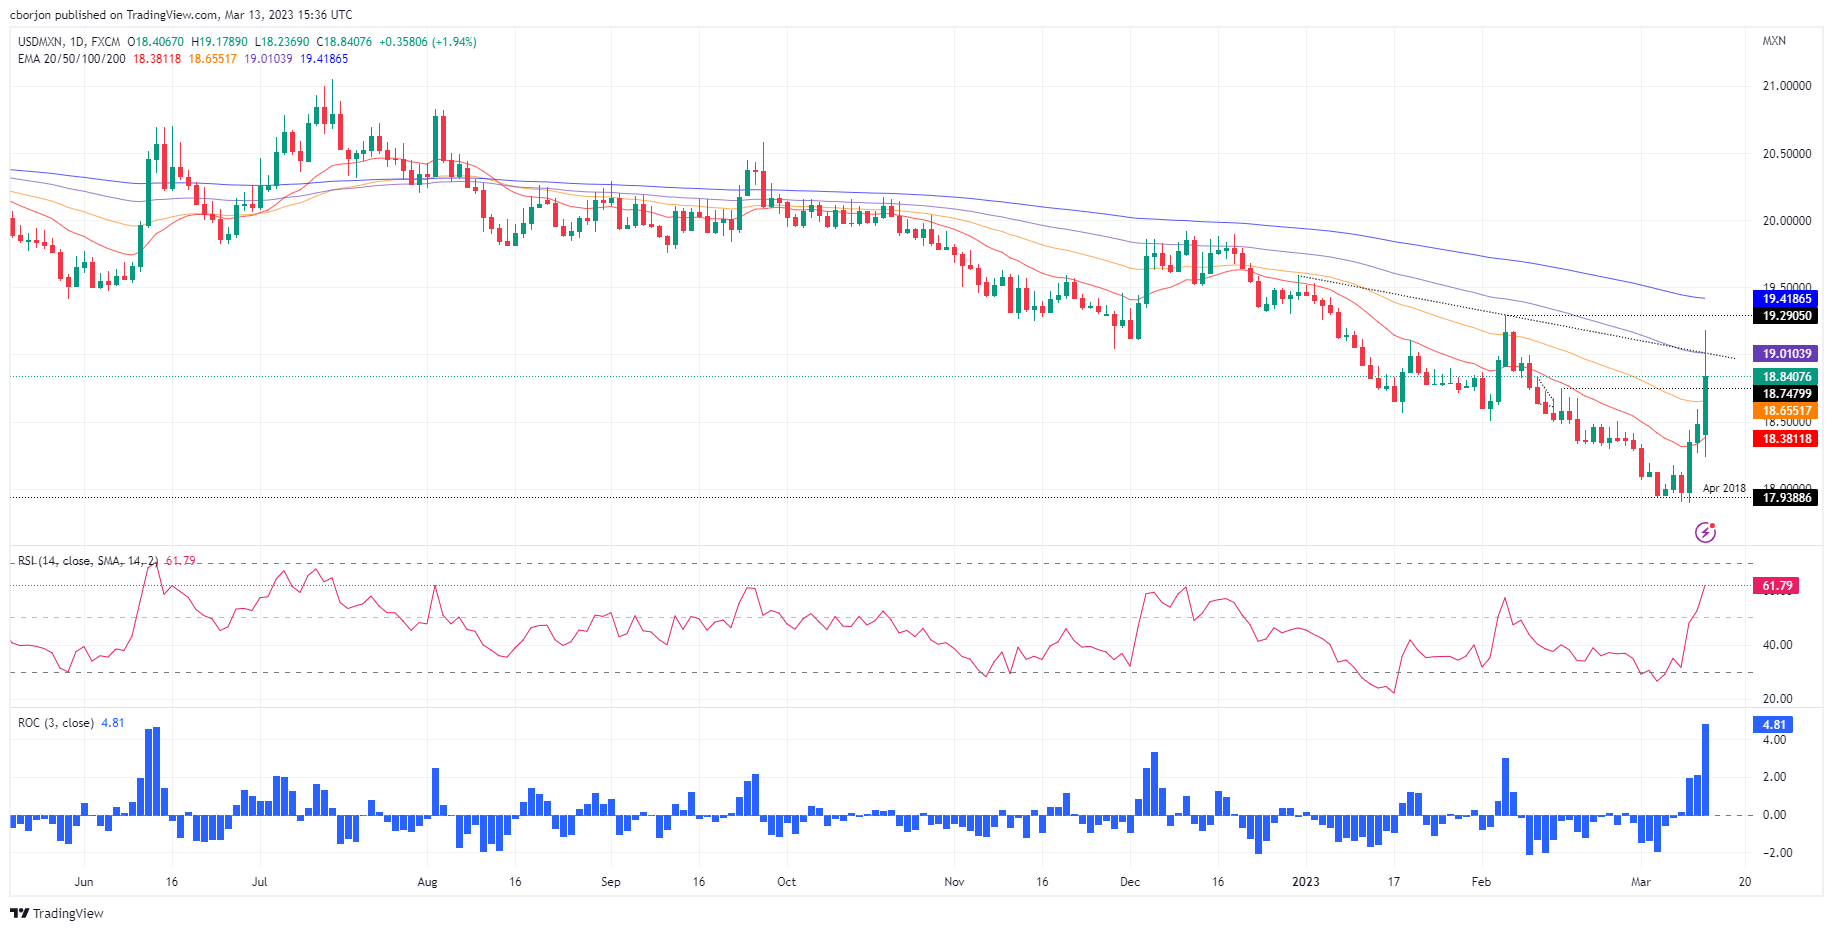
- The USD/MXN pair depreciates close to 2%, caused by the SVB crisis
- It reached a weekly maximum of $19.1789, a level not seen since February.
- USD/MXN Price Analysis:: A close for the week above $19.00 could generate an advance towards $19.50.
The Mexican Peso (MXN) depreciates the most against the US Dollar (USD) on fears of a possible contagion after the failure of the Silicon Valley Bank (SVB). Over the weekend, the state seized New York’s Signature Bank amidst the need to stabilize the financial system. At the time of writing, the USD/MXN is trading at 18.8246, above its opening price by 1.85%.
The crisis in regional banks in the US weaken the Mexican Peso
The domestic crisis in the banking sector in the United States (USD) caused a change in market sentiment. The winner is the precious metals segment, with Gold breaking the $1900 barrier. Wall Street turned positive, except for financials, which are losing as US Treasury bond yields plummet. US Federal Reserve (Fed) interest rate expectations lie at a 25 bps hike in March at a 64.2% change, and for no change, at 35.8%. Traders speculate that the current crisis in the Regional Bank segment could keep the Fed from tightening monetary conditions.
The US 2-year Treasury bond yield has dropped 50 bps, the most since the Global Financial Crisis (GFC) in 2008, barely above the 4% threshold. The 10-year note rate sits at 3.466%, down 23 bps.
The CME FedWatch Tool has the Federal Funds Rate (FFR) peaking at 4.75% - 5.00%, with traders expecting rate cuts in June, September, and December.
As a consequence, the USD/MXN appreciates in uncertain scenarios. Large capitals, fearing a crisis, move their assets out of emerging markets and return to the US Dollar or Gold.
Let’s remember that Jerome Powell, the head of the Federal Reserve, testified before the Senate’s finance committee and the House of Representatives. Powell said that interest rates could rise to higher levels than projected. He added a faster rate increase, depending on economic data.
Given this scenario, the USD/MXN broke important technical ceilings, such as the 50 and 100-day Moving Average, at 18.6546 and 19.010, respectively. However, it has fallen below $19.00, having that barrier as the first top.
USD/MXN Technical analysis
From a technical point of view, the USD/MXN could consolidate between the 50-day and 100-day Moving Averages (MM), at 18.6549 and 19.00, respectively. The current trend has turned neutral. However, a break above $19.00 would open the way to the February 6 high at 19.2905 units. With a break of this area, the USD/MXN pair could reach the 200-day Moving Average (MM), at 19.4187.
Momentum indicators such as the Relative Strength Index (RSI) have turned bullish above 50, while the Rate of Exchange (RoC) shows increased demand for dollars.
On the other hand, a drop below the 50-day MA at 18.6555 could cause a decline toward the 20-day MA at 18.3821 before testing the $18.00 barrier.
- US yields fall dramatically pushing DXY to the downside.
- Markets attempt to stabilize amid market jitters.
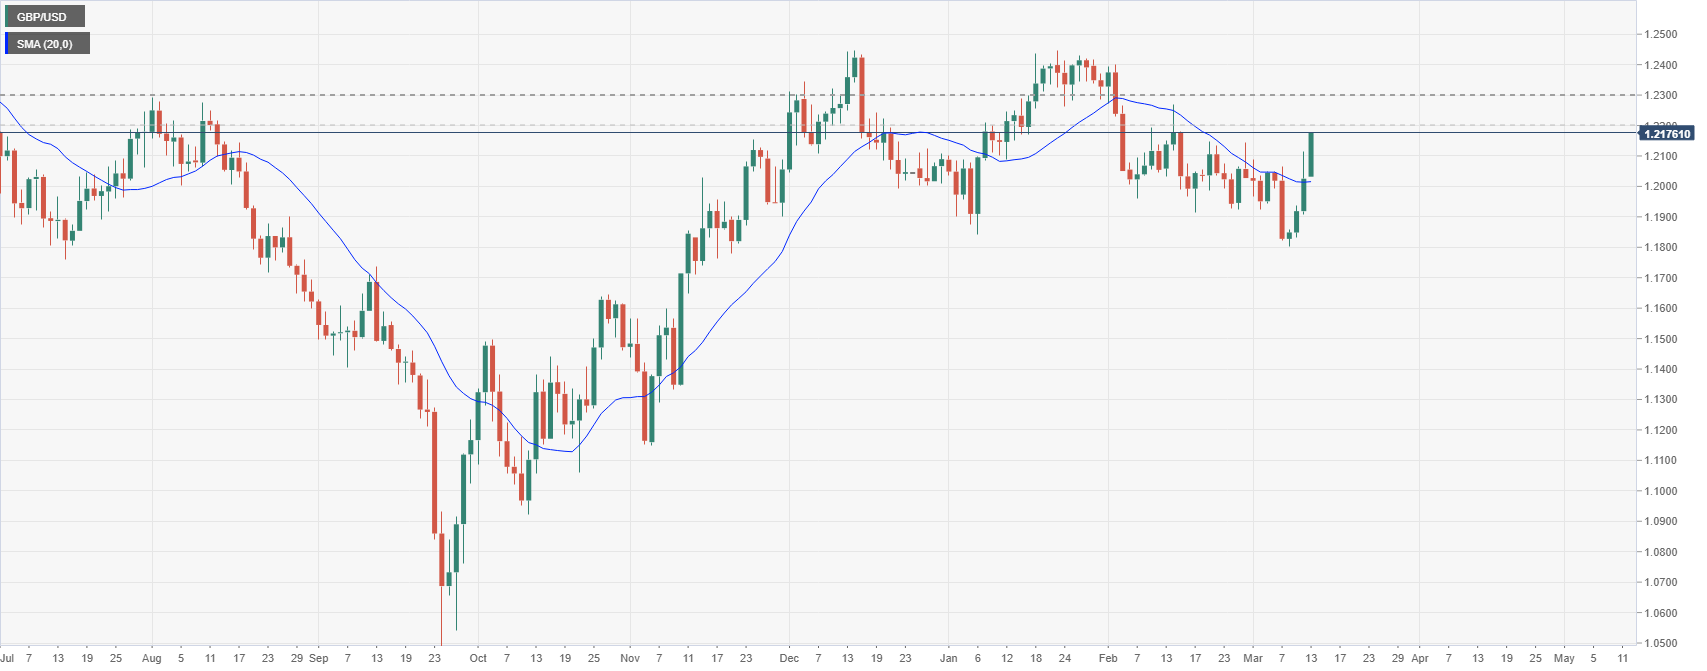
- GBP/USD up for the fourth day in a row, looking at 1.2200.
The GBP/USD broke above 1.2150, reaching the highest level since mid-February, boosted by a sharp decline of the US Dollar Index (DXY). A sharp drop in US yields occurs as investors shift their bets for a softer Federal Reserve, amid market concerns about the banking industry.
DXY slumps on a new scenario
The collapse of Silicon Valley Bank and its effect are driving markets. Major US indices are mixed on Monday, with the banking sector falling sharply. The Dow Jones is at four-month lows levels.
The ongoing situation has diminished the odds of a 50 basis points rate hike from the Federal Reserve next week and sent US yields sharply to the downside. On Tuesday, the US will release February’s Consumer Price Index, a key input, now being offset by recent developments. Before the SVB collapse, larger-than-expected inflation numbers would have cemented exceptions for a 50bps rate hike, but the case now is more complex with market participants projecting a softer Fed.
US yields are falling sharply at a speed not seen in years. The US 10-year was above 4% last week and on Monday bottomed at 3.42%. The slide in yields has weakened the US Dollar against it main European competitors. The DXY is down by almost 1% at the lowest in four weeks.
The ramifications of the banking crisis in the US crossed the Atlantic. In the UK, the government and the Bank of England facilitated a deal for HSBC o buy Silicon Valley Bank UK for 1 pound. On Tuesday, before US CPI, the UK will release employment numbers.
The GBP/USD is trading at monthly highs at 1.2176, with a strong bullish momentum. On the upside, the next strong resistance area is seen at 1.2200. The pair is retaking the 20-day Simple Moving Average (SMA). The 1.2100 zone and 1.2060 have become relevant support levels.
GBP/USD daily chart
Economists at Erste Group Research expect the EUR/USD pair to hover around 1.08 in the short term. In the medium term, the US Dollar is expected to weaken.
Dollar to weaken slowly in the medium term
“Varying economic data should continue to drive rapidly changing expectations for policy rates in both economies. The environment thus remains very uncertain. However, neither currency should become more attractive.”
“EUR/USD should thus remain in a volatile sideways movement around 1.08 for the time being.”
“In the medium term, we expect a slow weakening of the Dollar, as interest rates should start to fall here earlier than in the Eurozone.”
The Federal Reserve Bank of New York's monthly Survey of Consumer Expectations showed on Monday that the US consumers' one-year inflation expectation dropped to the lowest level since May 2021 at 4.2% in February, compared to 5% in January.
Further details of the publication showed that the three-year ahead expected inflation remained unchanged at 2.7% and the five-year ahead expected inflation edged higher to 2.6% from 2.5%.
Finally, the year-ahead expected earnings growth held steady at 3%.
Market reaction
The US Dollar stays on the back foot after this report and the US Dollar Index was last seen losing 1% on the day at 103.60.
The US Dollar has continued to weaken sharply. A big upside surprise in the US Consumer Price Index (CPI) report due out tomorrow is required to lift the greenback, economists at MUFG Bank report.
Another 25 bps hike next week
“On balance we believe the latest labour market developments favour another 25 bps hike rather than a larger 50 bps hike.”
“Market attention will now shift to the release of the latest US CPI report tomorrow. It would likely take a significant upside inflation surprise now to revitalize speculation over a larger 50 bps hike at next week’s FOMC meeting and trigger a US Dollar rebound.”
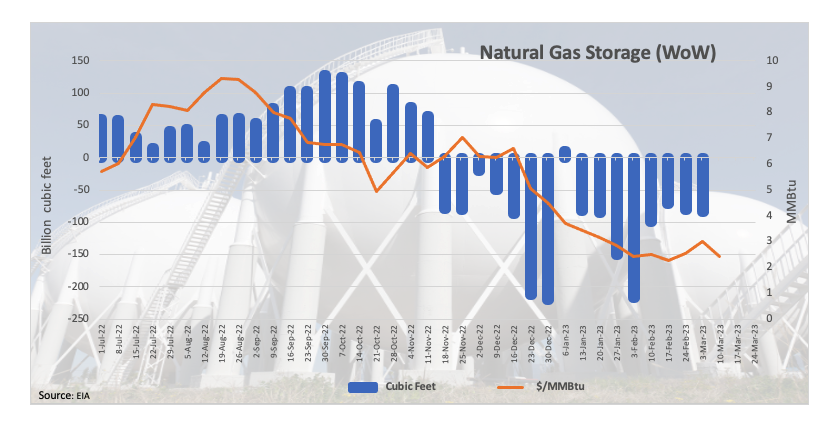
Prices of natural gas seem to have met some decent support in the $2.40 region per MMBtu and manage to leave behind three consecutive daily pullbacks at the beginning of the week.
The commodity gathers some traction on the back of colder days ahead in the US, although the broad-based outlook remains tilted to the negative side amidst the absence of a strong driver for the time being. On this, Friday’s figures in natural gas futures markets appear to support the underlying negative outlook for the commodity in the very near term at least.
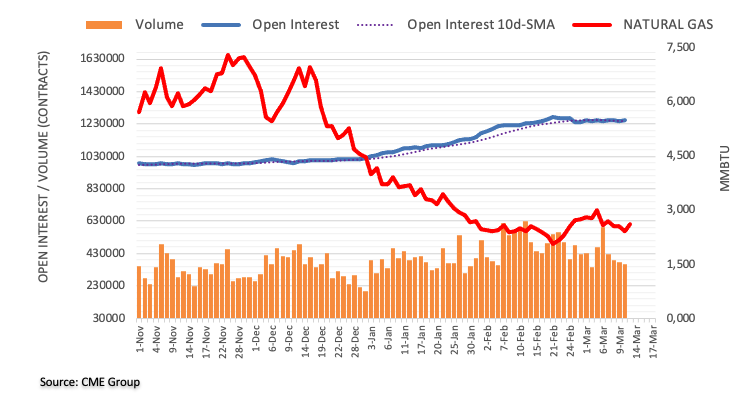
Against that, another test of the 2023 low in the sub-$2.00 region should not be ruled out, while the $3.00 mark continues to cap occasional bullish attempts for the time being. Above this region, natural gas should meet temporary resistance at the 55-day SMA at $3.145, just ahead of the Fibo retracement of the December-February drop at $3.182.
Later in the week, the EIA will release its weekly report on natural gas storage.
Natural Gas levels to watch
At the moment, Natural Gas prices are advancing 6.87% at $2.594 and faces the next up-barrier at $3.009 (monthly high March 3) seconded by $3.145 (55-day SMA) and finally $3.182 (Fibo retracement). On the downside, a break below $1.967 (2023 low February 22) would expose $1.795 (monthly low September 21 2020) and then $1.605 (monthly low July 20 2020).
Silver price has plunged 16% so far this year. Economists at ANZ Bank expect the precious metal to perform better by the end of the year.
Silver price action diverges from fundamentals
“Normally, Silver outperforms Gold in a rising price environment, suggesting Silver should do well in the later part of the year.”
“From a supply-demand perspective, the market is expected to remain undersupplied for this year.”
See – Gold Price Forecast: XAU/USD bullish momentum continues, eyes on next resistance at $1,960 – ANZ
- The upside momentum in EUR/USD picks up pace on Monday.
- Next on the upside comes the 1.0800 mark.
EUR/USD extends the buying interest to fresh multi-week highs north of 1.0700 the figure at the beginning of the week.
The continuation of the uptrend appears favoured for the time being. Against that, a convincing move above Monday’s peak at 1.0737 should open the door the wekly high at 1.0804 (February 14). Further up, there are no resistance levels of note until the 2023 high at 1.1032 (February 2).
Looking at the longer run, the constructive view remains unchanged while above the 200-day SMA, today at 1.0324.
EUR/USD daily chart
Senior Economist at UOB Group Alvin Liew reviews the latest BoJ monetary policy meeting.
Key Takeaways
“The Bank of Japan (BoJ) kept its policy measures unchanged at last Monetary Policy Meeting (MPM) helmed by exiting BoJ Governor Kuroda. The decision was unanimous, and the BoJ kept steadfastly to its easing stance. Post-BoJ announcement saw a jump of the USD/JPY above 136 while the Nikkei stock index fell.”
“BoJ Outlook – To Shift Or Not To Shift YCC Policy, That Will Now Be Under The New BoJ Governor Ueda: With Kuroda’s last MPM decision now out of the way, the attention will shift to Kazuo Ueda who is likely to win approval from the Upper House of the Diet today as the new BoJ Governor. While we see an exit from the YCC and negative interest rates is inevitable for Japan, the question is how Ueda will execute his plan. We believe Ueda will proceed at a gradual, well-telegraphed pace, and not a sharp and sudden reversal. We see it in two broad steps, 1) Protracted adjustment to its forward guidance on YCC and interest rates (Apr to Dec 2023) and 2) Scrapping of YCC and lifting of the negative policy rate in early 2024.”
“The next BoJ MPM on 27-28 Apr will be widely watched event given that it will be the first BoJ decision under Ueda and the outcome of the Shunto (annual wage negotiation) will be out by then, and it will include an updated Outlook Report (The Bank's View).”
EUR/USD edges back under the 1.07 level. Economists at Scotiabank expect the world’s most popular currency pair to sustain more losses on a break below the 1.0635 mark.
EUR reversal from the highs has been quite significant
“The EUR reversal from the highs has been quite significant and suggests a failure/rejection at the 55-Day Moving Average (1.0716).”
“EUR/USD losses may extend a little more on a break under 1.0635 intraday.”
See: EUR/USD set to extend its race higher toward the 1.0780/1.0800 area – ING
- DXY intensifies the decline and breaches 104.00 on Monday.
- The 55-day SMA near 103.50 should offer initial contention.
DXY extends the strong bearish momentum and breaks below the 104.00 support to record new multi-week lows.
In case sellers push harder, then the index should face a temporary support at the 55-day SMA at 103.51 prior to the weekly low at 102.58 (February 14).
In the meantime, while below the 200-day SMA at 106.62, the outlook for the greenback is expected to remain negative.
DXY daily chart
- Gold rally goes on, tests $1,900.
- Yellow metal rises 5% in three trading days.
- US Yields hit lowest levels in months amid risk aversion.
Gold price is up by more than 2% on Monday, adding to last Friday’s gains boosted by a rally in US Treasury bonds as investors fly to safety and pare Federal Reserve rate hike bets.
XAU/USD hit $1,900 for the first time since February 3. It then pulled back modestly to $1,895. The rally in gold has been dramatic, rising more than $90 since Thursday. Above $1,900 the next resistance area is seen around $1,920.
The key driver of the yellow metal rally is the sharp decline in US yields. The US 10-year has fallen from above 4.0% to 3.41%, approaching year-to-day lows; the 2-year was above 5.0% on Wednesday (highest since 2008) and a few moments ago reached the lowest intraday level since October at 4.00%.
The collapse of the Silicon Valley Bank triggered concerns about the banking sector, weighing on Fed rate hike expectations. Investors are looking at the impact of the crisis that is offsetting incoming economic data. On Tuesday, the US February Consumer Price Index is due and it was supposed to be critical for monetary expectations. After the SVB collapse, markets are pricing in a softer Fed.
Technical levels
- XAG/USD starts the week with a 5.24% intraday gain, touching a high of $21.61.
- Technical indicators, such as the RSI(14) and daily 20-SMA, suggest a potential bullish outlook for silver.
- US CPI ex Food and Energy data (Feb) is the critical economic event to be followed on Tuesday.
Daily price movements:
XAG/USD (Silver) opens the day at $20.54, with the precious metal experiencing an intraday gain of 5.24% to trade at $21.61 at the time of press. Silver hits an intraday high of $21.61, indicating a surge in bullish market sentiment.
At the start of the new week, the US Dollar faces significant selling pressure due to market reevaluation of the Federal Reserve’s (Fed) future policy actions after the recent collapse of Silicon Valley Bank (SVB). This also acts as a booster for Silver to climb higher on the day.
Key economic events:
Markets will be monitoring Tuesday’s US Consumer Price Index ex Food & Energy (MoM)(Feb) data to understand better the possible Fed actions on the speed of rate hikes decisions which will affect the US Dollar’s strength.
Technical view:
Technical indicators suggest a potential bullish outlook for XAG/USD silver in the short term. The RSI(14) is currently at 52.93, indicating bullish momentum. The daily 20-SMA is $21.03, indicating that the current price may trend higher. Daily pivot resistance levels for Silver are $20.91, $21.30, and $21.81, while support levels stand at $20.02, $19.52, and $19.13. However, the daily 50-SMA is $22.40, indicating a long-term bearish trend.
Technically, bullish momentum is continuing after breaking the range of $1,845-1,850 on Friday. Gold needs to trade high to continue this momentum, analysts at ANZ Bank report.
Cautious on false breakout
“Gold price broke the key resistance of $1,845 following rise in US unemployment number and collapse of Silicon Valley Bank on Friday. This suggests that bullish momentum is likely to continue, however, one should be cautious of a false breakout.”
“To continue the bullish momentum, Gold needs to trade above $1850 level. The next resistance is at $1,960.”
“On the downside, if XAU/USD comes back below $1,845 range, then a consolidation looks possible until it breaks the key support of $1,810. A break of this could trigger a technical sell-off, dragging prices to a low of $1,750. We see this level setting the lower bound for this year’s price range.”
US President Joe Biden said on Monday that no losses will be borne by US taxpayers following the collapse of Silicon Valley Bank and Signature Bank.
Biden further noted that investors in those banks will not be protected and reminded that "no one is above the law."
Biden also explained that the quick administration action should give Americans confidence that the US banking system is safe and added that he will ask Congress and regulators to strengthen bank rules.
Market reaction
These comments don't seem to be having a significant impact on financial markets. As of writing, the benchmark 10-year US Treasury bond yield was down 6% on the day at 3.48% and the US Dollar Index was losing 0.6% at 104.00.
SVB (Silicon Valley Bank) rattled the US financial sector and global markets last week. Economists at HSBC analyze investment implications.
USD downside to occur when the economic downturn is further advance
“In the short term, we expect continued volatility in US equities and credit and hence we stress our focus on quality. We think the backstop provided by the Fed for banks should be helpful to restore public confidence in the banking system. While tech VC may face more headwinds than before, we maintain a neutral view on IT and focus on established cash-generative industry leaders. As for financials, some banks may raise deposit rates, which could weigh on profitability but net interest margins are very healthy, causing us to keep a neutral view on the sector.”
“For fixed income investors, the increased level of uncertainty may direct the Fed to a 0.25% hike (as per our view) rather than 0.5% in March. The volatility and increased unemployment have moved the markets’ view of the peak rate from 5.69% to 5.1%, close to our 5.25%-5.5% forecast. We continue to overweight global investment grade and stay invested in senior and Basel III Tier 2 financials bonds.”
“The US Dollar should continue to consolidate. The fall in rate expectations weighed on USD last week, but on the other hand, the USD benefits from a safe haven bid. We expect further USD downside to occur when the economic downturn is further advanced and global risk appetite bounces.”
The US Bureau of Labor Statistics (BLS) will release the most important inflation measure, the US Consumer Price Index (CPI) figures, on Tuesday, March 14 at 12:30 GMT. As we get closer to the release time, here are the forecasts by the economists and researchers of 10 major banks regarding the upcoming United States inflation print for the month of February.
The annual inflation is expected to decline to 6.0% from 6.4% in January, while the Core CPI, which excludes volatile food and energy prices, is seen at 5.5% from 5.6%. On a monthly basis, the CPI is forecast at 0.4%, while the Core CPI is also expected at 0.4%.
ANZ
“We expect US core CPI inflation to increase by 0.4% MoM and headline CPI to rise by 0.5% in February.”
Commerzbank
“In February, although the headline inflation rate is likely to have fallen from 6.4% to 6.1%, the core rate probably fell only slightly from 5.6% to 5.5% and thus remains far too high. At 0.5%, the MoM rate of the core index is likely to be above average again. From the Fed's point of view, such a report would probably not provide convincing enough support for the ‘disinflation process’ identified by Fed Chairman Powell and would therefore argue in favor of stronger interest rate hikes again.”
Credit Suisse
“We expect core CPI inflation to remain steady at 0.4% MoM in February, causing the YoY reading to tick down to 5.5%. Energy and food prices are likely to moderate, with headline inflation also coming in at 0.4% MoM. A reading in-line with our expectations would be uncomfortably high for the Fed, but still consistent with gradual disinflation this year.”
Deutsche Bank
“We think the headline CPI and core CPI will both round to 0.4% MoM which is where the consensus is. This will translate to headline dropping 0.4pp to 6% YoY and core down a tenth to 5.5% YoY.”
RBC Economics
“We expect Tuesday’s report to show the YoY measure falling to 5.9% in February compared to 6.4% January (which was the lowest reading since October 2021). Much of that easing has come from lower energy prices and signs that food price growth is past its peak. Inflation pressures across other goods and services has also been edging lower, though stickier than expected in recent months. We expect the February numbers to look better with ‘core’ inflation (which excludes food and energy products) dipping to 5.4% from 5.6% in January. Robust US labour market data indicates strong economic momentum at the start of 2023, and stickier inflation suggests it may take longer to get back to the 2% target. This is bolstering the case for further interest rate hikes from the Fed.”
NBF
“The energy component may have had only a limited effect on the headline index, with prices remaining more or less flat in this segment in the month. Expected gains for shelter, used vehicles and airline fares could still result in a 0.4% monthly increase in headline prices. The core index may have seen a similar rise, which would translate into a one-tenth drop in the annual rate to 5.5%.”
TDS
“Core prices likely gained momentum in February with the index rising a strong 0.5% MoM, as we look for the recent large relief from goods deflation to start normalizing. Shelter inflation likely remained the key wildcard, while slowing gasoline and food prices will likely dent non-core CPI inflation. Our MoM forecasts imply 6.1%/5.5% YoY for total/core prices.”
CIBC
“A further increase in prices at the pump and continued pressure in core categories suggest that prices rose by an uncomfortably fast 0.4% in February. Looking at core (ex. food and energy) categories, shelter prices are set to peak imminently as the typical lags with new leases that are resetting at lower rates kick in, but continued pressure in core services outside of shelter, in line with the tight labor market, will keep the Fed on a tightening path. Moreover, the deflation in core goods prices appears to have ended, as supply chains have normalized, and used car prices as measured by industry gauges climbed in February. A consensus-matching core CPI reading will likely be good enough to keep the Fed on track for a 25 bps hike this month.”
Wells Fargo
“We look for another monthly increase of 0.4% in the overall CPI in February, which would put the YoY rate at 6.0%. We still see inflation set to grind lower, but the process is likely to be bumpy and take time. Despite some directional improvement over the past couple of quarters, prices are still growing well-above the Fed's 2% target, and the tight labor market suggests that there are still inflationary pressures that could forestall a full return to 2% inflation.”
CitiBank
“We expect a softer 0.4% MoM increase in headline CPI due to a retracement of utility gas prices in line with falling natural gas prices. Details should reveal continued strength in key services prices, although starting with February data could be the start of an expected slowing in shelter prices which comprise close to 40% of core CPI. Other non-shelter services should be strong overall, although with a continued drag from the medical insurance component in CPI which notably will not be included in PCE inflation. Prices for medical services themselves, however should remain strong, as should prices for recreation services and transportation services, including a 1.5% MoM bounce back in airfares. Rather than services which should remain consistently strong, the pick-up in core CPI relative to the previous two months should come from goods prices. Most notably, we expect recently rising wholesale measures of used car prices to start to feed through to stronger car prices in CPI.”
CAD slips from highs versus soft USD. Economists at Scotiabank expect the USD/CAD pair to challenge 1.37 if it manages to stay below the 1.38 level.
Persistent strength above 1.38 will likely prompt a retest of 1.3850/60
“Price action Friday strongly suggested that the broader USD uptrend in place over the past month or so may be stalling. But the intraday rebound in the USD from session lows – so far – looks quite constructive on the short-term charts and underlying trend momentum remains USD-bullish.”
“If USD/CAD gains are capped around 1.38 intraday, the CAD may have a shot at pushing back towards 1.37.”
“Persistent USD strength above the figure will likely prompt a retest of 1.3850/60.”
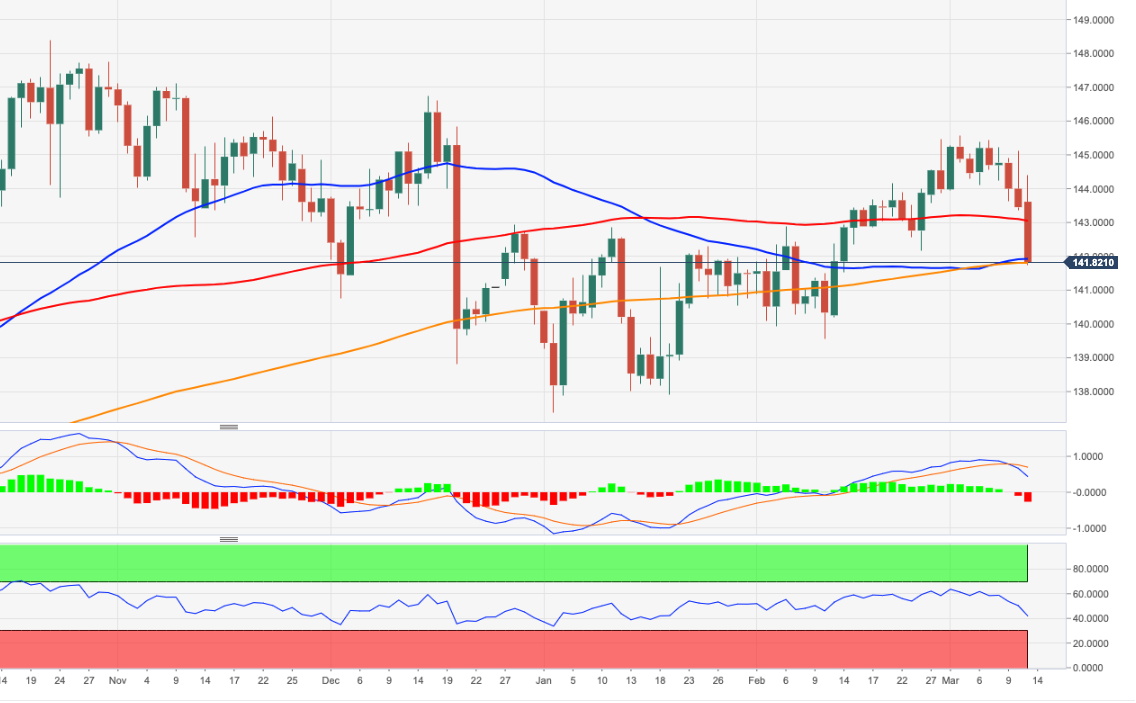
- EUR/JPY falls off the cliff and retests the 200-day SMA near 141.80.
- The next support level emerges at the February low in the mid-139.00s.
EUR/JPY debilitates further and breaks below the 142.00 to print new 4-week lows near 141.80 at the beginning of the week.
EUR/JPY breaks below the consolidative range and challenges the key 200-day SMA, today at 141.77. A sustainable breach of the latter should open the door to extra weakness to, initially, the February low at 139.54 (February 10).
Below the 200-day SMA the outlook for the cross is expected to shift to negative.
EUR/JPY daily chart
- USD/JPY opens the week on a bearish note, with the currency pair trading at 133.50, down by 1.10% on the day.
- Despite hitting an intraday high of 134.99, USD/JPY struggles to gain as bearish market sentiment prevails.
- US CPI and BoJ Monetary Meeting Minutes are critical events to follow on Tuesday.
Intraday price movements:
USD/JPY opens the day of a new week at 134.97, dropping to an intraday low of 132.96 before hitting an intraday high of 134.99. The pair continues to struggle to gain amid bearish market sentiment, trading at 133.50 above its 50-day SMA of 132.41, down by 1.10% on the day at the press time.
There is no critical economic event on the day that may affect the price of USD/JPY on Monday, the week's first and relatively silent day.
Markets will be closely monitoring the Consumer Price Index ex Food & Energy (MoM)(Feb) released by the US Department of Labor Statistics (Tue, Mar 14th, 2023 12:30 GMT) and Bank of Japan’s (BoJ) Monetary Meeting Minutes (Tue, Mar 14th, 2023 23:50 GMT).
Technical View:
Technical indicators for USD/JPY pair show a bearish bias in the short-term outlook. The daily chart indicates that the Daily 38.2% Fibonacci level at 135.22 remains critical support, while the Daily 61.8% Fibonacci level at 135.89 acts as critical resistance. The RSI(14), currently at 42.121, confirms the bearish sentiment for the currency pair. The daily pivot support levels for USD/JPY are 133.65, 132.44, and 130.77, while the resistance levels are 136.53, 138.20, and 139.41.
US President Joe Biden will deliver remarks about the banking system,, which is on the spotlight following the collapse of Silicon Valley Bank and Signature Bank. Biden is set to speak at 13:00 GMT about how to “maintain a resilient banking system”.
The crisis with SVB triggered fear and panic across financial markets. The Dow Jones is at the lowest level in months, gold and silver are sharply higher as market participants priced in a softer Fed.
USD/IDR is forecast to trade within the 15,250-15,450 range for the time being, according to Markets Strategist Quek Ser Leang at UOB Group.
Key Quotes
“We expected USD/IDR to trade sideways between 15,200 and 15,350 last week. However, USD/IDR to rose to a high of 14,475 on Friday. The advance, was however short-lived as USD/IDR fell sharply upon opening today. The decline amid overbought conditions suggests USD/IDR is unlikely to advance further.”
“This week, USD/IDR is more likely to consolidate between 15,250 and 15,450.”
GBP/USD is capped around recent range highs. Economists at Scotiabank note that Intraday price action looks weak for the British Pound.
Sterling to move in line with the broader market tone for the next few days
“Sterling is likely to move in line with the broader market tone for the next few days.”
“GBP/USD gains since late last week managed to retest recent peaks in the low/mid-1.21s (55-Day Moving Average at 1.2121 today). Intraday price action looks weak for the GBP, suggesting another failure/rejection around the recent range highs.”
“GBP support is 1.2020 ahead of a return to the low/ mid-1.19s.”
The EUR has regained upward momentum in recent weeks. Economists at MUFG Bank expect higher Eurozone rates, diminished recession risk and China reopening to provid more support for the shared currency.
Downside risks to EUR limited from ECB policy update
“The EUR should continue to trade at stronger levels in the near-term supported by: i) hawkish expectations for further ECB policy tightening, ii) the diminished risk of a sharper slowdown in the Eurozone economies as natural gas prices continue to fall, and ii) China reopening optimism.”
“We see limited risk of a dovish policy surprise from the ECB in the week ahead that could trigger a significant EUR sell-off given the recent run of stronger Eurozone activity and core inflation data.”
In the view of Markets Strategist Quek Ser Leang at UOB Group, USD/MYR could have printed a near-term top near 4.5300.
Key Quotes
“We highlighted last Monday (06 Mar, spot at 4.4670) that ‘overbought conditions combined with waning upward momentum suggest USD/MYR is unlikely to advance further’ and we expected USD/MYR to consolidate between 4.4500 and 4.4900. Our view of consolidation was incorrect as USD/MYR rose to 4.5290 before closing at 4.5180 on Friday (+1.01%).”
“USD/MYR fell sharply upon opening today, and this combined with rapidly waning upward momentum suggests 4.5290 is a short-term top. However, it is too early to expect a major reversal. This week, USD/MYR is likely to edge lower but any decline is viewed a lower trading range of 4.4500/4.5150.”
Economists at HSBC think both AUD and CAD are likely to consolidate in the near term, before strengthening over the longer term.
AUD and CAD: Consolidate before strengthening
“We think that the AUD and CAD are likely to move mostly sideways over the near term; with the focus remaining on US data, and how it could shape the 25 bps vs 50 bps debate for the 21-22 March Federal Open Markets Committee (FOMC) meeting.”
“Over the longer term when some of the uncertainties around the Fed, the US economy’s landing, and China’s recovery subside, the AUD and CAD are likely to strengthen against the USD.”
Economists at ING asses the Silicon Valley Bank fallout.So far the system looks fine, but it needs to be treated with caution ahead, just in case.
The system is under scrutiny, but fine so far
“We need to accept that some banks will come under pressure at this stage of the interest rate cycle. The Fed has hiked from zero to near 5%. Moreover, starting from zero rates means a bigger rate sensitivity to hikes (think duration).”
“If some balance sheets get eroded by a ratcheting down in market valuations, and become an eyesore, before you know it there are trust issues to deal with. Big banks are less affected; they have to meet tougher hurdles to begin with. But there could well be further stress in the smaller bank sector.”
“This could and indeed probably should all blow over. But we need to also let a bit of time pass before we can be sure.”
Ulrich Leuchtmann, Head of FX and Commodity Research, highlights how quickly the US Dollar could lose its safe haven status. AS ECB expectations are being revised to the downside, but to a much lesser extent than the Fed's, the Euro is set to profit.
ECB policy seems much cleverer
“It is much less likely this morning that the Fed will add another 50 bps – seeing that the policy implemented so far has already caused considerable stress.”
“So far, I have found nobody who projects a rate cut, but I expect the first projections of this nature during the day if nervousness does not ease immediately.”
“And not just that the Fed expectations are now having to be massively revised to the downside. Suddenly the much more cautious ECB policy seems much cleverer. Because it leaves more time for market participants to adjust.”
“That is how quickly the Dollar can lose its status as a safe haven, which it enjoyed against the Euro recently!”
- XAU/USD is moving toward the $1,900 mark, amid falling US Treasury 2-Year yields.
- Gold price bulls are charging in for the last three trading days.
- The market is heading into the US CPI release with caution.
XAU/USD is surging higher in the last four days and is up around 1% on the day. Falling US Treasury yields have fueled the Gold price higher as the market is scaling out for any 50 bps rate hike possibility for the March FOMC Meeting.
XAU/USD benefited amid the softer US Dollar earlier in the Asian session due to the Federal Reserve (Fed) and the US Treasury intervening in the banking system to rescue the Silicon Valley Bank (SVB) and Signature Bank.
Given the fact that surging borrowing cost across and United States (US) is denting financial health, as a result, the market has encountered the SVB fallout.
XAU/USD is showing some strong upward momentum in the wake of falling yield since Gold price is inversely correlated with US Treasury yields – as Gold is sensitive to the shorter end of the yield curve.
A heavy fall in the shorter end of the yield curve occurred last Friday after the Nonfarm Payrolls (NFP) release. The added jobs number was higher than expected while the Unemployment Rate rose to 3.8%. The market interpretation of Friday’s NFP is to look cautious and flurry. The fact that yields are heading lower across the board, especially the shorter end of the US Treasury yield curve, is putting heavy pressure on the US Dollar as well as equity complexes across the globe.
On the data docket, the United States economic calendar will feature the Consumer Price Index (CPI) data on Tuesday, but it looks like the market is heading into the upcoming CPI event with red eyes. We are already in the Fed’s blackout period, therefore market dynamics will likely remain fragile until the 22 March FOMC Meeting.
Gold price key levels to watch
Gold price is looking to break above March’s high at the $1,894 mark. A convincing break above will lead the price toward the $1,900 key psychological mark. Any downside will likely be capped around Monday’s low at $1,866.
The dramatic re-pricing of the Fed curve and the bullish disinversion of the US curve is a Dollar negative, economists at ING report.
Swiss Franc and Japanese Yen to stay bid
“The first major US financial crisis since 2008 has seen a significant bullish disinversion of the US yield curve – which is Dollar bearish.”
“We have been arguing for some that time that bullish disinversion would be required to send the Dollar lower – but had felt that it would be US disinflation or weak activity data – not a financial crisis – which would be the trigger.”
“Expect investors to remain wary this week and continue to prefer the CHF and JPY over the Dollar. In a way, we are going back to former periods of risk aversion – when selling the Dollar and buying US two-year Treasury notes was the key strategy in a crisis.”
USD/CNY largely fluctuated between 6.86 and 6.98 in the past three weeks. According to economists at Commerzbank, the Yuan still enjoys upside potential.
Government reshuffle is completed
“The government reshuffle during the annual session of National People’s Congress (NPC) marked the end of the latest five-year political succession. It is widely believed that under the new leadership line-up, the Communist Party will have a tighter grip on the government.”
“An extensive restructuring plan was also unveiled during the NPC meeting, as the government undergoes a reorganization every five years. A highly centralized system may increase top-down efficiency. But it also increases the risk of making severe policy mistakes.”
“Beyond the near term, there is still room for CNY to strengthen modestly against the Dollar should future data show robust post-reopening recovery which will boost market confidence.”
Markets Strategist Quek Ser Leang at UOB Group notes USD/THB could grind lower in the near term.
Key Quotes
“Last Monday (13 Feb, spot at 34.60 ), we highlighted that ‘35.39 could be a short-term’ and we held the view ‘the pullback from the high has scope to extend but any decline is viewed as a lower trading range of 34.30/34.90’. However, USD/THB traded between 34.39 and 35.19 before closing at 34.83 (+0.99%).”
“USD/THB started this week on a soft note and the underlying tone appears soft and we see room for USD/THB to edge below 34.30. The next support level at 34.00 is unlikely to come under threat. On the upside, a breach of 35.00 (minor resistance is at 34.75) would indicate that the current mild downward pressure has eased.”
- EUR/USD surpasses the 1.0700 mark, or 4-week highs.
- The dollar remains well on the defensive post-Payrolls.
- The next risk event will be the US CPI due on Tuesday.
The optimism around the European currency remains well in place at the beginning of the week and lifts EUR/USD back above the 1.0700 hurdle, or new 4-week tops.
EUR/USD now looks at US CPPI, ECB
EUR/USD advances for the third session in a row and moves north of the 1.0700 barrier, where some initial resistance seems to have emerged so far.
The continuation of the pair’s rebound comes in response to the persistent sell-off in the greenback, which was particularly exacerbated following the mixed results from the February Payrolls published last Friday.
By the same token, the USD Index (DXY) starts the week well in the negative territory and navigates multi-week lows pari passu with investors repricing of a 25 bps rate hike by the Fed at the March 22 gathering, while some speculation around a no rate at all seems to have also kicked in.
Supporting the view of a stronger EUR/USD, open interest increased in the last three sessions, while volume retreated to more “normal” levels following the post-Powell spike on March 7.
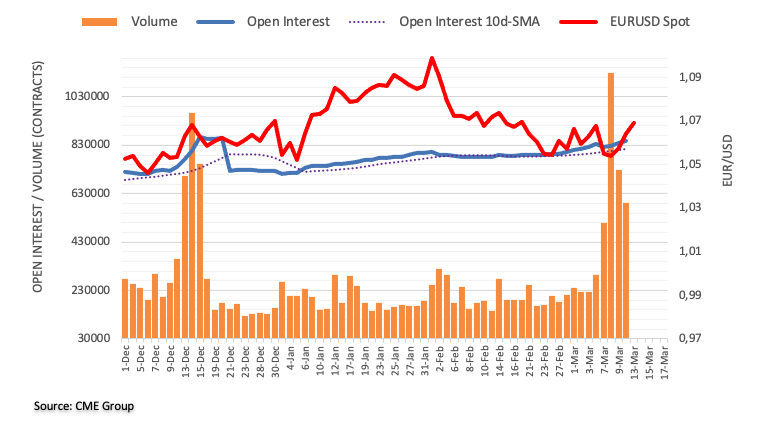
No data releases in the euro area should leave Tuesday’s release of US CPI for the month of February as the salient event in the first half of the week. Moving forward, the ECB meeting on March 16 should see the central bank hiking the policy rate by 50 bps.
What to look for around EUR
EUR/USD manages to reclaim the area above 1.0700 the figure at the beginning of the week, always amidst the persevering retracement in the greenback.
In the meantime, price action around the European currency should continue to closely follow dollar dynamics, as well as the potential next moves from the ECB past the March meeting, when the bank has already anticipated another 50 bps rate hike.
Key events in the euro area this week: Eurogroup Meeting (Monday) – ECOFIN Meeting (Tuesday) – EMU Industrial Production (Wednesday) – ECB Interest Rate decision, ECB Lagarde (Thursday) – EMU Final Inflation Rate (Friday).
Eminent issues on the back boiler: Continuation of the ECB hiking cycle amidst dwindling bets for a recession in the region and still elevated inflation. Impact of the Russia-Ukraine war on the growth prospects and inflation outlook in the region. Risks of inflation becoming entrenched.
EUR/USD levels to watch
So far, the pair is advancing 0.33% at 1.0673 and the breakout of 1.0737 (monthly high March 13) would target 1.0804 (weekly high February 14) en route to 1.1032 (2023 high February 2). On the downside, the initial support comes at 1.0524 (monthly low March 8) seconded by 1.0481 (2023 low January 6) and finally 1.0323 (200-day SMA).
Sterling preserves its bullish momentum. However, economists at ING would not chase GBP/USD over 1.22.
EUR/GBP could easily retrace back up to 0.8900
“As in the US, depositors in the UK are being made whole and the government is looking to address the working capital needs of those exposed.”
“The market still expects the Bank of England to push ahead with a 25 bps hike on 23 March. This still may be at risk of being priced out, given the BoE was not far away from a pause anyway.”
“We could easily see EUR/GBP retracing back up to 0.8900, while we would not chase GBP/USD over 1.22.”
In the view of Markets Strategist Quek Ser Leang and Senior FX Strategist Peter Chia, USD/CNH is expected to keep the 6.8500-6.9500 range in the next few weeks.
Key Quotes
24-hour view: “Our view for USD consolidate last Friday was incorrect as it plunged to a low of 6.9040 in NY trade. While USD could weaken further, oversold conditions suggest a sustained drop below 6.8700 is unlikely (the next support at 6.8500 is unlikely to come under threat). On the upside, a breach of 6.9500 (minor resistance is at 6.9380) would indicate that the current downward pressure has eased.”
Next 1-3 weeks: “We highlighted last Tuesday (07 Mar, spot at 6.955) that USD ‘is likely to trade with an upward bias but any advance is likely to encounter solid resistance at 7.0000’. After USD rose to 6.9960, we indicated last Wednesday (08 Mar, spot at 6.9880) that while the outlook for USD is still positive, it has to break and stay above 7.0000 before further advance to 7.0200 is unlikely. USD dropped sharply on Friday and took out our ‘strong support’ level of 6.9140. The breach of the ‘strong support’ indicates that USD is unlikely to advance further. The outlook is mixed and for the time being, we expect USD to trade in a broad range of 6.8500/6.9500.”
Market focus remains on the collapse of Silicon Valley Bank (SVB) and the repercussions for the wider US banking system. Economists at Commerzbank expect the US Dollar to suffer
Has Fed monetary policy failed?
“At the end of last week, a medium-sized Californian bank had to close after the losses that in the end were at least to some extent down to rising interest rates and yields, caused a bank-run. On Sunday a smaller bank in New York also went under.”
“The FDIC put out a statement yesterday confirming that all customers of the two banks concerned would receive their deposits back. Sic! The Fed too reacted immediately: it activated the ‘Bank Term Funding Program’ and the discount window that has been thrown wide open. Of course, it is far too early to judge whether all that is sufficient, whether the calm will return today or whether the contagion effects will ripple through the financial system.”
“Thanks to the Fed swap lines, the Dollar supply can be guaranteed via national central banks if necessary. In the midst of such a situation all projections have to be treated with some caution, but I guess that there are few market participants who want to fill up with Dollars now for fear of a renewed USD shortage. That leaves USD-negative effects.”
“You can look at it this way: the fact that these banks failed is the result of rapidly rising interest rates and yields, i.e. the Fed’s monetary policy. Of course, many will tell you a different story. That it was due to ruthless bankers again.”
EUR/USD reached its highest level in a month above 1.0700. In the view of economists at ING, the pair is biased to the 1.0780/1.0800 zone.
Spreads narrow markedly in favour of EUR/USD
“The dramatic re-pricing of the Fed policy curve has seen two-year EUR:USD swap rate differentials narrow inside 100 bps – the narrowest since October 2021. This is EUR/USD positive.”
“Unless there is a massive rally in US banking stocks today which suggested that US authorities had been incredibly successful in putting the genie of US banking sector risk back in the bottle, we would say EUR/USD is biased to the 1.0780/1.0800 area.”
In a joint statement from the UK Treasury and the Bank of England (BOE), the UK Finance Minister, Jeremy Hunt, said on Monday that the “deposits will be protected, with no taxpayer support.”
The UK authorities confirmed that HSBC bank agreed to rescue the Silicon Valley Bank’s (SVB) UK arm.
Additional takeaways
"The announcement supersedes statement that intended to mark SVB UK as insolvent."
"No other UK banks are directly materially affected by these actions."
The Turkish Lira is deceptively stable on a day-by-day basis. But, the slow and steady depreciation trend very much persists in the background, Tatha Ghose, FX Analyst at Commerzbank, reports.
Slow, creeping Lira depreciation takes its toll
“As Lira weakness has persisted despite the recent ‘photo ops’ of CBT receiving $5 bn deposit from the Saudi government, fresh tightening of restrictions were deemed necessary. CBT issued guidance to all banks last week to widen their spreads on retail Dollar purchases which tantamounts to some ad hoc price control.”
“Weekly regulator data showed that Turkish banks are running a net deficit FX position amounting to 2.1% (of equity) for state banks and 1.3% deficit for the sector, overall. In other words, they will look to buy FX at some point.”
“An ad hoc price control has little potential to stop the relentless depreciation trend in the background, let alone address any underlying economic imbalance.”
Considering advanced prints from CME Group for natural gas futures markets, open interest increased by around 2.8K contracts after two consecutive daily pullbacks on Friday. On the other hand, volume shrank for the fourth straight session, this time by around 11.2K contracts.
Natural Gas: Another visit to $2.00 should not be ruled out
Friday’s third consecutive drop in prices of the natural gas was accompanied by rising open interest, which is indicative that further weakness could be in store for the commodity in the very near term. Against that, a potential revisit to the $2.00 region per MMBtu in the near term should not be disregarded just yet.
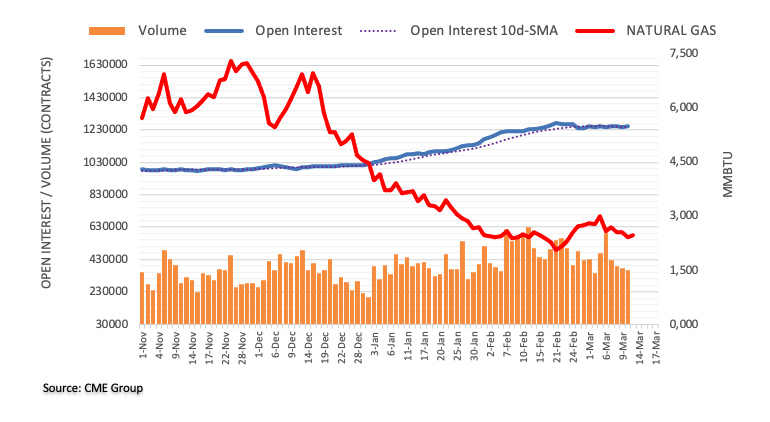
Here is what you need to know on Monday, March 13:
The US Dollar started the new week under heavy selling pressure with markets reassessing the next Federal Reserve policy action following the collapse of Silicon Valley Bank (SVB). The benchmark 10-year US Treasury bond yield is down 0.7% below 3.7% following Friday's 6% decline and the US Dollar Index stays deep in negative territory at around 104.00 early Monday. There will not be any high-tier macroeconomic data releases featured in the economic calendar on Monday.
As the Fed raised interest rates, the value of long-term bonds that were collected by SVB during the ultra-low Fed interest rate regime continued to decline. With start-ups starting to draw down funds held by SVB due to higher borrowing costs, the bank faced a capital crisis and announced that it will be selling more than $2 billion worth of new shares to solve the liquidity crunch on Wednesday. This decision caused companies and depositors to rush to withdraw their money from the bank, leading to the collapse of SVB by Friday.
Over the weekend, the Federal Deposit Insurance Corporation (FDIC) took control of the New York-based Signature Bank. Meanwhile, US authorities launched emergency measures on Sunday to avoid collateral damage in the banking system. Regulators assured customers that they will have access to all their deposits starting Monday. Moreover, the Fed introduced a new facility that will provide loans up to one-year for institutions that were impacted by the failure of SVB.
According to CME Group FedWatch Tool, markets are currently pricing in a 96% probability of a 25 basis points rate hike at the next FOMC meeting. Earlier in the day, "in light of recent stress in the banking system, we no longer expect the FOMC to deliver a rate hike at its March 22 meeting with considerable uncertainty about the path beyond March," Goldman Sachs said.
EUR/USD extended its rally early Monday and reached its highest level in a month above 1.0700. As of writing, the pair was up 0.75% on the day at 1.0720.
GBP/USD preserves its bullish momentum and trades in positive territory at around 1.2100. HSBC UK Bank plc announced recently that it has acquired SVB's UK unit, Silicon Valley Bank UK Limited.
Pressured by the broad-based US Dollar weakness, USD/JPY fell sharply during the Asian trading hours before staging a technical correction. As of writing, the pair was down 0.4% on the day at 134.45.
Gold price capitalized on the risk-averse market environment and retreating US Treasury bond yields. XAU/USD opened with a bullish gap and reached its highest level since early February at $1,894 before retreating below $1,880.
Following the sharp decline witnessed in the week, Bitcoin recovered sharply over the weekend, gaining nearly 8% on Sunday. BTC/USD was last seen rising more than 1% on the day at $22,550. Ethereum rose nearly 10% over the weekend and ended up closing the week in positive territory. ETH/USD continues to stretch higher and was last up 1.7% at $1,620.
Further downside in USD/JPY should meet decent contention around the 133.00 region, note Markets Strategist Quek Ser Leang and Senior FX Strategist Peter Chia.
Key Quotes
24-hour view: “We highlighted last Friday that while there is scope for USD to weaken, any decline is viewed as a lower trading range of 135.50/137.00. However, USD sold off sharply before extending its drop in Asian trade. The sharp drop appears to be overdone but with no signs of stabilization just yet, USD could weaken further. That said, the major support at 133.00 is likely out of reach today. On the upside, a breach of 135.50 (minor resistance is at 135.00) would indicate that the weakness in USD has stabilized.”
Next 1-3 weeks: “Last Friday (10 Mar, spot at 136.40), we held the view that USD ‘appears to have entered a consolidation phase’ and we expected it to trade within a range of 135.00/138.00. We did not anticipate the sharp selloff to 134.10. The sharp drop appears to be running ahead of itself but there is scope for USD to weaken further. At this stage, we expect any decline could be limited to 133.00. Overall, only a breach of the ‘strong resistance’ level at 136.40 would indicate that USD is not weakening further.”
- The index comes under heavy selling pressure and breaches 104.00.
- US yields also extend the decline to multi-week lows.
- Markets’ attention remains on the release of US CPI on Tuesday.
The greenback, in terms of the USD Index (DXY), remains on the defensive and breaks below the 104.00 support for the first time since mid-February.
USD Index weaker ahead of US CPI
The index retreats for the third session in a row and breaches the 104.00 level at the beginning of the week, as investors continue to reprice the next interest rate hike by the Federal Reserve at the March 22 meeting.
Following Friday’s mixed results from Non-farm Payrolls, the greenback saw its decline gather extra steam amidst rising bets for a 25 bps rate raise, while the Silicon Valley Bank (SVB) crisis did not help the buck either.
Absent releases in the US data space on Monday, the focus of attention is expected to remain on the publication of inflation figures tracked by the CPI for the month of February, due on Tuesday.
What to look for around USD
The index accelerates its downside and revisits the sub-104.00 region for the first time after many weeks.
The latest results from the US jobs report continue to weigh on the greenback and collaborate with investors’ repricing of a 25 bps rate hike at the March gathering, all sponsoring the corrective decline in the USD Index (DXY) from last week’s 2023 highs in the boundaries of the 106.00 region.
So far, the index fully fades the post-Powell steep rebound against the backdrop of reinvigorated bets of a Fed’s pivot in the short-term horizon. However, the still elevated inflation and the resilience of the US economy continue to play against that view.
Key events in the US this week: Inflation Rate (Tuesday) – MBA Mortgage Applications, Producer Prices, Retail Sales, Business Inventories, NAHB Housing Market Index, TIC Flows (Wednesday) – Initial Jobless Claims, Housing Starts, Building Permits, Philly Fed Manufacturing Index (Thursday) – Industrial Production, Flash Michigan Consumer Sentiment, CB Leading Index (Friday).
Eminent issues on the back boiler: Rising conviction of a soft landing of the US economy. Persistent narrative for a Fed’s tighter-for-longer stance. Terminal rates near 5.5%? Fed’s pivot. Geopolitical effervescence vs. Russia and China. US-China trade conflict.
USD Index relevant levels
Now, the index is retreating 0.70% at 103.89 and the breakdown of 103.68 (monthly low March 13) would open the door to 103.51 (55-day SMA) and finally 102.58 (weekly low February 14). On the other hand, the next up-barrier aligns at 105.88 (2023 high March 8) seconded by 106.62 (200-day SMA) and then 107.19 (weekly high November 30 2022).
The Reserve Bank of New Zealand (RBNZ) could hike rates less than expected but the NZD/USD pair is still seen higher over the coming months, economists at ING report.
RBNZ pivot may not come in April
“The RBNZ continued to delay their dovish pivot. There is a good probability that April won’t see a pivot either. What will tilt the balance on the dovish side for the RBNZ, in our view, will be the disinflation process (which may well start earlier than they are projecting) and/or property market weakness rather than well-telegraphed evidence of a recessionary environment.”
“We expect the RBNZ to end up short of their projected 5.50% peak rate, but that should not prevent NZD to touch 0.66 in 2H23.”
“NZD/USD – 1M 0.62 3M 0.64 6M 0.66 12M 0.67”
Gold price has set off the week on a solid footing this Monday. Acceptance above $1,900 is critical for XAU/USD, FXStreet’s Dhwani Mehta reports.
Any pullback in Gold price appears limited
“Gold price has yielded a decisive break above the mildly bullish 50-Daily Moving Average (DMA) at $1,873, extending Friday’s upsurge to six-week highs of $1,895. Although Gold bulls have taken a pause before resuming the uptrend. The retracement in XAU/USD could retest the 50 DMA resistance-turned-support, below which the daily low at $1,868 could come into play.”
“Gold bulls will need to take out the intraday high at $1,895 to resume the upside to test the $1,900 barrier. Daily closing above the latter is critical to initiate a meaningful advance toward the year-to-date highs of $1,960. Ahead of that, the February 3 high of $1,919 needs to be scaled by Gold buyers.”
- WTI crude oil defends the previous day’s bounce off two-week low despite lacking upside momentum of late.
- Risk-on mood, receding hawkish Fed bets underpin WTI strength.
- US-China tension, cautious mood ahead of OPEC, EIA reports and US inflation probe energy buyers.
WTI crude oil remains sidelined near $77.00 as bulls struggle to cheer the broadly risk-on mood and the US Dollar weakness during early Monday. Even so, the black gold defends the previous day’s rebound from a short-term support line ahead of the monthly Oil market reports from the US Energy Information Administration (EIA) and the Organization of the Petroleum Exporting Countries (OPEC).
The commodity prices initially dropped to the two-week low before bouncing off $74.90 on the US Dollar’s slump despite witnessing the better-than-forecast Nonfarm Payrolls (NFP) reports. It should be noted that the fears emanating from the Silicon Valley Bank (SVB) and Signature Bank fallout drowned the US Treasury bond yields and the US Dollar on Friday.
However, the US Treasury Department, Federal Reserve and the Federal Deposit Insurance Corporation (FDIC) undertook joint actions to tame the risks during the weekend. While reacting to the US regulators’ actions, US President Joe Biden said, “American people and American businesses can have confidence that their bank deposits will be there when they need them.”
Even so, the market’s concerns that the SVB and Signature Bank flagged fragile conditions of the US banks pushed back hopes of more rate hikes from the US Federal Reserve (Fed) and drowned the US Treasury bond yields despite the risk-on mood during early Monday. With this in mind, Goldman Sachs expects to rate hike in March while the Fed Fund Futures also cut previously upbeat odds favoring a 0.50% rate lift in the Fed rate in March.
Elsewhere, a new term for China’s President Xi Jinping keeps the Sino-American tension on the table as he said earlier on Monday that they must resolutely oppose the interference of external forces, 'split' of Taiwan. The same raised fears of less energy demand from China and the US amid a lack of activity due to geopolitical tension.
Against this backdrop, S&P 500 Futures bounced off a 2.5-month low, up nearly 1.60% around 3,960 by the press time, whereas the US Treasury bond yields reverse the early-day rebound from monthly low amid fresh challenges for the hawkish Fed bets.
Looking ahead, Tuesday’s US Consumer Price Index (CPI) for February to direct immediate market moves. Following that, the Retail Sales and preliminary readings of the Michigan Consumer Sentiment Index for March, up for publishing on Wednesday and Friday, will be crucial for WTI crude oil traders to watch for clear direction.
Above all, monthly energy market reports from the OPEC and the EIA will be important for the WTI crude oil traders.
Technical analysis
Although a five-week-old support line restricts immediate WTI crude oil downside near $75.00, a daily closing beyond the 50-DMA hurdle surrounding $77.75 becomes necessary for the Crude Oil price to keep the buyers in the driver’s seat.
In the opinion of Markets Strategist Quek Ser Leang and Senior FX Strategist Peter Chia, a potential drop to the 0.6500 region in AUD/USD seems to be losing traction in the short term.
Key Quotes
24-hour view: “Last Friday, we held the view that AUD ‘is likely to trade with a downward bias but 0.6560 is expected to offer strong support’. AUD subsequently dropped to 0.6565 before rebounding to a high of 0.6641. While there is no significant improvement in upward momentum, AUD could advance further to 0.6660. The strong resistance at 0.6700 is unlikely to come under threat. On the downside, a breach of 0.6580 (minor support is at 0.6600) would indicate that AUD is unlikely to advance further.”
Next 1-3 weeks: “In our most recent narrative from last Wednesday (08 Mar, spot at 0.6585), we highlighted that AUD ‘is likely to weaken further but any weakness is likely to be at a slower pace’. We added, ‘The major support at 0.6500 may not come into view so soon’. Last Friday, AUD dipped to 0.6565 before rebounding sharply. Downward pressure is beginning to ease and the odds of AUD dropping to 0.6500 have diminished. However, only a break of 0.6700 (no change in ‘strong resistance’ level) would indicate that AUD has moved into a consolidation phase.”
CME Group’s flash data for crude oil futures markets noted traders increased their open interest positions for the fourth consecutive session on Friday, this time by around 1.5K contracts. Volume, instead, remained erratic and went down by nearly 19K contracts.
WTI: Next on the upside comes $80.00 and above
WTI prices regained the smile on Friday after three daily pullbacks in a row. The rebound was amidst increasing open interest and leaves the room open to the continuation of this trend at least in the very near term. The immediate resistance for the commodity lines up at the key $80.00 mark per barrel.
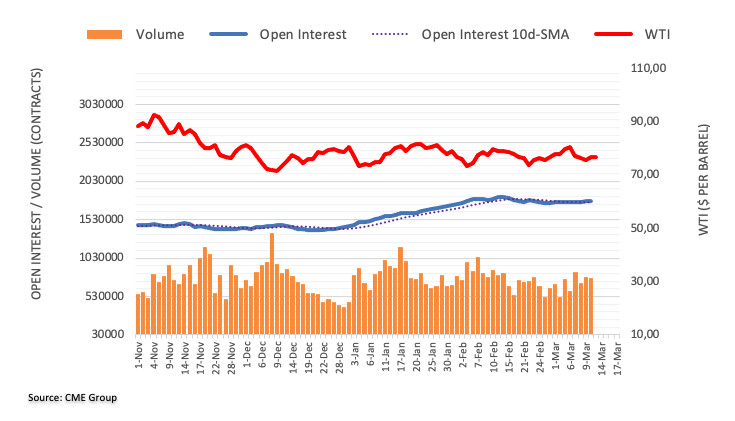
GBP/USD sticks to its mixed outlook and is expected to trade between 1.1950 and 1.2240 in the next weeks, suggest Markets Strategist Quek Ser Leang and Senior FX Strategist Peter Chia.
Key Quotes
24-hour view: “We did not anticipate the strong surge in GBP to 1.2112 last Friday (we were expecting GBP to trade in a range). The rapid rise has scope to test 1.2145. The major resistance at 1.2240 is not expected to come into view. Support is at 1.2040, followed by 1.2000.”
Next 1-3 weeks: “Last Friday (10 Mar, spot at 1.1915), we indicated that ‘downward momentum is beginning to fade and a break of 1.1950 would indicate that GBP is unlikely to weaken further’. However, we did not anticipate GBP jumping to a high of 1.2112. After the recent sharp but short-lived swings, the outlook for GBP is mixed. For the time being, we expect GBP to trade in a broad range of 1.1950/1.2240.”
Open interest in gold futures markets reversed the previous drop and increased by around 15.5K contracts on Friday, according to preliminary readings from CME Group. Volume followed suit and went up for the second session in a row, this time by around 108.8K contracts.
Gold: Immediate target emerges at $1900
Friday’s strong uptick in gold prices was on the back of increasing open interesting and volume and is indicative that extra gains appear in store for the yellow metal in the few weeks. That said, the next up-barrier of note appears around the $1900 mark per ounce troy.
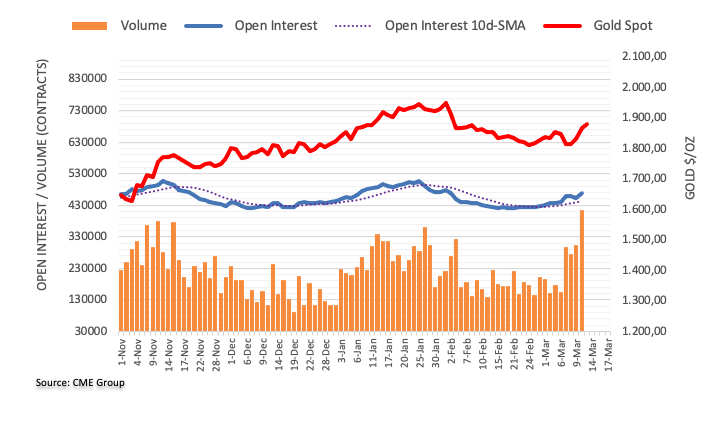
Markets Strategist Quek Ser Leang and Senior FX Strategist Peter Chia now see EUR/USD navigating within the 1.0560-1.0800 range for the time being.
Key Quotes
24-hour view: “We expected EUR to ‘continue to edge higher’ last Friday but we were of the view that it ‘is unlikely to break strong resistance at 1.0630’. However, EUR strengthened more than expected, jumping to a high of 1.0700. Upward momentum has improved, albeit not significantly. Today, EUR could advance further to 1.0740. The major resistance at 1.0800 is not expected to come under threat. On the downside, a breach of 1.0620 (minor support is at 1.0660) would indicate that the current upward pressure has eased.”
Next 1-3 weeks: “Our latest narrative was from last Wednesday (08 Mar, spot at 1.0550) where the slight improvement in downward momentum is likely to lead to EUR gravitating lower to 1.0485. Last Friday, EUR jumped above our ‘strong resistance’ of 1.0630. The breach of the ‘strong resistance’ indicates that downward pressure has eased. We view the current price actions as part of a consolidation range and expect EUR to trade between 1.0560 and 1.0800 for the time being.”
- EUR/USD seesaws around one-month high during a three-day uptrend.
- Convergence of 50-DMA, 38.2% Fibonacci retracement level challenge buyers.
- Sustained bounce off 100-DMA, the strongest bullish MACD signal in two months suggest further upside.
EUR/USD bulls take a breather around the 1.0730 resistance confluence after refreshing the one-month during early Monday. In doing so, the Euro pair jostles with a convergence of the 50-DMA and 38.2% Fibonacci retracement level of the quote’s upside from November 2022 to the previous monthly top.
The MACD prints the strongest bullish signal since early January and joins the aforementioned catalysts to keep EUR/USD buyers hopeful.
Additionally, the major currency pair’s successful upside break of a one-month-old descending resistance line, now support around 1.0630, joins the sustained bounce off the 100-DMA level surrounding 1.0540 to favor the EUR/USD bulls.
Even if the Euro bears manage to conquer the 1.0540 support, the low marked so far in March near 1.0525 precedes January’s bottom surrounding 1.0480 to challenge the further downside.
On the flip side, the EUR/USD pair’s daily closing beyond the 1.0730 resistance confluence could quickly direct buyers towards a three-month-old resistance line, near 1.0820 at the latest.
It should, however, be noted that the Euro pair’s run-up beyond 1.0820 may need validation from late January’s swing high of near 1.0930 before challenging the previous monthly top close to 1.1035.
Overall, EUR/USD is likely to rise further but a daily closing beyond 1.0730 could fasten the run-up.
EUR/USD: Daily chart
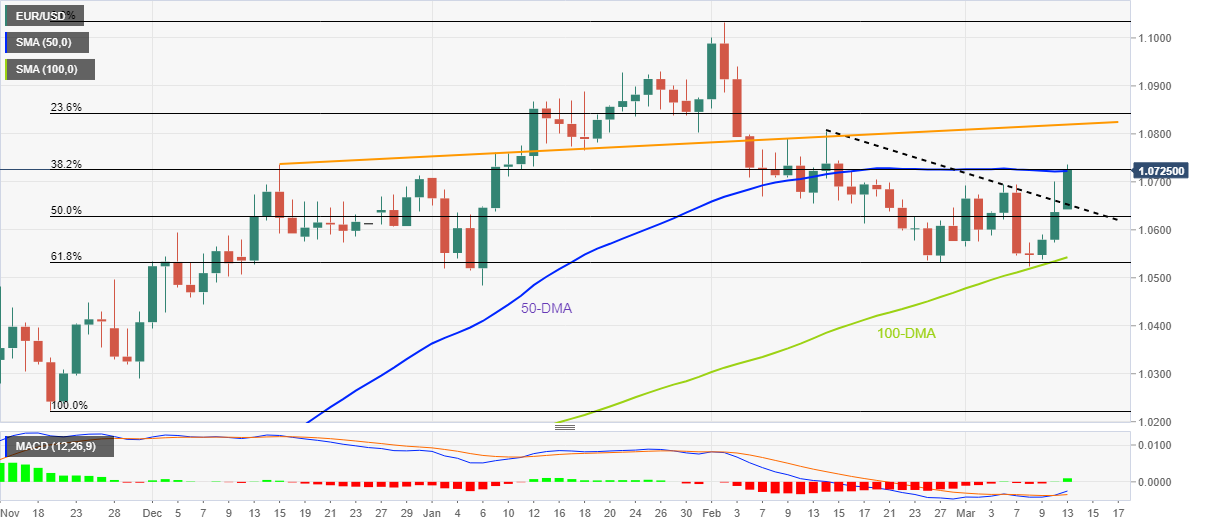
Trend: Further upside expected
In an interview with CBS'"Face the Nation on Sunday, "US Treasury Secretary Janet Yellen provided few details on the government's next steps.
Key quotes
"We're not going to do that again.”
"But we are concerned about depositors, and we're focused on trying to meet their needs."
"The American banking system is really safe and well capitalized. It's resilient."
- Gold price grinds higher after refreshing five-week high, prints three-day uptrend.
- Clear upside break of $1,865 support confluence keeps XAU/USD bulls hopeful.
- US regulators’ defence of SVB, Signature Bank fails to trigger rebound in US Treasury bond yields.
- US inflation data, consumer-centric figures, headlines surrounding SVB and Fed chatters will be crucial for near-term directions.
Gold price (XAU/USD) cheers the previous day’s upside break of the $1,865 hurdle, now support, to refresh a five-week high amid a broad risk-on mood. Adding strength to the precious metal’s advance is the broad-based US Dollar weakness as the US regulators’ efforts to tame the financial crisis, due to the Silicon Valley Bank (SVB) and Signature Bank fallout, fail to trigger a rebound in the US Treasury bond yields. The reason could be linked to the market’s fears that the Fed’s rate hikes have made the US banks fragile enough to trigger a recession, which in turn weighs on the Fed rate hike concerns despite the recently firmer US data and upbeat testimony from Fed Chair Jerome Powell.
It should be noted, however, that the Asia-Pacific equities’ inability to cheer the US Dollar weakness, despite rising of late, join the fears of fresh US-China tension to prod the Gold price upside. Furthermore, the cautious mood ahead of this week’s US Consumer Price Index (CPI) and the US Dollar’s notable fall despite posting a better-than-expected jobs report for February also challenge the XAU/USD bulls.
Also read: Gold Price Forecast: Acceptance above $1,900 is critical for XAU/USD, US CPI in focus
Gold Price: Key levels to watch
The Technical Confluence Detector shows that the Gold price is all set to reclaim the $1,900 threshold as the metal trades successfully beyond the $1,865 support confluence, now resistance, that comprise the Fibonacci 38.2% on one month.
That said, the Pivot Point One Week R1 guards the XAU/USD’s immediate upside near $1,890.
It should be noted that the Fibonacci 61.8% in one-month highlights the $1,902 as an extra filter towards the north.
Alternatively, the quote’s downside break of $1,865 resistance-turned-support will need validation from the $1,857 level, including Fibonacci 23.6% on one week, to recall the Gold bears.
Here is how it looks on the tool
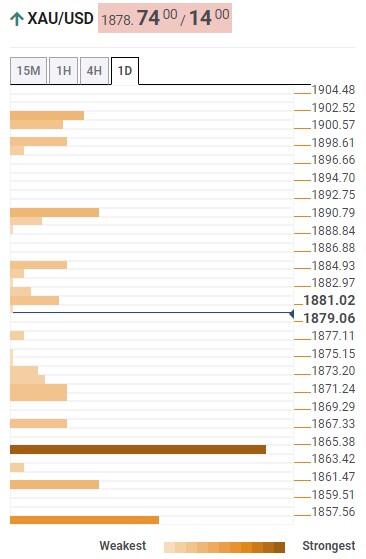
About Technical Confluences Detector
The TCD (Technical Confluences Detector) is a tool to locate and point out those price levels where there is a congestion of indicators, moving averages, Fibonacci levels, Pivot Points, etc. If you are a short-term trader, you will find entry points for counter-trend strategies and hunt a few points at a time. If you are a medium-to-long-term trader, this tool will allow you to know in advance the price levels where a medium-to-long-term trend may stop and rest, where to unwind positions, or where to increase your position size.
- USD/INR keeps the previous day’s U-turn from key DMAs to refresh multi-day lows, rebounds from intraday low of late.
- Cautious mood ahead of India CPI, mixed sentiment in Asia probes Rupee buyers.
- US Dollar bears the burden of SVB-inspired risk-on mood, receding hawkish Fed bets.
USD/INR picks up bids to pare intraday losses around 81.95 during early Monday morning in Europe. In doing so, the Indian Rupee (INR) pair struggles to cheer the US Dollar’s weakness amid mixed concerns in Asia, as well as the broad US Dollar weakness. Also challenging the pair traders could be the cautious mood ahead of the key inflation numbers for India and the US.
Asia-Pacific equities trade mixed as they’re yet to overcome Friday’s bond and stock market rout, as well as bear the burden of China-linked fears.
A new term for China’s President Xi Jinping keeps the Sino-American tension on the table as he said earlier on Monday that they must resolutely oppose the interference of external forces, 'split' of Taiwan. It’s worth mentioning that Wall Street saw the red on Friday while the US bond yields also dropped the most in a month amid fears emanating from the Silicon Valley Bank (SVB) and Signature Bank fallouts. However, the US Treasury Department, Federal Reserve and the Federal Deposit Insurance Corporation (FDIC) took joint actions to tame the risks during the weekend. While reacting to the US regulators’ actions, US President Joe Biden said, “American people and American businesses can have confidence that their bank deposits will be there when they need them.”
Amid these plays, S&P 500 Futures bounced off a 2.5-month low, up nearly 1.60% around 3,960 by the press time, whereas the US Treasury bond yields reverse the early-day rebound from monthly low amid fresh challenges for the hawkish Fed bets.
That said, the fallout of the SVB and Signature Bank flagged fragile conditions of the US banks, which in turn pushed back hopes of more rate hikes from the US Federal Reserve (Fed). With this in mind, Goldman Sachs expects to rate hike in March while the Fed Fund Futures also cut previously upbeat odds favoring a 0.50% rate lift in the Fed rate in March.
Hence, the risk-on mood underpins the US Dollar’s weakness but the cautious mood ahead of India’s key inflation data and mixed sentiment in Asia challenges the USD/INR bears.
Looking forward, India Consumer Price Index (CPI) for February precedes Tuesday’s WPI Inflation numbers and the US CPI for the said month to direct short-term USD/INR moves. In a case where the schedule data portray inflation fears, the US Dollar may pare some of its latest losses, which in turn probes the pair bears.
Technical analysis
USD/INR bears keep the reins unless witnessing a clear upside break of a convergence of the 50-DMA and 100-DMA, around 82.10-15 at the latest.
- AUD/USD stays on the front foot near intraday high as bulls cheer the biggest daily gains in almost two months.
- SVB-led risk-on mood joins receding hawkish Fed bets to drown US Dollar.
- Fresh fears surrounding US-China ties fail to derail risk-on mood.
AUD/USD bulls celebrate the biggest daily gains since early February around the 0.6665-70 hurdle during early Monday in Europe. The Aussie pair’s latest inaction could be linked to its struggle to overcome the five-week-old descending resistance line amid the broadly risk-on mood, as well as the US Dollar weakness.
While portraying the mood, S&P 500 Futures bounced off a 2.5-month low, up nearly 1.60% around 3,960 by the press time. It’s worth noting that the Asia-Pacific equities trade mixed as they’re yet to overcome Friday’s bond and stock market rout, as well as bear the burden of China-linked fears.
A new term for China’s President Xi Jinping keeps the Sino-American tension on the table as he said earlier on Monday that they must resolutely oppose the interference of external forces, 'split' of Taiwan. It’s worth mentioning that Wall Street saw the red on Friday while the US bond yields also dropped the most in a month amid fears emanating from the Silicon Valley Bank (SVB) fallout.
However, the US Treasury Department, Federal Reserve and the Federal Deposit Insurance Corporation (FDIC) took joint actions to tame the risks during the weekend. While reacting to the US regulators’ actions, US President Joe Biden said, “American people and American businesses can have confidence that their bank deposits will be there when they need them.”
The fallout of the SVB and Signature Bank flagged fragile conditions of the US banks, which in turn pushed back hopes of more rate hikes from the US Federal Reserve (Fed). With this in mind, Goldman Sachs expects to rate hike in March while the Fed Fund Futures also cut previously upbeat odds favoring a 0.50% rate lift in the Fed rate in March.
Amid these plays, US Dollar Index (DXY) drops to the lowest level in a month, down 0.80% near 103.80.
Looking ahead, Tuesday’s US Consumer Price Index (CPI) for February to direct immediate market moves. Following that, the Retail Sales and preliminary readings of the Michigan Consumer Sentiment Index for March, up for publishing on Wednesday and Friday, will be crucial for AUD/USD traders to watch. At home, Thursday’s Aussie jobs report will be observed to reconfirm recent dovish bias surrounding the Reserve Bank of Australia (RBA).
Technical analysis
A five-week-old descending resistance line, around 0.6665 by the press time, challenges the AUD/USD bulls.
- USD/JPY holds lower ground after refreshing a one-month bottom.
- U-turn from the DMAs, rejection of bullish channel and the strongest bearish MACD signals since early February to favor sellers.
- Early February tops may test Yen pair bears ahead of 50-SMA.
- Buyers remain off the table unless witnessing a clear break of 200-DMA.
USD/JPY bears keep the reins for the third consecutive day heading into Monday’s European session. In doing so, the Yen pair seesaws around the lowest levels in one month, marked earlier in the day, as sellers poke the 134.00 threshold.
A clear U-turn from the 200-DMA, as well as a downside break of the 100-DMA, joins a sustained downside break of a five-week-old bullish channel to favor USD/JPY sellers. On the same line could be the strongest bearish MACD signals since early December 2022.
With this, the Yen pair appears all set to slump toward the 50-DMA support of 132.50. However, the early February swing highs near 132.90 seem to prod the USD/JPY sellers of late.
In a case where the USD/JPY price remains bearish past the 50-DMA, the 130.00 round figure and the previous monthly low surrounding 128.00 will be in the spotlight.
On the flip side, a convergence of the 100-DMA and the aforementioned channel’s lower line, close to 135.85, holds the key to USD/JPY pair’s recovery.
Even so, the 200-DMA can test the upside momentum near 137.50 before directing prices towards the aforementioned channel’s top line, close to 139.50 at the latest.
USD/JPY: Daily chart
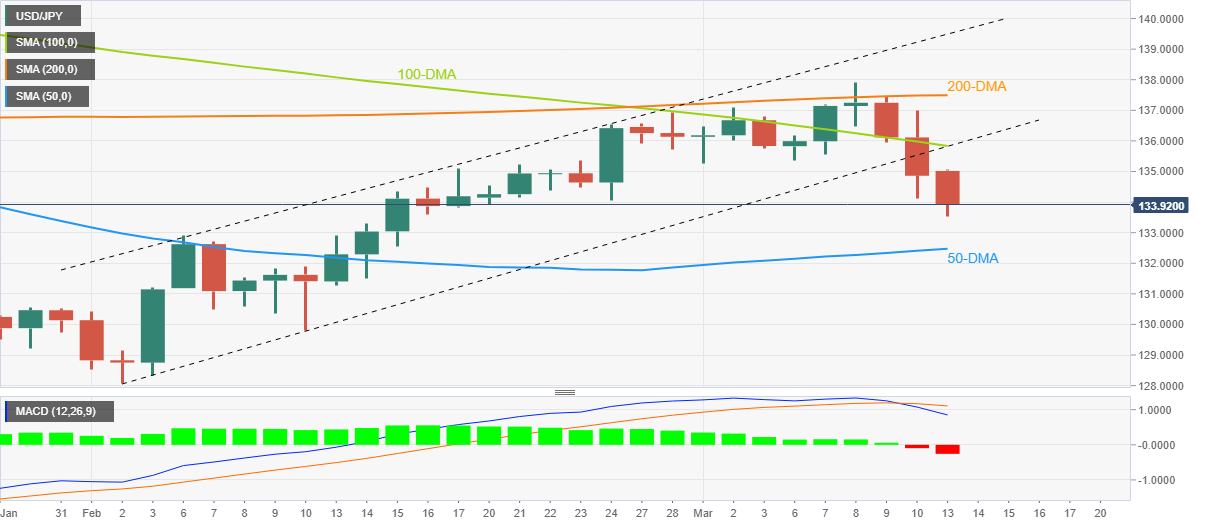
Trend: Further downside expected
- USD/CAD takes offers to extend pullback from five-month high.
- US regulators unveil plans to tame SVB, Signature Bank inflicted risk.
- Fed rate hike expectations ease amid looming fears on US banks.
- Oil price cheers softer US Dollar with eyes on EIA, OPEC monthly reports.
USD/CAD stands on slippery grounds, declining nearly 0.80% intraday to 1.3720 heading into Monday’s European session. In doing so, the Loonie pair sellers cheer the broad US Dollar weakness, as well as the recent recovery in prices of Crude Oil, Canada’s key export item.
US Dollar Index (DXY) drops to the lowest levels in a month, down 0.80% near 103.80, as risk-on mood joins easing hawkish Fed bets to drown the greenback’s gauge versus the six major currencies. On the other hand, WTI crude oil rises for the second consecutive day, up 0.50% intraday near $77.00 at the latest.
After witnessing the stock and bond market rout on Friday, the market sentiment improved as the US Treasury Department, Federal Reserve and the Federal Deposit Insurance Corporation (FDIC) took joint actions to tame the risks emanating from the Silicon Valley Bank (SVB) and Signature Bank during the weekend. “All depositors of Silicon Valley Bank and Signature Bank will be fully protected,” said the authorities in a statement released afterward. While reacting to the US regulators’ actions, US President Joe Biden said, “American people and American businesses can have confidence that their bank deposits will be there when they need them.”
It should be noted, however, that the latest fallout of the SVB and Signature Bank flagged fragile conditions of the US bank, which in turn pushed back hopes of more rate hikes from the US Federal Reserve (Fed). With this in mind, Goldman Sachs expects to rate hike in March while the Fed Fund Futures also cut previously upbeat odds favoring a 0.50% rate lift in the Fed rate in March.
Alternatively, China’s dislike for the US interference in Taiwan matters and the better-than-expected US Nonfarm Payrolls (NFP) join the Bank of Canada’s (BoC) dovish play to weigh on the Loonie prices.
On Friday, US Nonfarm Payrolls (NFP) grew more than 205K expected to 311K in February, versus 504K (revised), while the Unemployment Rate rose to 3.6% for the said month compared to 3.4% expected and prior. Further, the Average Hourly Earnings rose on YoY but eased on monthly basis for February whereas the Labor Force Participation increased during the stated month.
At home, Canada’s Net Change in Employment rose to 21.8K versus 10K market forecasts and 150K prior while the Unemployment Rate remained unchanged at 5.0% compared to 5.1% expected.
Looking ahead, Tuesday’s US Consumer Price Index (CPI) for February to direct immediate market moves. Following that, the Retail Sales and preliminary readings of the Michigan Consumer Sentiment Index for March, up for publishing on Wednesday and Friday, will be crucial for clear directions of the USD/CAD traders.
Technical analysis
Friday’s Doji at multi-day high joins overbought RSI to favor USD/CAD pullback towards the late 2022 peak surrounding the 1.3700 round figure.
The US Dollar has come under renewed selling pressure in Asia this Monday after Goldman Sachs revised downward its expectations of the US Federal Reserve (Fed) rate hike outlook, in the face of the Silicon Valley Bank (SBV) fallout.
Key quotes
"In light of recent stress in the banking system, we no longer expect the FOMC to deliver a rate hike at its March 22 meeting with considerable uncertainty about the path beyond March."
“Goldman Sachs now predicts -
March on hold
May +25 bps
June +25 bps
July +25 bps
Terminal rate forecast at 5.25 - 5.50%.”
- GBP/USD rises to the highest levels in two weeks during a four-day uptrend.
- Clear upside break of 21-DMA, previous resistance lines join bullish MACD signal to favor buyers.
- Sellers need validation from 1.1920-10 support zone for conviction.
GBP/USD takes the bids to refresh a three-week high near 1.2125-30 during early Monday morning in Europe. It should be noted that the multiple catalysts including the UK jobs report and the US inflation data highlight this week an important one for the Cable traders.
Also read: GBP/USD bulls are in the market testing bear commitments at 1.2100
That said, the quote cheers the upside break of the 21-DMA and previous resistance lines from early February. Adding strength to the north-side bias are the recently bullish MACD signals and the above 50 levels of RSI (14) that back the last week’s recovery moves.
It’s worth noting, however, that a convergence of the 50-DMA and 50% Fibonacci retracement level around 1.2130 appears the key hurdle for the GBP/USD buyers to cross to keep the reins.
Following that, the Cable pair’s run-up towards the 61.8% Fibonacci retracement level of late January to early March downturn and the mid-February swing high, respectively near 1.2205 and 1.2270 in that order, can’t be ruled out.
Meanwhile, the pullback move may initially aim for the one-month-old resistance-turned-support line, near 1.2030 at the latest, before poking the 21-DMA level of around 1.2020.
In a case where the GBP/USD bears keep control past 1.2020, the previous resistance line from February 02, near the 1.2000 psychological magnet at the latest, appears important to watch.
Even so, the GBP/USD pair sellers should remain cautious unless it breaks the nine-week-old horizontal support line near 1.1920-10.
GBP/USD: Daily chart
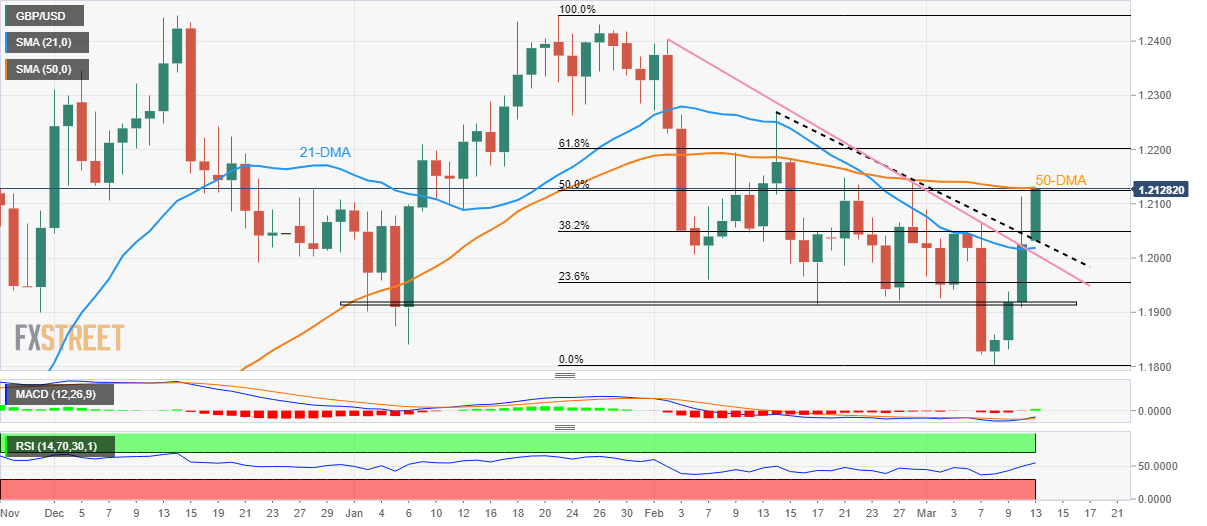
Trend: Further upside expected
- EUR/USD prints three-day uptrend as firmer sentiment weighs on the US Dollar.
- US regulators’ efforts to tame financial markets risk from SVB, Signature Bank favor risk profile on Monday.
- Friday’s US employment data failed to impress US Dollar bulls as the previous risk-aversion drowned yields.
- US CPI, ECB eyed for clear directions, consumer-centric data also appear important to watch.
EUR/USD rise to the highest levels in three weeks as an upbeat risk profile favors bulls amid early Monday. That said, the Euro pair advances nearly half a percent on a day to 1.0715 as it prints a three-day winning streak at the highest levels in three weeks with eyes on Thursday’s European Central Bank (ECB) monetary policy meeting, as well as Tuesday’s US Consumer Price Index (CPI).
US Treasury Department, Federal Reserve and the Federal Deposit Insurance Corporation (FDIC) took joint actions to tame the risks emanating from the SVB and Signature Bank during the weekend. “All depositors of Silicon Valley Bank and Signature Bank will be fully protected,” said the authorities in a statement released afterward. While reacting to the US regulators’ actions, US President Joe Biden said, “American people and American businesses can have confidence that their bank deposits will be there when they need them.”
It should be noted that China’s dislike for the US interference in Taiwan matters and the better-than-expected US Nonfarm Payrolls (NFP) seem to probe the risk-on mood ahead of this week’s top-tier data/events.
On Friday, the US Nonfarm Payrolls (NFP) grew more than 205K expected to 311K in February, versus 504K (revised), while the Unemployment Rate rose to 3.6% for the said month compared to 3.4% expected and prior. Further, the Average Hourly Earnings rose on YoY but eased on monthly basis for February whereas the Labor Force Participation increased during the stated month. The data, however, failed to impress the US Dollar buyers as the market’s risk-off mood drowned the US Treasury bond yields and the greenback.
It’s worth observing that the market’s fears of no Fed rate hikes in March, due to the latest imbalance in the US banking sector due to the SVB and Signature Bank fallout, also seem to weigh n the US Dollar.
Amid these plays, S&P 500 Futures bounced off a 2.5-month low, up nearly 1.0% around 3,905 by the press time whereas the US Treasury bond yields recover from the monthly low, after posting the biggest daily loss of the year 2023 on Friday.
Moving on, market plays may witness a sluggish session on Monday amid a cautious mood ahead of top-tier data/events. That said, the ECB is likely to announce a 0.50% rate hike and can join the latest risk-on mood to propel the EUR/USD price. Though, strong prints of the US consumer-centric data and inflation may renew hawkish Fed bias and can exert downside pressure on the major currency pair moving forward.
Technical analysis
The EUR/USD pair’s higher highs on price fail to gain support from the Relative Strength Index (RSI) 14 as it forms a lower high, which in turn suggests a lack of enough bullish momentum to cross the immediate key hurdle, namely the 200-SMA level surrounding 1.0710.
| Raw materials | Closed | Change, % |
|---|---|---|
| Silver | 20.531 | 2.29 |
| Gold | 1868.77 | 2.07 |
| Palladium | 1379.15 | -0.31 |
China's President Xi Jinping said in a statement on Monday, we “must resolutely oppose the interference of external forces, 'split' of Taiwan.”
Additional comments
China should implement strategy of rejuvenating country through science, education.
China should work to achieve greater self-reliance, strength in science and technology, promote industrial transformation and upgrading.
Efforts should be made to upgrade, appropriately expand economy, and continuously increase China's economic strength, scientific and technological capabilities.
We must better coordinate development and security, implement overall national security concept.
Necessary to promote modernization of national defence, military.
Build military into effective safeguard of state sovereignty.
We must promote 'one country, two systems' and 'reunification of the motherland'.
China must oppose pro-Taiwan independence forces.
Actively promote peaceful development of cross-strait relations.
Market reaction
Despite these comments, AUD/USD keeps its recovery mode intact near 0.6650, up 1.06% on the day.
Japan Chief Cabinet Secretary Hirokazu Matsuno said on Monday, they don't see big impact on Japan's financial companies from the SVB fallout.
Key quotes
“Japan’s financial institutions have sufficient liquidity, capital base overall.“
“Not likely that Silicon Valley Bank’s collapse has a big impact on Japanese financial stability.”
“Iran, Saudi Arabia’s agreement toward diplomatic normalizations is a forward-looking move for peace and stability in the Middle East.”
Market reaction
USD/JPY remains heavily offered around 134.40, at the time of writing, amid a broadly weaker US Dollar. The latest upswing in the pair could be linked to the rising US Treasury bond yields and risk recovery. The spot is still down 0.44% on the day,
- Silver price struggles to extend recovery from four-month low, pares intraday gains during a three-day uptrend.
- Failure to cross short-term resistance line, downside break of 200-SMA lure XAG/USD sellers.
- Two-week-old horizontal support zone restricts immediate Silver price downside.
Silver price (XAG/USD) clings to mild gains around $20.60 as it probes the metal’s pullback from a short-term key resistance line during early Monday. Even so, the XAG/USD prints the three-day winning streak, as well as extends the previous day’s rebound from the lowest levels since November 04, 2022.
That said, the looming bear cross on the MACD joins the bullion’s inability to stay beyond the 200-SMA, not to forget the failure to cross a two-week-old resistance line, which keeps the Silver price bears hopeful.
As a result, the bullion remains on the way to retesting the two-week-old horizontal support zone, close to $20.40 at the latest. However, the metal’s further downside may witness hardships in breaking the $20.00 psychological magnet.
Following that, the monthly low of $19.95 and the November 2022 bottom surrounding $18.85 will be in focus.
On the contrary, recovery moves remain elusive unless the XAG/USD stays below the downward-sloping resistance line from late February, around $20.90 at the latest. Also acting as an upside filter is the $21.00 round figure.
In a case where the Silver buyers keep control past $21.00, the last week’s high of around $21.30 may act as the last defense of the XAG/USD bears.
Silver price: Hourly chart
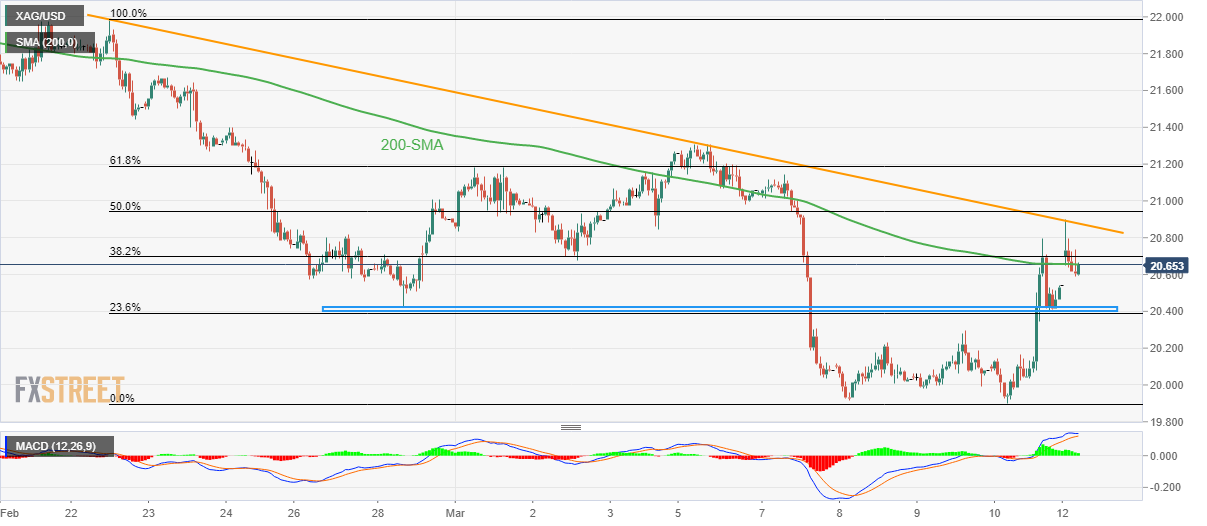
Trend: Further downside expected
Bank of Korea (BOK) Governor said in a statement on Monday that they “will take market stabilizing measures if necessary.”
“Closely monitoring interest rates, stock prices, foreign exchange rates, capital flows,” the BOK added.
Meanwhile, the South Korean Finance Minister said that they “will step up monitoring of financial markets.”
He added that they “will respond in a timely manner if necessary.”
Market reaction
USD/KRW has come under renewed selling interest, fuelled by the above comments. The pair is trading 0.35% lower at 1,316.08, having failed to find acceptance above the $1,320 level.
- AUD/USD bulls are in the market following a strong open.
- A correction is underway but bulls remain committed at 0.6600 support.
As per the pre-open market analysis, the price rallied into and beyond the M-formation´s neckline which was forecasted to be a pull on the Aussie for the open.
The prior analysis explained that an M-formation had formed on this hourly chart:
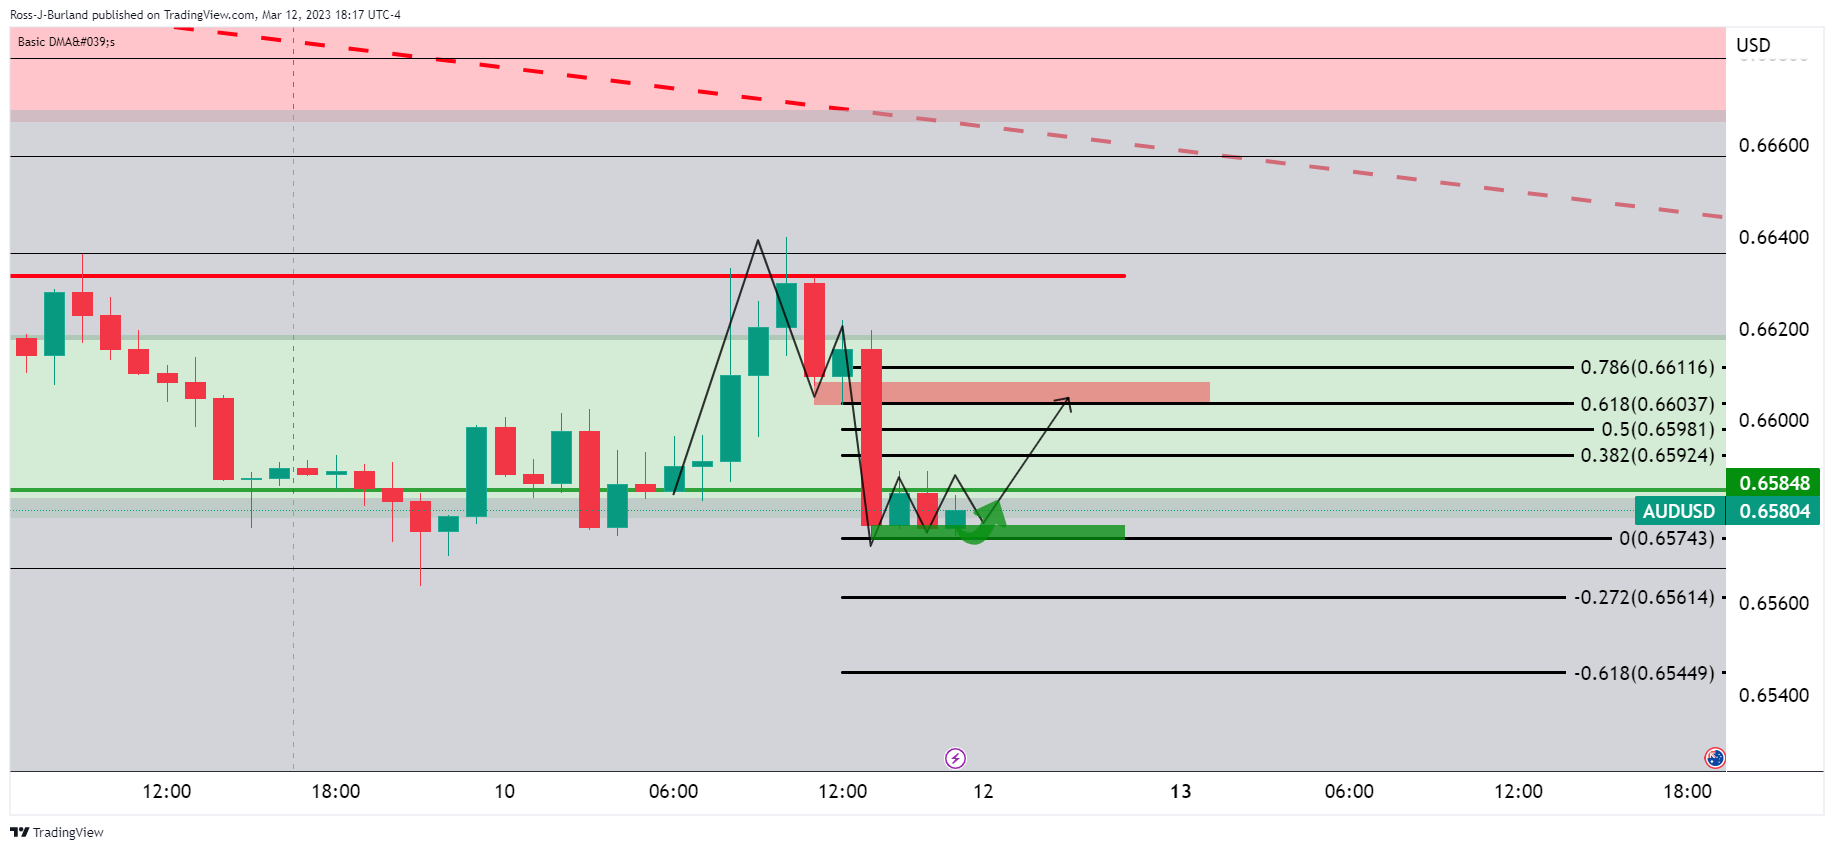
´´The M-formation is a reversion pattern and the price can be pulled into the neckline for a restest which is yet to play out, so far. However, it is worth noting for the open this week with 0.6600 being a key level in this regard.´´
AUD/USD update
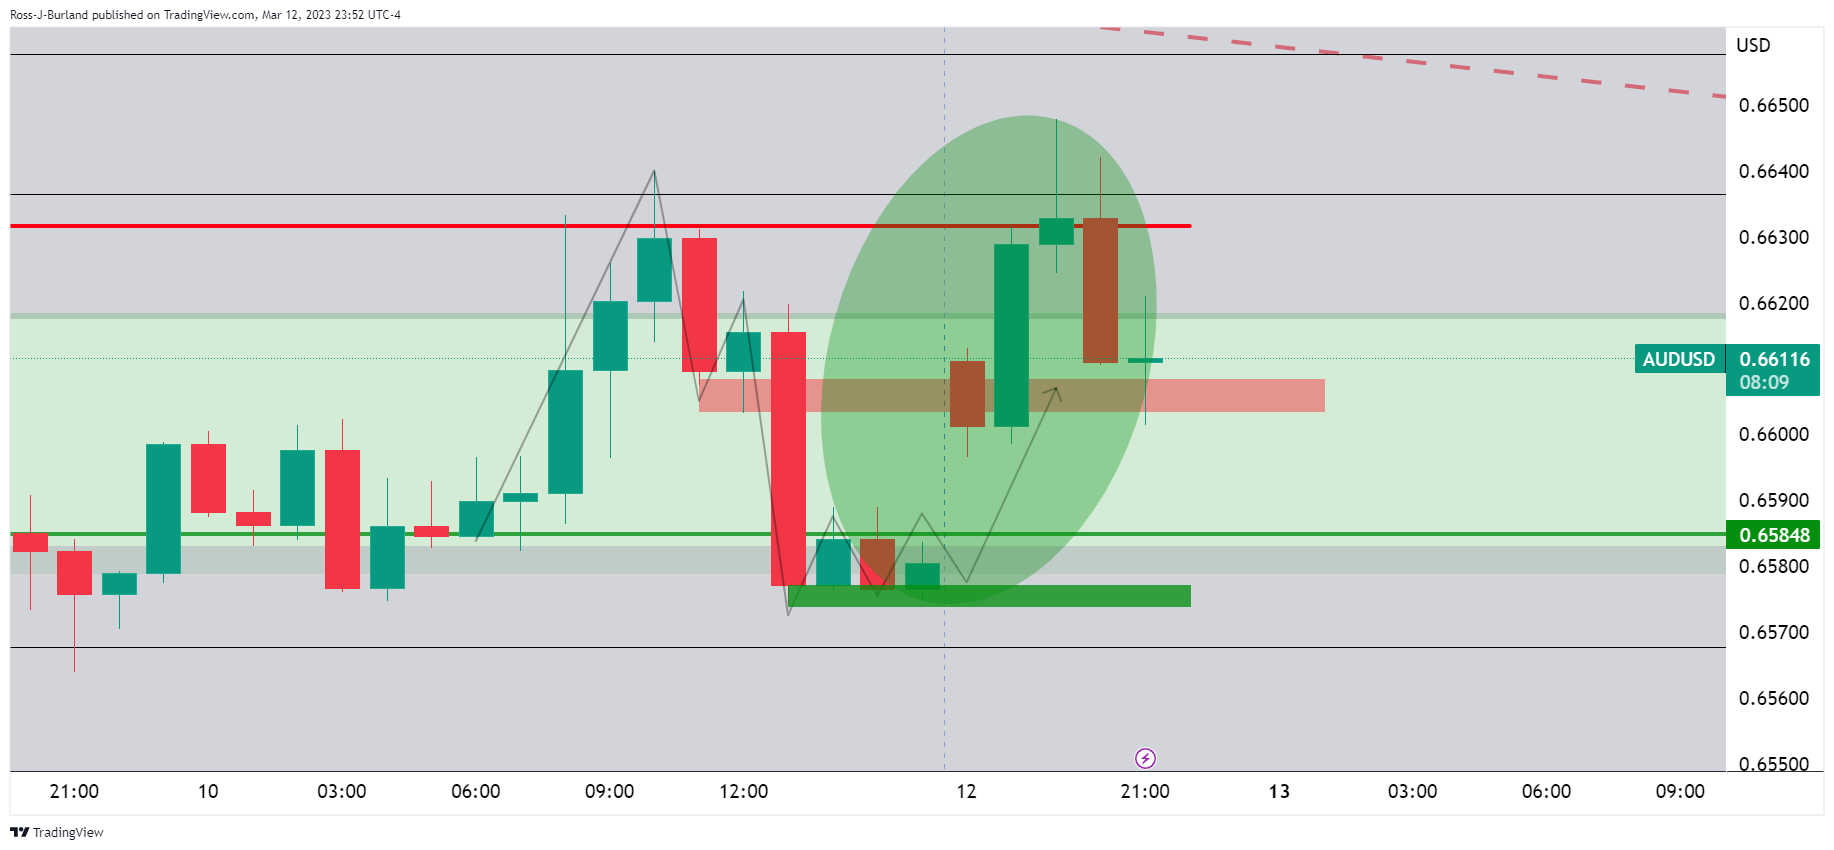
The bulls are in the market and the correction of the opening rally is stalling above 0.66 so far.
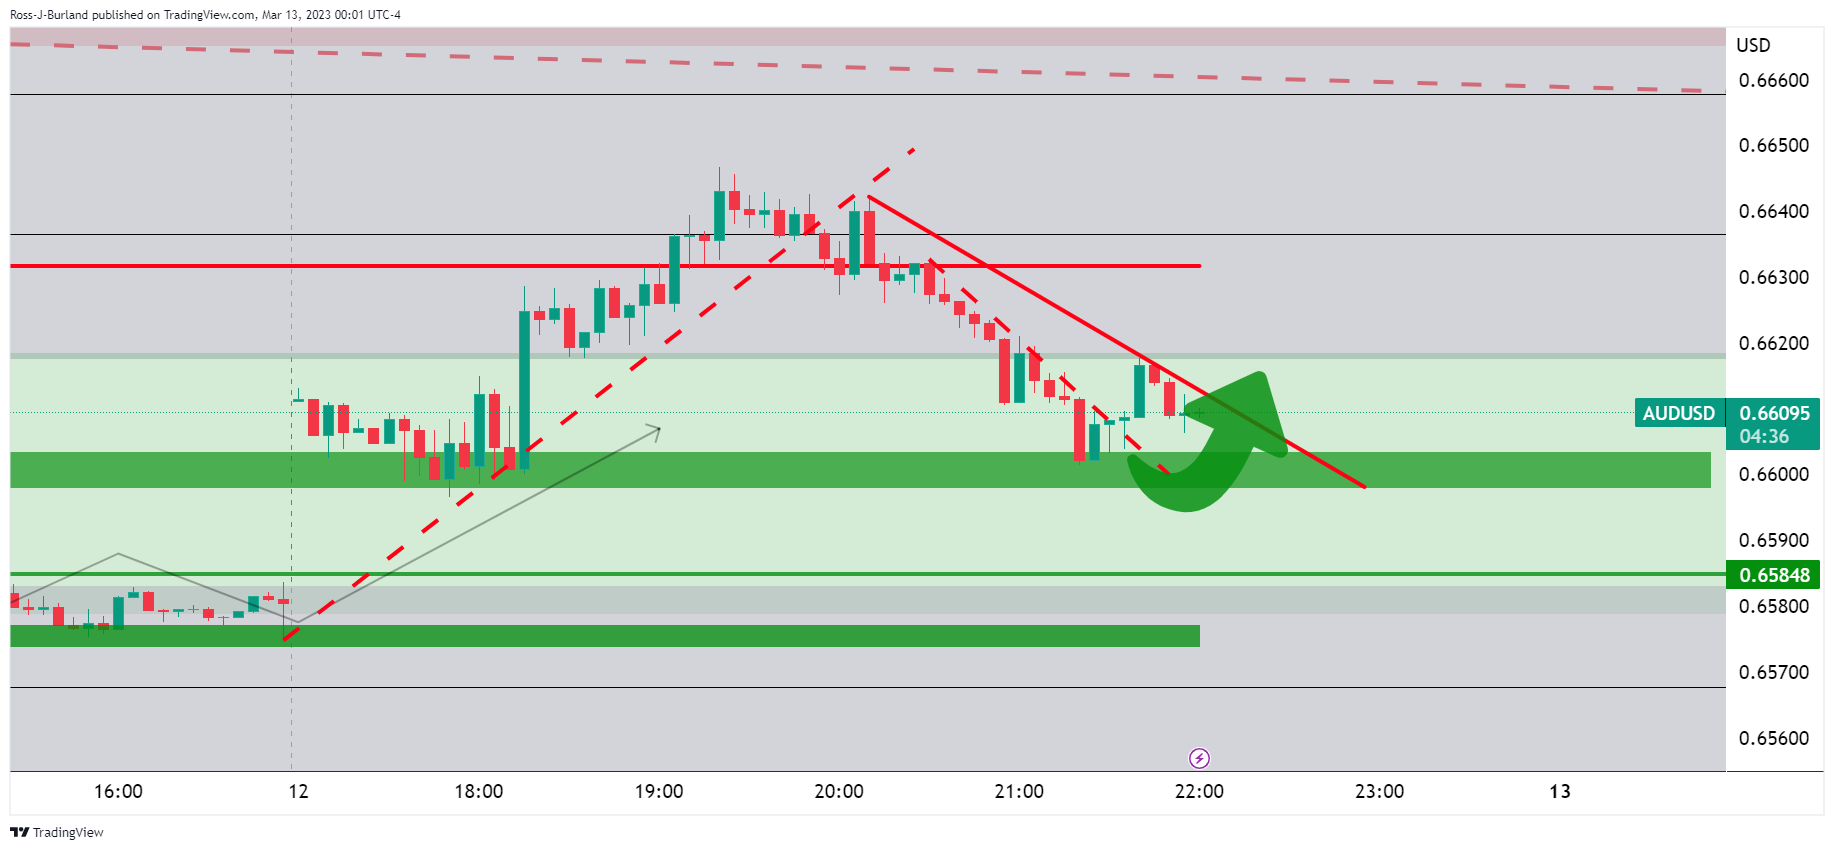
A break has occurred through a micro trendline resistance with more work to do from the bulls to get over the line. 0.6620 will be a milestone on the onward´s journey for laying down the foundations of a continuation beyond 0.6650.
- Market sentiment improves as US regulators manage to tame fears emanating from Silicon Valley Bank, Signature Bank.
- S&P 500 Futures rebound from the lowest levels in nine weeks.
- US two-year Treasury bond yields pare the biggest daily loss in nine months around 4.52%.
- US inflation, consumer-centric data eyed amid Fed blackout period.
Markets witness a risk-on mood during early Monday, following a show of heavy pessimism the previous day, as the US policymakers take steps to tame financial risks emanating from the Silicon Valley Bank (SVB) and Signature Bank.
While portraying the mood, S&P 500 Futures bounced off a 2.5-month low, up nearly 1.0% around 3,905 by the press time whereas the US Treasury bond yields recover from the monthly low. That said, the benchmark 10-year Treasury bond coupons rise nearly five basis points (bps) to 3.74% as it pares the biggest daily loss in four months. More interestingly, the two-year Treasury bond yields consolidate the heavy daily slump since June 2022 around 4.52% by the press time. It should be noted, however, that shares in the Asia-Pacific region are still in the red, despite recovering in the last hour, as they were left to react on Friday’s equity market rout.
US Treasury Department, Federal Reserve and the Federal Deposit Insurance Corporation (FDIC) took joint actions to tame the risks emanating from the SVB and Signature Bank during the weekend. “All depositors of Silicon Valley Bank and Signature Bank will be fully protected,” said the authorities in a joint statement released a few minutes back.
While reacting to the US regulators’ actions, US President Joe Biden said, “American people and American businesses can have confidence that their bank deposits will be there when they need them.”
Although the US policymakers manage to renew the risk-on mood, fears emanating from the Federal Reserve’s (Fed) stronger rate hikes, especially after Friday’s mostly upbeat data and the previous week’s hawkish testimony from Fed Chair Powell, weigh on the sentiment. That said, the US Nonfarm Payrolls (NFP) grew more than 205K expected to 311K in February, versus 504K (revised), while the Unemployment Rate rose to 3.6% for the said month compared to 3.4% expected and prior. Further, the Average Hourly Earnings rose on YoY but eased on monthly basis for February whereas the Labor Force Participation increased during the stated month.
Looking ahead, US President Biden's speech on Monday will precede Tuesday’s US Consumer Price Index (CPI) for February to direct immediate market moves. Following that, the Retail Sales and preliminary readings of the Michigan Consumer Sentiment Index for March, up for publishing on Wednesday and Friday, will be crucial for clear directions.
Commenting on the Silicon Valley Bank (SVB) depositor rescue plan, US President Joe Biden said early Monday, the solution avoids putting taxpayer dollars at risk.
Additional comments
“Treasury secretary and National Economic Council director reached solution with banking regulators.”
“American people and American businesses can have confidence that their bank deposits will be there when they need them.”
“Committed to 'holding those responsible for this mess fully accountable'.”
“Will deliver remarks on Monday morning on how we will maintain a resilient banking system to protect our historic economic recovery.”
“Plans to continue efforts to strengthen oversight of larger banks.”
Market reaction
Fears over the SVB fallout seem to wane during mid-Asia, as the Fed and Treasury come out with a bailout plan. The S&P 500 futures have jumped about 1.20% so far, reclaiming the 3,900 mark. Meanwhile, the US Dollar Index is on the back foot, testing the 104.00 level, reeling from the mixed US employment data-led pain.
- USD/CHF rebounds from one-month low but stays bearish for the fourth consecutive day.
- Five-week-old ascending support line, oversold RSI challenges the bears.
- Bulls need validation from 200-SMA previous support line from early February.
USD/CHF bears struggle to keep the reins around a one-month low as it pares intraday losses near 0.9200 during early Monday. Even so, the Swiss Franc (CHF) pair stays in the red for the fourth consecutive day, while extending the previous week’s pullback.
The quote’s latest rebound could be linked to the oversold conditions of the Relative Strength Index (RSI) line, placed at 14, as well as the pair seller’s inability to break the upward-sloping support line from February 03, close to 0.9165 at the latest.
It should be noted, however, that the bearish MACD signals and the pair’s sustained trading below the previous support line from February 01, close to 0.9315 by the press time.
Apart from the support-turned-resistance line, the 200-SMA also challenges the USD/CHF rebound, at 0.9275 as we write.
In a case where USD/CHF remains firmer past 0.9275, the odds of witnessing a run-up towards the previous week’s double tops near 0.9440 appear brighter.
Alternatively, a downside break of the five-week-long ascending support line of near 0.9165 won’t hesitate to challenge the early February’s swing low around 0.9130 ahead of highlighting the previous monthly low of 0.9060 for the bears.
Should the USD/CHF sellers dominate past 0.9060, August 2021 low near 0.9020 and the 0.9000 psychological magnet will be in focus.
USD/CHF: Four-hour chart
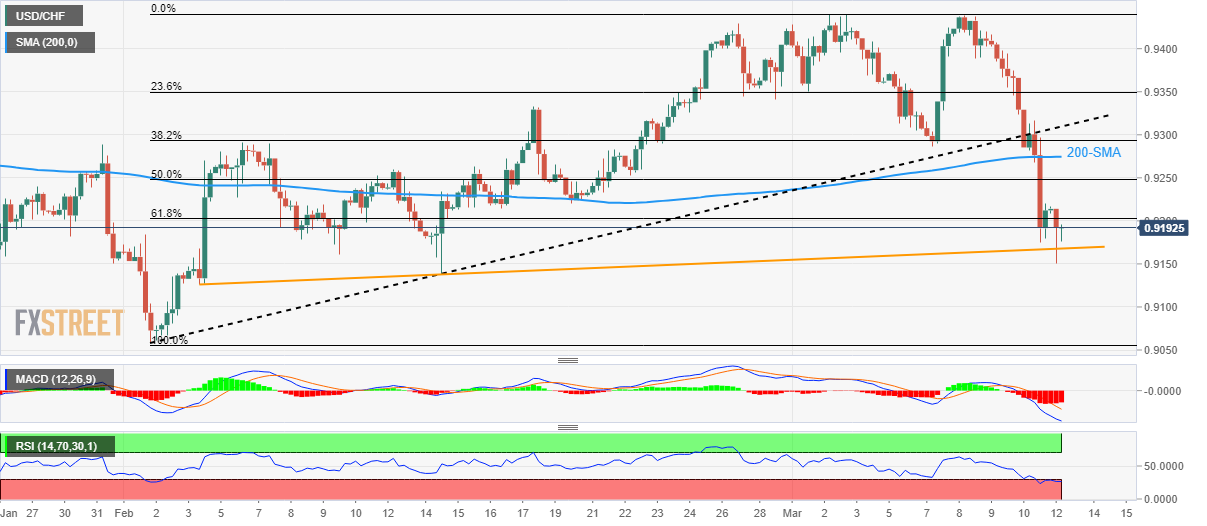
Trend: Further recovery expected
In recent trade today, the People’s Bank of China (PBOC) set the yuan at 6.9375 vs. last close of 6.9195.
About the fix
China maintains strict control of the yuan’s rate on the mainland.
The onshore yuan (CNY) differs from the offshore one (CNH) in trading restrictions, this last one is not as tightly controlled.
Each morning, the People’s Bank of China (PBOC) sets a so-called daily midpoint fix, based on the yuan’s previous day's closing level and quotations taken from the inter-bank dealer.
- Gold price is firm in the open on a soft US Dollar.
- Gold price bears eye trendline support while bulls look to $1,920s.
Gold price was higher at the start of the week by some 0.5% after the first hour of Tokyo trade having jumped 2% on Friday and while US authorities announced plans to limit the fallout from the collapse of Silicon Valley Bank (SVB). At the time of writing, Gold price is trading at $1,878 and between a low of $1,867.03 and $1,894.68.
In a joint statement, the US Treasury and Federal Reserve announced a range of measures to stabilise the banking system and said depositors at SVB would have access to their deposits on Monday. The Biden administration on Sunday guaranteed that customers of the failed Silicon Valley Bank will have access to all their money starting Monday. In a joint statement Sunday, Treasury Secretary Janet Yellen, Federal Reserve Chair Jerome Powell and Federal Deposit Insurance Corporation Chairman Martin J. Gruenberg said the FDIC will make SVB and Signature’s customers whole.
Investors speculated the Fed would now be reluctant to rock the boat by hiking interest rates by a super-sized 50 basis points this month which gave rise to a softer US Dollar. Fed fund futures surged in early trading to imply only a 17% chance of a half-point hike, compared to around 70% before the SVB news broke last week. The peak for rates came all the way back to 5.14%, from 5.69%, last Wednesday, and markets were even pricing in rate cuts by the end of the year. Yields on two-year Treasuries dropped to 4.445%, well below last week's 5.08% high and in a move that has benefitted the Gold price.
Meanwhile, traders will be looking at what the US Consumer Price Index figures will reveal on Tuesday. Even with the financial system under strain, there are prospects of a more aggressive Fed if the data comes in hot. ´´Core prices likely gained momentum in February with the index rising a strong 0.5% MoM, as we look for the recent large relief from goods deflation to start normalizing,´´ analysts at TD Securities explained. ´´Shelter inflation likely remained the key wildcard, while slowing gasoline and food prices will likely dent non-core CPI inflation. Our m/m forecasts imply 6.1%/5.5% YoY for total/core prices.´´
Gold technical analysis
- Gold, Chart of the Week: XAU/USD bulls could have some staying power
On the 4-hour timeframe there are prospects of a meanwhile correction into the Friday rally for the opening balance as follows:
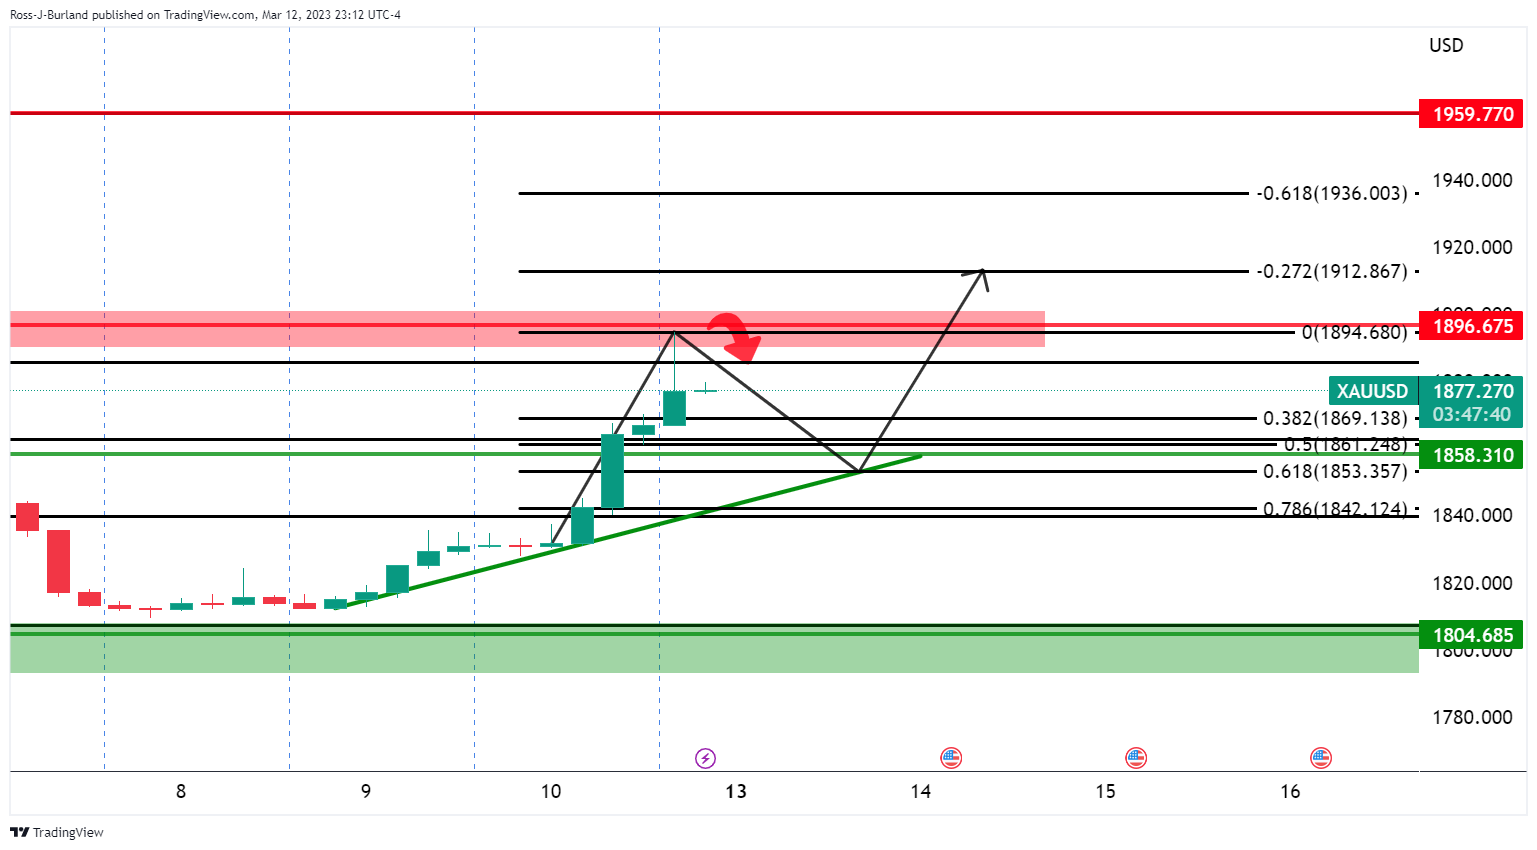
The bears could be moving in at this juncture and a correction into the trendline support might result in a test of and failure for an onward bullish continuation with the $1,920s eyed.
- NZD/USD prints two-day winning streak as US regulators tame financial market risks.
- NZIER anticipates much weakness growth in 2024, Thursday’s New Zealand Q4 GDP eyed.
- Easing fears from SVB, Signature Bank renew market’s risk-on mood.
- Mixed US employment data, anxiety ahead of key data/events probe Kiwi pair buyers.
NZD/USD defends Friday’s recovery around 0.6150-55 as market sentiment improves on early Monday. In doing so, the Kiwi pair pays little attention to the downbeat report from the New Zealand Institute of Economic Research (NZIER).
“The latest NZIER Consensus Forecasts show an upward revision to the near-term growth outlook for the New Zealand economy but a downward revision for the subsequent two years,” per the March 2023 NZIER report. The think-tank also adds that annual average GDP growth is forecast to slow to 0.3 percent for the year to March 2024 before picking up to 1 percent in the following year.
The NZD/USD pair’s upside could also be linked to the pacific nation’s Business NZ PSI for February, 55.5 versus 54.5 prior, as well as Food Price Index for the said month, 1.5% MoM compared to 0.6% market consensus and 1.7% previous readings.
Elsewhere, the risk profile benefits from the US regulators’ efforts to tame the financial market risks emanating from the Silicon Valley Bank (SVB) and Signature Bank. That said, US Treasury Department, Federal Reserve and the Federal Deposit Insurance Corporation (FDIC) took joint actions to tame the risks emanating from the SVB and Signature Bank during the weekend. “All depositors of Silicon Valley Bank and Signature Bank will be fully protected,” said the authorities in a joint statement released a few minutes back.
While portraying the mood, the US 10-year Treasury bond yields pare the biggest daily loss in four months near 3.75% while the S&P 500 Futures also rebound from a nine-week low.
It should be noted that the fears emanating from the SVB and Signature Bank drowned the US Treasury bond yields and the US Dollar the previous day, which in turn allowed the NZD/USD to remain firmer despite the risk-off mood.
The US Dollar, on the other hand, failed to cheer the mostly upbeat employment report for February, amid downbeat yields. That said, the US Nonfarm Payrolls (NFP) grew more than 205K expected to 311K in February, versus 504K (revised), while the Unemployment Rate rose to 3.6% for the said month compared to 3.4% expected and prior. Further, the Average Hourly Earnings rose on YoY but eased on monthly basis for February whereas the Labor Force Participation increased during the stated month.
Looking ahead, US Consumer Price Index (CPI) for February, up for publishing on Tuesday, will be crucial for the NZD/USD pair traders ahead of Thursday’s New Zealand fourth quarter (Q4) Gross Domestic Product (GDP).
Technical analysis
NZD/USD recovery remains elusive unless crossing a one-month-old descending resistance line, around 0.6190 by the press time.
- USD/CAD bears are in the market at start of week.
- Bears eye a break of the daily trendline support.
The Canadian Dollar barely changed against its US counterpart on Friday, but it is gaining momentum vs. the greenback at the start of the week, moving away from a five-month low. The following illustrates the technical layout from a daily and hourly perspective.
USD/CAD daily chart
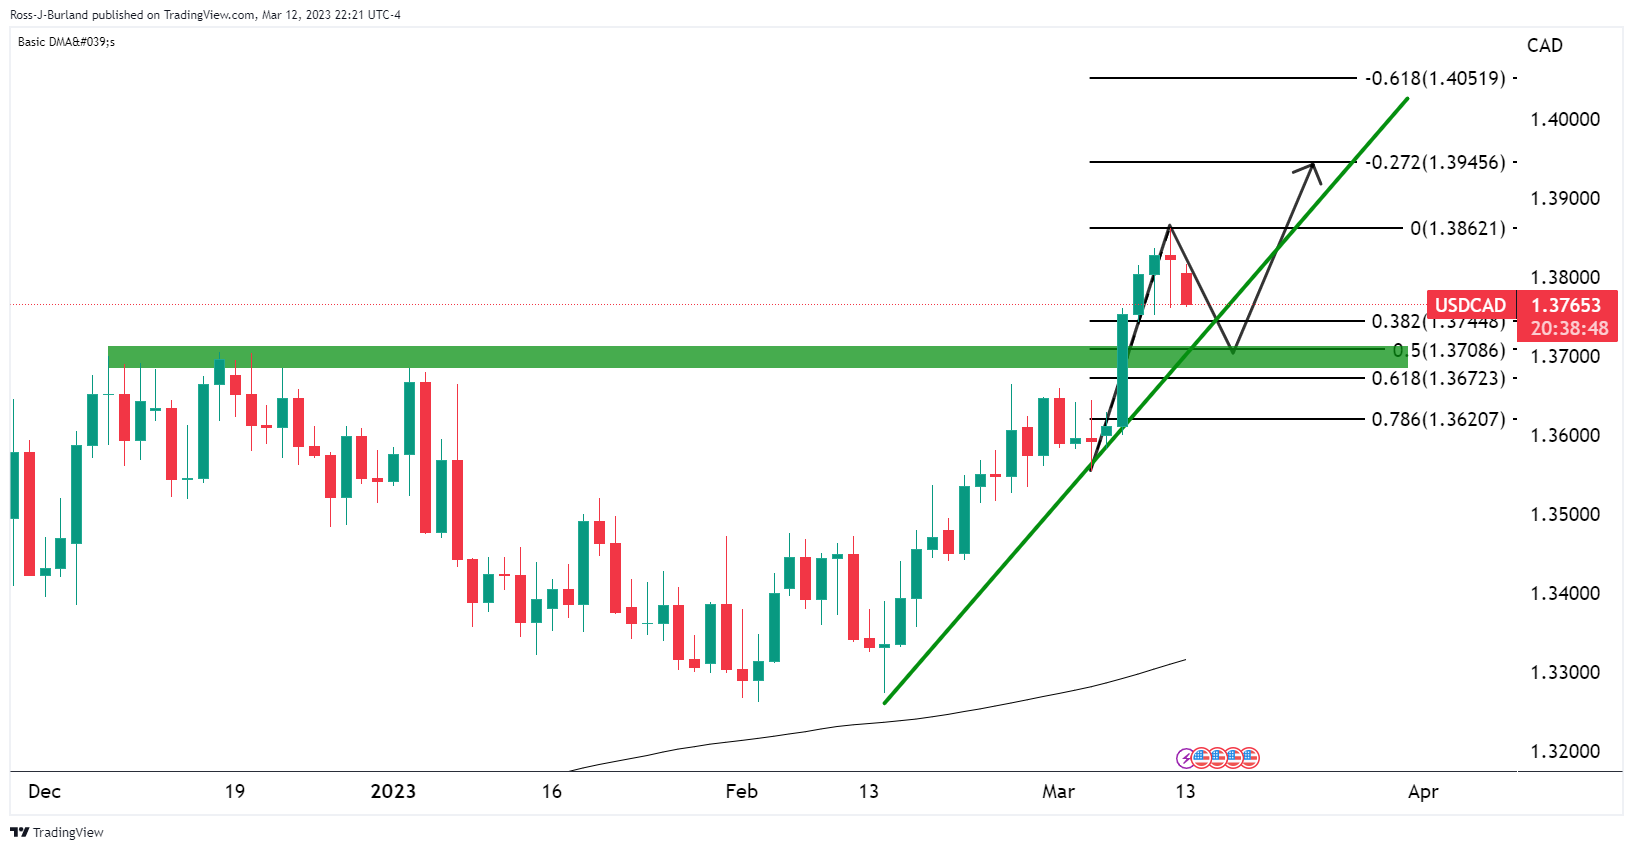
A correction is taking place on the daily chart and the support of the trendline could come under pressure for the week ahead. Bears eye 1.3700 in a 50% mean reversion.
USD/CAD H1 chart
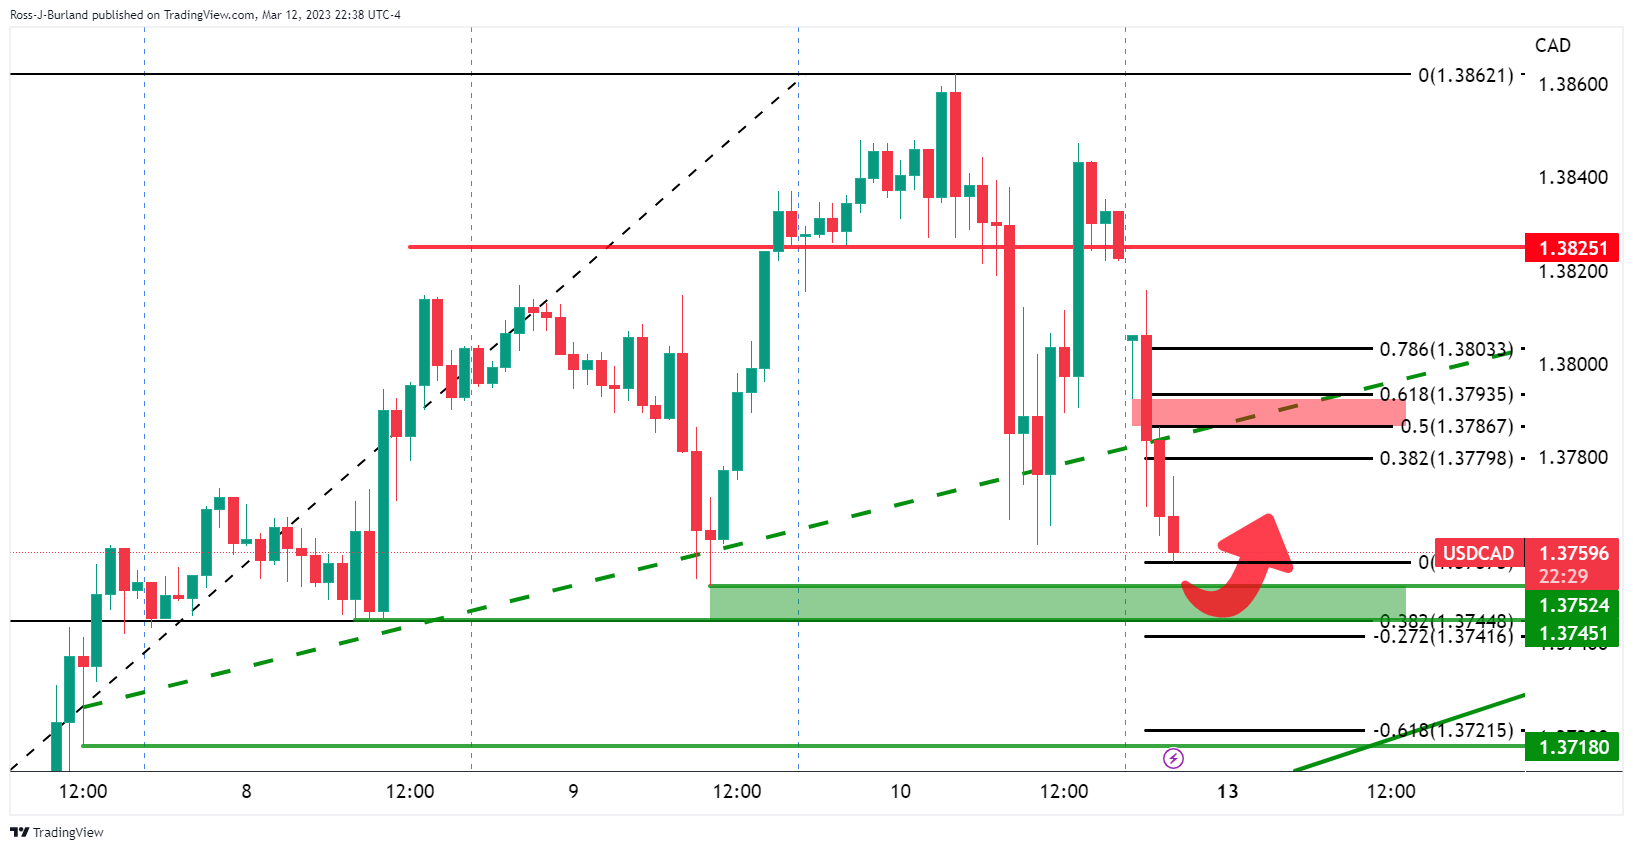
Bulls are likely lurking in the prior support area and a test thereof could lead to a correction for the sessions ahead. A move to test the prior support in a 50% mean reversion opens risk towards 1.3790 / 1.3800.
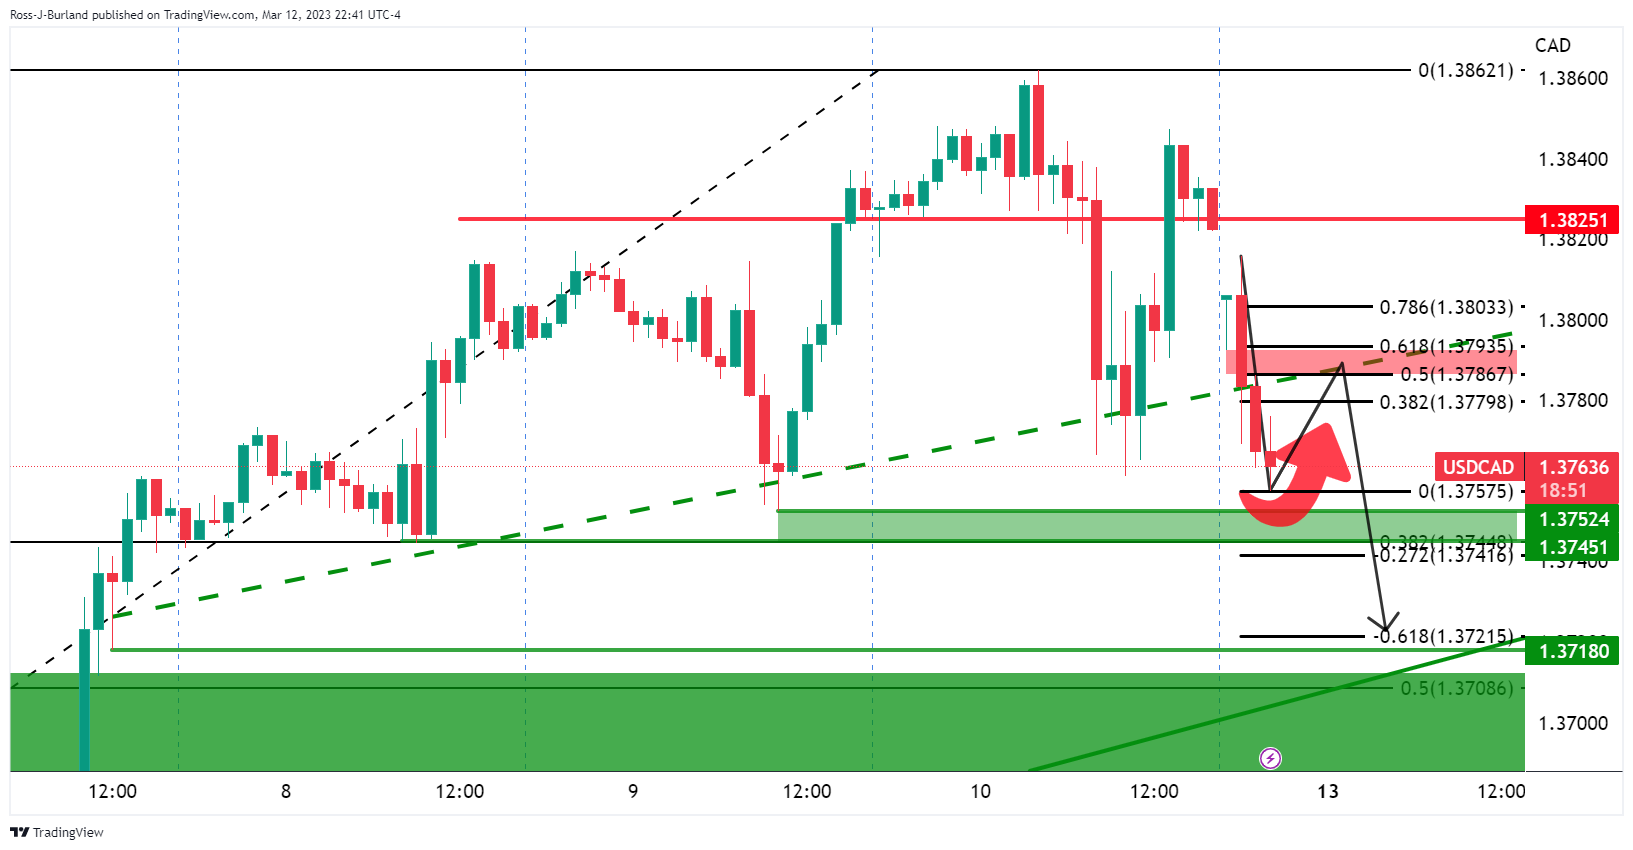
Thereafter, if the bears commit, then a downside extension could play out for a test of the 1.3720s and below.
- USD/JPY picks up bids to pare intraday losses, rebounds from one-month low.
- Yields, S&P 500 Futures recover as US regulators tame risks emanating from SVB, Signature Bank.
- BoJ Minutes will be crucial to watch as hawkish bets on the Japanese central bank’s next move escalates after Kuroda’s exit.
- US consumer-centric data will be crucial after recently firmer-than-expected NFP print.
USD/JPY takes a U-turn from the one-month low, marked earlier in Asia, as it picks up bids to 134.50 amid an initial hour of Tokyo open on Monday. Even so, the Yen pair remains on the back foot for the third consecutive day as Bank of Japan (BoJ) Governor Haruhiko Kuroda’s retirement propels hawkish calls for the Japanese central bank’s next moves. Also challenging the pair buyers could be the cautious mood ahead of this week’s top-tier data/events, including the BoJ Minutes and the US consumer-centric numbers including the Consumer Price Index (CPI) and Retail Sales for February.
The Yen pair’s latest rebound could be linked to the recently firmer US Treasury bond yields, as well as risk-on sentiment in the market, mainly driven by the US regulators’ efforts to tame the financial market risks emanating from the Silicon Valley Bank (SVB) and Signature Bank. That said, the US 10-year Treasury bond yields pare the biggest daily loss in four months near 3.75% while the S&P 500 Futures also rebound from a nine-week low.
US Treasury Department, Federal Reserve and the Federal Deposit Insurance Corporation (FDIC) took joint actions to tame the risks emanating from the SVB and Signature Bank during the weekend. “All depositors of Silicon Valley Bank and Signature Bank will be fully protected,” said the authorities in a joint statement released a few minutes back.
“All depositors of Silicon Valley Bank and Signature Bank will be fully protected,” said the authorities in a joint statement released a few minutes back. S&P 500 Futures and US Treasury bond yields consolidate the previous day’s losses after the late plan for the US authorities to tame the financial crisis.
Despite the risk-on mood, escalating hawkish bets on the BoJ’s next move, especially after Kuroda’s retirement, seem to exert downside pressure on the USD/JPY prices. On the same line could be the Federal Reserve (Fed) watchers’ indecision after Friday’s mixed US employment data. That said, the US Nonfarm Payrolls (NFP) grew more than 205K expected to 311K in February, versus 504K (revised), while the Unemployment Rate rose to 3.6% for the said month compared to 3.4% expected and prior. Further, the Average Hourly Earnings rose on YoY but eased on monthly basis for February whereas the Labor Force Participation increased during the stated month.
Looking forward, Wednesday’s BoJ Minutes will be crucial to confirm the latest hawkish bias for the Japanese central bank’s next move, which in turn can weigh on the USD/JPY prices if matching market forecasts. However, firmer prints of the US consumer-centric numbers could renew hawkish Fed bets ahead of the all-important March Federal Open Market Committee (FOMC) and may recall the USD/JPY bulls.
Technical analysis
Although the 200-day Exponential Moving Average (EMA) restricts short-term USD/JPY downside near 134.00, the Yen pair’s latest recovery needs validation from the 100-day EMA level surrounding 135.00.
| Index | Change, points | Closed | Change, % |
|---|---|---|---|
| NIKKEI 225 | -479.18 | 28143.97 | -1.67 |
| Hang Seng | -605.82 | 19319.92 | -3.04 |
| KOSPI | -24.5 | 2394.59 | -1.01 |
| ASX 200 | -166.4 | 7144.7 | -2.28 |
| FTSE 100 | -131.6 | 7748.4 | -1.67 |
| DAX | -205.24 | 15427.97 | -1.31 |
| CAC 40 | -95.21 | 7220.67 | -1.3 |
| Dow Jones | -345.22 | 31909.64 | -1.07 |
| S&P 500 | -56.73 | 3861.59 | -1.45 |
| NASDAQ Composite | -199.46 | 11138.89 | -1.76 |
- GBP/USD bulls jump in at the start of the week.
- UK labour market and US CPI data eyed.
GBP/USD is 0.33% higher after the pair moved up from a low of 1.2063 to a high of 1.2103 following its biggest jump since January 6 while the US Dollar weakens broadly after Friday's US labour market.
Nonfarm Payrolls showed a robust jobs growth although the rise in the Unemployment Rate and signs of cooling wage inflation have led markets to trim bets that the Federal Reserve will raise interest rates as sharply. The United States added 311,000 payrolls in February and the unemployment rate rose to 3.6%. However, a survey of economists polled by Reuters expected the United States to have added 205,000 jobs last month and the unemployment rate to hold steady at 3.4%. Average hourly earnings rose 0.2% last month after gaining 0.3% in January, below expectations of 0.3%.
Also, Britain's economy was shown to have grown by more than expected in January, further allaying fears of a recession. The Office for National Statistics (ONS) said Britain's economy expanded 0.3% month-on-month, after a drop of 0.5% in December. A Reuters poll of economists had pointed to growth of 0.1%.
Meanwhile, the closing of SVB Financial Group is the largest bank failure since the financial crisis. Nevertheless, the Biden administration on Sunday guaranteed that customers of the failed Silicon Valley Bank will have access to all their money starting Monday. In a joint statement Sunday, Treasury Secretary Janet Yellen, Federal Reserve Chair Jerome Powell and Federal Deposit Insurance Corporation Chairman Martin J. Gruenberg said the FDIC will make SVB and Signature’s customers whole.
Looking ahead, the calendar is packed with US consumer Price Index and UK labour market data. ´´The labour market should soften in Jan, with the unemployment rate rising and wage growth falling, as the official data continues to catch up to high-frequency indicators,´´ analysts at TD Securities said. ´´Weaker wage growth will be particularly welcomed by the BoE after last month's upside surprise. However, with US CPI out later in the day, market reaction may be muted unless there's a large surprise.´´
| Pare | Closed | Change, % |
|---|---|---|
| AUDUSD | 0.65773 | -0.17 |
| EURJPY | 143.423 | -0.32 |
| EURUSD | 1.06405 | 0.6 |
| GBPJPY | 162.092 | -0.11 |
| GBPUSD | 1.20256 | 0.88 |
| NZDUSD | 0.61322 | 0.6 |
| USDCAD | 1.38329 | 0.06 |
| USDCHF | 0.92122 | -1.21 |
| USDJPY | 134.791 | -0.95 |
- US Dollar Index picks up bids to consolidate US employment-led losses.
- US regulators take measures to tame risks emanating from SVB, Signature Bank.
- Fed blackout period may test DXY bulls as firmer sentiment weigh on US Dollar’s haven demand.
- US CPI, Retail Sales will be important to watch for clear directions.
US Dollar Index (DXY) licks its wounds while paring the intraday loss to 104.30 during early Monday, following the two-day losing streak at the latest. In doing so, the US Dollar’s gauge versus the six major currencies portrays the market’s rush towards riskier assets like AUD/USD and commodities amid easing fears from the Silicon Valley Bank (SVB) and Signature Bank.
During the weekend, US Treasury Department, Federal Reserve and the Federal Deposit Insurance Corporation (FDIC) took joint actions to tame the risks emanating from the SVB and Signature Bank. “All depositors of Silicon Valley Bank and Signature Bank will be fully protected,” said the authorities in a joint statement released a few minutes back. S&P 500 Futures and US Treasury bond yields consolidate the previous day’s losses after the late plan for the US authorities to tame the financial crisis.
Also read: Regulators close Signature bank, announce plan to make depositors whole
While easing fears from the SVB and Signature Bank appear to weigh on the US Dollar of late, following the drowning of the US Treasury bond yields on Friday, the DXY may witness a corrective bounce as the latest US jobs report appeared somewhat upbeat.
On Friday, United States Nonfarm Payrolls (NFP) grew more than 205K expected to 311K in February, versus 504K (revised), while the Unemployment Rate rose to 3.6% for the said month compared to 3.4% expected and prior. Further, the Average Hourly Earnings rose on YoY but eased on monthly basis for February whereas the Labor Force Participation increased during the stated month.
It should be noted, however, that the Federal Reserve (Fed) officials’ two-week silence ahead of the monetary policy meeting may probe the DXY bulls if the risk-on mood lasts longer. Also important to watch will be the US Consumer Price Index (CPI) for February, up for publishing on Tuesday, which will precede the Retail Sales and preliminary readings of the Michigan Consumer Sentiment Index for March, up for publishing on Wednesday and Friday.
Technical analysis
A daily closing below the 50-day Exponential Moving Average (EMA), around 104.20 at the latest, becomes necessary for the US Dollar Index (DXY) bears to retake control.


© 2000-2026. All rights reserved.
This site is managed by Teletrade D.J. LLC 2351 LLC 2022 (Euro House, Richmond Hill Road, Kingstown, VC0100, St. Vincent and the Grenadines).
The information on this website is for informational purposes only and does not constitute any investment advice.
The company does not serve or provide services to customers who are residents of the US, Canada, Iran, The Democratic People's Republic of Korea, Yemen and FATF blacklisted countries.
Making transactions on financial markets with marginal financial instruments opens up wide possibilities and allows investors who are willing to take risks to earn high profits, carrying a potentially high risk of losses at the same time. Therefore you should responsibly approach the issue of choosing the appropriate investment strategy, taking the available resources into account, before starting trading.
Use of the information: full or partial use of materials from this website must always be referenced to TeleTrade as the source of information. Use of the materials on the Internet must be accompanied by a hyperlink to teletrade.org. Automatic import of materials and information from this website is prohibited.
Please contact our PR department if you have any questions or need assistance at pr@teletrade.global.
transfers